
 Submit a Paper
 Propose a Special lssue
 Open Access
ARTICLE

Inter-Provincial Transaction Model in Two-Level Electricity Market Considering Carbon Emission and Consumption Responsibility Weights
1 Electric New Power System Technology Research Institute, The Electric Power Research Institute of State Grid Xinjiang Electric Power Co., Ltd., Urumqi, 830000, China
2 Power Dispatch Control Center, State Grid Xinjiang Electric Power Co., Ltd., Urumqi, 830063, China
3 College of Electrical Engineering, Shanghai University of Electric Power, Shanghai, 200090, China
* Corresponding Author: Ming Li. Email:
Energy Engineering 2023, 120(10), 2393-2416. https://doi.org/10.32604/ee.2023.028574
Received 26 December 2022; Accepted 19 April 2023; Issue published 28 September 2023
 View Full Text
 Download PDF
Abstract
In the context of the joint operation of China’s intra-provincial markets and inter-provincial trading, how to meet the load demand and energy consumption using inter-provincial renewable energy trading is a key problem. The combined operation of intra-provincial and inter-provincial markets provides a new way for provincial power companies to optimize and clear the intra-provincial power market, complete the intra-provincial consumption responsibility weight index, and consume renewable energy across provinces and regions. This paper combines power generation and consumption within the province, uses inter-provincial renewable energy trading to meet the load demand within the province and completes the index of intra-provincial consumption responsibility weights. The intra-provincial market trading and inter-provincial market clearing are respectively taken as the upper and lower levels of the model. Under the two-level electricity market operation framework, the upper-level model aims to minimize the expected total operating cost within the province considering the carbon emission cost and the weight of the consumption responsibility, while the lower-level model aims to minimize the inter-provincial renewable energy purchasing cost. Finally, the influence of inter-provincial transaction mechanism, risk aversion coefficient, voucher price, and responsibility weight on operating cost is analyzed. Simulation is used to verify that the proposed model can meet the requirements of the provincial load power consumption and the consumption responsibility weight index, and promote the consumption of renewable energy.Keywords
Under the guidance of the “double carbon” goal, China is at a crucial stage of deepening energy reform in the “14th Five-Year Plan”, as well as a stage of preparation and exploration to achieve the “carbon peak” by 2030. With the continuous expansion of renewable energy capacity, the contradiction between resources and demand becomes more and more prominent in time and space. With the existence of uncertain factors of renewable energy, the willingness to consume renewable energy is gradually depressed [1–3].
Aiming at the characteristics of the reverse distribution of power resources and demand in China [4]. It is one of the necessary means to alleviate the contradiction between power supply and demand, transact power transmission and distribution across provinces and regions, realize the optimal allocation of large-scale electric energy, and carry out an inter-provincial transaction. At present, China’s inter-provincial electricity trading market is relatively mature, and the country’s inter-provincial trading electricity in the first half of 2022 was 479.14 billion kWh. At the same time, China's electricity market mechanism and pilot program mainly aim at the province [5], considering the joint operation of the intra-provincial market and inter-provincial transactions, and forming a two-level operation mode between provinces and cities is one of the hot issues in the current electricity market. Establishing trans-provincial and trans-regional power transmission channels and forming inter-provincial and inter-provincial power markets with a “unified market and two-level operation” is the main method to solve the problem of reverse distribution of energy supply and demand in China and to break the barriers of inter-provincial trading. At present, China’s inter-provincial power market mainly carries out medium and long-term power trading and carries out incremental spot trading for renewable energy. There are still many problems in the inter-provincial power market, such as the form, the single contract provisions, the inflexibility of the mechanism, and the solidification of medium-term and long-term transactions. It is necessary to study the trading and consumption of renewable energy in the inter-provincial power market. The research on the operation of the inter-provincial electricity market under the consumption guarantee mechanism has a certain reference value for optimizing the operation of intra-provincial market transactions, and inter-provincial trading is conducive to optimizing resource allocation and promoting renewable energy consumption.
In this regard, the PJM market in the United States and the electricity market in Europe are typically trans-regional electricity markets, which have important reference value for the establishment of an inter-provincial renewable energy power trading market in China [6–8]. Reference [6] put forward a two-level dispatching strategy for an inter-provincial interconnected power grid, and the unit start-stop and inter-provincial tie-line transmission plans are formulated in the early dispatch, and the intra-day dispatch adjusts the unit output and tie-line transmission according to the actual photovoltaic and load, which improves the economy of system operation. Reference [9] established a two-layer dispatching model of power grid interconnection across provinces and regions, which considers the photovoltaic and load characteristics of each province and effectively improves the operation economy. The reference [10] extended the traditional provincial SCED model to the inter-provincial large power grid, establishes an economic dispatch model, and improves the solution efficiency by optimizing the objective function and constraints. Reference [11] took the regional power grid as the main body to build an optimization model of power purchase considering the uncertainty of wind power, to realize over-peak peak regulation and risk control. Reference [12] established a regional power grid model for joint evaluation of domestic renewable energy and CO2. Reference [13] designed the market mechanism of renewable energy but did not consider the impact of the absorption guarantee mechanism on inter-provincial transactions. Reference [14] proposed a coupling mechanism between the green certificate market and the provincial day-ahead market but does not involve the impact of cross-provincial trading of renewable energy on the market. Reference [15] took inter-provincial power generation rights trading as the theme and studies the cross-provincial absorption compensation mechanism. Reference [16] established an inter-provincial power purchase model considering risks, without considering the power purchase strategy of inter-provincial trading agents under the absorption guarantee mechanism. Reference [17] proposed a two-tier electricity market optimization model to analyze the impact of the carbon-green certificate trading mechanism on market costs but does not consider the impact of the weight of consumption responsibility in the electricity market. Reference [18] established the optimal clearing model of inter-provincial renewable energy power purchase under the absorption guarantee mechanism, which only considered the single delivery province and did not involve risk control.
In response to the widespread transaction risks in the electricity market environment, some studies have introduced risk management methods while considering optimal power purchase models. For example, financial transmission rights are used to hedge blocking risks [19], opportunity-constrained planning methods [20] or conditional value-at-risk methods [21,22] are used. The above reference proposes that the risk management method mainly targets the real-time operation risk of the spot market, that is, the risk of blocking and the risk of electricity price fluctuation, and does not involve the market risk caused by the uncertainty of renewable energy output and load demand. Before the opening of the inter-provincial market, inter-provincial traders need to declare the inter-provincial power purchase demand based on the forecast results of new energy output and load demand in the province. As renewable energy penetration and load demand grow in the future, the risk of forecast errors will inevitably affect the power purchase decisions of interprovincial traders.
There are few studies on inter-provincial renewable energy trading in the existing reference, and the influence of market risk and absorption guarantee mechanism on power purchase strategies in the inter-provincial and intra-provincial markets is not fully considered [23–26]. After the introduction of the absorption guarantee mechanism, the price of the absorption voucher, the weight of the absorption responsibility, and the quotation of the renewable energy market will all have an impact on the inter-provincial transactions.
The combined operation of intra-provincial and inter-provincial markets provides a new way for provincial power companies to optimize and clear the intra-provincial power market, complete the intra-provincial consumption responsibility weight index, and consume renewable energy across provinces and regions. This paper first establishes an overall operating framework for the inter-provincial power market and uses inter-provincial renewable energy trading to meet the load demand within the province. Secondly, a two-level market clearing model considering carbon emission and absorption responsibility weight is established, including market uncertainty risk factors. Finally, a province was selected as the target province of optimal clearing, and three renewable energy delivery provinces were selected as the inter-provincial transaction objects for example analysis, to verify the effectiveness of the model proposed in this paper.
2 Two-Level Electricity Market Operation Framework
At present, China is in the primary stage of electric power market construction, and the inter-provincial market is traded by provincial power companies. This chapter takes provincial power companies as the research object and constructs the model framework of provincial power companies participating in inter-provincial transactions and organizing the clearance of the provincial power market, as shown in Fig. 1. The users in the province (power grid company, electricity supplier, power user, etc.) participate in the provincial power market organized by the provincial power company and put forward the power demand information according to the users’ load demand and consumption assessment index. The power generation side in the province provides the power output prediction and quotation information, and the provincial power market organizes the clearance [27]. At the same time, the provincial power company proposes to participate in the inter-provincial power market trading based on the absorption responsibility demand and carbon emission cost, and the inter-provincial market organizes the inter-provincial power clearing according to the output prediction and quotation information of the provincial power generation side at the sending end. The renewable energy clearing results are returned to the provincial power company, which arranges the dispatching plan according to the cleared quantity and price. The boundary conditions are used to clear the power and reserve capacity of the provincial power market.
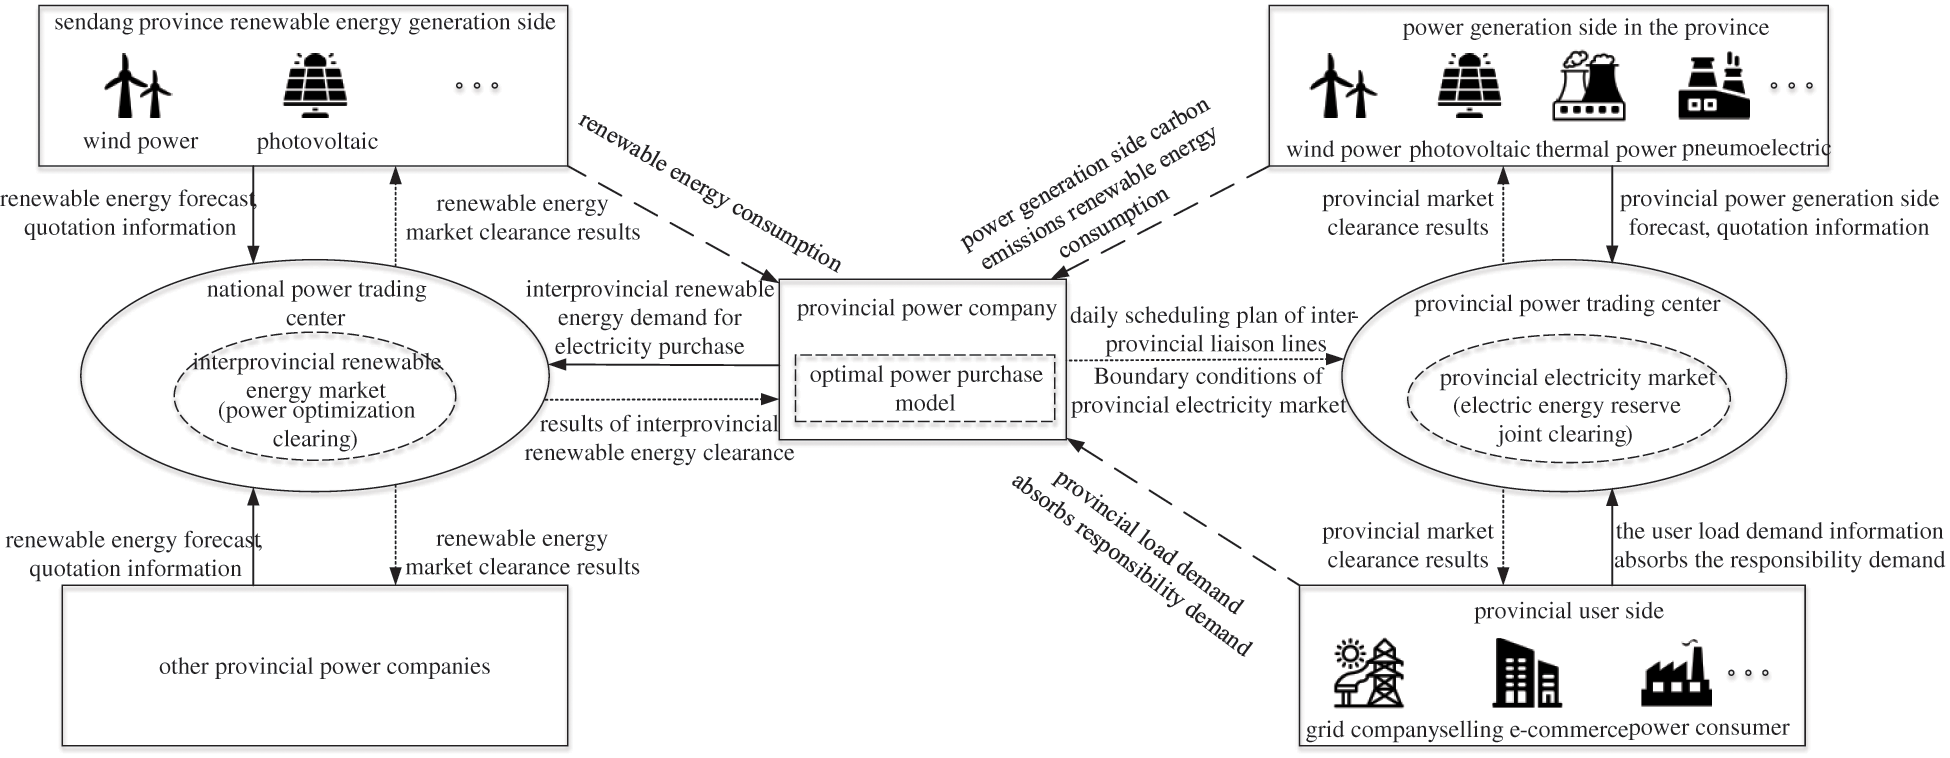
Figure 1: Operation structure of the two-level power market within and between provinces
3 Two-Level Electricity Market Operation Model
There is a certain coupling relationship between intra-provincial and inter-provincial transactions, among which, the inter-provincial power market provides more power resources for intra-provincial users, and intra-provincial users provide a way for the power generation side to consume renewable energy. This chapter takes intra-provincial and inter-provincial markets as the upper and lower levels of the model and establishes an intra-provincial two-level power market optimization clearing model considering carbon emission and absorption responsibility weight. Inter-provincial renewable energy purchasing demand proposed by provincial power companies and clearance results returned by national power trading centers are used as upper and lower transmission information, as shown in Fig. 2. The upper model aims to minimize the expected value of the total operating cost within the province considering the carbon emission cost and absorption responsibility weight, while the lower model aims to minimize the electricity purchasing cost of renewable energy between the provinces. In addition, carbon emission charges and absorption voucher costs are introduced into the upper model, and the absorption responsibility weight index of provincial power companies is considered to achieve the corresponding amount of consumption during the operation of the provincial power market. The consumption voucher is divided into green certificate and excess consumption. Since the model in this chapter has a short time scale and belongs to the intra-day operation model, and the corresponding consumption amount of the price and unit voucher is the same, this chapter does not make any distinction, and the consumption voucher is taken as the calculation.
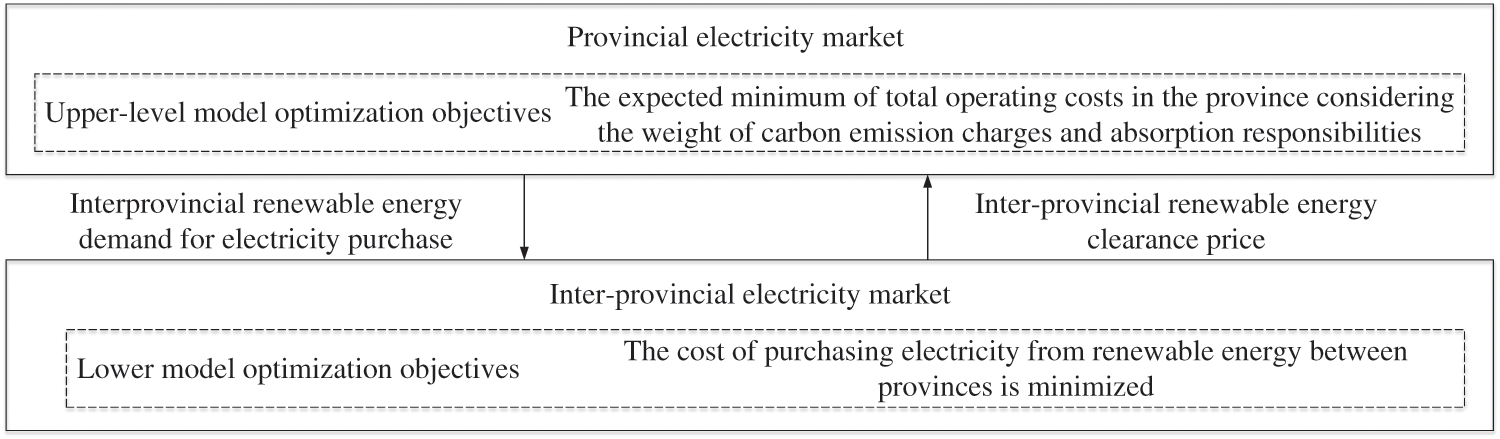
Figure 2: Upper and lower-level models of intra-provincial and inter-provincial electricity markets
The objective of the upper-layer model is to minimize the expected value of the total operating cost in the province. Considering the uncertainty of the user load and renewable energy output in the province, the model adopts Latin hypercube sampling combined with synchronous back generation technology to generate multiple provincial loads and renewable energy output scenarios and then obtains the total operating cost in the province of each scenario. The goal is to optimize the expected value of the total cost in each scenario. And provide renewable energy demand information for the lower-level model. The upper-level objective function is:
where ω is different scenes;
The upper-layer model constraints are
1) Power balance constraints:
where
2) Reserve capacity constraints:
where
3) Constraint of absorption responsibility:
where
4) Output constraints of generator set:
where
5) Climbing constraints of generator set:
where
6) Constraints on the affordable acquisition of renewable energy within the province:
In the formula,
7) Non-negative constraint of decision variables:
3.2 CVaR Objective Function Considering Risk
In the upper model, there are user load fluctuation and renewable energy output uncertainty in the provincial market, which leads to an increase in the total cost of intra-provincial operation. The deviation between the forecast of renewable energy output and user load demand will cause the electricity purchase demand declared by traders before the operation of the inter-provincial market to deviate from the actual demand. If the demand for electricity purchase is greater than the actual demand, the cost of electricity purchase between provinces increases; If the demand for electricity purchase is less than the actual demand, it is necessary to purchase electricity from the unit with a high quotation in the province, increasing in the cost of clearing the unit in the province.
In this paper, CVaR theory is used to measure the market risk loss in the province. When the confidence level of the provincial power company is
The constraint conditions are:
where
By minimizing the CVaR risk value in the provincial market, the provincial power company will adjust the power purchase strategy to minimize the risk of the provincial market. Considering the objective of minimizing the provincial market operation cost and value-at-risk, the multi-objective is converted into a single objective function. When the risk aversion coefficient of the provincial power company is
In the equation,
In the upper-level model, provincial power companies participate in inter-provincial electricity market trading after obtaining the renewable energy demand of provincial users. Power balance, the transmission capacity of the inter-provincial liaison line, and the output of renewable energy units at the transmission end is taken as constraints to form the objective function of minimizing inter-provincial power purchase cost, and the clearing price of renewable energy returns to the upper-level model. The objective function of the lower model is:
where T is the number of operating periods of the system; Y is the number of provinces delivering renewable energy;
The constraints of the lower model are
1) Interprovincial renewable energy transmission power balance:
2) Transport capacity constraints of inter-provincial contact lines:
where
3) Power constraints of renewable energy units in the delivery province:
where
4) Inter-provincial renewable energy clearance price
The lower model inter-provincial clearing tariff
In the equation
A province is taken as the target province for optimal clearing, and three renewable energy delivery provinces are taken as inter-provincial transaction objects for example analysis, as shown in Fig. 3.
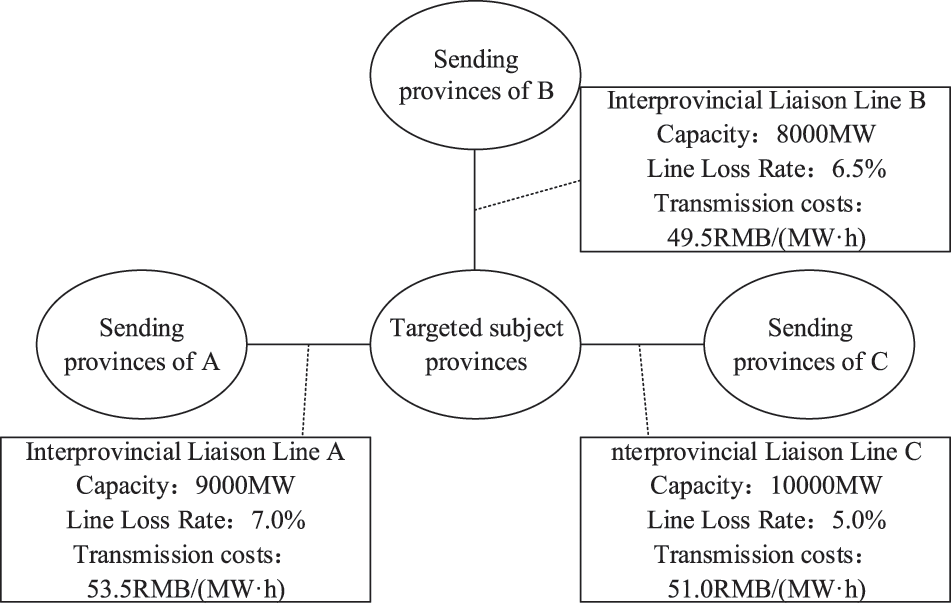
Figure 3: Parameter topology of inter-provincial contact lines
This section takes a typical day in the target receiving province as the research object and assumes that the provincial power company needs to complete the corresponding non-water renewable energy consumption of the load on a typical day. It is assumed that the intra-day demand forecast of provincial load obeys a normal distribution with the expectation of μr and a standard deviation of 0.2 μr, and the intra-day output forecast of provincial wind power and PV obeys a normal distribution with the expectation of μw and μs and standard deviation of 0.15 μw and 0.15 μs, respectively. The sampling method is used to generate 1000 scene data for each. See Appendix B for details.
The influence of traditional energy and renewable energy output on carbon emission factors was considered [28], CO2 emission factor
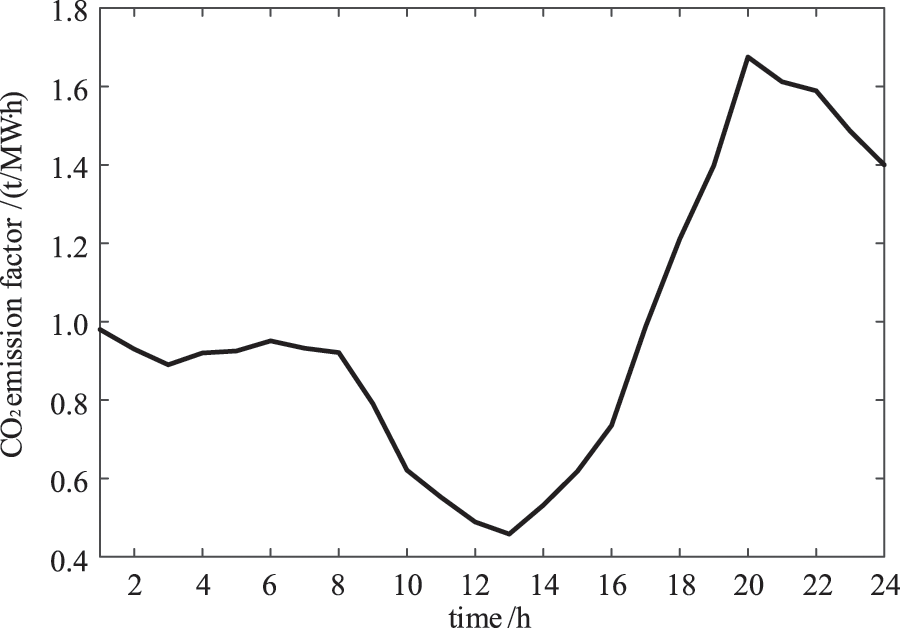
Figure 4: CO2 emission factors in the province
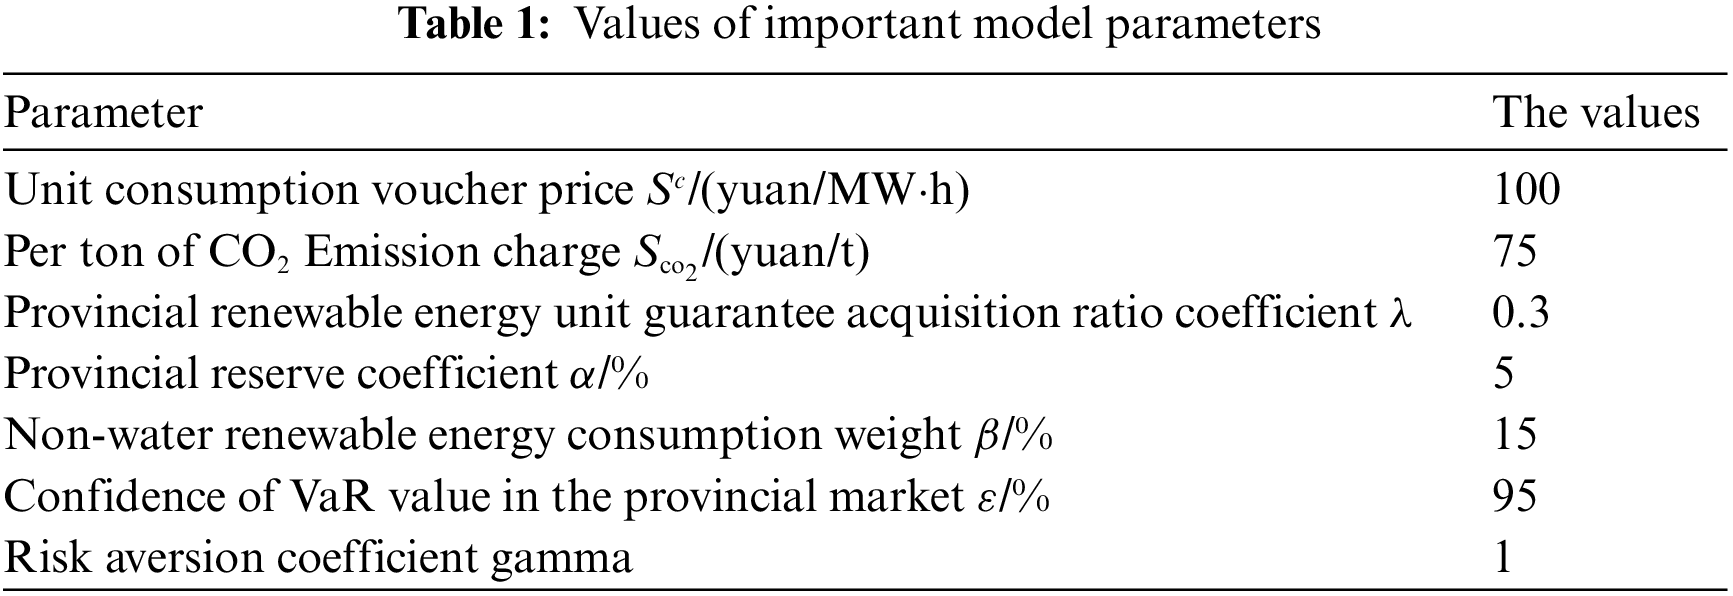
Example verification Under default conditions, the main parameters are shown in Table 1, where the quotation of spare capacity of traditional energy units in the province is 5% of the quotation of electric energy.
In this case analysis, the differences in market operation costs in different scenarios are compared under three market mechanism environments. They are as follows:
Mechanism 1: The units and loads in the province are cleared, and the units have not participated in the inter-provincial power market trading, and there is no renewable energy absorption responsibility weight index or quota system constraint, which needs to include carbon emission charges.
Mechanism 2: Based on mechanism 1, it evaluates the consumption situation of the provincial market and puts forward constraints on the consumption responsibility weight index of renewable energy. However, provincial power companies only organize and participate in the clearing operation of the provincial power market, but do not participate in inter-provincial transactions.
Mechanism 3: Based on mechanism 2, provincial power companies can participate in inter-provincial power market trading to obtain renewable energy electricity, and complete the consumption responsibility weight index within the province.
The total cost of market operation is shown in Fig. 5. Mechanism 2 is compared with mechanism 1. The absorption responsibility assessment mechanism is introduced to restrain provincial power companies, which increases the market operation cost. After participating in the inter-provincial renewable energy market trading, the market operation cost of mechanism 3 has decreased, because the renewable energy units sent to the provinces through the inter-provincial contact line, enable the receiving provinces to consume the low price of renewable energy electricity and achieve the consumption responsibility weight assessment index.
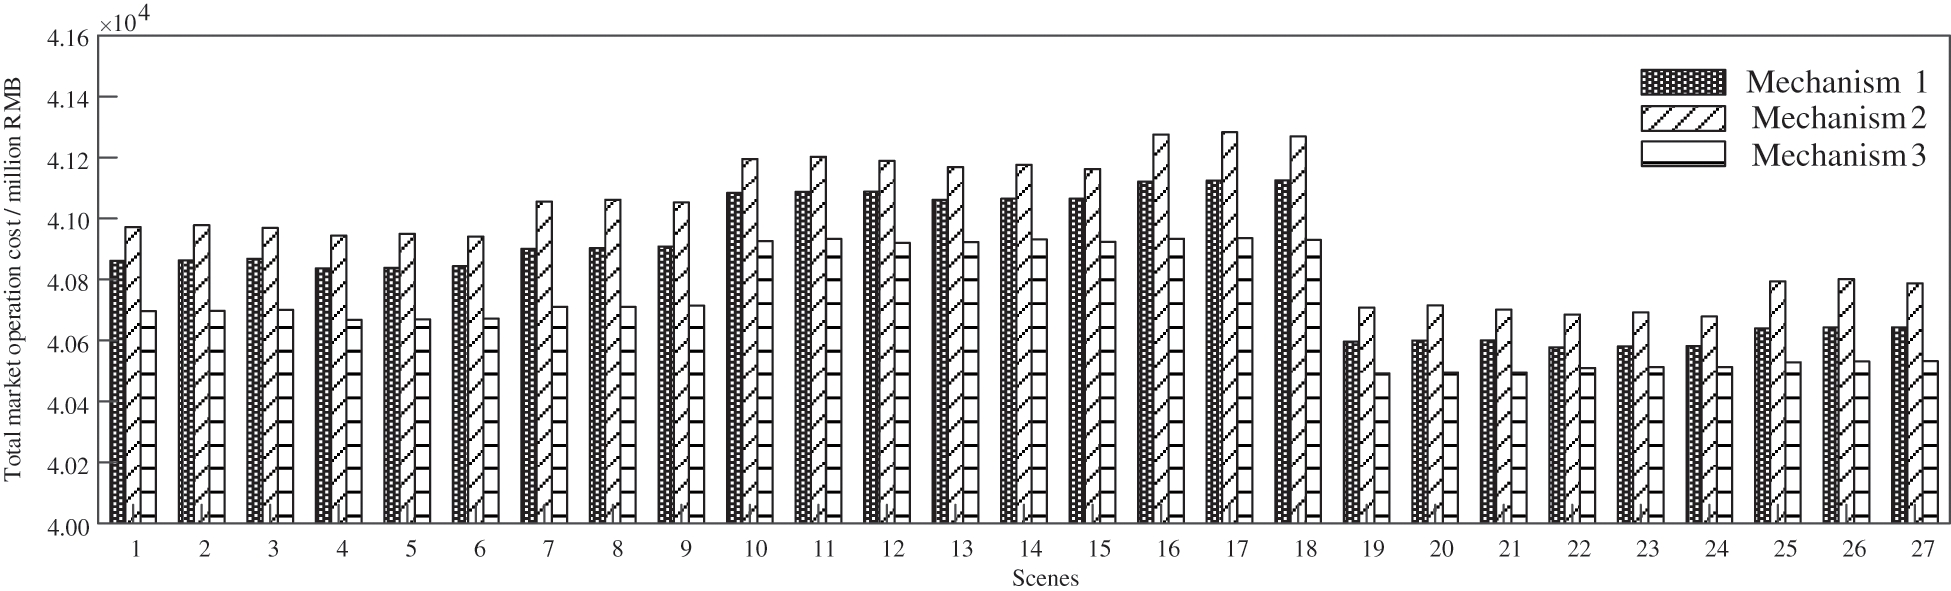
Figure 5: Total cost of market operation in each scenario
As can be seen from Appendix B, in the 27 combination scenarios, scenario 4, which is composed of load demand scenario 1, wind power output scenario 2, and photovoltaic output scenario 1, has the highest probability. Under three different market mechanisms, the output of various units in the province in scenario 4 is shown in Fig. 6.
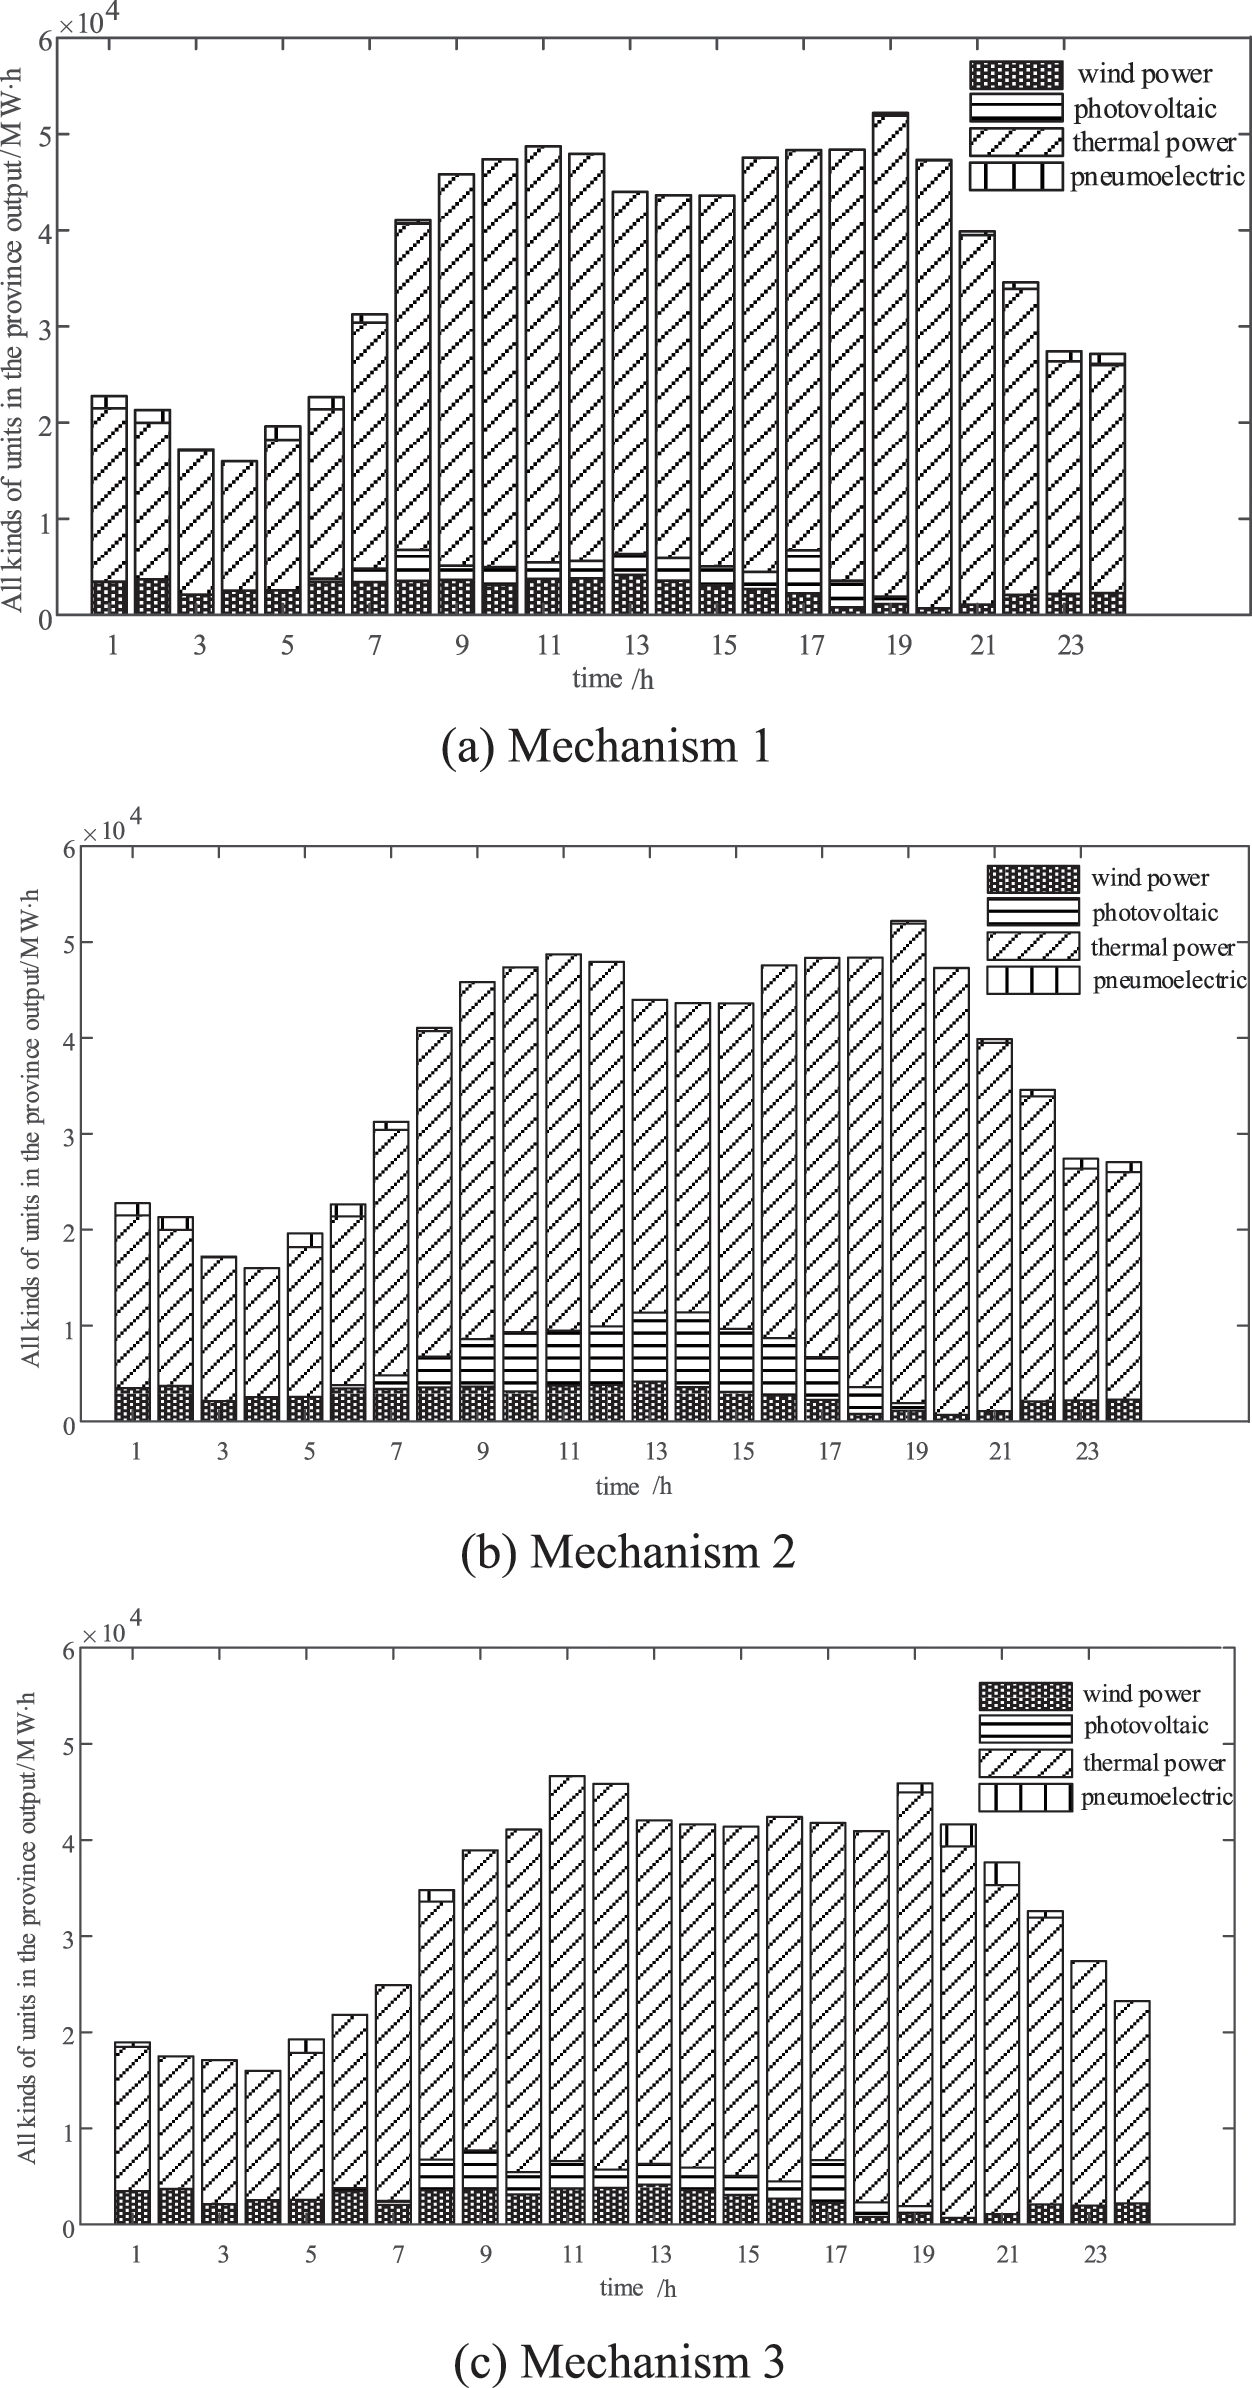
Figure 6: Output power of various units in the province
As can be seen from Fig. 6, the provincial wind power is preferentially cleared among the three mechanisms because its quotation is lower than that of the provincial PV, thermal power, and gas power units, and the electricity quantity is consistent with the prediction of the provincial power output in scenario 4. In Fig. 6a, when the absorption responsibility guarantee mechanism is not implemented in mechanism 1, the photovoltaic units in the province are cleared at the proportion of affordable renewable energy acquisition. In Fig. 6b, the provincial power grid company in mechanism 2 has significantly improved its photovoltaic clearance level to complete the 15% absorption responsibility weight index. It can be seen that the introduction of the absorption responsibility guarantee mechanism promotes the absorption of renewable energy. In Fig. 6c, mechanism 3 introduced inter-provincial renewable energy trading, which gave provincial power companies more ways to complete power supply and realized the absorption responsibility weight index. Compared with mechanism 2, the output of photovoltaic units in the province decreased.
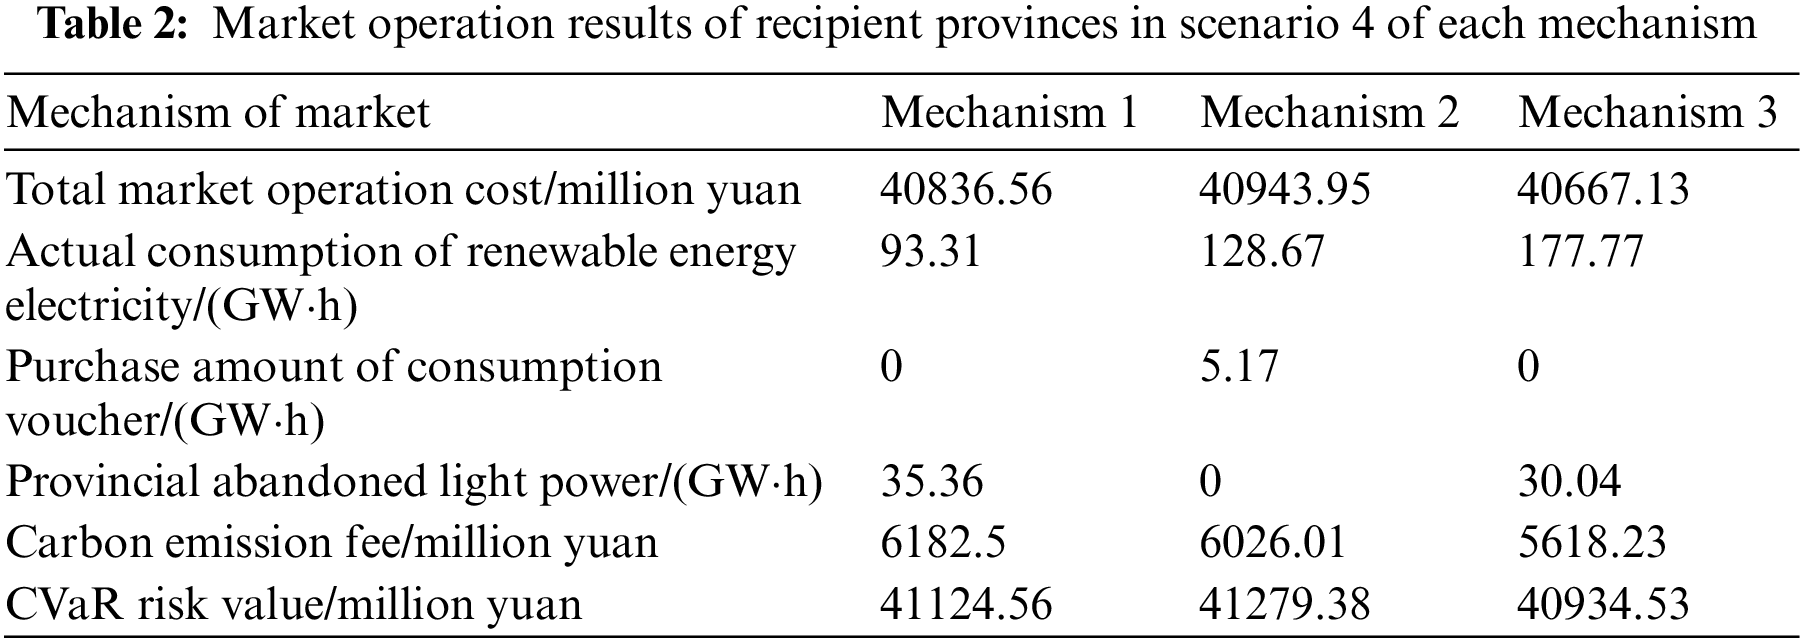
Table 2 shows the results of the three market mechanisms in operation in scenario 4. It can be seen from the table that the total market operation cost and CVaR risk value of mechanism 1 are in the middle position among the three mechanisms. Because the absorption responsibility guarantee mechanism has not been introduced, the provincial market only absorbs wind power and part of guaranteed photovoltaic power output at low prices, resulting in serious light abandonment and the highest carbon emission cost. In mechanism 2, the absorption responsibility guarantee mechanism is introduced, the total cost of market operation is the highest, and the assessment index brings risks, making CVaR the highest risk value. The renewable energy electricity in the province is not enough to achieve the absorption responsibility weight index, so it is necessary to purchase the consumption voucher to complete the intra-day assessment index. Mechanism 3 has the lowest market operation cost and consumes wind power at a lower prices in the province, but there is a phenomenon of more abandoned light power. This is because inter-provincial transactions bring more low-price renewable energy, and the quotation of photovoltaic units in the province is not dominant. Mechanism 3 completes the target of intra-day consumption responsibility weight through the actual consumption of renewable energy, without the additional purchase of consumption vouchers. The carbon emission cost and CVaR risk value are the lowest in the three scenarios.
4.3 Results of Inter-Provincial Transaction Operation
This example mainly analyzes the results of mechanism 3, when provincial power companies participate in the inter-provincial transaction after obtaining the inter-provincial renewable energy purchasing demand, and clearing the provincial renewable energy units sent to the end, as shown in Fig. 7.
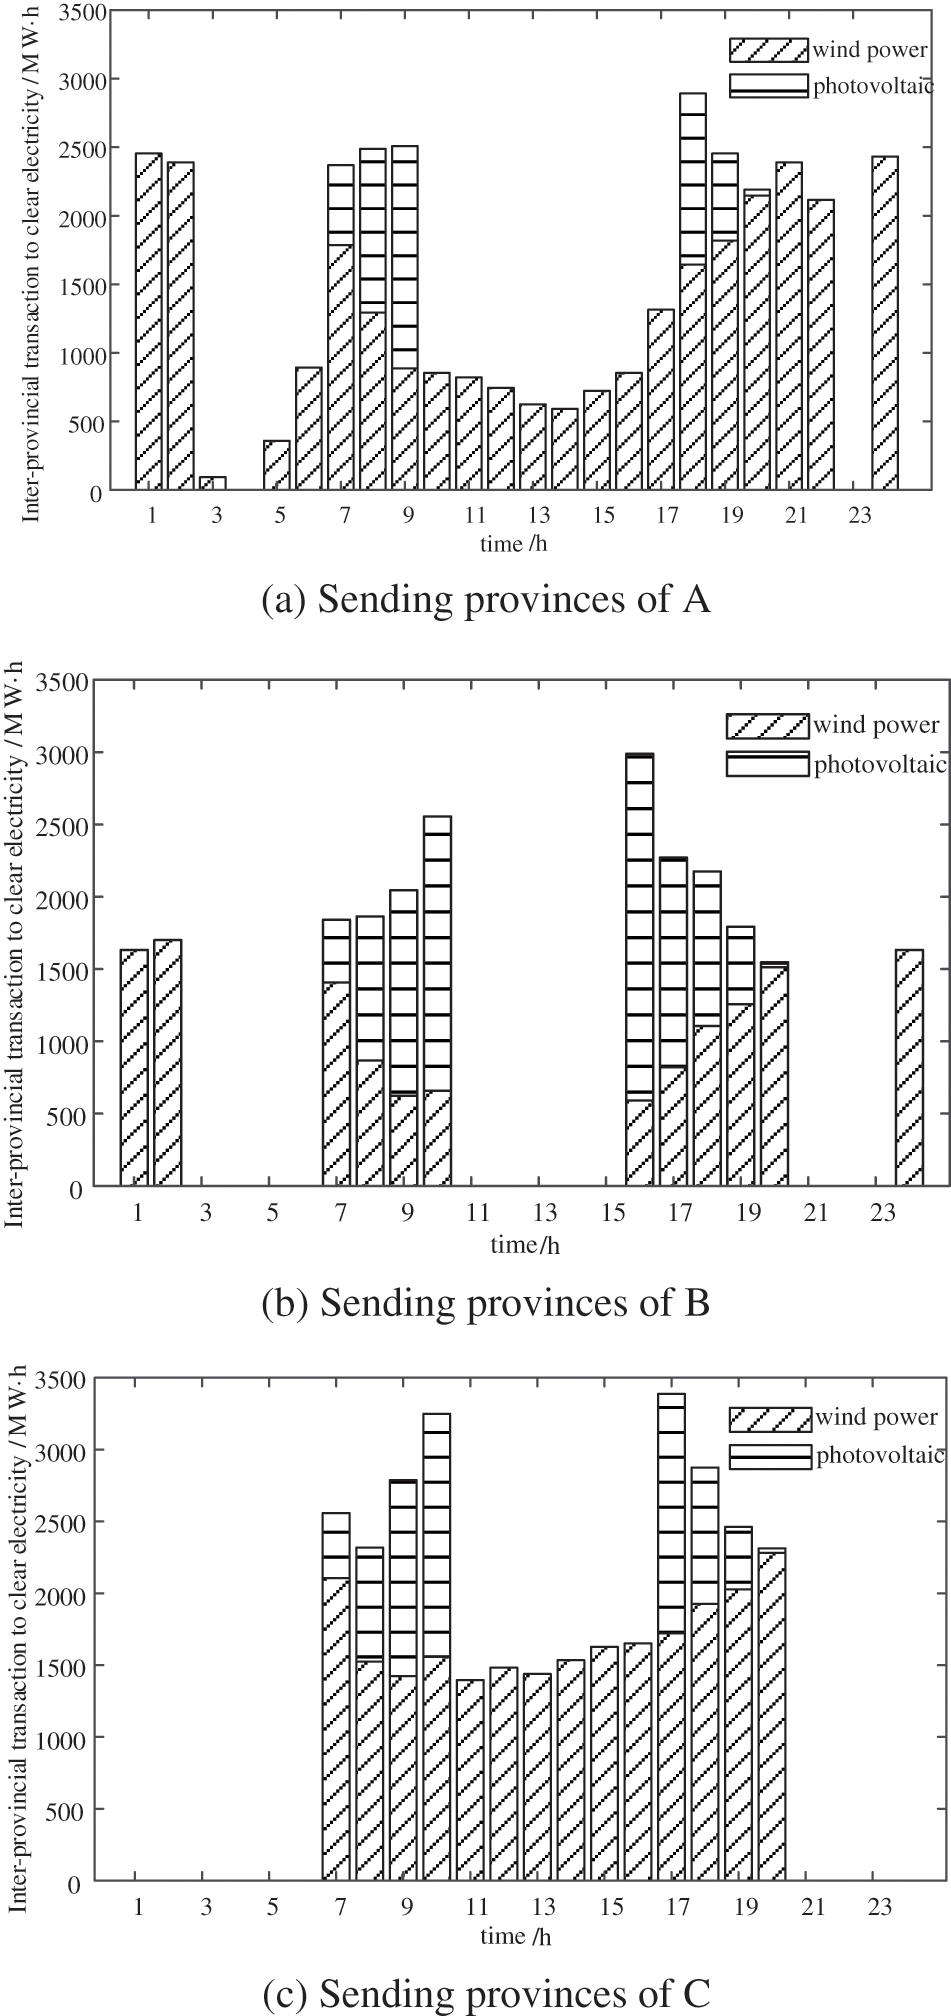
Figure 7: The amount of electricity cleared by renewable energy units in transmission provinces participating in inter-provincial transactions
From Figs. 7a–7c, it can be seen that the wind turbines with the lower quotation of A, B, and C have priority over the photovoltaic units in a clearing, while the wind turbines with the lowest quotation of PV and the largest amount of clearing power among the three provinces. The photovoltaic output of the three sending provinces is mainly concentrated in the two periods with high load demand: 6:00–10:00 and 15:00–20:00. In the two periods of 3:00–4:00 and 22:00–23:00, the power of the three sending provinces and receiving provinces is 0. It can be seen from Fig. 8 that in the absence of photovoltaic clearing, the clearing price of the inter-provincial market is mainly determined by the clearing price of wind turbines in the three sending provinces. Since the price of wind turbines in the three sending provinces, inter-provincial contact line loss rate, and transmission cost levels are relatively close, the clearing price remains unchanged at 380.11 yuan/MW·h. When the output of the three provincial PV units starts, the inter-provincial clearing price is mainly determined by the PV units during the two periods of 6:00–10:00 and 15:00–20:00. In the two periods from 6:00 to 9:00 and from 18:00 to 20:00, photovoltaic power is generated in all the three provinces. At this time, the clearing price is the highest, 466.13 yuan. From 9:00 to 10:00 and from 16:00 to 17:00, only photovoltaic units in two provinces B and C are sent for output, and the price is 443.16 yuan. From 15:00 to 16:00, only B with the lowest PV quotation can save PV power, and the clearing price is 437.97 yuan. As can be seen from Fig. 7, the wind turbines with the lower quotation of A, B, and C have priority over the photovoltaic units in a clearing, while the wind turbines with the lowest quotation of PV and the largest amount of clearing power among the three provinces. The photovoltaic output of the three sending provinces is mainly concentrated in the two periods with high load demand: 6:00–10:00 and 15:00–20:00. In the two periods of 3:00–4:00 and 22:00–23:00, the power of the three sending provinces and receiving provinces is 0.
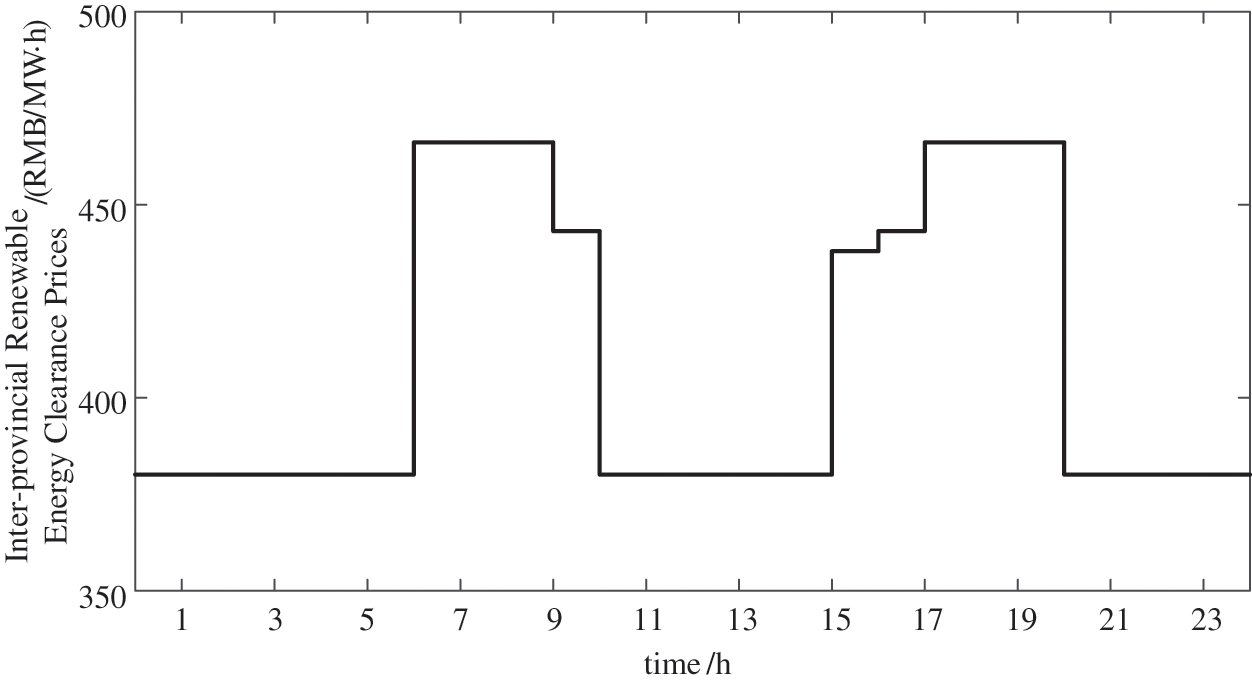
Figure 8: Clearing prices of interprovincial renewable energy transactions
4.4 Influence of Risk Aversion Coefficient
This example analyzes the risk control ability of provincial power companies in mechanism 3, and the influence of different risk aversion coefficients
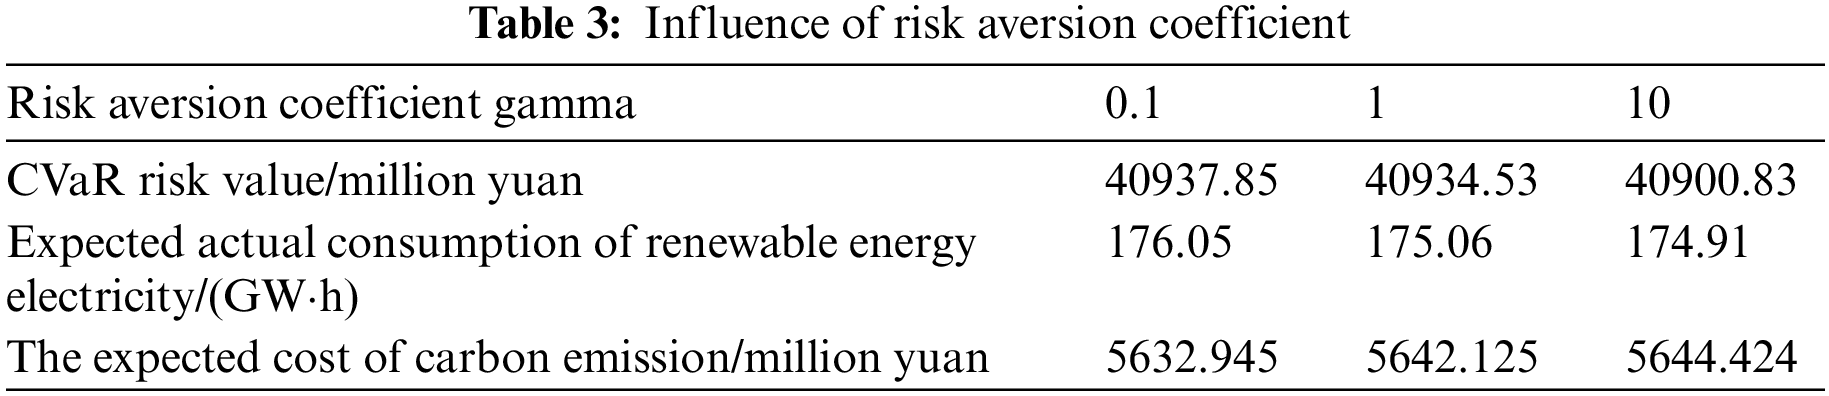
As shown in Table 3, with the gradual increase of the risk aversion coefficient, provincial power companies become more risk averse and make more conservative power purchase decisions. The CVaR risk value of market operation gradually decreases, and the actual consumption expectation of renewable energy electricity in each scenario decreases, including the electricity purchase of renewable energy between provinces. Provincial power companies are more inclined to choose thermal power and gas power with accurate output prediction when making power purchase decisions, so the carbon emission costs will increase accordingly.
As can be seen from Fig. 9, with the increase in risk aversion coefficient, provincial power companies are more risk averse, and the total cost difference of market operation between scenarios gradually decreases. Among the 27 scenarios, the scenario of high market operation total cost shows a trend of decreasing with the increase of the risk aversion coefficient. It can be seen that the adoption of CVaR risk theory to measure market operation risk can improve the ability of provincial power companies to change their power purchase decision and control market operation costs under the scenario of uncertain risk.
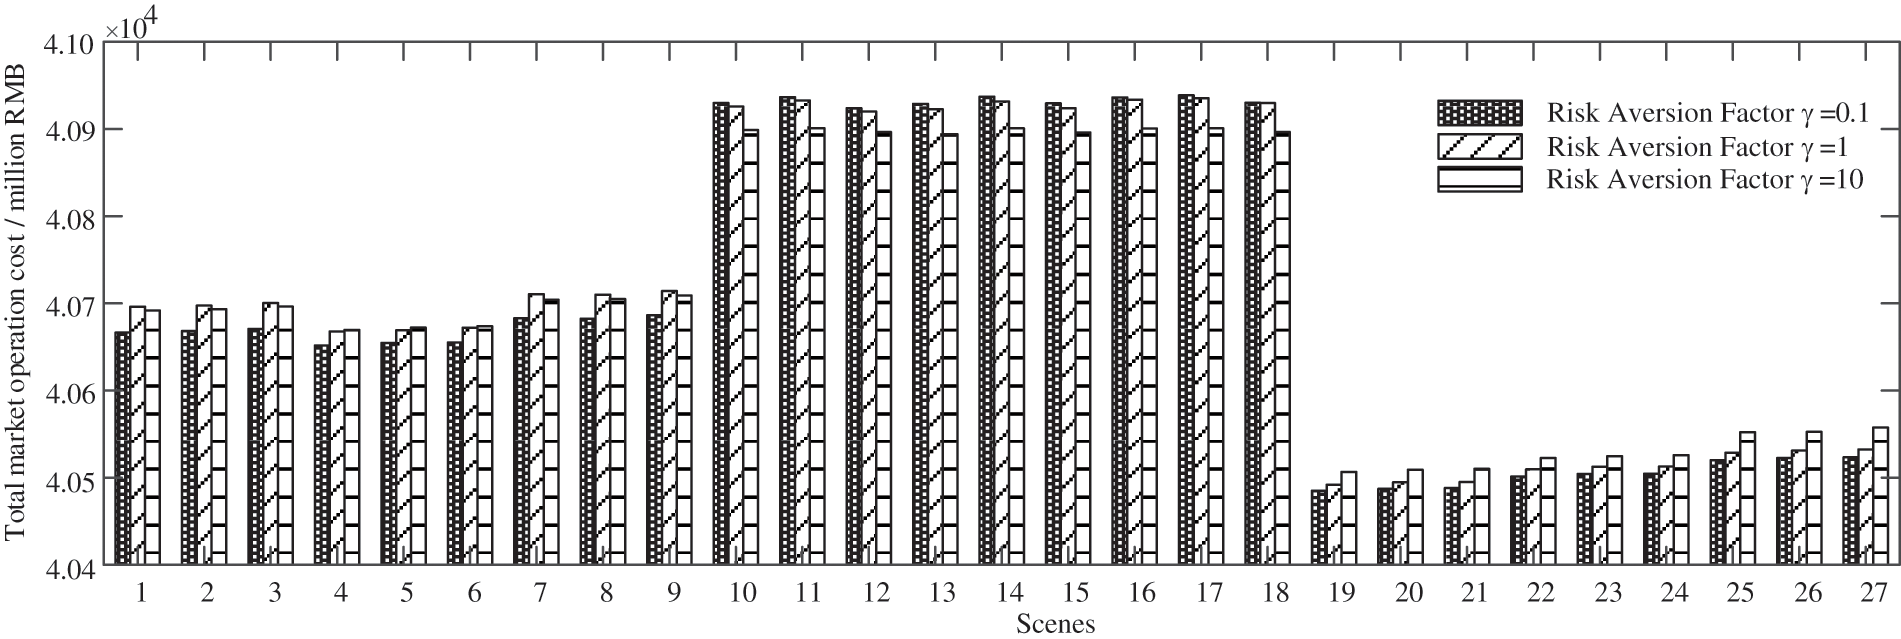
Figure 9: Impact of risk aversion coefficient on market operation cost
4.5 The Influence of the Consumption Responsibility Guarantee Mechanism on the Market Operation Results
This example mainly studies the influence of the absorption liability guarantee mechanism on the market operation results. With the price of consumption vouchers (i.e., green certificate and excess consumption price) and the weight of non-water consumption responsibility of provincial power companies as variables in mechanism 2 and mechanism 3. Analyze the impact on the expected total running cost of each scenario. The market operation cost of mechanism 2 is shown in Fig. 10a, and the market operation cost of mechanism 3 is shown in Fig. 10b.
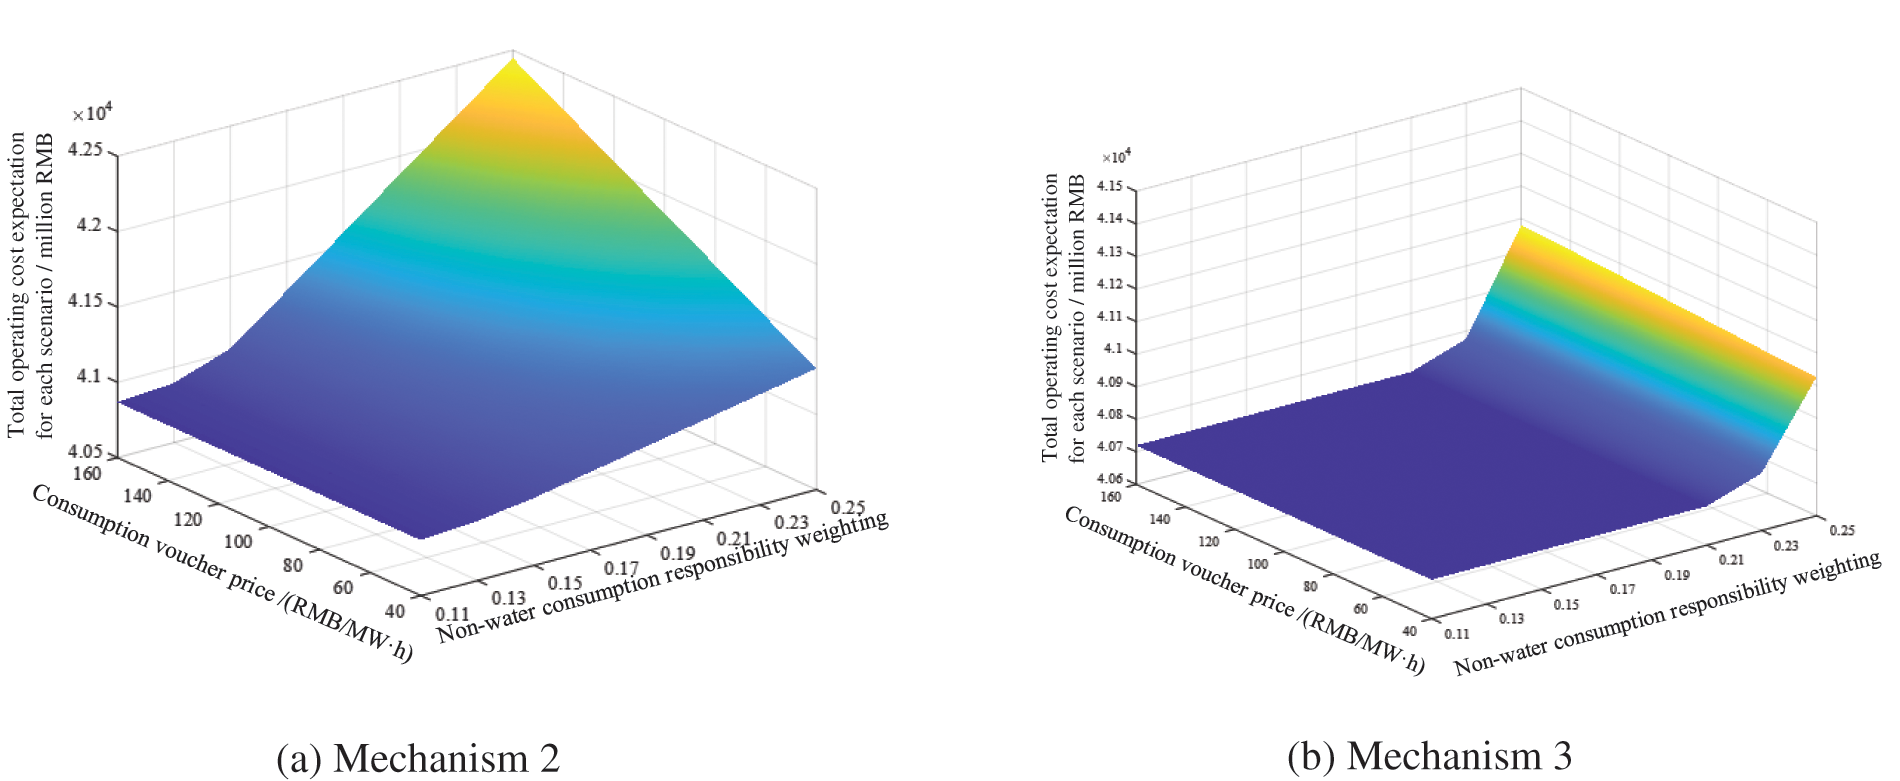
Figure 10: Market operating costs
According to Fig. 10a, under the condition that the absorption responsibility guarantee mechanism is implemented in the mechanism 2 market and the output of renewable energy units remains unchanged, the market operation cost gradually increases with the increase of the weight of non-water absorption responsibility. At the same time, the market operation cost is also affected by the price parameters of the consumption voucher. The higher the intra-day green certificate and the excess consumption price level, the more sensitive the market operation cost is to the change degree of the absorption responsibility weight. As shown in Fig. 10b, inter-provincial renewable energy trading is introduced in mechanism 3. Provincial power companies participate in inter-provincial trading according to the provincial renewable energy electricity quantity and consumption demand. With the increase of the weight of non-water consumption responsibility, the expected value of the total cost of market operation has increased since the weight value of 23%. At this time, the renewable energy resources within and between provinces gradually cannot meet the demand of the weight of consumption responsibility, so it is necessary to purchase the consumption voucher to achieve the assessment index of the weight of consumption responsibility.
This paper proposes an intra-provincial power market clearing model considering carbon emission and absorption responsibility weight. Combined with the power generation and consumption within the province, inter-provincial renewable energy trading is used to meet the load demand within the province and achieve the consumption responsibility weight index within the province. In the modeling process, the impact of carbon emission cost and the weight of consumption responsibility, as well as the total cost of market operation with uncertain risks are considered to complete the model of the electricity market with intra-provincial trading and inter-provincial clearing. The example uses the inter-provincial transaction of one receiving province and three sending provinces to compare and analyze the impact of the introduction of the absorption guarantee mechanism and inter-provincial transaction on the market operation cost, analyzes the result of the clearance of inter-provincial renewable energy transaction, and analyzes the power purchase decision and the change of operating cost caused by the change of risk aversion coefficient and absorption responsibility weight. Finally, it is concluded that the model proposed in this paper provides the basis for the study of inter-provincial energy trading and promotes the wider uptake of renewable energy. The following conclusions were obtained:
(1) After considering the carbon emission cost and the weight of renewable energy consumption responsibility, after the provincial power company participates in the inter-provincial electricity market transaction to obtain renewable energy, the market operating cost can be effectively reduced by about 2.76 million yuan, and the consumption of renewable energy electricity can be increased by 91%.
(2) Considering the wind aversion coefficient, it can effectively improve the ability of provincial power companies to change power purchase decisions and control market operating costs under uncertain risk scenarios.
(3) When the weight of non-water consumption responsibility is increased and the weight of consumption responsibility reaches a certain value, the expected value of total operating cost is increased, and consumption vouchers need to be purchased to meet the assessment index of consumption responsibility weight.
This paper provides a reference for the power purchase strategy of inter-provincial and intra-provincial transactions under China’s two-tier electricity market model in the future. At the same time, it provides an idea for provinces with more new energy contributions to complete consumption.
Acknowledgement: None.
Funding Statement: Project supported by National Natural Science Foundation of China (51977127); Shanghai Municipal Science and Technology Commission (19020500800); “Shuguang Program” (20SG52) Shanghai Education Development Foundation and Shanghai Municipal Education Commission.
Author Contributions: The authors confirm contribution to the paper as follows: study conception and design: Chunlei Jiao, Hongyan Hao; data collection: Ming Li; analysis and interpretation of results: Rifucairen Fu, Yichun Liu, Shunfu Lin; draft manuscript preparation: Ronghui Liu. All authors reviewed the results and approved the final version of the manuscript.
Availability of Data and Materials: The authors confirm that the data supporting the findings of this study are available within the article.
Conflicts of Interest: The authors declare that they have no conflicts of interest to report regarding the present study.
References
1. Zhao, Y. L., Kong, G., Li, Z., Ma, L. W., Ni, W. D. (2021). Strategic analysis of global energy transition and China’s energy revolution. Strategic Study of CAE, 23(1), 15–23. [Google Scholar]
2. Jiang, L. H. (2021). Global carbon cycle: From fundamental scientific problem to green responsibility. Science, 73(1), 39–43+4. [Google Scholar]
3. Zhang, Y., Zhang, J. Y., Yang, Z. F., Li, J. (2012). Analysis of the distribution and evolution of energy supply and demand centers of gravity in China. Energy Policy, 49(10), 695–706. [Google Scholar]
4. Zhang, S. L., Sun, Y. M., Zhang, Y. (2012). Research on mechanism of inter-provincial contract transfer and replacement transaction in South China electricity market. Power System Technology, 36(12), 262–268. [Google Scholar]
5. Bao, M. L., Ding, Y., Shao, C. Z., Song, Y. H. (2017). Review of Nordic electricity market and its suggestions for China. Proceedings of the CSEE, 37(17), 4881–4892. [Google Scholar]
6. Lin, J. (2013). Modeling and simulation of PJM and northeastern RTOs for interregional planning. 2013 IEEE Power & Energy Society General Meeting, pp. 1–5. Vancouver, BC, Canada. [Google Scholar]
7. Lam, L. H., Ilea, V., Bovo, C. (2018). European day-ahead electricity market coupling: Discussion, modeling, and case study. Electric Power Systems Research, 155, 80–92. [Google Scholar]
8. Chen, W., Liang, Z. F., Zhang, Z. X., Zhang, Q. L. (2018). Analysis of European internal electricity market and its enlightenment to China southern region electricity market. Power System and Clean Energy, 34(8), 11–16. [Google Scholar]
9. Li, G. Q., Li, X. T., Bian, J., Li, Z. H. (2021). Two level scheduling strategy for inter-provincial DC power grid considering the uncertainty of PV-load prediction. Proceeding of the CSEE, 41(14), 4763–4776. [Google Scholar]
10. Xu, D., Liang, F., Huang, G. D. (2019). Security constrained economic dispatch model of inter provincial power grid considering multi-level dispatch. Automation of Electric Power Systems, 43(22), 94–100. [Google Scholar]
11. Yu, S. M., Wen, B. Y., Wang, L. Y., Chen, J. (2018). Electricity purchasing strategy for the regional power grid considering wind power accommodation. IEEJ Transactions on Electrical and Electronic Engineering, 13(8), 1110–1118. [Google Scholar]
12. Yang, Y. Z., Zhang, H. Y., Xiong, W. M., Zhang, D., Zhang, X. L. (2018). Regional power system modeling for evaluating renewable energy development and CO2 emissions reduction in China. Environmental Impact Assessment Review, 73, 142–151. [Google Scholar]
13. Shi, L., Zhou, L., Pang, B., Yan, Y. (2017). Design ideas of electricity market mechanism to improve accommodation of clean energy in China. Automation of Electric Power Systems, 41(24), 83–89. [Google Scholar]
14. Peng, Q., Zhou, X. J., Yang, R. (2020). Design of coordination and balance mechanism between national green power certificate trading market and provincial day-ahead power market. Power System Technology, 44(7), 2565–2571. [Google Scholar]
15. Zou, B., Zhao, Y., Li, X. G., Yang, L. B. (2016). Market nechanism research on trans-provincial and trans-regional clean energy consumption and compensation. Power System Technology, 40(2), 595–601. [Google Scholar]
16. Guo, L. B., Ding, Y., Bao, M. L., Zeng, D. (2019). An optimal power purchase model of inter-provincial traders in two-level electricity market considering risk management. Power System Technology, 43(8), 2726–2734. [Google Scholar]
17. Liu, K. Z., Dai, Y. H., Zhao, Q. L., Wu, Z. S., Dong, M. (2023). Considering carbon-green certificate trading mechanism under demand response new energy cross-province trading model. Proceedings of the CSU-EPSA, pp. 1–13. [Google Scholar]
18. Chen, X. L., Wang, X. L., Lyu, J. H., Zhang, H., Zhu, Z. Y. (2020). Optimal operation model of two-level electricity market under the responsibility of renewable energy consumption. Journal of Global Energy Interconnection, 3(5), 430–440. [Google Scholar]
19. Zhuang, X. D., Feng, D. H., Gan, D. Q. (2010). Bi-level optimal power purchase combination strategy based on financial transmission rights and BDE algorithm. Electric Power Automation Equipment, 30(5), 11–17. [Google Scholar]
20. Li, C. H., Wang, Q., Wen, F. T. (2007). Chance-constrained programming based approach to optimal purchasing strategies of distribution companies. Proceedings of the Chinese Society of Universities for Electric Power System and Automation, 19(6), 12–17. [Google Scholar]
21. Xie, P. J., Tan, Z. F., Wang, M. B., Hou, J. B. (2009). Spot market optimal decision-making model of purchase electricity for power-supplying company based on CVaR model. Transactions of China Electrotechnical Society, 24(4), 186–192. [Google Scholar]
22. Liu, H. M., Han, M. M., Hou, Y. H., Lu, J. J., Chen, Q. W. (2010). A mean-weighted CVaR model for distribution company’s optimal portfolio in multi-energy markets. Power System Technology, 34(9), 133–138. [Google Scholar]
23. Chen, L. H. (2020). Decision-making suggestions for renewable energy quota entities participating in green certificate market transactions. China Power Enterprise Management, 10, 60–63. [Google Scholar]
24. Yao, X. A., Zheng, Z. J., Yang, W., Wu, J. H., Yang, L. (2020). Electricity market settlement mechanism design and practice in Guangdong. Power System Protection and Control, 48(2), 76–85. [Google Scholar]
25. Zang, H. X., Ma, M. X., Zhou, Y. Z., Xia, Q. Q., Sun, G. Q. (2022). Robust optimal scheduling model for a ‘wind power-concentrating solar power-biomass’ hybrid power plant in the electricity market. Power System Protection and Control, 50(5), 1–11. [Google Scholar]
26. Guo, X. J., Li, S. Y., Zhu, Q. P., Meng, X. Y. (2021). Capacity mechanisms of the oligopoly electricity market based on an equilibrium model. Power System Protection and Control, 49(24), 121–131. [Google Scholar]
27. Song, W., Wang, J. W., Zhao, H. B., Song, X. J., Li, W. (2017). Research on multi-stage bidding strategy of virtual power plant considering demand response market. Power System Protection and Control, 45(19), 35–45. [Google Scholar]
28. Gai, Z. J., Wang, P. H. (2017). A typical calculation and analysis of carbon emissions from coal-fired power plants. Electric Power, 50(5), 178–184. [Google Scholar]
Appendix A
1 Two-layer model solution
The upper model calculates the quantity (electricity purchased from renewable energy between provinces
1) Lagrange constraint
where
2) Lagrangian stationarity constraint
where
3) Duality problem constraints
4) Complementary relaxation conditions
The lower model meets the KKT equivalent condition and transforms the two-layer model into a single-layer model. The specific objective function is as follows:
2. Linearization of the two-layer model
Since the objective function of Eq. (A-5) has the multiplication term of decision variables (i.e.,
According to duality theory, the duality problem of the lower level problem is:
According to the duality theory, the original objective function and the objective function of the dual problem can obtain the same value by optimizing their respective decision variables, namely:
Expansion and derivation can be obtained:
Substitute Eq. (A-7) into Eq. (A-5) to transform it into a single-layer linear problem, and the final objective function is:
Appendix B
The LHS Latin hypercube sampling method is used to generate data of 1000 scenes each, and the scenes are reduced by combining the synchronous back generation technique. The scenes and corresponding probabilities are shown in Figs. B1–B3, and finally the 27 sets of provincial load, wind power and PV scenes are combined.
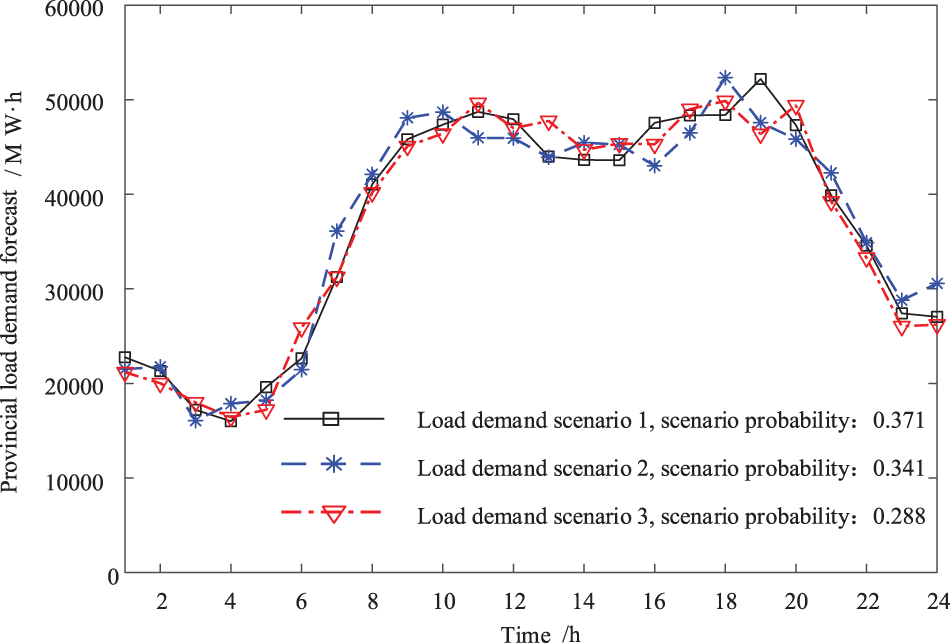
Figure B-1: Scenario of provincial load requirements
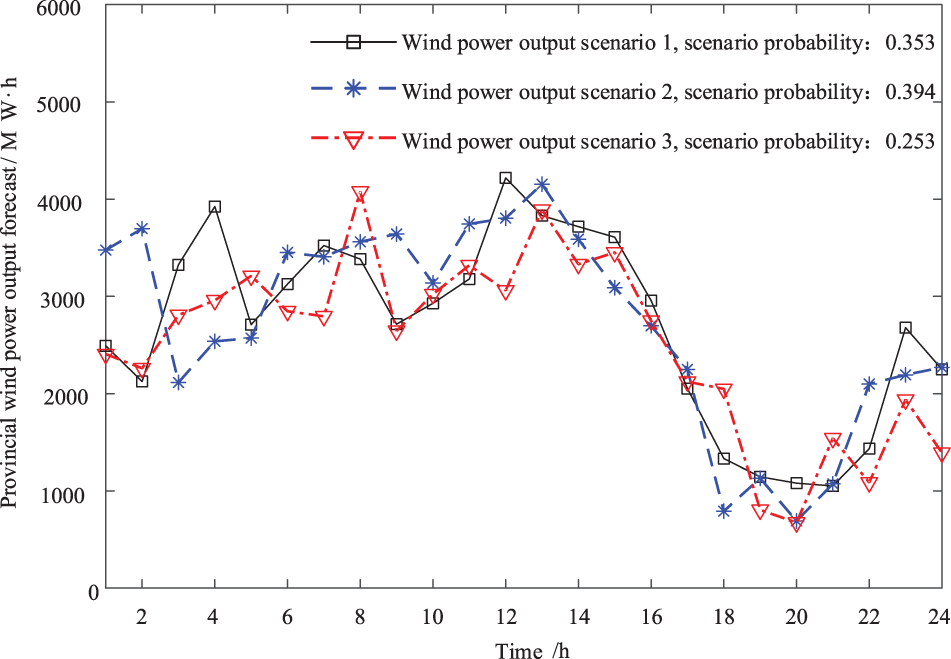
Figure B-2: Scenario of provincial wind power output
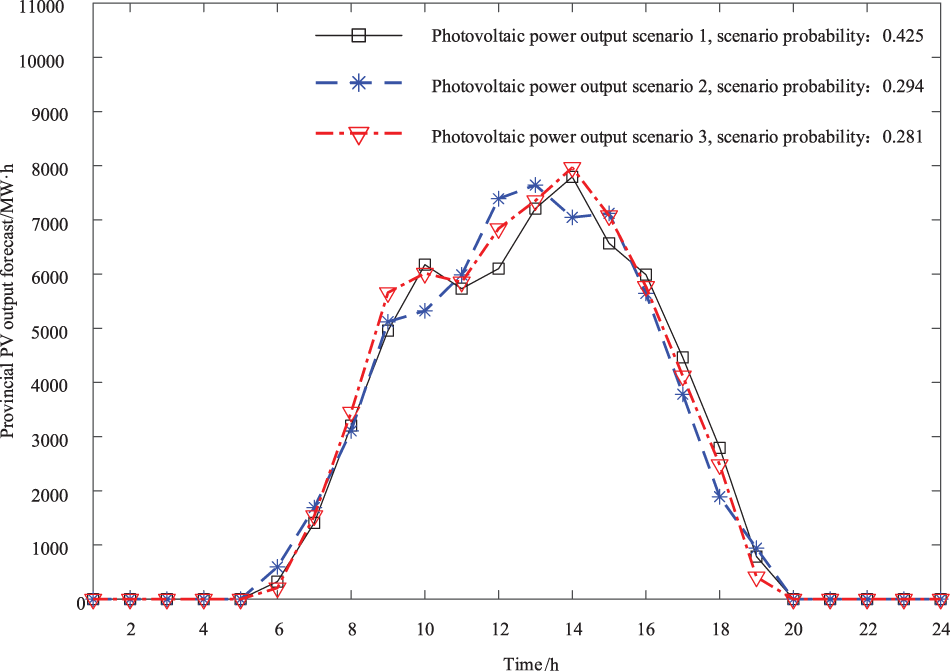
Figure B-3: Provincial PV output scenario
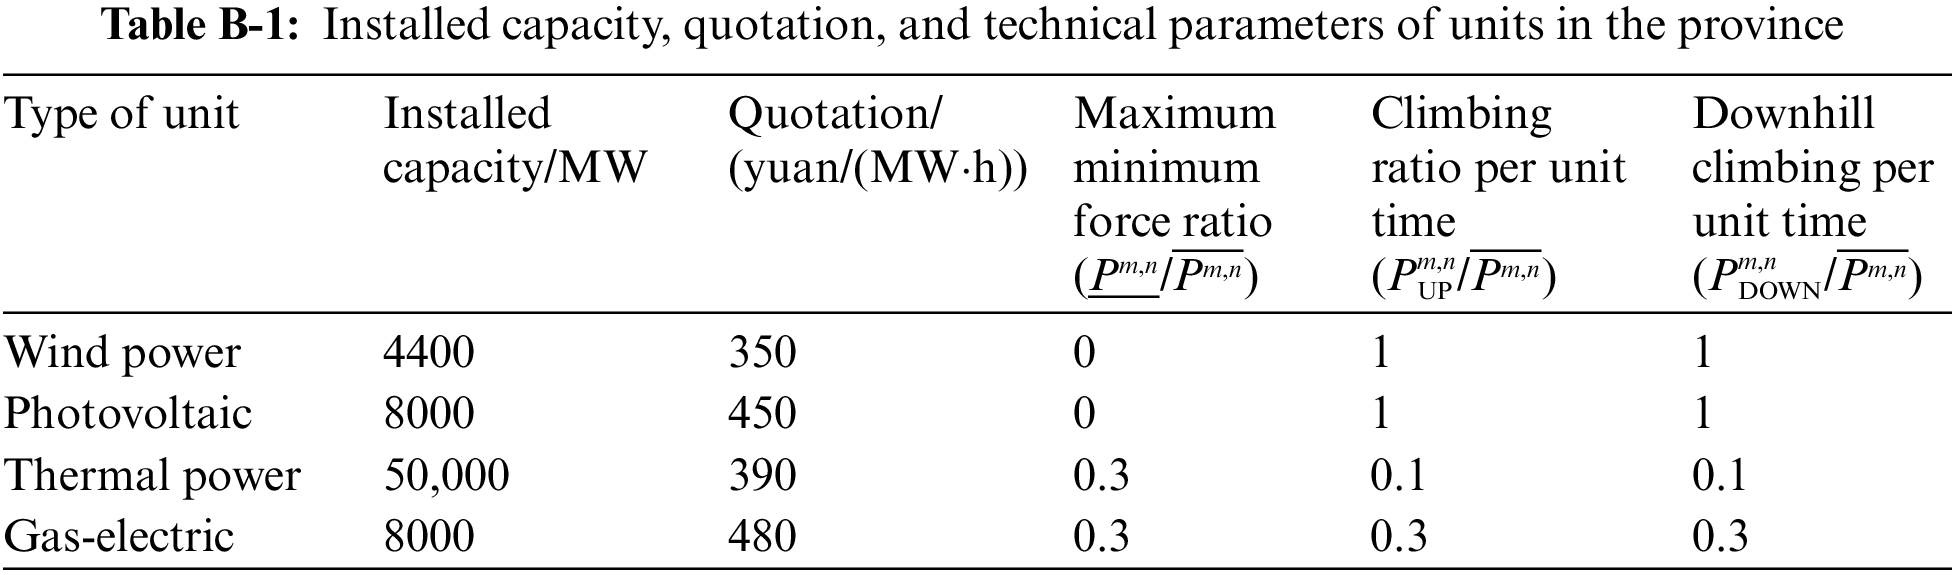
This chapter assumes that all parameters of the units in the province are the same in all scenarios at all periods. Table B-1 shows the installed capacity, quotation, and technical parameters of the renewable energy units and traditional energy units in the province.
Figs. B4–B6 show the output prediction of the renewable energy unit in the endpoint province.
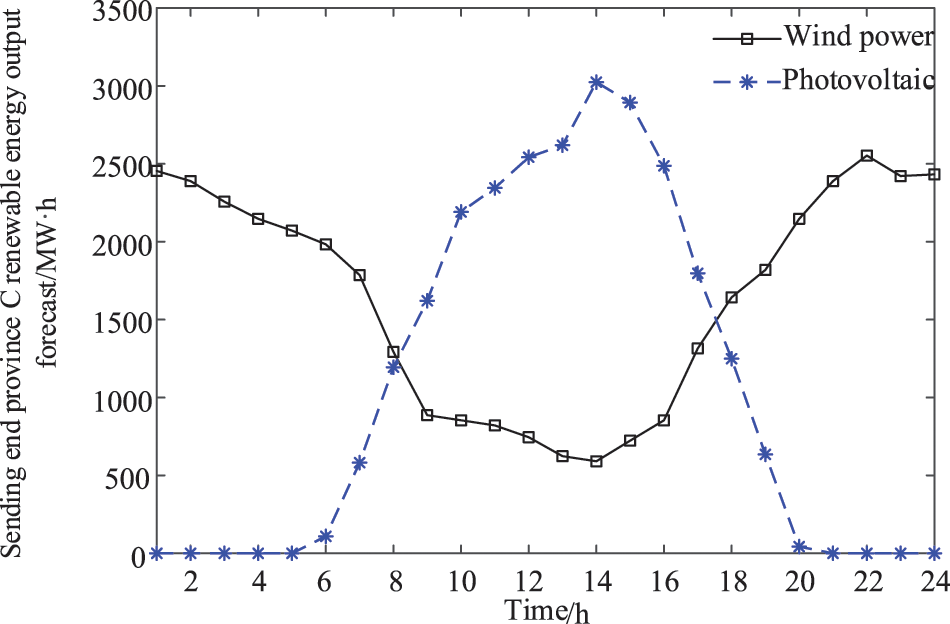
Figure B-4: Sending end province A renewable energy output forecast
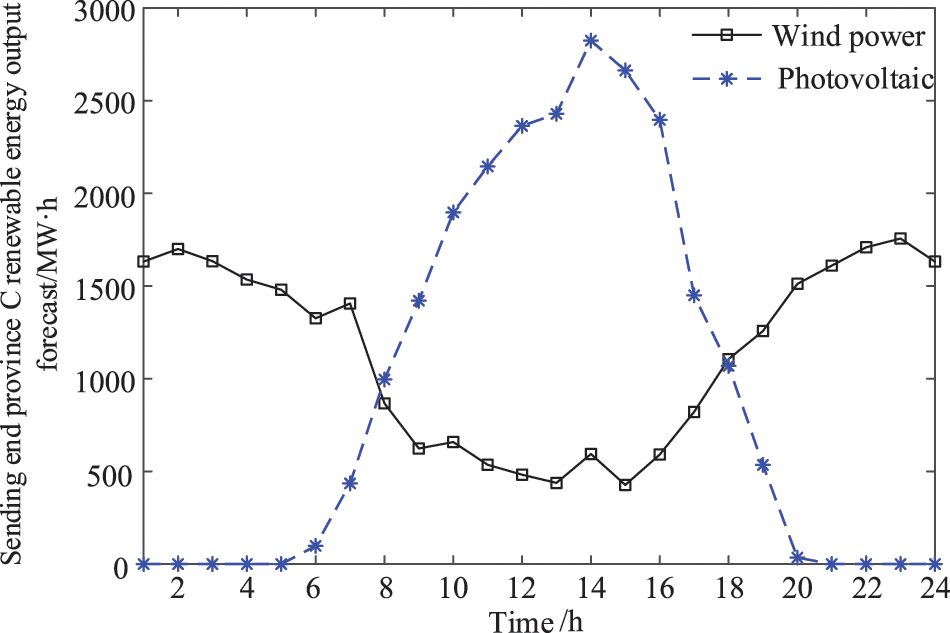
Figure B-5: Sending end province B renewable energy output forecast
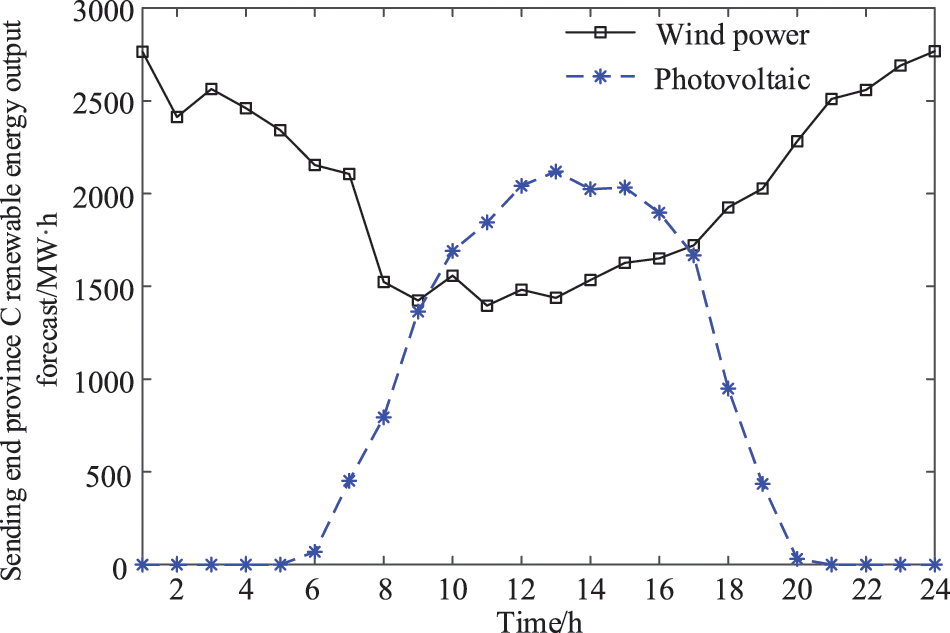
Figure B-6: Sending end province C renewable energy output forecast
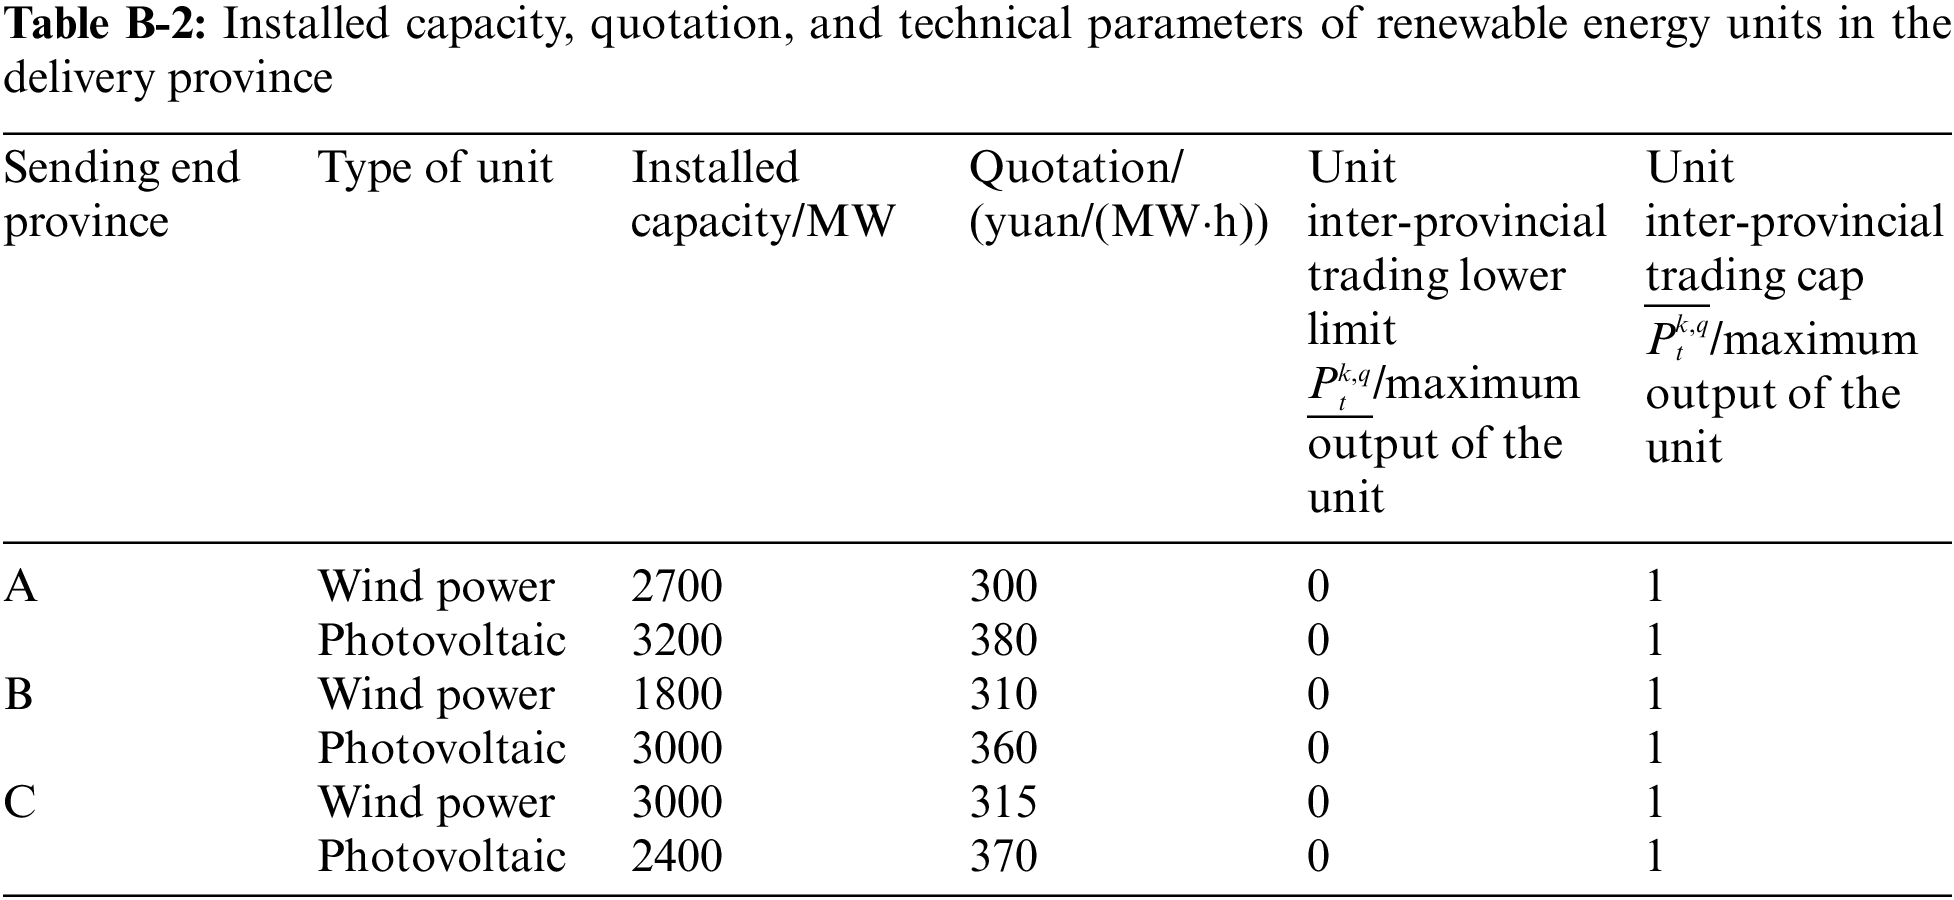
Assume that the parameters of the same renewable energy units in different provinces are the same, and the installed capacity, quotation, and technical parameters are shown in Table B-2.
Cite This Article
 Copyright © 2023 The Author(s). Published by Tech Science Press.
This work is licensed under a Creative Commons Attribution 4.0 International License , which permits unrestricted use, distribution, and reproduction in any medium, provided the original work is properly cited.
 Downloads
 Citation Tools