
 Submit a Paper
 Propose a Special lssue
 Open Access
ARTICLE

Identification of High-Risk Scenarios for Cascading Failures in New Energy Power Grids Based on Deep Embedding Clustering Algorithms
1 State Grid Shanxi Electric Power Research Institute, State Grid Shanxi Electric Power Co., Ltd., Taiyuan, 030001, China
2 School of Electrical and Electronic Engineering, North China Electric Power University, Beijing, 102206, China
* Corresponding Author: Ziqi Zhang. Email:
(This article belongs to the Special Issue: Fault Diagnosis and State Evaluation of New Power Grid)
Energy Engineering 2023, 120(11), 2517-2529. https://doi.org/10.32604/ee.2023.042633
Received 06 June 2023; Accepted 01 August 2023; Issue published 31 October 2023
 View Full Text
 Download PDF
Abstract
At present, the proportion of new energy in the power grid is increasing, and the random fluctuations in power output increase the risk of cascading failures in the power grid. In this paper, we propose a method for identifying high-risk scenarios of interlocking faults in new energy power grids based on a deep embedding clustering (DEC) algorithm and apply it in a risk assessment of cascading failures in different operating scenarios for new energy power grids. First, considering the real-time operation status and system structure of new energy power grids, the scenario cascading failure risk indicator is established. Based on this indicator, the risk of cascading failure is calculated for the scenario set, the scenarios are clustered based on the DEC algorithm, and the scenarios with the highest indicators are selected as the significant risk scenario set. The results of simulations with an example power grid show that our method can effectively identify scenarios with a high risk of cascading failures from a large number of scenarios.Keywords
Over the past few years, there has been a significant surge in the development of modern power systems characterized by ultrahigh voltage, long-distance transmission capabilities, large capacities, and extensive interconnections. However, along with these advancements comes the risk of cascading failures, where even minor faults in local power grids can propagate to neighboring regional grids, resulting in widespread outage incidents. Numerous large-scale outages in various countries have demonstrated that cascading failures are often the root cause of such accidents [1]. Hence, it has become essential to assess the risk of cascading failures in power grids.
The most common method for risk assessment of new power systems is the Monte Carlo method, mostly based on the traditional sequential Monte Carlo and nonsequential Monte Carlo methods [2,3]. However, this method requires a large computational volume to obtain accurate values and tends to ignore some special cases. In addition, there are some methods based on power flow calculation in the risk assessment of cascading failures in new power systems; the reference [4] used the alternating current power flow calculation method, which determines the risk after wind power access from multiple directions. Reference [5] used the stochastic power flow calculation method to calculate the distribution of each cascading failure search index. These studies involve power flow calculation, and there are often assumptions of the model that are not consistent with actual scenarios, such as the assumption that the unbalanced power of the whole network is borne by the balancing nodes. Reference [6] introduced the Thiel entropy index to assess the vulnerability of each branch in the power system and quantify the impact on the safety of grid operation after a branch fault is withdrawn from operation; Reference [7] proposed a fast screening method for cascading failures considering source-load uncertainty based on the random response surface method and Deep Forest while taking into account the speed and accuracy of stochastic power flow calculation; these methods have achieved some results in cascading failure screening.
With the continuous development of science and technology, monitoring and control systems using the supervisory control and data acquisition (SCADA) architecture have become able to record complex and diversified data information in the power system and to perform some tasks remotely. The large amount and diversity of data allow the staff to analyze the power system in detail and identify the locations and types of faults in the power grid faster and more accurately. Among them, scenario analysis has been widely used in power systems [8–11] to analyze data with satisfactory results. Many data analysis-based approaches to power grid risk assessment have achieved some results. In reference [12], the stochastic current calculation method was rederived by taking into account the role of system frequency regulation, drawing upon the idea of the Oxla method. In reference [13], the main causes of four types of interlocking faults that occur in a high percentage of new energy power systems and three key techniques for searching interlocking fault accident cascades were refined. Reference [14] analyzed the fault interaction dynamics between source, grid and load and established centralized and distributed new energy protection logic and risk indicators, respectively.
However, considering the randomness and uncertainty of renewable energy, cascading failure characteristics in traditional grids may differ from those in renewable energy grids. When assessing the risk of cascading failures in renewable energy grids, evaluating indicators based solely on the transfer of power flows is insufficient to represent the cascading failure risk in such operational scenarios. Meanwhile, most of the methods in the above literature are based on traditional algorithms, and with the expansion in grid scale and increase in structural complexity, the complexity of scenarios is also increasing, and traditional algorithms are becoming insufficient. Deep learning algorithms are more capable of learning data features than traditional algorithms and are more suitable for solving complex scenario identification problems.
In this paper, we construct a method of identifying scenarios with a high risk of cascading failure in a new energy grid based on a deep embedding clustering (DEC) algorithm combined with a scenario analysis approach. The contributions of this paper are summarized as follows:
1. A new energy grid cascading failure risk index is constructed, which combines line power flow entropy and voltage offset entropy to reflect the risk level of cascading failures in new energy grids and is applicable to the operation scenarios of power systems containing new energy.
2. The proposed method of identifying scenarios with a high risk of cascading failures based on the DEC algorithm classifies operational scenarios according to the similarity of risk indicators. It generates a set of significant risk scenarios with a high probability of cascading failures, confirms the effectiveness of the model for high-risk scenario identification, and reduces the time required to conduct cascading failure simulation studies in different scenarios.
2 Scenario Cascading Failure Risk Indicators
2.1 Traditional Grid Interlocking Fault Power Flow Entropy
The main factor of cascading failures in conventional power grids is active power flow shifting, where power flow in many lines exceeds their normal operating range, the probability of failure increases, and minor disturbances may lead to the tripping of overloaded lines. Entropy is a measure of the degree of system chaos. The power system is a nonlinear complex energy balance system, and the power flow entropy reflects the degree of uniformity of the distribution of power flow in lines [15].
Denote the line load factor
Define the line load factor equivalence sequence
Then, the line power flow entropy calculation formula considering cascading failures is shown in Eq. (3).
As seen from Eq. (3), the higher the percentage of heavily loaded lines, the higher the line load factor, the higher the power flow entropy value, and the greater the risk of cascading failures.
2.2 New Energy Grid Cascading Failure Voltage Offset Entropy
After the new energy is connected to the grid, the mechanism and mode of cascading failure are changed, the uncertainty of the new energy has an impact on the evolution path of cascading failures in the grid, and the interaction between the new energy and grid failures drives the evolution of cascading failures. The main influencing factors of cascading failures in new energy grids include not only active power flow transfer but also the voltage offset at each node in the system. After the initial fault, the high- and low-voltage ride-through capability of the wind turbine determines whether it goes off-grid due to the postfault system state, resulting in cascading failure and system collapse. The voltage offset entropy is intuitively defined based on the power flow entropy to measure the voltage offset degree at the wind turbine generator terminal and to assess the risk of wind turbines going off-grid.
The voltage offset rate is calculated as in Eq. (4), where
The formula for calculating the voltage offset entropy considering cascading failures is shown in Eq. (6).
The higher the percentage of off-grid wind turbine capacity, the higher the voltage offset rate at the wind turbine end, the greater the voltage offset entropy, and the greater the risk of cascading failures in the new energy grid.
2.3 Integrated Cascading Failure Risk Indicators
The new energy grid cascading failure risk analysis and evaluation should take into account the active power shift and voltage offset. We first normalize these two datasets using maximum-minimum normalization, and then transform the above active power flow entropy in lines and voltage offset entropy into a comprehensive entropy, which acts as a cascading failure risk indicator, calculated as follows:
where different weights
3 Deep Embedding Clustering Algorithm
An autoencoder (AE) is a deep neural network that mainly consists of an encoder and a decoder that enable unsupervised data dimensional compression and data feature representation [16]. Its structure diagram is shown in Fig. 1.
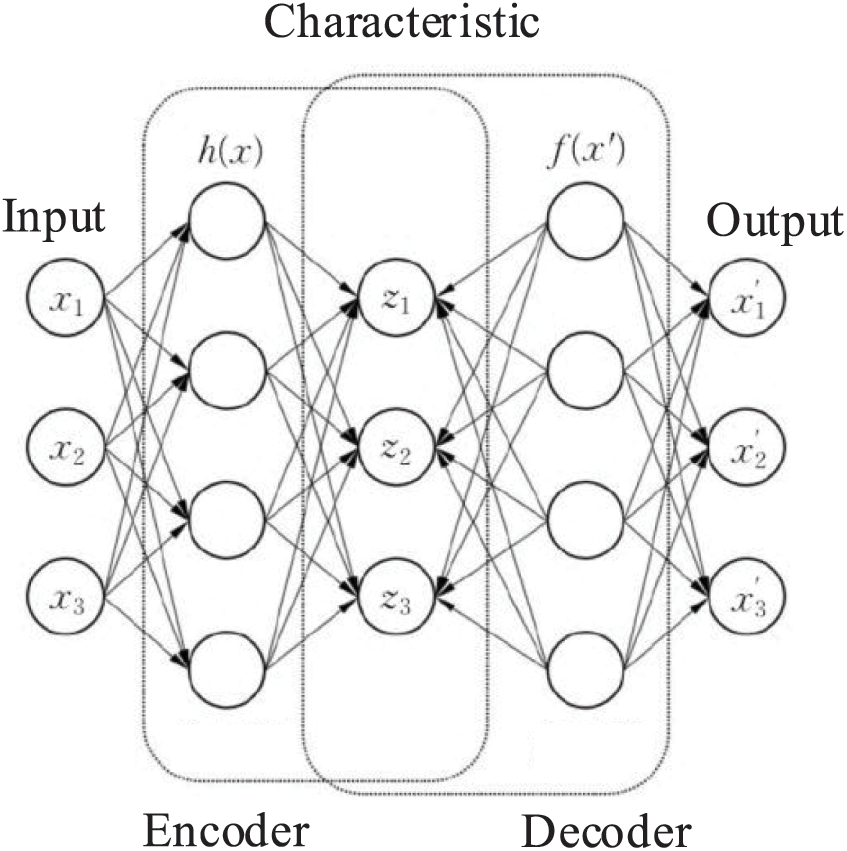
Figure 1: Autoencoder diagram
The encoder
3.2 Autoencoder-Based Deep Clustering Algorithm
The DEC algorithm is based on a deep learning AE and K-means clustering algorithm, which uses the encoding layer of the AE to generate an embedding representation of the data and then uses the K-means algorithm to cluster the data in the embedding space.
The DEC algorithm converts the clustering metric into a probability value by referring to the t-distribution in t-SNE and calculates the clustering metric as follows:
where
In the DEC algorithm, an auxiliary distribution is defined, and the KL divergence is used to measure the difference two distributions and construct the loss function. The auxiliary distribution and the loss function L are calculated as follows:
The structure diagram of the DEC algorithm is shown in Fig. 2. The general DEC algorithm consists of two parts: the first consists of pretraining the AE, optimizing it and reducing the reconstruction loss, while the second consists of taking the encoder part of the AE model and putting it into the clustering layer to perform clustering training. During the clustering training, the encoder is optimally trained using the clustering loss, the reconstruction loss, and the final output clustering results.
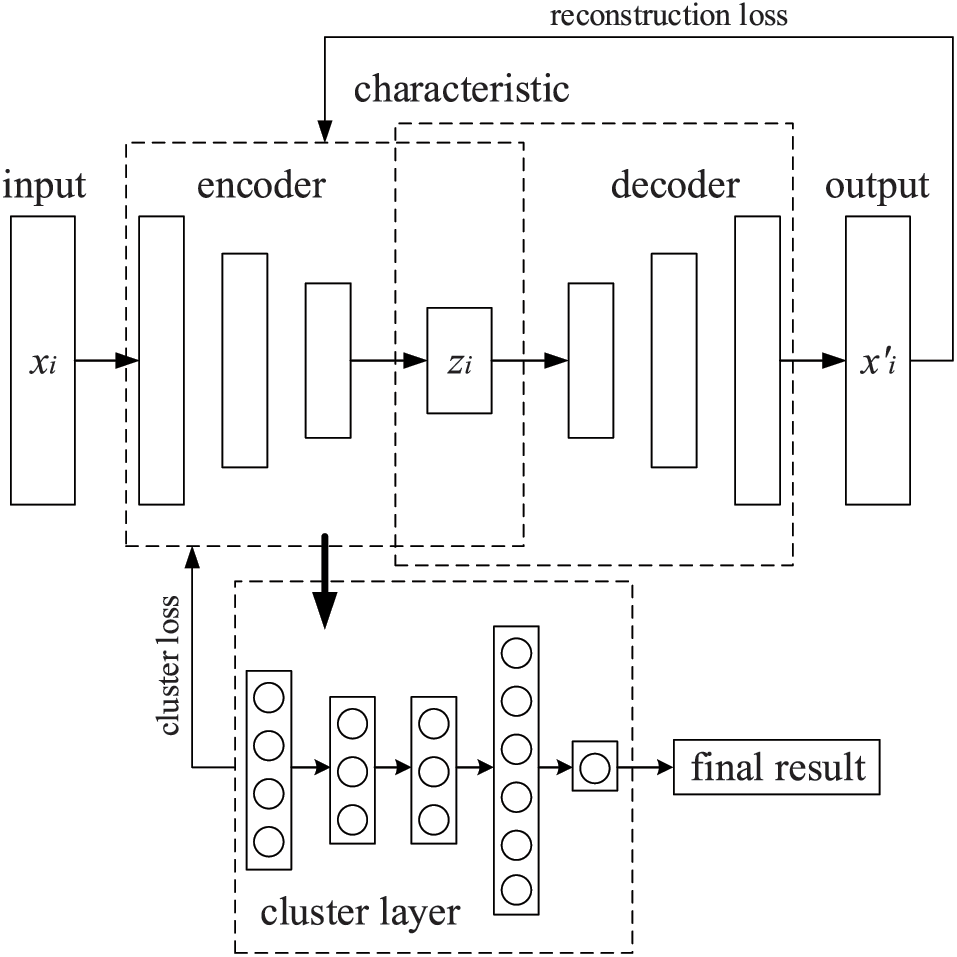
Figure 2: Deep embedding clustering algorithm structure diagram
The advantage of the DEC algorithm over traditional clustering algorithms is that the use of AEs allows it to retain the high-dimensional data better, which not only reduces the influence of invalid features on the clustering process but also significantly improves the clustering speed [18]. The definition of the center-of-mass-based probability distribution and the use of the KL divergence as the clustering loss function in the algorithm allow it to achieve better clustering results in applications.
4 Scene Recognition Model Based on a Deep Embedding Clustering Algorithm
4.1 Clustering Criteria and Evaluation Index
The operating states of electrical equipment in different operating scenarios of the power grid are different, and the risk of cascading failures in a given scenario also differs. In this paper, we construct different operation scenarios of a power system by adjusting the system states, such as the grid load level, new energy output size, and grid topology.
By calculating the constructed cascading failure risk index of the new energy grid to as the characteristic index to describe the cascading failure risk of the scenarios and by using the DEC algorithm to cluster different operating scenarios, the grid abnormal operation scenarios with the highest cascading failure risk after clustering are analyzed as the significant scenario set. Thus, we identify high-risk scenarios of cascading failures.
In this paper, the standard mutual information index (NMI) and accuracy rate (ACC) are used as evaluation indices to evaluate the performance of the scene recognition model. NMI is based on the idea of information entropy, which is used to measure the degree of coincidence of two data distributions, and is calculated as follows:
where
The accuracy rate enables a more intuitive assessment of model performance and demonstrates the clustering effect and is calculated as follows:
where
4.2 Model Identification Process
The input of the identification model of high-risk scenarios of cascading failures in new energy grids based on the DEC algorithm is the integrated cascading failure risk indicators of different operation scenarios. The scenarios are clustered based on the risk indicators. The output is the set of significant risk scenarios with high-risk indicators and the general risk scenario set. The model identification process is as follows:
1. First, the grid parameters are adjusted to obtain different grid operation scenarios, and the risk values under each scenario are calculated based on the constructed new energy grid cascading failure risk index to obtain the risk scenario sample set.
2. A scene recognition model based on the DEC algorithm is constructed, and the risk scenario sample set is divided into a training set, test set, and validation set according to a ratio of 8:1:1. The training set is used to train the model, and the test set and validation set are used to evaluate the model recognition effect.
3. After the model is trained, the set of significant risk scenarios and the set of general risk scenarios are generated, and the set of significant risk scenarios is analyzed.
4. Cascading failure simulation is performed for scenarios with significant risk to verify the effectiveness of the model for identifying scenarios with a high risk of cascading failures.
The flow chart of the identification process is shown in Fig. 3.
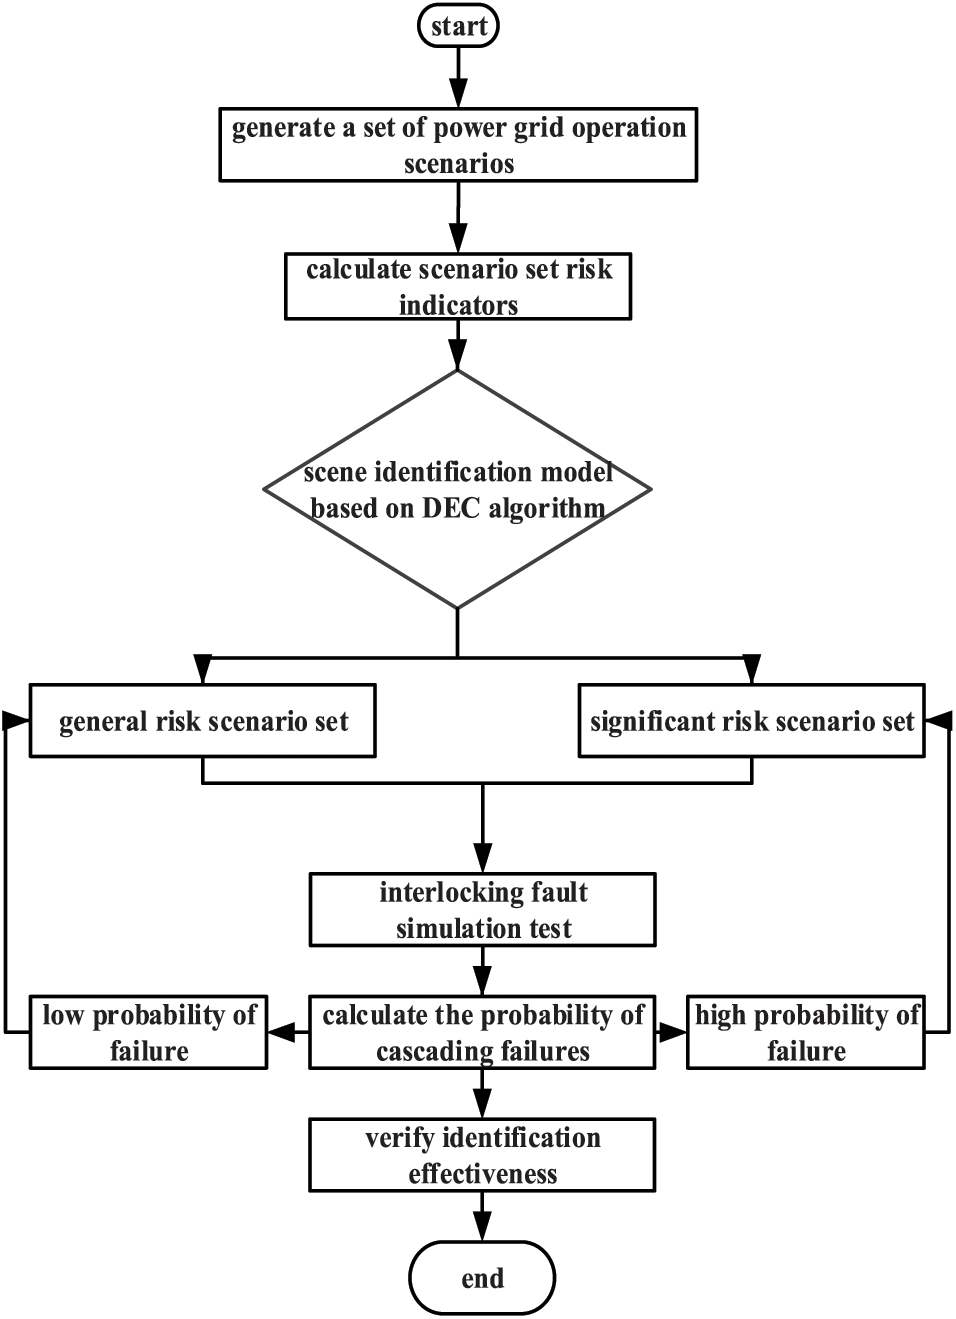
Figure 3: Risk scenario identification flowchart
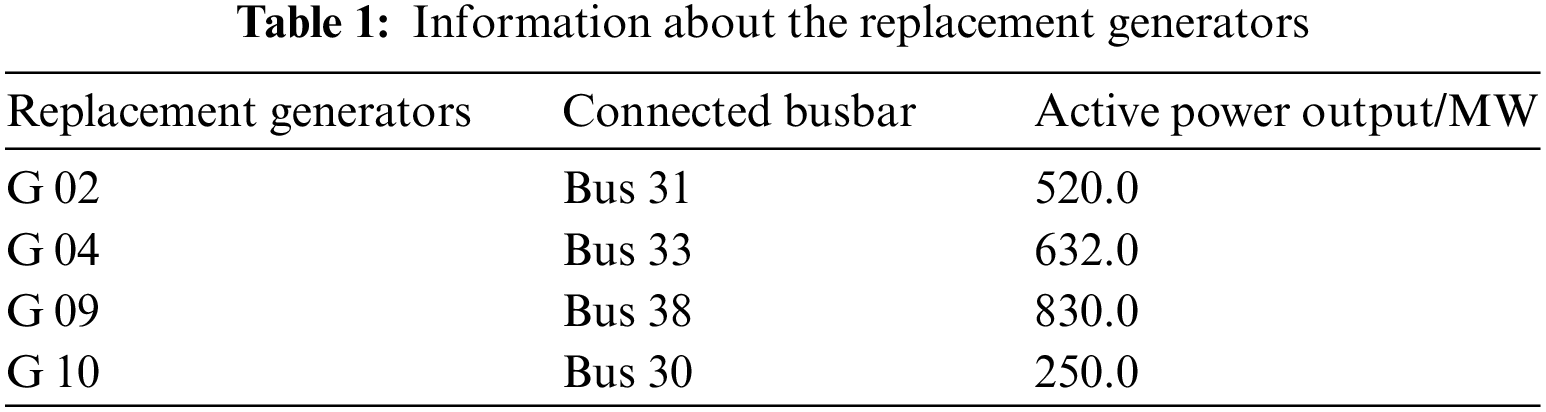
In this paper, the IEEE39-node system is used as an example, and four of the generators are changed into wind turbines, which are transformed into a new energy grid, as shown in Fig. 4. The synchronous generators G 10, G 02, G 04, G 09 connected to nodes 30, 31, 33, 38 are turned into wind farms with the same output and a new energy grid model with a new energy power grid connection ratio of 43.27% is obtained. The power output and the connected busbars of the replacement generators are shown in Table 1. The DEC algorithm is written in the Python language, and parameters such as unit output and load size are randomly assigned to obtain the scene sample set. The simulation is verified using Powerfactory/DIgSILENT simulation software.
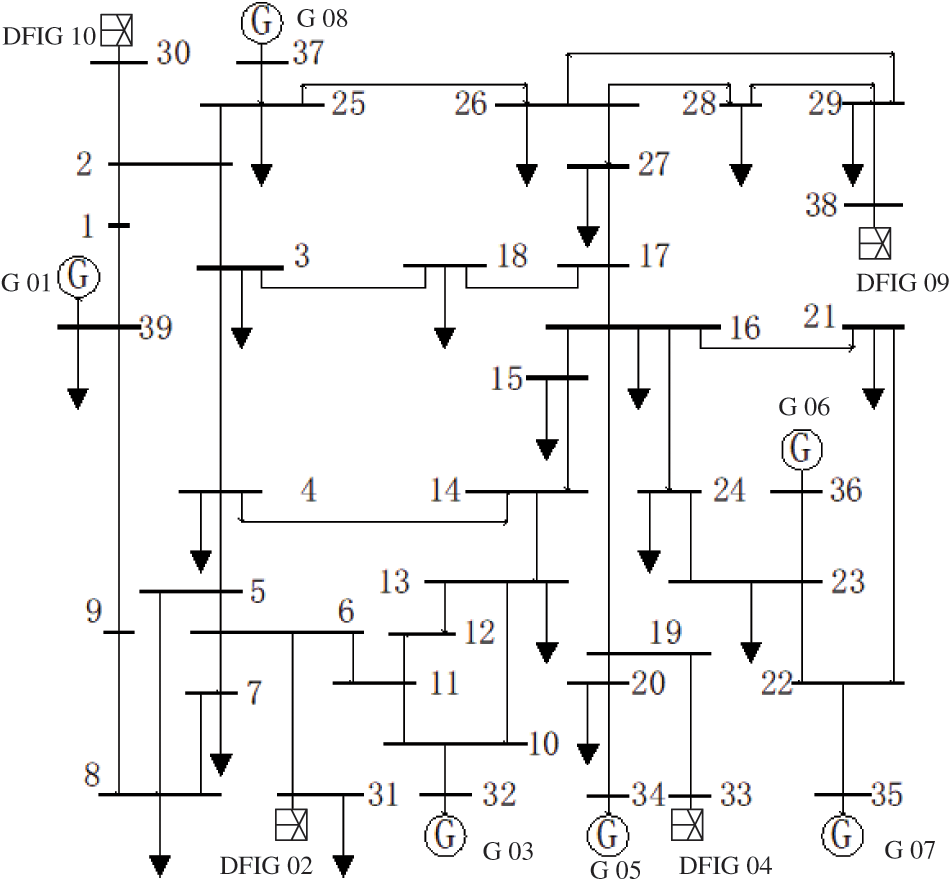
Figure 4: IEEE39-node new energy grid wiring diagram
In the simulation software, this paper randomly sets the initial fault N−2 within the model. Based on the line overload situation, the next trip line is set, and the line outage probability is as follows:
Taking
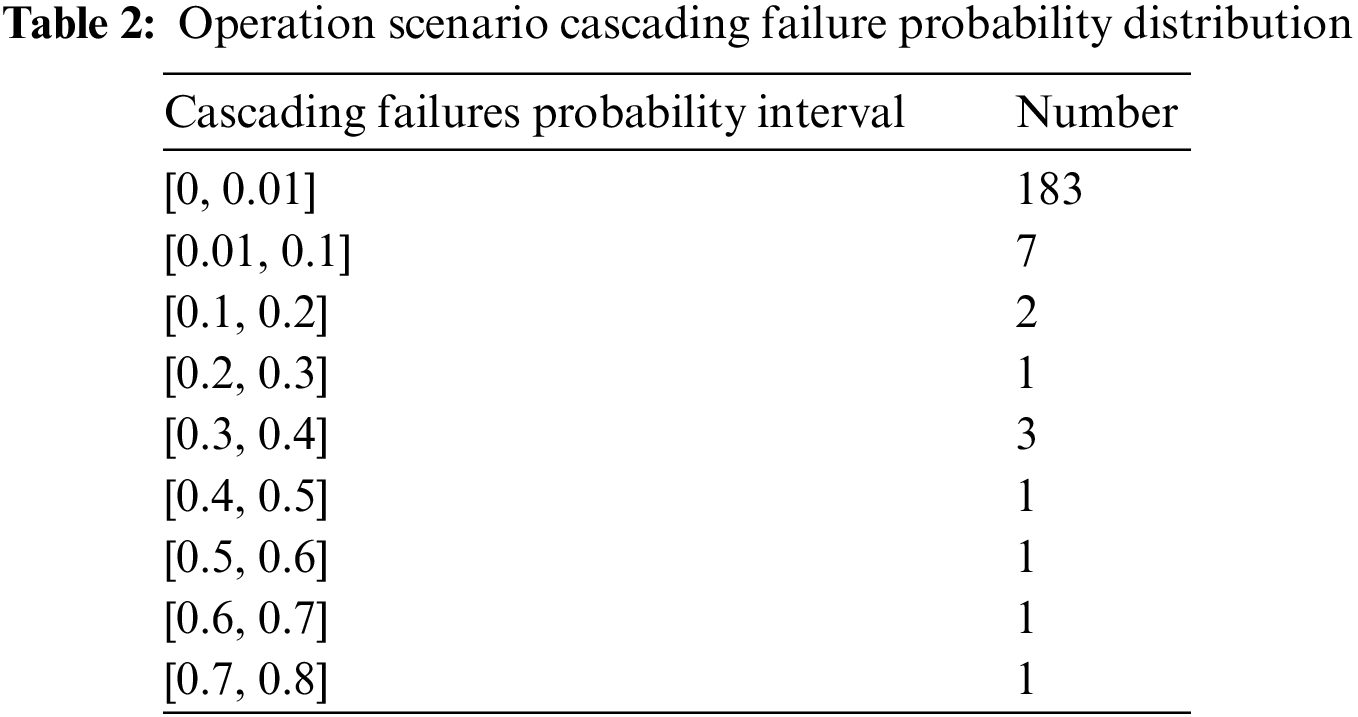
In this paper, a total of 200 operation scenarios are constructed, the risk indicators of all scenarios are calculated, the scenarios are clustered based on the risk indicators, and the cascading failure probabilities of the scenarios are output after 1000 random cascading failure simulations. The specific probability distribution is shown in Table 2.
Based on the DEC algorithm, we set the number of clusters to 2 and output the significant scenario set of the model, whose specific information is shown in Table 2.
As seen from Table 3, the size of the risk indicators does not correspond exactly to the size of the cascading failure probability, and clustering can identify some of the missed high-risk scenarios. Fig. 5 shows the cascading failure probability distribution of the significant risk scenario set and the general risk scenarios, where the vertical coordinate is the cascading failure probability on a logarithmic scale and the horizontal coordinate is the scenario number. The probability of cascading failure is higher in the significant risk scenario set than in the general scenarios. All scenarios with cascading failure probabilities higher than 0.1 are identified, and overall, the model has a good recognition effect.
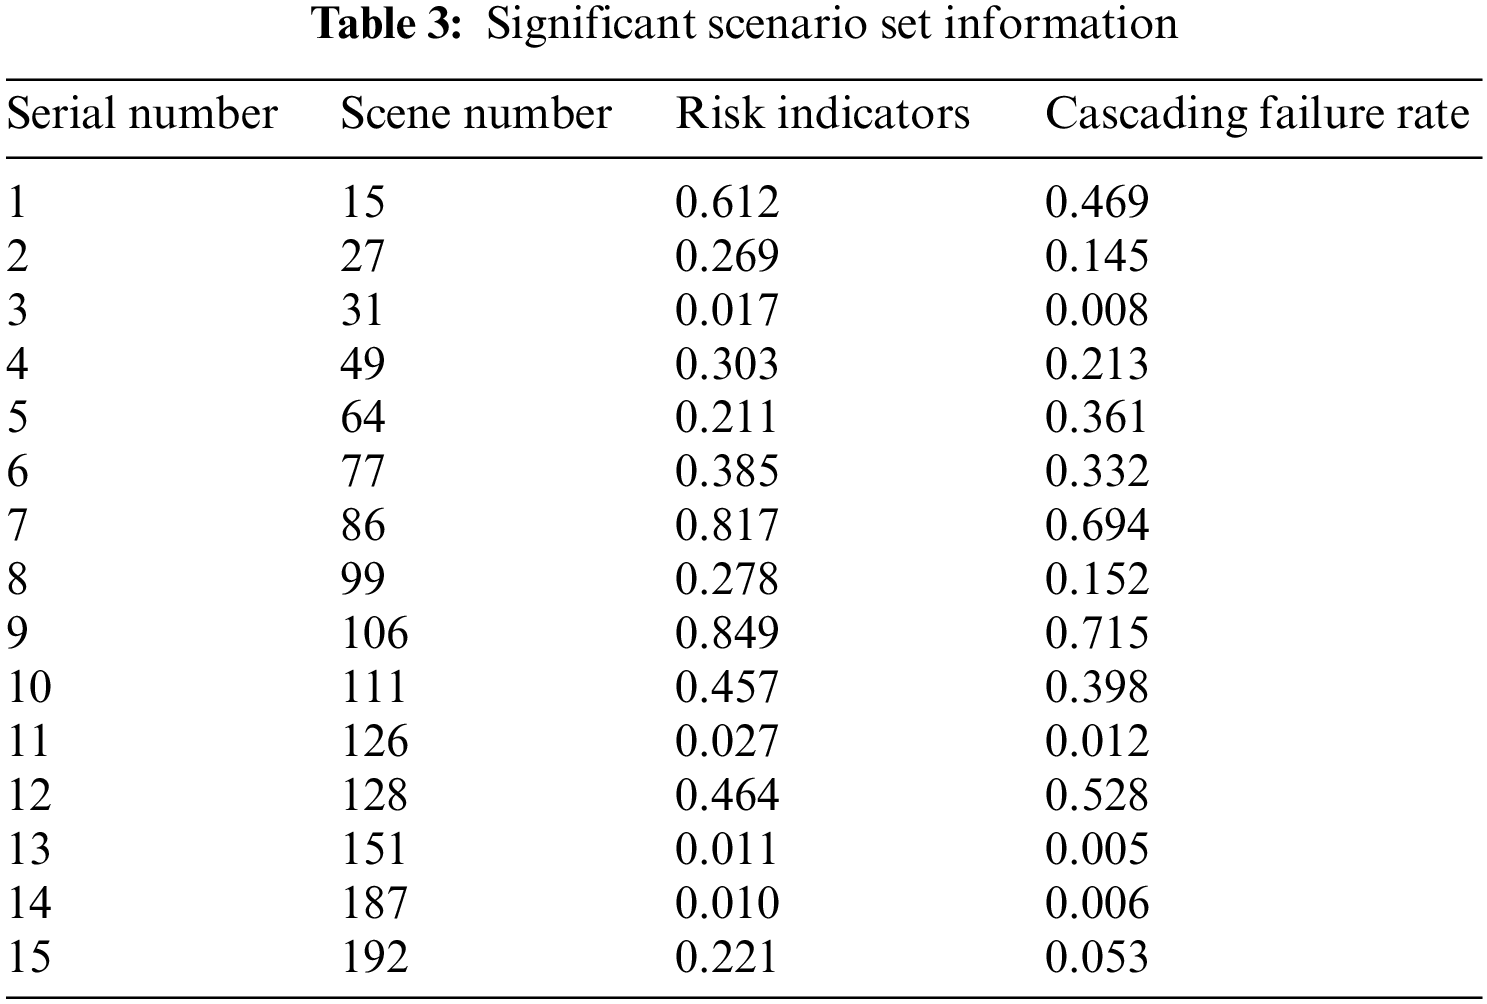
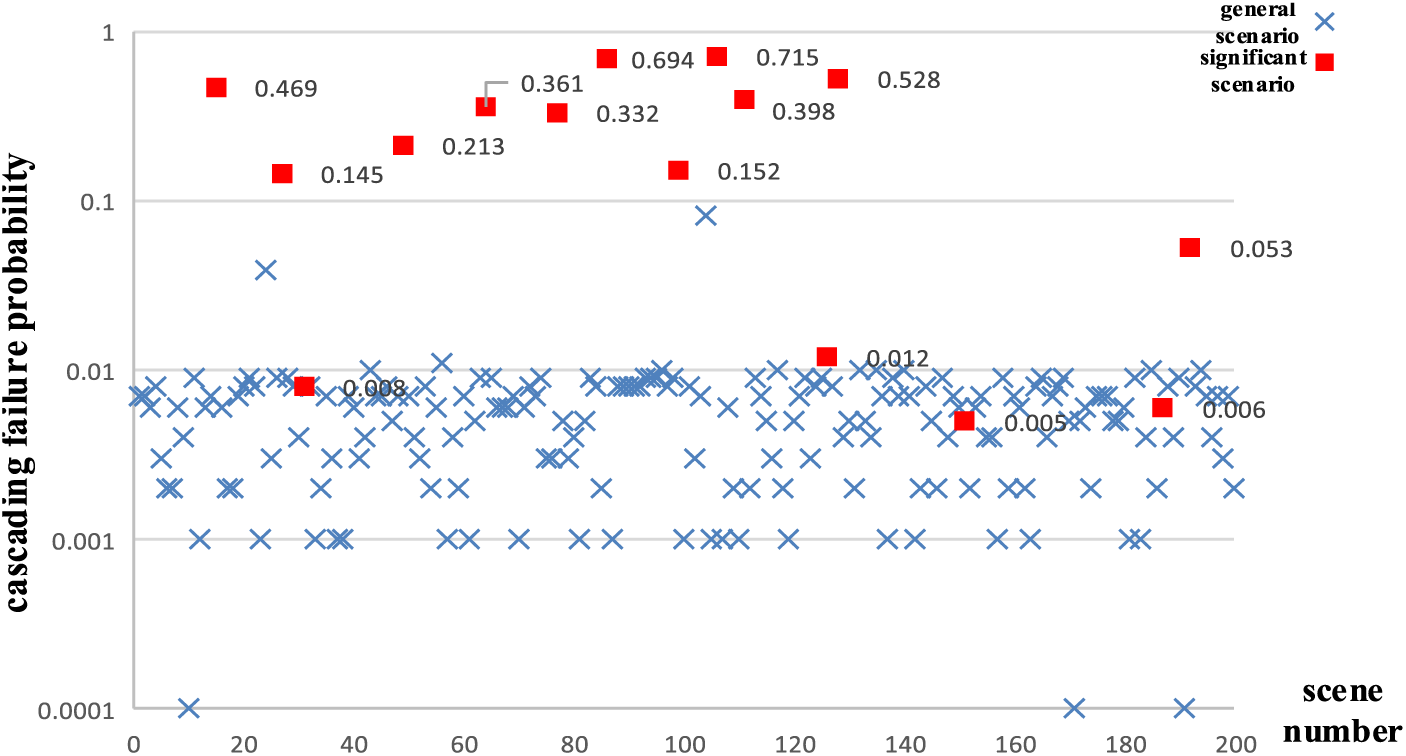
Figure 5: Probability of failure in general and significant risk scenarios
Fig. 6 shows the change in the accuracy rate and loss during the model training process, and it can be seen that as the number of training rounds increases, the loss value keeps decreasing, the accuracy rate gradually increases, and the recognition effect becomes better.
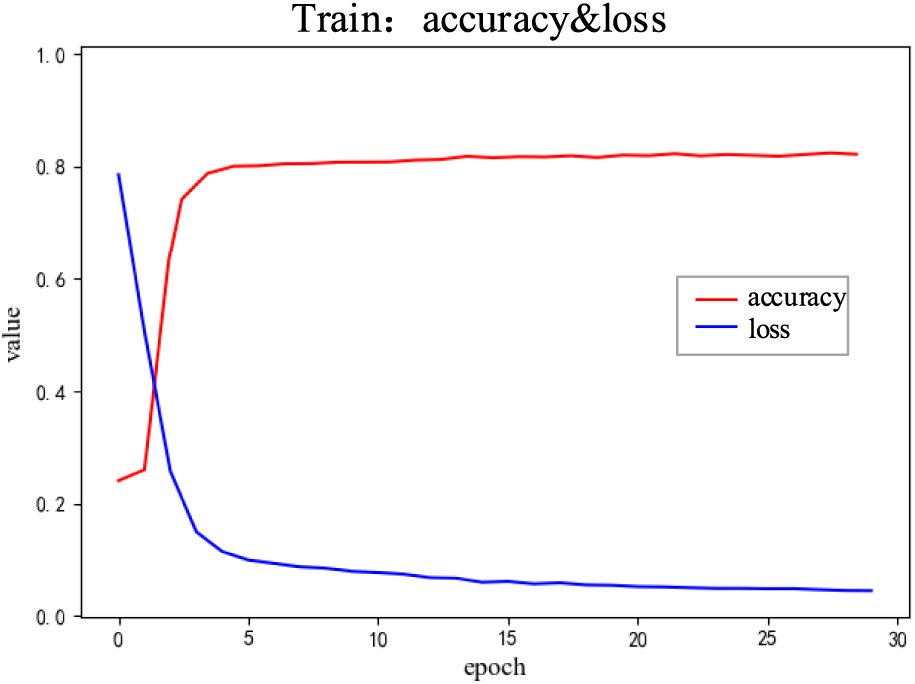
Figure 6: Accuracy and loss value changes during model training
As seen from Table 4 and Fig. 7, the DEC algorithm works better than the traditional K-means clustering algorithm, and the NMI values and accuracy rates of the DEC algorithm are significantly better. The DEC algorithm to cluster high-risk scenes more efficiently identifies high-risk scenes.
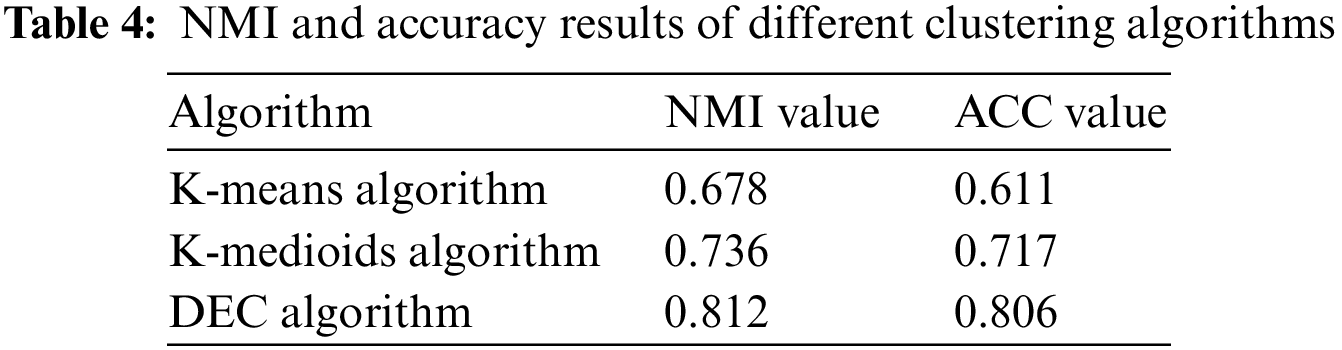
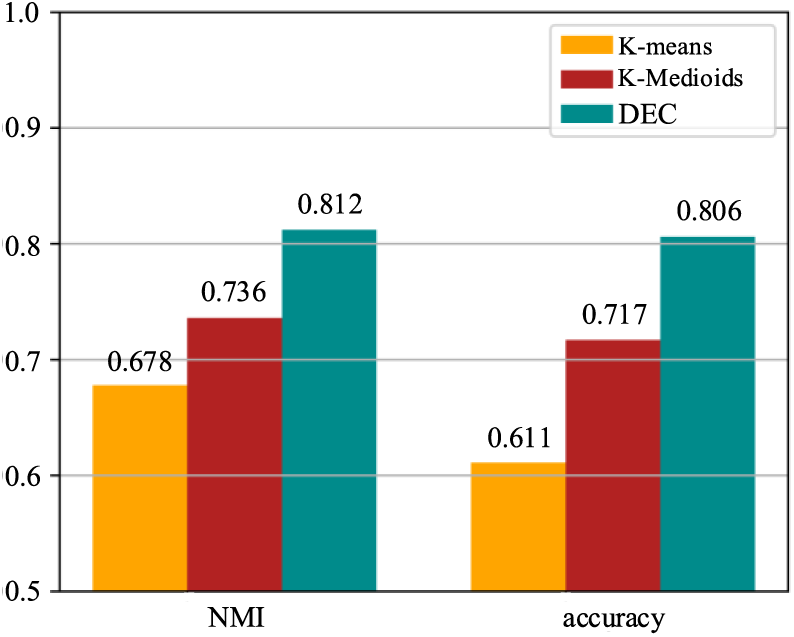
Figure 7: NMI and accuracy results of different clustering algorithms
This paper proposes a method for identifying scenarios with a high risk of cascading failures in new energy grids based on a DEC algorithm. A comprehensive risk indicator combining power flow entropy and voltage deviation entropy is established, and a clustering algorithm is employed to assess the cascading failure risk in different operating scenarios of the new energy grids. The encoder-decoder automatic coding is used for pretraining, and the Kullback-Leibler (KL) divergence is applied to fine-tune the encoder network parameters of the model. The scenario set is clustered and analyzed by this model, and the scenarios with the highest output index are defined to be the significant risk scenario set. The effectiveness of this method is verified by simulating scenarios in the improved IEEE39-node new energy grid.
The proposed method in this study effectively identifies cascading failure risk scenarios in the new energy grids and demonstrates higher evaluation metrics compared to other traditional clustering algorithms. However, the model training time is relatively long. In future research, different variations of autoencoders will be explored for their application in the DEC algorithm, aiming to improve the training speed and achieve better evaluation results.
Acknowledgement: The authors acknowledge the support of State Grid Shanxi Electric Power Company.
Funding Statement: This research was funded by the State Grid Limited Science and Technology Project of China, Grant Number SGSXDK00DJJS2200144.
Author Contributions: The authors confirm contribution to the paper as follows: study conception and design: Xueting Cheng, Ziqi Zhang, Yueshuang Bao; data collection: Xueting Cheng, Ziqi Zhang, Yueshuang Bao; analysis and interpretation of results: Xueting Cheng, Ziqi Zhang, Yueshuang Bao, Huiping Zheng; draft manuscript preparation: Xueting Cheng, Ziqi Zhang. All authors reviewed the results and approved the final version of the manuscript.
Availability of Data and Materials: Data supporting this study are included within the article.
Conflicts of Interest: The authors declare that they have no conflicts of interest to report regarding the present study.
References
1. Shi, L., Shi, Z., Yao, L., Ni, Y., Bazargan, M. (2010). A review of mechanism of large cascading failure blackouts of modern power system. Power Grid Technology, 34(3), 48–54. [Google Scholar]
2. Guo, X., Liu, Z., Feng, B., Jiang, B., Guo, J. et al. (2022). Research status and prospect of new-type power system risk assessment. High Voltage Technology, 48(9), 3394–3404. [Google Scholar]
3. Ma, Y., Luo, Z., Zhao, S., Wang, Z., Xie, J. et al. (2022). Risk assessment of a power system containing wind power and photovoltaic based on improved Monte Carlo mixed sampling. Power System Protection and Control, 50(9), 75–83. [Google Scholar]
4. Zhang, X., Zhong, Y., Mei, S., Xia, D., Wang, S. et al. (2016). Blackout risk analysis of power system integrated with DFIG wind farm. Advanced Technology of Electrical Engineering and Energy, 35(7), 1–7. [Google Scholar]
5. Xu, D., Wang, H. (2019). High risk cascading outage assessment in power systems with large-scale wind power based on stochastic power flow and value at risk. Power System Technology, 43(2), 400–409. [Google Scholar]
6. Deng, H., Zeng, F., Zhang, X., Zheng, Y., Li, P. et al. (2023). A multi-objective prevention strategy for grid cascading failurebased on vulnerable lines screening. Electric Power Engineering Technology, 42(2), 223–231. [Google Scholar]
7. Zhu, Y., Liu, Y. (2023). Fast screening of high-risk cascading failure considering uncertainties of source and load. Automation of Electric Power Systems, 47(5), 92–103. [Google Scholar]
8. Zhu, Z., Yuan, W., Wu, B., Yang, X., Chen, G. (2023). Method for filling missing data in power grid based on historical data mining auxiliary scenario analysis. Power System & Automation, 45(1), 72–74. [Google Scholar]
9. Li, Q., Zhang, N., Gao, S., Liu, J., Zhou, Q. (2021). Modeling and application scenario analysis of power phase shift transformer based on RTDS. Electric Power Engineering Technology, 40(2), 53–58. [Google Scholar]
10. Jiang, H., Sun, S. (2020). Comparison and scenario analysis of micro-grid grid-connected and off-grid control methods. Electrotechnics Electric, 11, 23–27. [Google Scholar]
11. Ma, Q. (2019). Capacity planning study of optical storage microgrid based on multi-scenario analysis (M.A. Thesis). Kunming University of Science and Technology, China. [Google Scholar]
12. Zhou, Z., Shi, L. (2021). Risk assessment of power system cascading failure considering wind power uncertainty and system frequency modulation. Proceedings of the CSEE, 41(10), 3305–3316. [Google Scholar]
13. Cui, X., Wu, J., Lei, M., Zhang, J., Xu, J. et al. (2021). Discussion on inducement and fault chain search technology of cascading failure in power system with high penetration of renewable energy. Electric Power Automation Equipment, 41(7), 135–143. [Google Scholar]
14. Meng, F., Guo, Q., Kang, H., Zhang, M., Wang, L. et al. (2022). Cascading failure simulation for power system with utility-scale and distributed renewable energy. High Voltage Engineering, 48(1), 189–198. [Google Scholar]
15. Zhou, K., Zhang, F. (2015). Research on differentiated lightning protection renovation sequence of transmission lines based on power flow entropy. Electric Power Science and Engineering, 31(11), 35–39. [Google Scholar]
16. Bengio, Y., Courville, A., Vincent, P. (2013). Representation learning: A review and new perspectives. IEEE Transactions on Pattern Analysis and Machine Intelligence, 35(8), 1798–1828. [Google Scholar] [PubMed]
17. Xie, J., Girshick, R., Farhadi, A. (2016). Unsupervised deep embedding for clustering analysis. Proceedings of the 33rd International Conference on Machine Learning, pp. 478–487. New York, USA. [Google Scholar]
18. Tao, W., Qian, Y., Zhang, Y., Ma, H., Leng, H. et al. (2022). Survey of deep clustering algorithm based on autoencoder. Computer Engineering and Applications, 58(18), 16–25. [Google Scholar]
Cite This Article
 Copyright © 2023 The Author(s). Published by Tech Science Press.
This work is licensed under a Creative Commons Attribution 4.0 International License , which permits unrestricted use, distribution, and reproduction in any medium, provided the original work is properly cited.
 Downloads
 Citation Tools