
 Submit a Paper
 Propose a Special lssue
 Open Access
ARTICLE

Analysis of Capacity Decay, Impedance, and Heat Generation of Lithium-ion Batteries Experiencing Multiple Simultaneous Abuse Conditions
School of Aeronautics and Astronautics, Purdue University, West Lafayette, 47907, USA
* Corresponding Author: Vikas Tomar. Email:
Energy Engineering 2023, 120(12), 2721-2740. https://doi.org/10.32604/ee.2023.043219
Received 26 June 2023; Accepted 14 September 2023; Issue published 29 November 2023
 View Full Text
 Download PDF
Abstract
Abuse of Lithium-ion batteries, both physical and electrochemical, can lead to significantly reduced operational capabilities. In some instances, abuse can cause catastrophic failure, including thermal runaway, combustion, and explosion. Many different test standards that include abuse conditions have been developed, but these generally consider only one condition at a time and only provide go/no-go criteria. In this work, different types of cell abuse are implemented concurrently to determine the extent to which simultaneous abuse conditions aggravate cell degradation and failure. Vibrational loading is chosen to be the consistent type of physical abuse, and the first group of cells is cycled at different vibrational frequencies. The next group of cells is cycled at the same frequencies, with multiple charge pulses occurring during each discharge. The final group of cells is cycled at the same frequencies, with a partial nail puncture occurring near the beginning of cycling. The results show that abusing cells with vibrational loading or vibrational loading with current pulses does not cause a significant decrease in operational capabilities while abusing cells with vibrational loading and a nail puncture drastically reduces operational capabilities. The cells with vibration only experience an increase in internal resistance by a factor of 1.09–1.26, the cells with vibration and current pulses experience an increase in internal resistance by a factor of 1.16–1.23, and all cells from each group reach their rated lifetime of 500 cycles without reaching their end-of-life capacity. However, the cells with vibration and nail puncture experience an increase in internal resistance by a factor of 6.83–22.1, and each cell reaches its end-of-life capacity within 50 cycles. Overall, the results show that testing multiple abuse conditions simultaneously provides a better representation of the extreme limitations of cell operation and should be considered for inclusion in reference test standards.Keywords
Li-ion batteries (LIBs) have seen increased usage in many applications recently, including electric vehicles (EVs), portable power banks, aircraft, and other systems. This makes the in-service dynamic vibration load a concern for the performance and safety of LIBs. Other concerns include both electrochemical stresses and physical abuse, such as intermittent current pulses and damage from impacts or punctures. These issues have long been known, and different types of abuse tests have been included in numerous LIB safety testing standards: the United Nations [1], Naval Sea Systems Command [2], SAE International [3], and Sandia National Laboratory [4] have all developed testing procedures and standards for Li-ion batteries. However, most of these safety tests only utilize go/no-go criteria that do not fully represent the possible damage caused by in-service abuse, and most research only focuses on one test condition at a time.
Many recent studies have been performed that utilize these testing standards to determine how physical and electrical abuse affects the operation of LIBs. Brand et al. investigated the damage of LIB electrodes caused by shock and vibration, and analyzed the influence on the battery capacity [5]. However, the dynamic load was only applied for a short time before operation according to the UN 38.3 standard, and no vibration was applied during the cycling of the cells. Li et al. [6] analyzed the degradation of capacity in cells subjected to vibration in six degrees of freedom to simulate operation in a UAV, but did not incorporate any other physical abuse. Savoye et al. [7] investigated how periodic pulses are detrimental to cell operation compared to cells cycled with constant currents, but did not combine these electrochemical stresses with any physical abuse. Our previous work has examined the operational and physicochemical effects on cells during continued operation after partial nail punctures alone [8,9]. In another of our previous works, the performance and heat generation of LIBs cycled under continuous vibration were analyzed using a sensor network [10]. While it was found that vibration testing does not cause an abrupt decrease in LIB capacity, there is no comparison with the capacity of cells cycled under static conditions.
Batteries that are utilized in commercial operations often experience multiple types of abuse either concurrently or sequentially. Few studies can be found that investigate the effects of more than one type of abuse, where it is expected that the detrimental effects on cell operation would be compounded when multiple types of abuse occur. To determine the extent of these effects, studies must be conducted that combine different types of abuse that are possible during LIB operation. This work utilizes a combination of vibration, current pulses, and partial nail punctures to reproduce hazardous conditions that could be experienced by LIBs during operation and analyze the effectiveness of the existing go/no-go test criteria currently in use.
To address these concerns, the performance of LIBs cycled under different in-service vibration loads is observed. Further tests are then performed combining vibrational loads with current pulses, as well as tests combining vibrational loads with partial nail punctures. The lifetime operation and final condition of the cells are analyzed using DC resistance measurements, electrochemical impedance spectroscopy (EIS) tests, and incremental capacity analysis (ICA), and the heat generation of the cells is analyzed using a relationship between capacity and temperature change determined in our previous work [10]. The results of the analyses investigate how physical and electrochemical abuse affect the operation of the cells, and whether multiple types of simultaneous abuse exacerbate the negative effects seen during LIB operation.
This study shows how multiple simultaneous abuse conditions affect the capacity, impedance, and operational temperature of commercially available prismatic LIBs. It is found that vibration has little detrimental effect on impedance, capacity fade, or heat generation, while combining vibration with current pulses causes a slight overall increase in impedance with little observable effect on capacity fade and heat generation. Cells that experience both vibration and nail puncture, however, show considerable increases in both impedance and capacity fade correlated with higher vibrational frequencies. Overall, the results of the testing show that combining multiple types of physical abuse can compound the detrimental effects of each individual form of abuse, and significant physical damage greatly reduces the operability of LIBs.
2 Experimental and Analysis Methods
2.1 Equipment Setup and Experimental Procedures
This study uses commercial Li-ion prismatic cells (from AA Portable Power Corp.) with LiCoO2 (LCO) cathodes and graphite anodes to analyze their aging and performance degradation under different dynamic loading and abuse conditions. Cells with LCO cathodes were used since they were the most widely available for the cell size and form factor at the time the study was performed. Performing these tests on cells with different cathode chemistries (NMC, NCA, LFP, etc.) would be expected to yield similar results with varying severity. The cells have a lab-rated capacity of ~135 mAh, which is determined by cycling the cells at the manufacturer-rated current of 170 mA for a standard charge/discharge cycle between 3.0 and 4.2 V. The cells are cycled using an 8-channel battery analyzer (also from AA Portable Power Corp.), and vibrational loading is applied using a K2007E01 SmartShaker (from The Modal Shop). The sine wave input to the vibration equipment is provided by a 5 MHz function generator (from BK Precision). To secure the cells to the vibration equipment and mount resistance temperature detectors (RTDs) to the cells for recording surface temperatures, cell holders are constructed using additive manufacturing. Temperatures and cycling profiles are recorded and processed to understand the contribution of vibration to aging, heat generation, and performance degradation. Table 1 shows the relevant specifications of the cells provided by the manufacturer.
To perform the nail puncture portion of the tests, a cell is placed in a holder which is then secured in a drop hammer test rig with a steel nail attached to the hammer. The cell completes its first full charge/discharge cycle and the charge portion of the second cycle. At the very beginning of the discharge portion of the second cycle, the drop hammer is released and the nail punctures the cell halfway through, causing moderate physical damage to the electrodes and exposing the internal components of the cell to the atmosphere. The puncture causes a momentary short-circuit and a larger-than-normal drop in voltage, and the hammer is lifted immediately after the puncture to remove the nail from the cell. The holder with the cell is then removed from the drop hammer test rig and attached to a shaker, and vibrational loading is commenced. The cell is continuously cycled throughout the nail puncture and transferred to the shaker. The nail puncture is only performed once on each cell at the beginning of cycling, while vibrational loading is applied throughout testing.
The LIBs are divided into three groups of three cells each and cycled with different dynamic abuse conditions until reaching their manufacturer-rated end-of-life (EOL) of 500 cycles. One group of cells experiences vibration only; another group of cells experiences vibration and intermittent current pulses of 1.5 times the maximum discharge current (510 mA) occurring for two seconds during the discharge cycle at 25%, 50%, and 75% depth of discharge; and the last group of cells experiences vibration and a partial nail puncture at the end of the second charge cycle when the cells are fully charged. Table 2 shows the different groups of cells and their specific abuse conditions, cycling current, and voltage range.
In this work, continuous vibration is selected as the consistent dynamic input to the LIBs under test, as many test standards identify vibration as a potential cause of LIB durability failure that can result in both a loss of electrical continuity and structural failure [11,12]. The vibration profiles for LIB testing are selected based on the UN 38.3 Recommendations on the Transport of Dangerous Goods, Manual of Tests, and Criteria [1]. This reference has been widely adopted in both industry and academia for LIB safety examination, and there are numerous studies employing the UN 38.3 standard for the characterization of LIB performance under vibration, including studies that employ differing ambient temperatures [13] or use battery management system control strategies [14].
To better understand how multiple abuse conditions occurring simultaneously affect the aging and performance degradation of LIBs, one static cell and two cells with vibration profiles specified in UN 38.3 standard are cycled for each group of cells. The conditions listed in the reference cover parts of the acceleration range of 1–8 g specified for testing individual cells and small batteries, equating to 18 and 50 Hz for 1 and 8 g acceleration, respectively. For this testing the vibration frequencies used are static (0 Hz) corresponding to 0 g, 18 Hz corresponding to 1 g, and 36 Hz corresponding to 4 g. The highest frequency of 50 Hz corresponding to 8 g is not used as the vibration equipment implemented in this testing is not capable of maintaining this frequency for an extended period of time without causing extensive damage. Another modification made is that the vibration is applied to the LIBs continuously until reaching their manufacturer-rated EOL, as opposed to a frequency sweep occurring for only 3 h as required in the reference. This is because LIBs in the field typically undergo vibration throughout their entire service life [15], and the significantly time-compressed tests normally used do not fully represent the dynamic conditions LIBs experience in the field [12]. The vibration frequency is also applied only in the direction normal to the electrodes as opposed to each of three mutually perpendicular directions, as changing the cell orientation during cycling during testing is impractical and not always common in normal applications.
Each cell is cycled with the manufacturer-specified standard cycling current of 170 mA. To provide more information on the development of LIB aging, the internal resistance (IR) of all LIBs is analyzed using a current pulse method every 100 cycles. The pulses used for IR measurements have the same current magnitude of 170 mA and are applied in the discharge direction at 4.2 V following a rest period after a full charge [16,17]. This process continues until it reaches the manufacturer-rated EOL. At the end of cycling, EIS tests are performed to observe and analyze the change in the impedances of the cells.
2.2 Internal Resistance and Electrochemical Impedance Spectroscopy Analysis
One of the most common approaches to evaluating cell impedance is through EIS measurements. However, these tests can often be very time-consuming when performed at intervals throughout the entire cycling process, especially if they are performed over multiple states of charge (SOC). Because of this, IR is obtained using a current pulse method to record the change in voltage and find the resistance of a cell [18]. To ensure consistency across the measurements, each of the IR tests is performed when a cell is at 100% SOC [19]. The resistance is calculated using the voltage change at the beginning of the current pulse to exclude the impedance contributions of polarization caused by charging.
The EIS tests conducted after the completion of cycling are performed using a Gamry Interface 5000E Potentiostat/Galvanostat/ZRA. After 500 cycles, the EIS tests are performed at 20%, 40%, 60%, 80%, and 100% SOC for the cells experiencing only vibration and the cells experiencing vibrations and current pulses. The cells experiencing vibrations and nail punctures are not able to hold a charge at the end of cycling, so only one EIS test is performed for each of these cells at the voltage the cells stabilize to after completing cycling. Fig. 1A shows a representation of the impedance spectra from an EIS test.
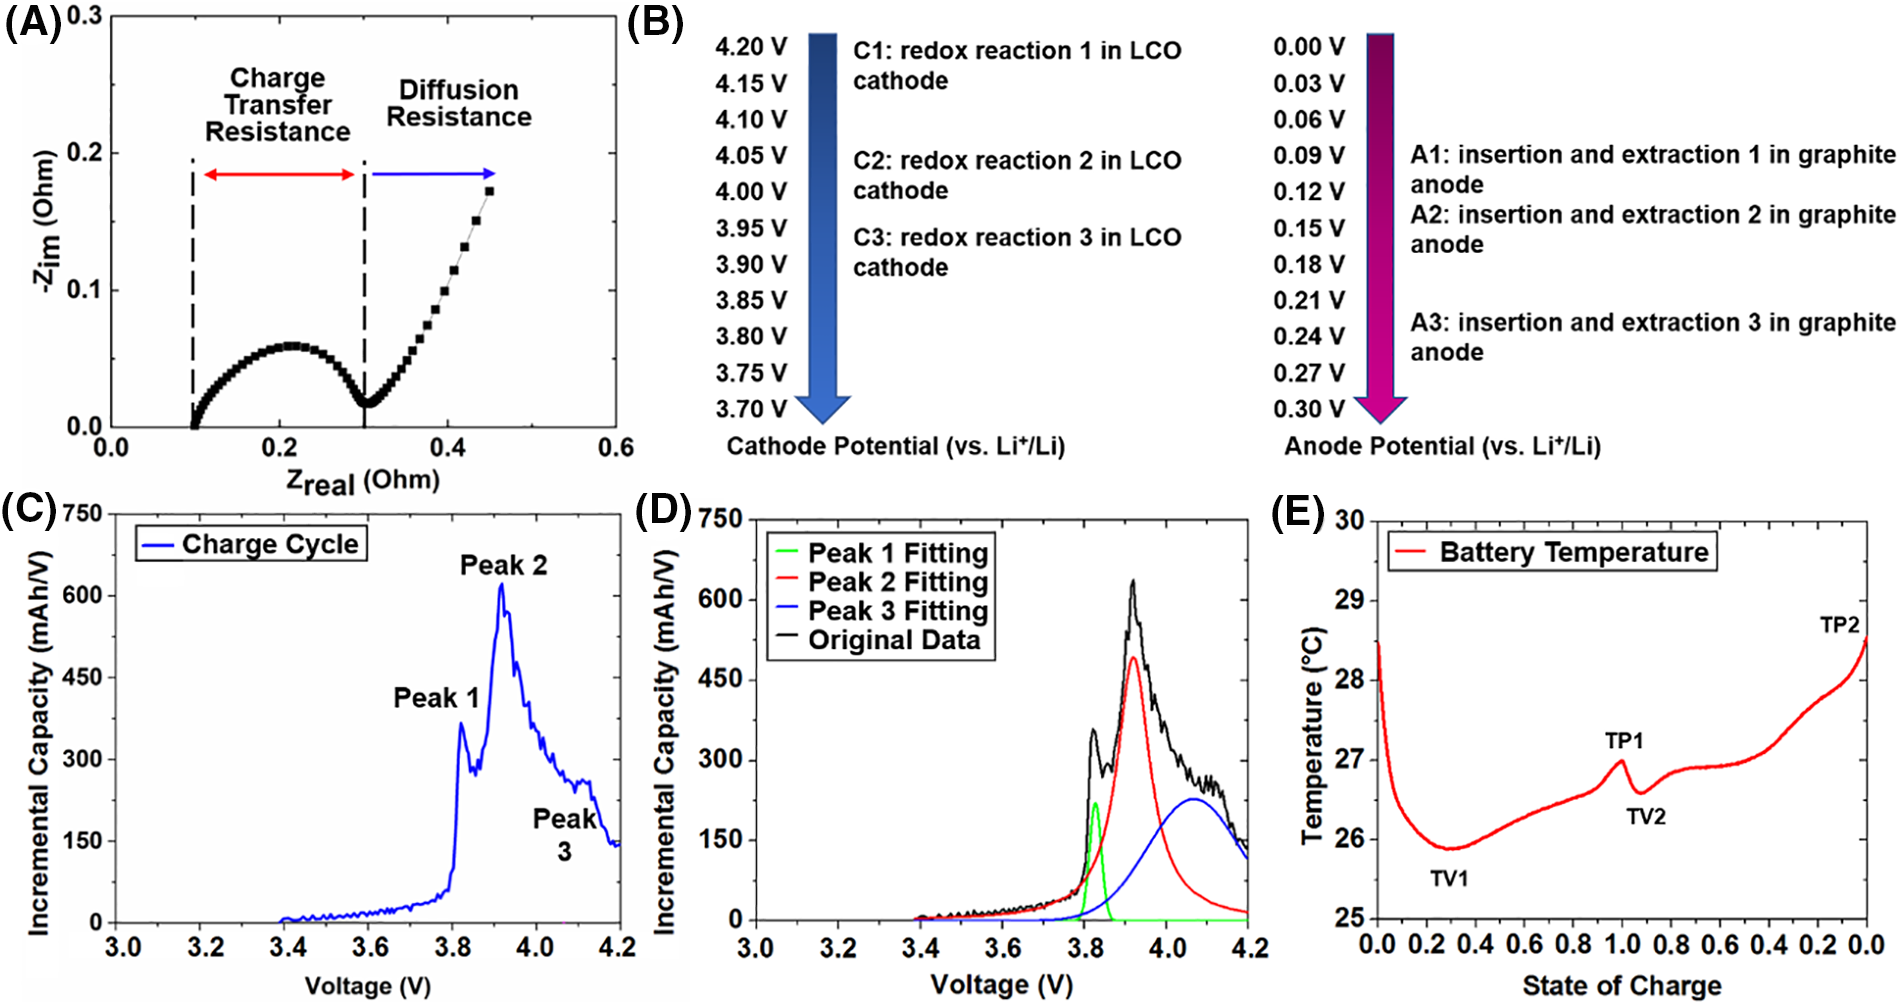
Figure 1: (A) Representative plot of impedance spectra from EIS test; (B) potential position of the redox reactions of the LCO cathode and graphite anode (potential data from [27]); (C) representative plot of incremental capacity-voltage relation; (D) peak fitting of the incremental capacity curve; and (E) representative battery temperature profile for one full charge/discharge cycle
2.3 Incremental Capacity Analysis
Incremental capacity (
where
By implementing the values of IC determined over the cycling process, IC-V curves can be used to investigate the degradation on the cell electrodes. The peaks of the IC-V curves represent the process of phase transition and surface film formation. It should be noted that although the IC-V curves are commonly obtained by cycling LIBs at low rates (generally ~ C/25), LIB operations under an approximate equilibrium state are rarely observed in practice [21]. For LIBs operating in the field, such as those in EVs, their cycling tends to be relatively dynamic [22]. It is also difficult to accurately calculate the discharge IC curves for the cells experiencing current pulses during their discharge cycles, as the discharge cycle is not continuous. Therefore, the IC-V curves investigated in this study are obtained from the charging process only.
Three major peaks can be observed in the IC-V charge curves as shown in Fig. 1C, which have been recognized in previous studies [23,24]. The magnitude and corresponding voltage of peak 1, peak 2, and peak 3 in the IC-V curves are determined through peak fitting as shown in Fig. 1D. Both the magnitude of the peaks and the voltage corresponding to the location of the peaks can be used to determine the type and extent of cell degradation over a lifetime by observing their shift in position [25,26]. Peak 2 is fit using a pseudo-Voigt function, while peaks 1 and 3 are fit using a Gaussian function [23]. This is because peaks 1 and 3 are sometimes difficult to distinguish using a pseudo-Voigt function, so a straight Gaussian function is used. The same fitting method is used on the data from all cells under test to maintain consistent IC peak readings.
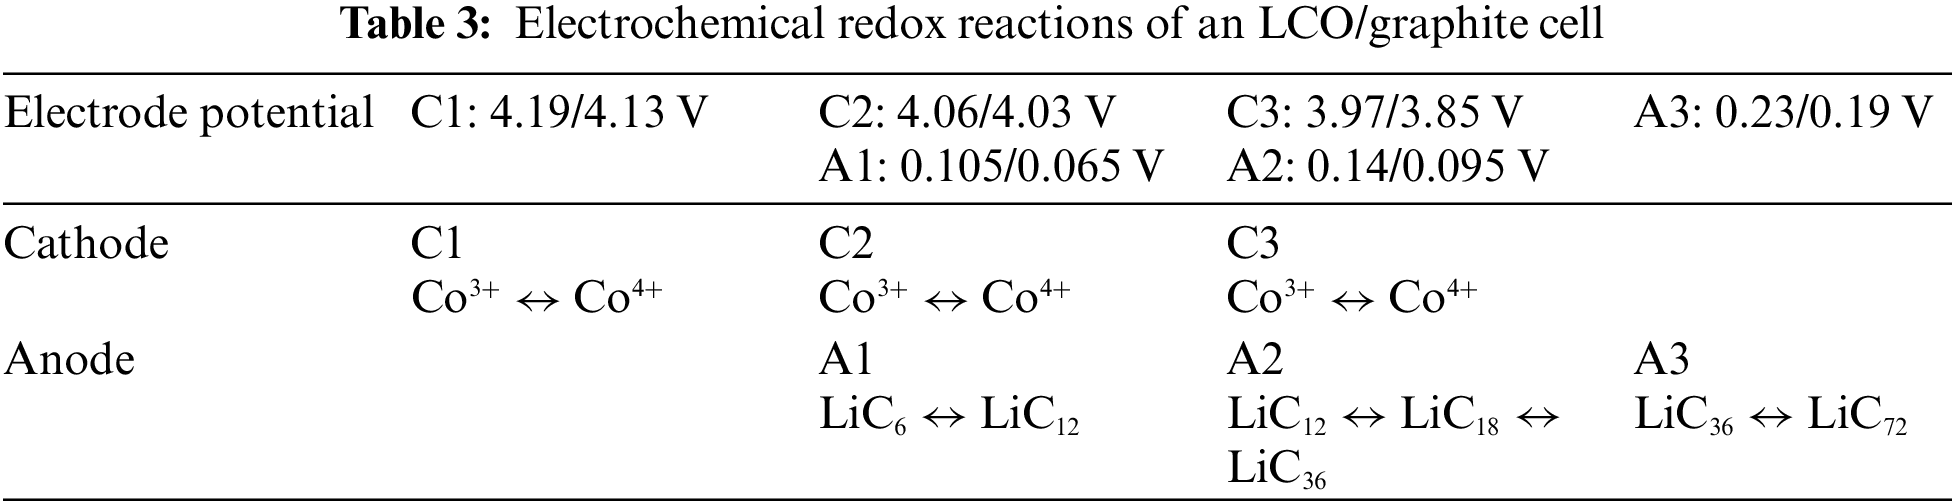
A summary of the potential positions of the redox reactions is provided in Fig. 1B: the LCO electrode has two weak redox reactions at 4.19/4.13 and 4.06/4.03 V vs. Li+/Li. There are strong oxidation/reduction peaks at 3.97/3.85 V vs. Li+/Li associated with the Co3+/Co4+ couple. The graphite anode presents three significant voltage plateaus located at 0.105/0.065, 0.14/0.095, and 0.23/0.19 V vs. Li+/Li, which are related to the Li+ ion insertion and extraction [27]. Therefore, peak 1 can be related to reaction A3, peak 2 can be related to reactions C3 and A2, and peak 3 can be related to reactions C2 and A1 as shown in Fig. 1C. Table 3 shows a representation of the electrochemical redox reactions associated with the peaks [28,29].
The origins of the three peaks can be described as follows: peak 1 comes from the lithiation and delithiation of the positive electrode active material (PEAM), and reflects information on the charge transfer process [27,30]. Peak 2 mainly comes from the phase transformation of the PEAM. Since the negative electrode active material (NEAM) is expected to reside in a potential plateau from the phase I to phase II transition of the PEAM, peak 2 should remain at about the same potential and magnitude [23]. Peak 2 is related to the primary phase transformation in the PEAM [24], and its intensity can be used as an indicator for the loss of active material (LAM) of a cell. Peak 3 relates to the solid solution formation [23,24]. It should be noted that the solid solution regime does not terminate at the end of charge (4.2 V), which can be reflected by the incomplete peak from the fitting of peak 3 shown in Fig. 1D.
2.4 Temperature Profile Analysis
A general energy balance in LIBs can be described with Eq. (2) [31]:
where
The peak and valley in battery temperature during the charge cycle are referred to as TP1 and TV1, and the peak and valley in battery temperature during the discharge cycle are referred to as TP2 and TV2. Since the temperature change of the cells under test is normally limited, TV1 and TV2 are close to room temperature at the end of the endothermic processes. Thus, the values of TP1 and TP2 can be assumed to be determined by the exothermic processes only. The effective entropic potential has the highest rate of change when approaching SOC = 0 and SOC = 1, which correspond to the times when the LIBs approach the lower and higher cut-off voltages. Our previous work has shown that a curve can be fit to show the relationship between the capacity of a cell and the total increase in temperature over cycling (difference between TV1 and TP2), which is explained in more detail later.
3.1 Internal Resistance and EIS
To observe the effects of different types of abuse on the cells, a current pulse method is used to calculate the internal resistance every 100 cycles. The results of these tests are shown in Fig. 2. For the cells experiencing only vibration and the cells experiencing vibration and current pulses, the IR of each of the cells increases slightly over their lifetime as expected with no discernible difference in behavior between the different vibrational loads. The increase in resistance for the cells experiencing only vibration increased by 9%–26%, which is similar to other previous research that has shown internal resistance increases of 5%–25% in cells that experience vibration [34,35]. These results agree with previous research that shows when the dynamic load profile is within the scope described in the UN 38.3 standard, no dynamic vibration-related influence can be observed on the ohmic resistance of the LIBs [5]. This further implies that the applied vibration does not degrade the LIB structure significantly for cells that experience no other types of physical abuse. This is because the ohmic resistance is related to the bulk materials in the LIBs, such as the current collector, electrolyte, and separator [36].
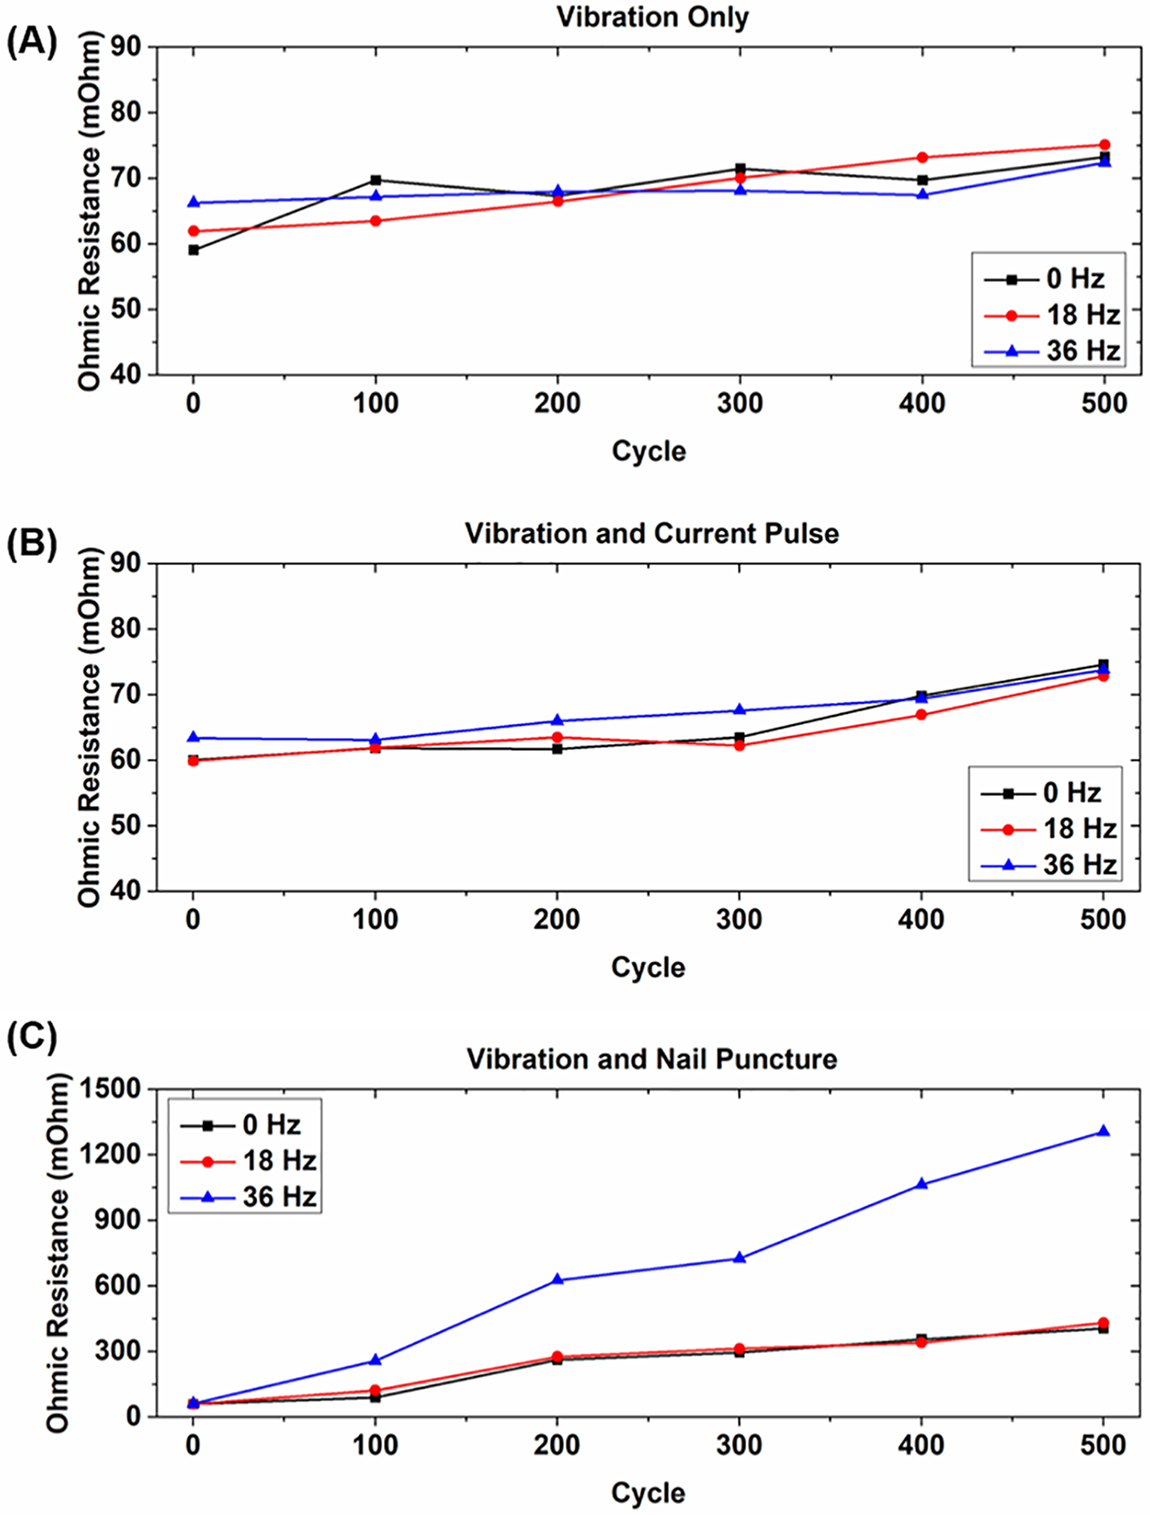
Figure 2: Internal resistance measurements over rated lifetime for (A) cells tested with only vibrational loading; (B) cells tested with vibrational loading and current pulses; and (C) cells tested with vibrational loading and nail punctures
More specific information on the effect on the electrochemical performance of the cells can be obtained by investigating differences in the spectra of EIS tests performed at different SOCs after the conclusion of cycling. Fig. 3 shows the results of the EIS tests for each of the cells, where overall the impedances of the cells decrease as the SOC of the cells at the time of the tests increases. The EIS tests on the cells experiencing nail punctures cannot be performed over different SOCs, as the cells are not capable of holding a charge because of the extensive physical damage. Due to this, only one EIS test is performed on each of the nail puncture cells at the voltage those cells equalize to after cycling (~0.5–1.0 V).
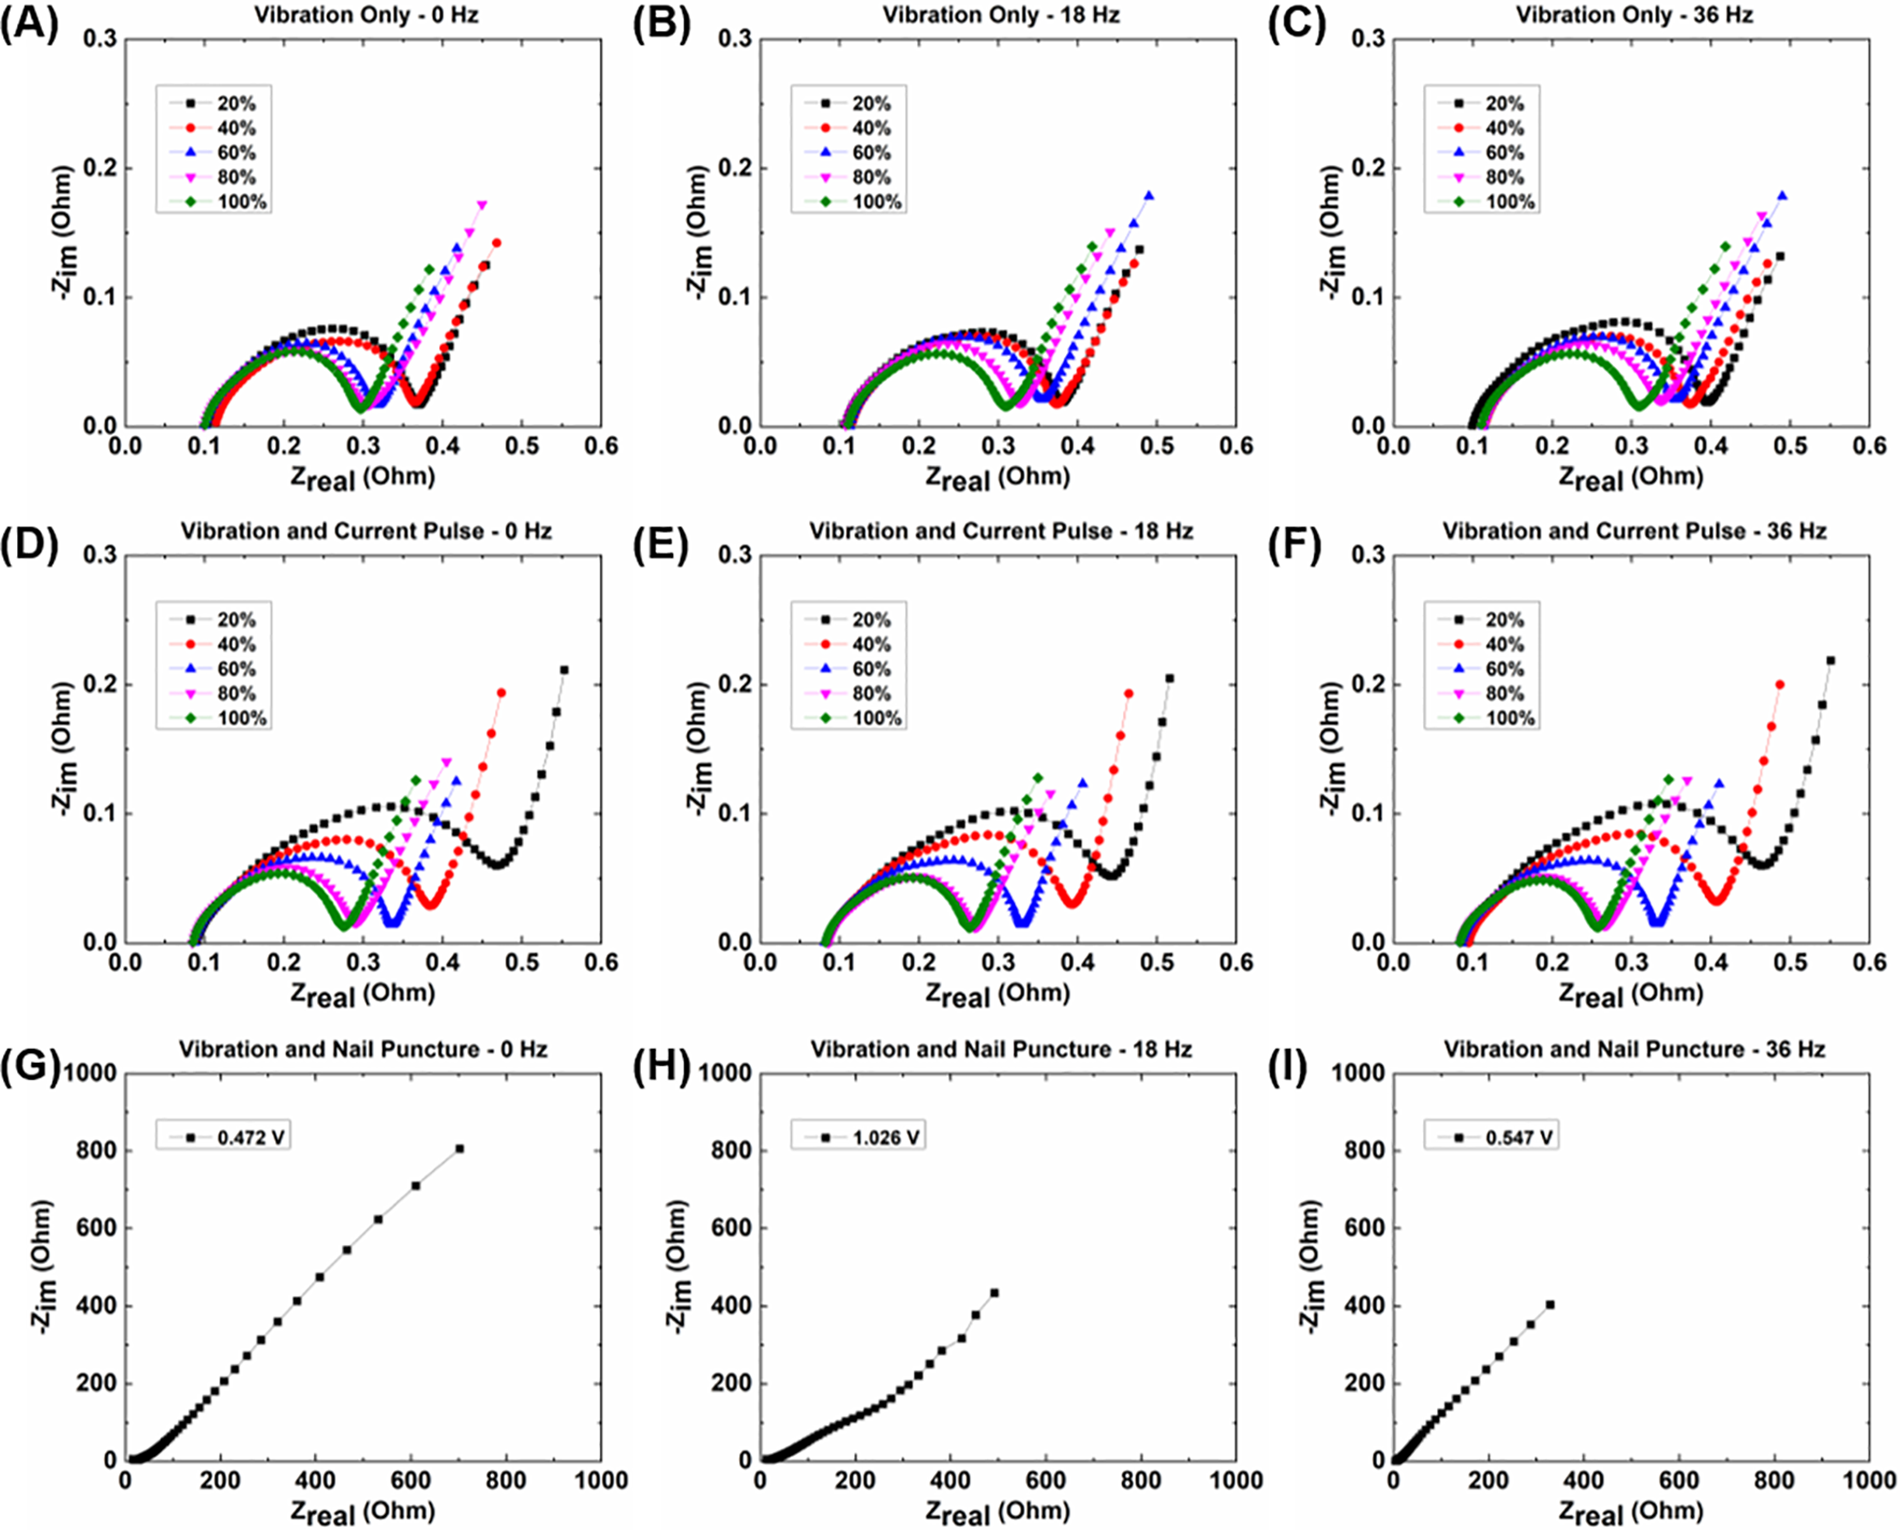
Figure 3: EIS spectra for (A–C) cells experiencing vibrational loading only; (D–F) cells experiencing vibrational loading and current pulses; and (G–I) cells experiencing vibrational loading and nail punctures
The EIS results do not show any significant differences or discernible change in pattern between different vibration frequencies for the different groups of cells. However, there is an observable difference in the spectra between the cells with only vibrational loading and the cells with both vibrational loading and current pulses at the lower SOCs and lower test frequencies. The cells with current pulses during cycling show a larger increase in the magnitude of their charge transfer resistance, as well as increases in both real and imaginary impedances, above those with just vibrational loading. The real and imaginary impedances for each of the nail puncture cells are significantly higher than the other cells, both due to the cells being at much lower SOCs during the tests and the significant physical effects on the internal components from the punctures. Similar to the current pulse tests, the results from the EIS testing show that vibration loading itself has little noticeable effect on cell resistance, but the effects caused by the current pulses require further investigation.
3.2 Capacity Degradation and Incremental Capacity
The changes in discharge capacity over the lifetime of the cells are presented in Fig. 4. The capacity increases observed in cycles 101, 201, 301, and 401 for the cells without nail punctures come from the rest periods associated with the internal resistance measurements. Continuous cycling can lead to the formation and buildup of byproducts such as LiF and Li2O on cell electrodes caused by the reaction between the electrolyte and oxygen products. These byproducts contribute slightly to capacity decay by reducing the conductivity of the electrodes. During the rest periods, the reaction products on the electrodes that have built up from consistent cycling partially dissolve, which can lead to a slight temporary increase in the available capacity when cells begin cycling again due to the improved electrode conductivity [37,38]. However, such capacity recovery is not sustainable and is not the focus of this work. Also, the small drop in overall capacity seen in these cells is less than what would normally be expected after hundreds of cycles. This is because the discharge cycles ended at 3.0 V as recommended by the manufacturer, which is a higher discharge cutoff voltage than what is normally seen in similar cells. This results in less capacity fade over the lifetime of the cells due to increased de-lithiation on the anode and lower loss of lithium inventory [39]. While this effect is likely also present in the cells that experience nail punctures, the significantly higher amount of capacity fade caused by the nail punctures far surpasses the increase in capacity that would be caused by a rest period.
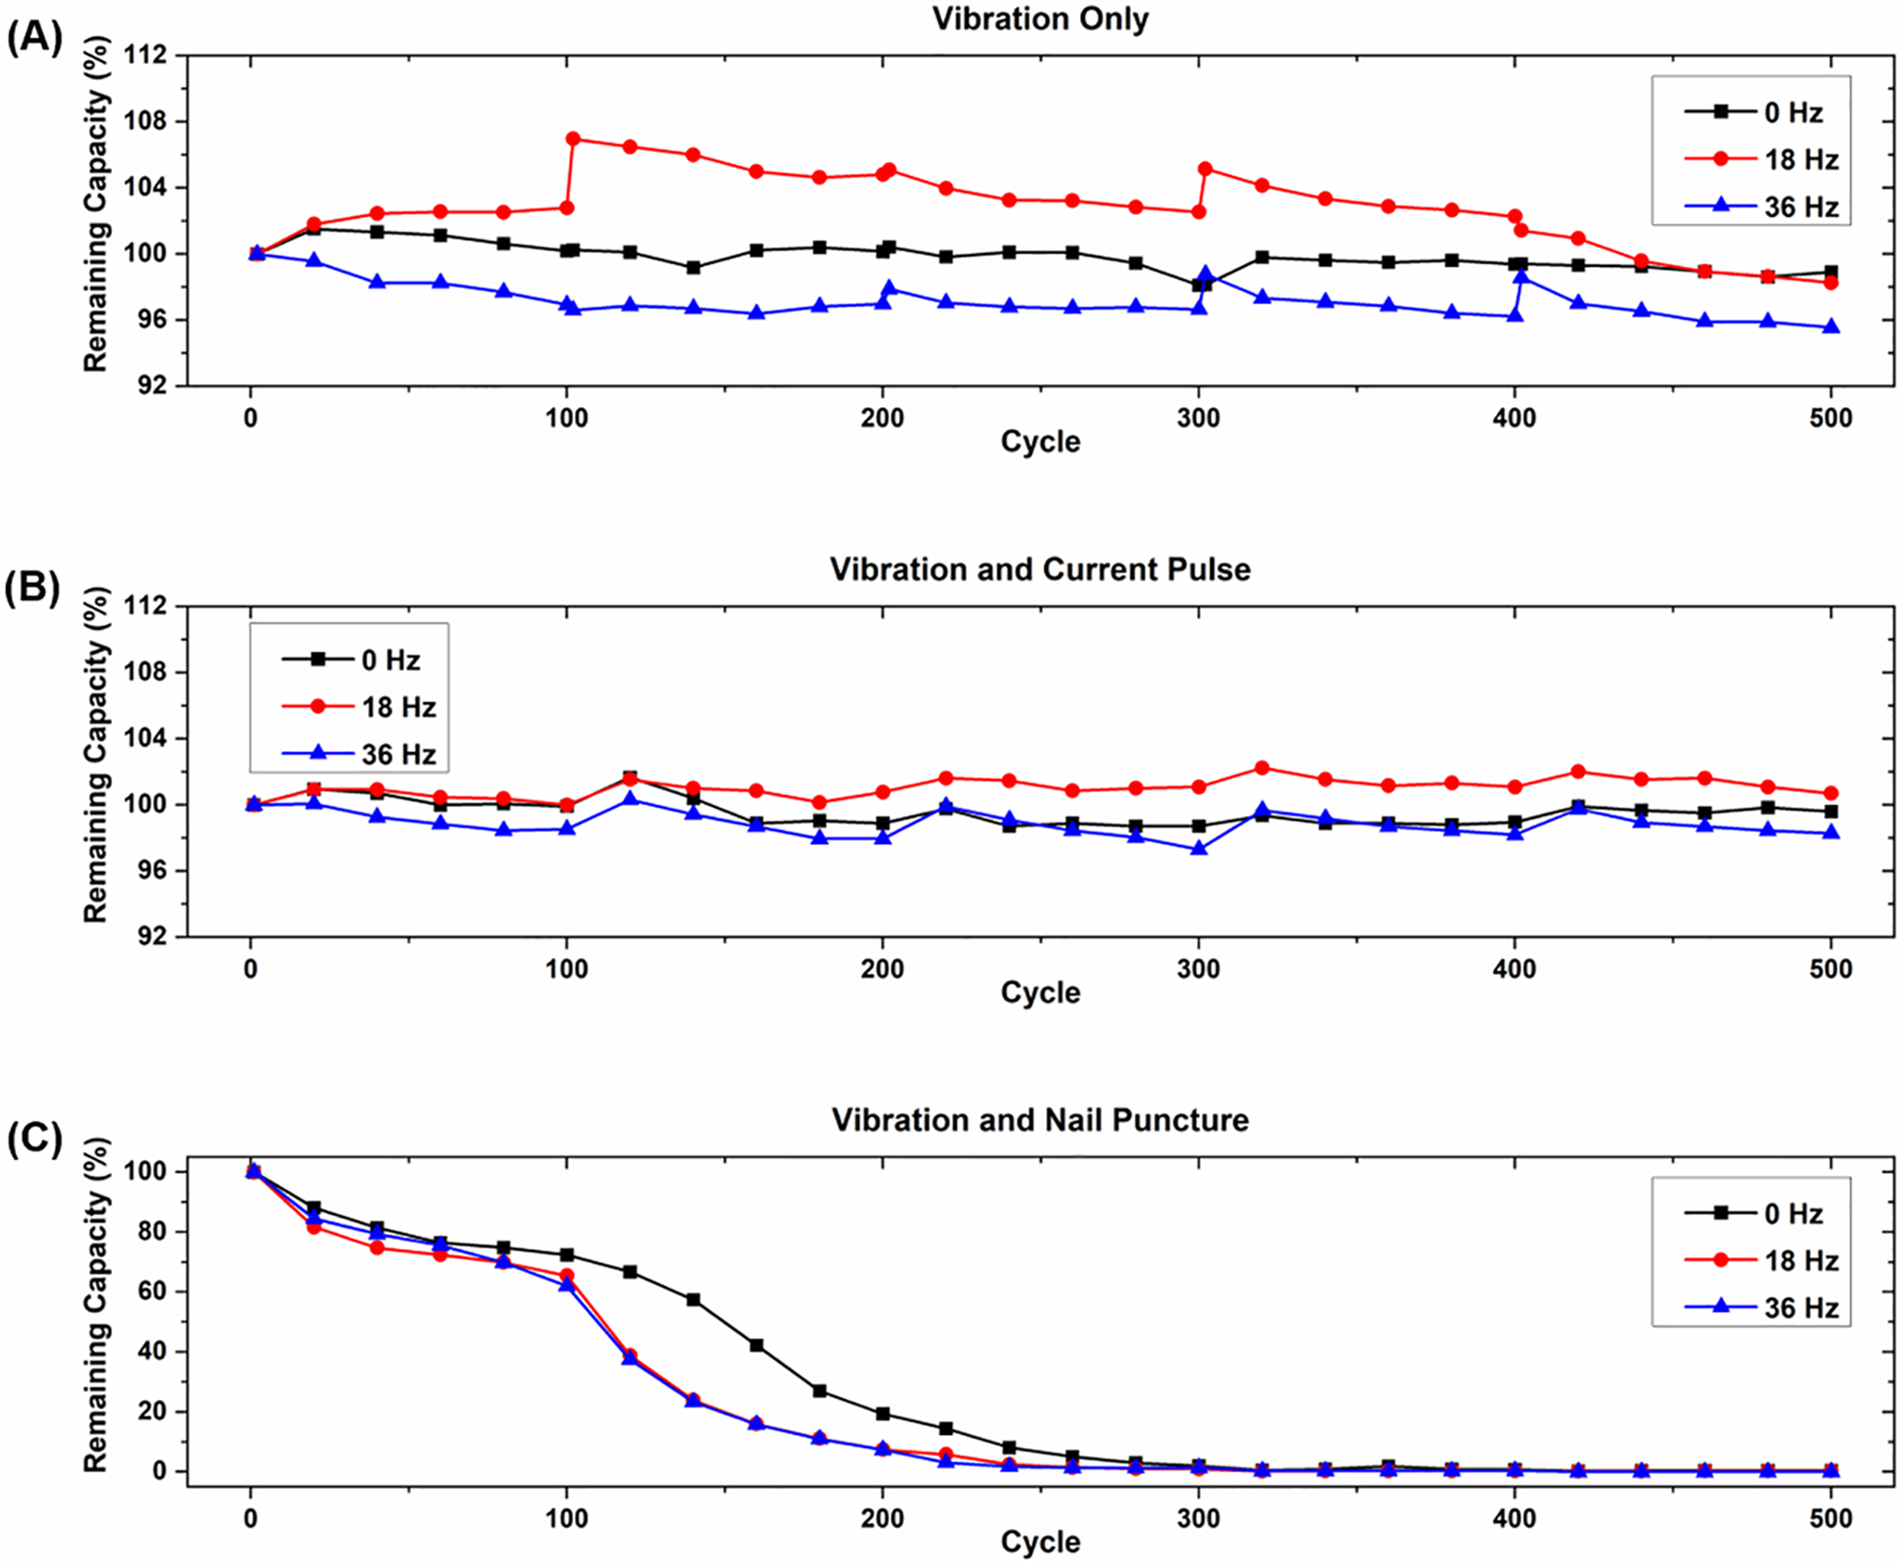
Figure 4: Summary of discharge capacities for (A) cells experiencing vibration loading only; (B) cells experiencing vibration loading and current pulses; and (C) cells experiencing vibration loading and nail punctures
The magnitudes and corresponding voltages of the IC peaks are shown in Fig. 5 for the cells experiencing only vibration loading. Since the incremental capacity peaks are related to specific electrochemical processes during charge and discharge, they are related to specific electrode potentials [27]. While the magnitude of peak 3 remains fairly constant, over its lifetime the magnitude of peak 1 decreases slightly and the magnitude of peak 2 increases slightly for each of the cells, indicating some degradation of the active material [40]. No distinguishable pattern is seen in the corresponding voltage of the peaks for each of the cells. Some variability in peak voltage occurs in the cells experiencing 18 and 36 Hz vibration, but the variability is similar between each of the peaks and generally occurs after the rest periods. This is likely due to the dissolving and dissipating of byproducts that cause the increase in discharge capacity after the rest periods explained previously. The behavior of the peaks is mostly consistent across each of the cells, showing no indication that continuous long-term vibration has any effect on capacity degradation.
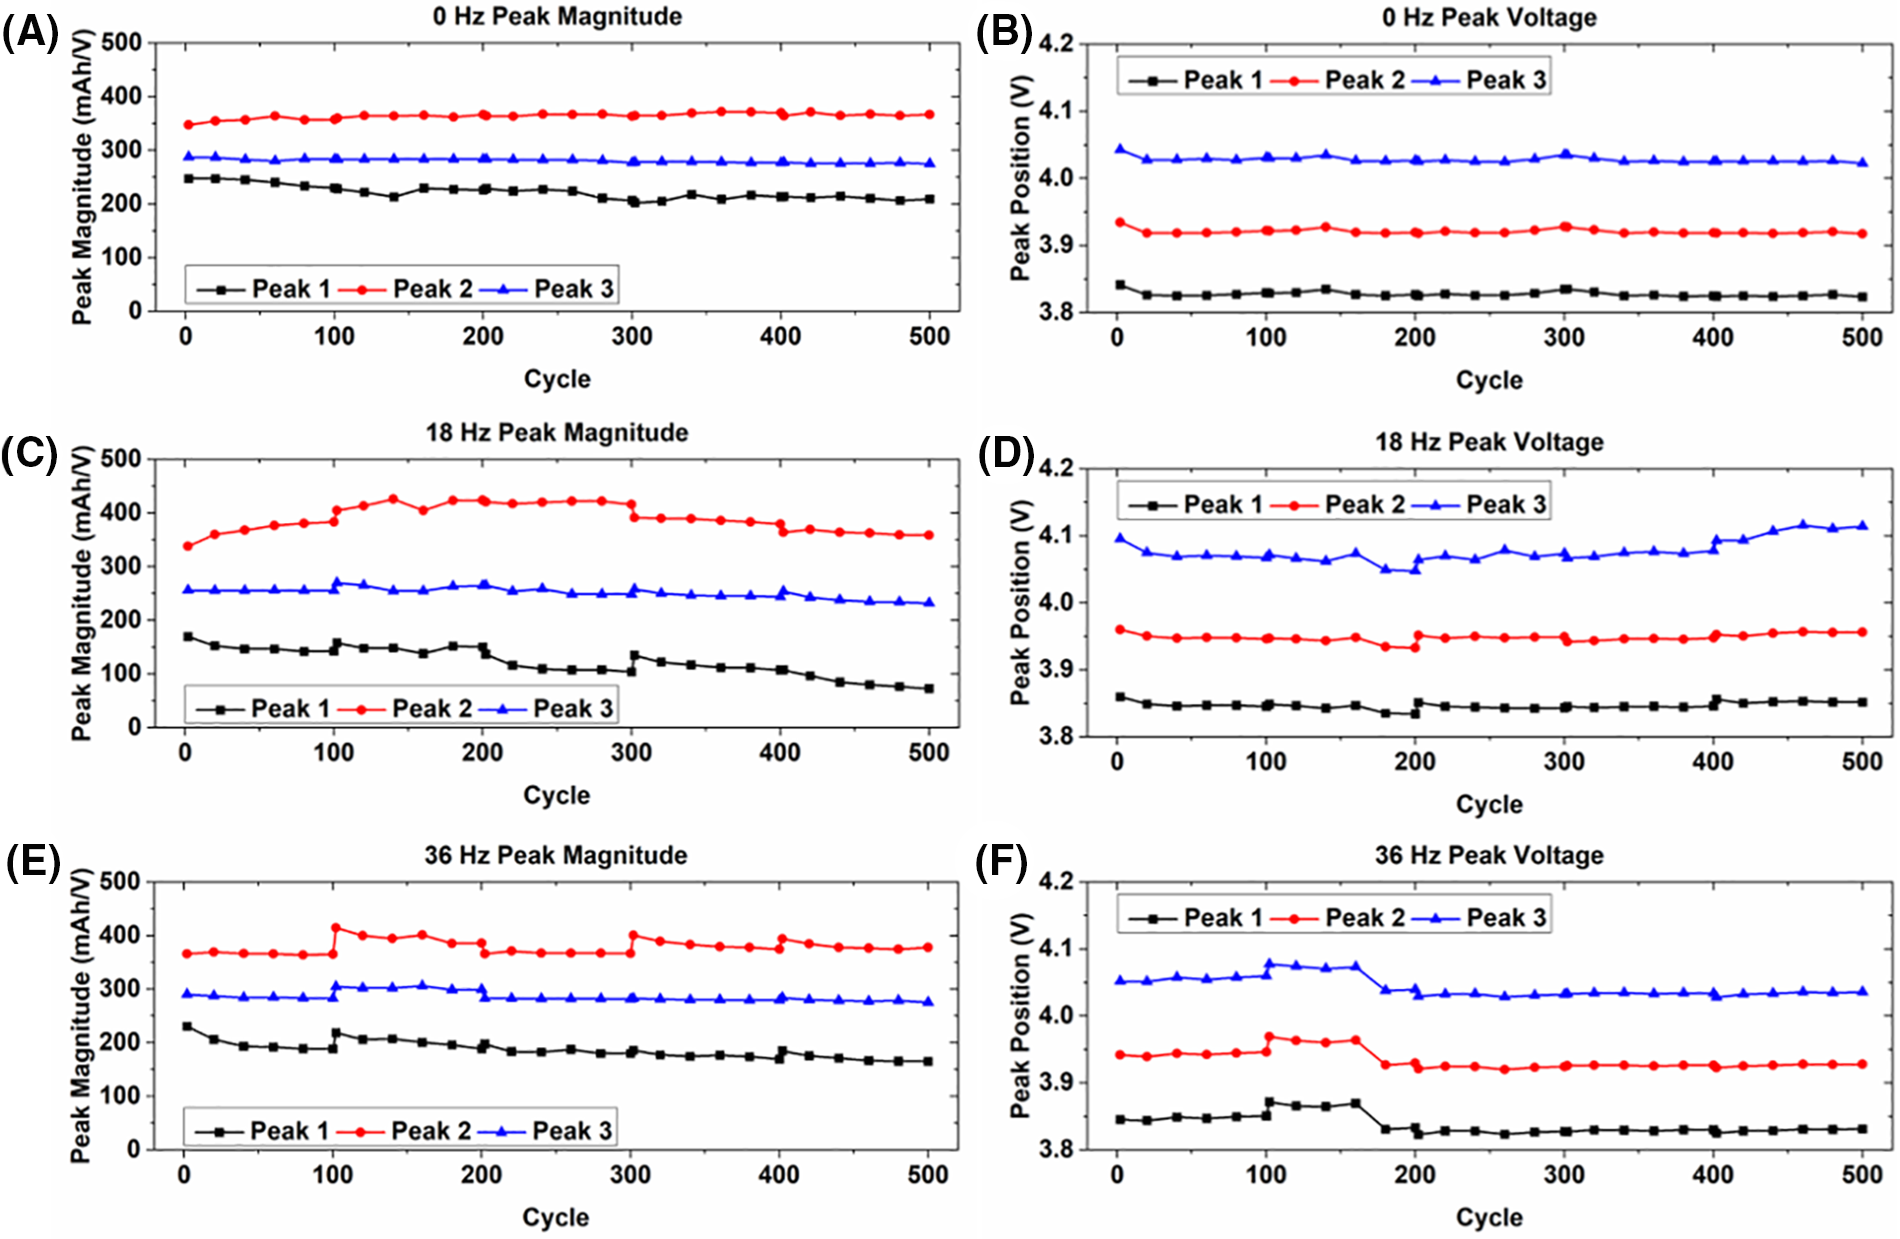
Figure 5: Summary of incremental capacity peak shift behavior for cells experiencing vibration loading only for (A, B) static condition; (C, D) 18 Hz vibration; and (E, F) 36 Hz vibration
Fig. 6 shows the magnitude and corresponding voltages of the IC peaks for the cells experiencing vibration loading and current pulses, which show very similar behavior to the cells with only vibration. Variation of the peak magnitudes occurs in each of the cells after the rest periods, the magnitudes of peaks 1 and 3 shift in the same manner, and the corresponding peak voltages show essentially no change in location. The results from these cells show that including current pulses in vibration testing gives no indication that long-term vibration combined with minor electrochemical abuse has any significant effect on capacity degradation either.
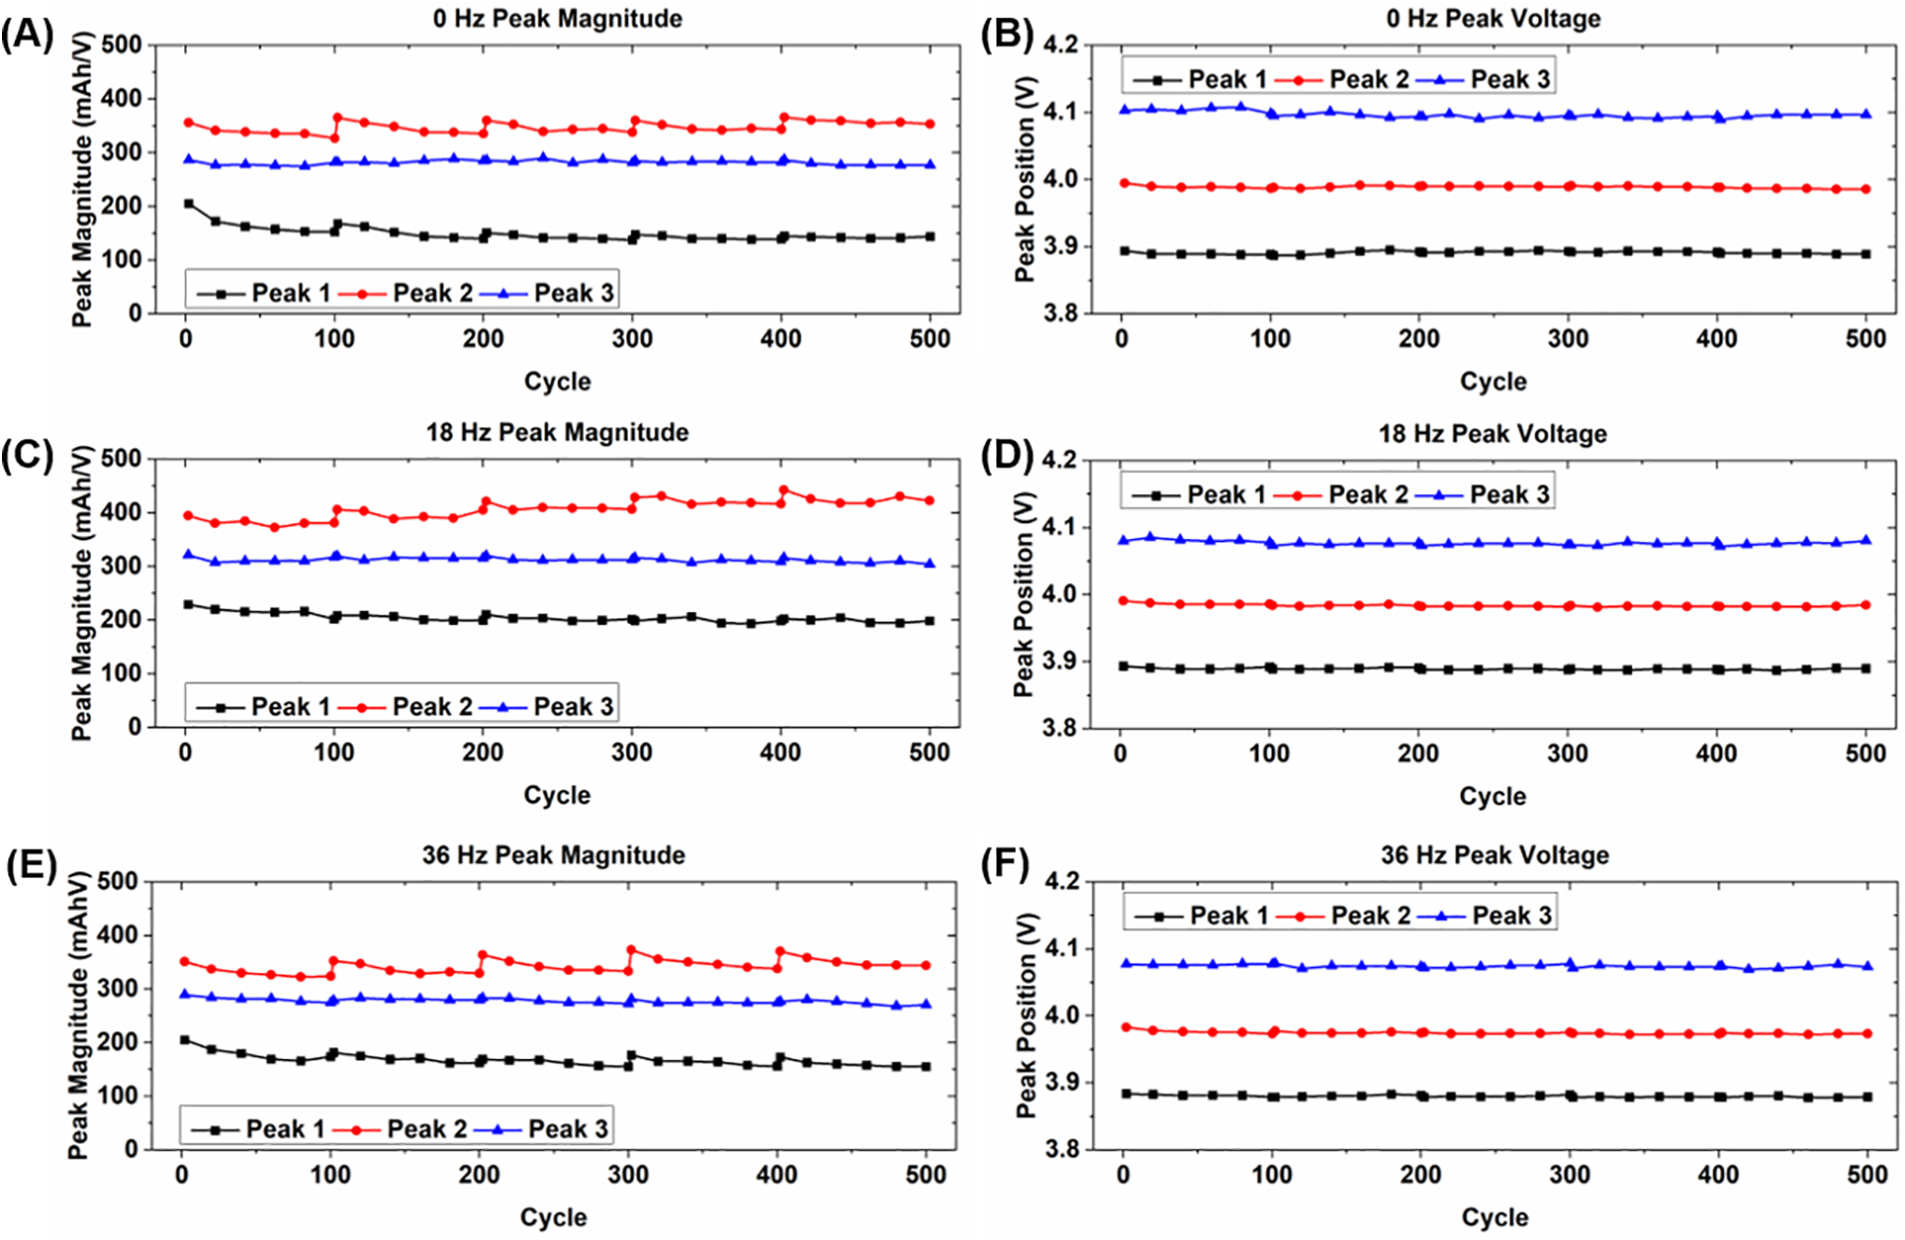
Figure 6: Summary of incremental capacity peak shift behavior for cells experiencing vibration loading and current pulses for (A, B) static condition; (C, D) 18 Hz vibration; and (E, F) 36 Hz vibration
Fig. 7 shows the magnitudes and corresponding voltages of the IC peaks for the cells experiencing vibration loading and nail punctures, whose behavior is significantly different from the other cells. After puncturing the magnitudes of peaks 1 and 2 decrease until they disappear, which occurs in the first 100-cycle period for each of the cells. The magnitude of peak 3 increases initially and intermittently spikes before decreasing and eventually disappearing around cycles 200–250. The corresponding voltages for each of the peaks increase before disappearing, which occurs in the case of peaks 1 and 2 in the first 100 cycle period, and then peak 3 disappears around cycles 200–250. The disappearance of the peaks and shifts to higher voltages indicates a severe loss of lithium inventory, as well as extreme polarization of the cells [27]. The peaks for the cells experiencing 18 and 36 Hz vibration disappear noticeably sooner than those of the static cell, providing more indication that vibration further accelerates the degradation of cells that experience a nail puncture.
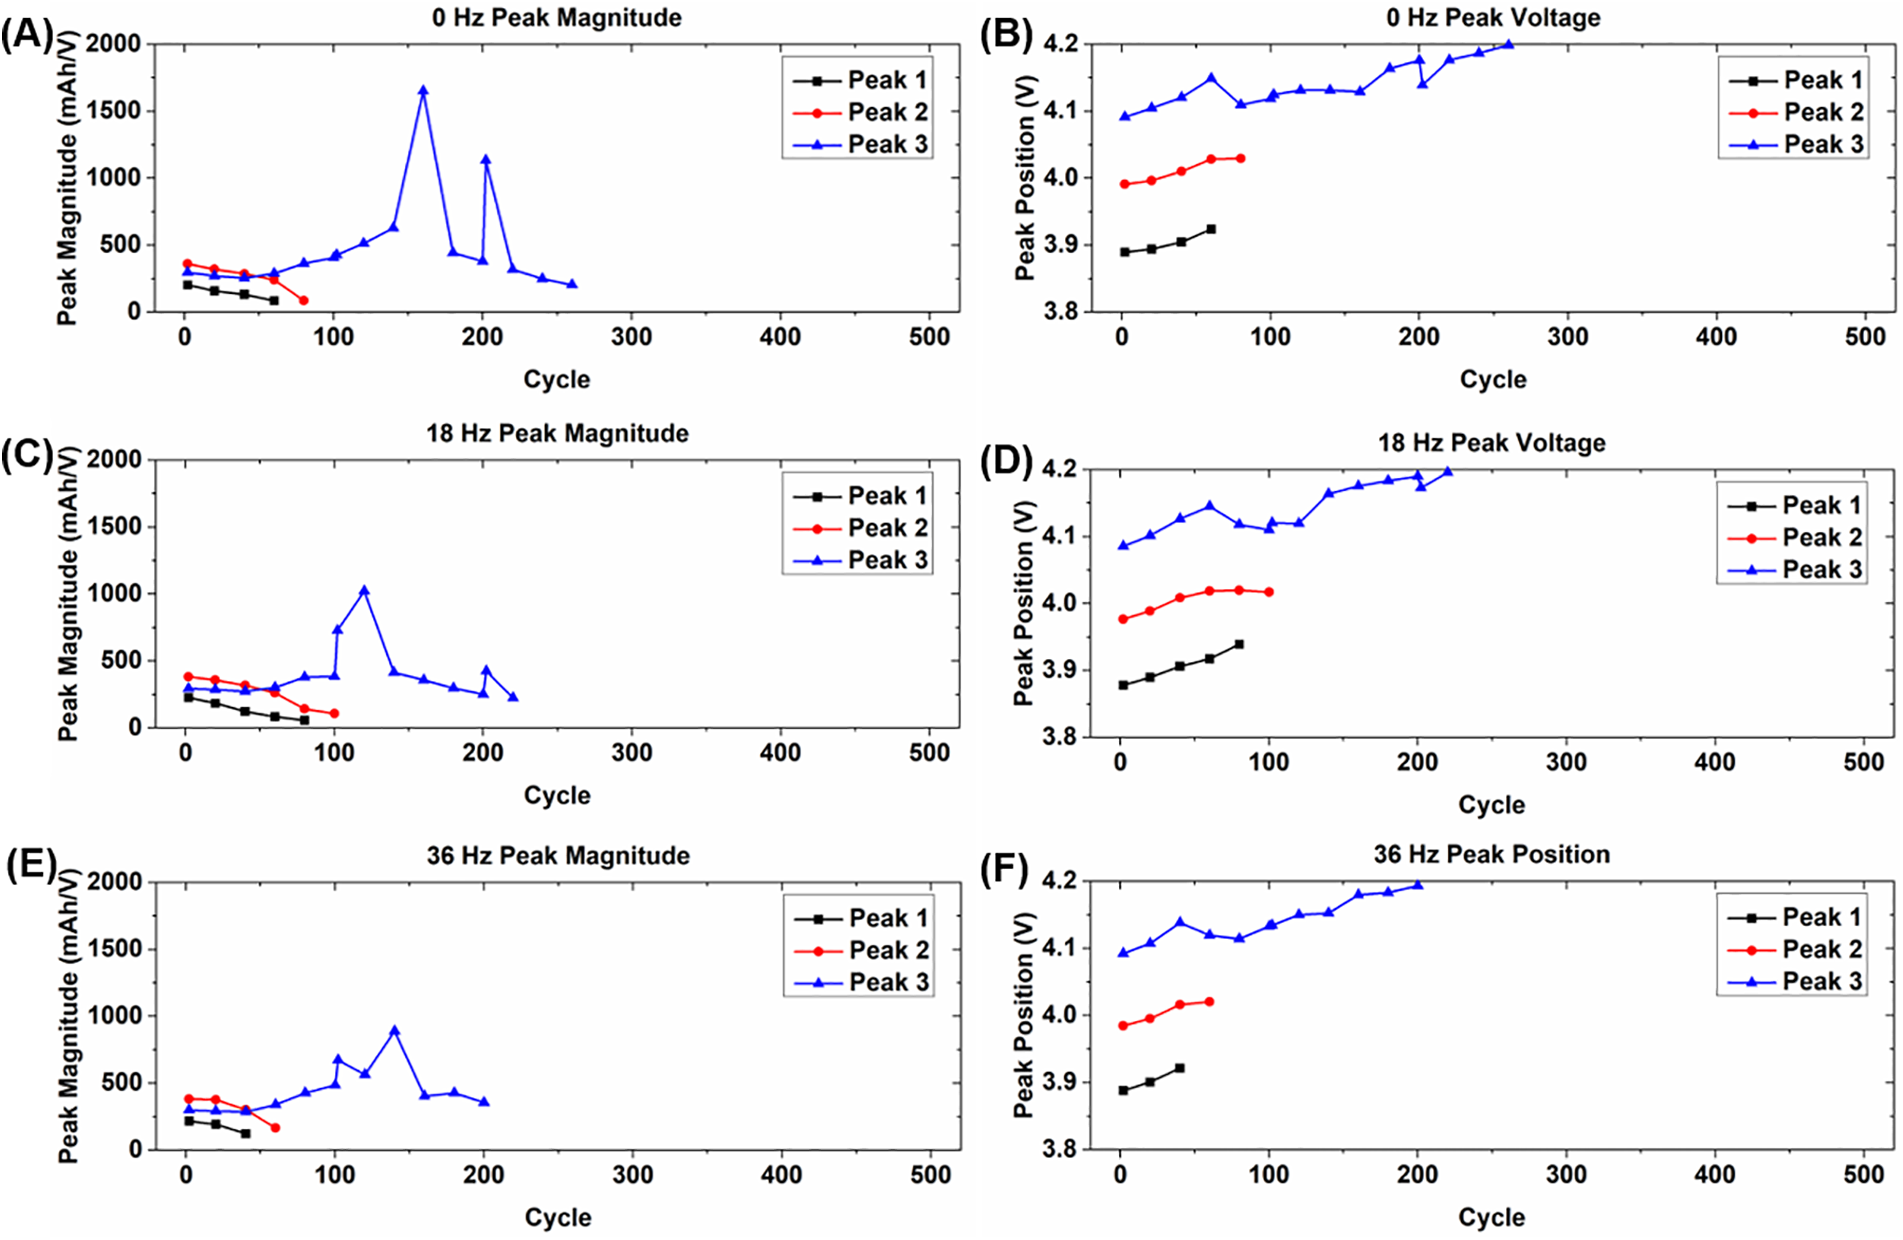
Figure 7: Summary of incremental capacity peak shift behavior for cells experiencing vibration loading and nail punctures for (A, B) static condition; (C, D) 18 Hz vibration; and (E, F) 36 Hz vibration
In our previous work [10], a relation between battery capacity and temperature increase was established and is shown in Eq. (3):
where
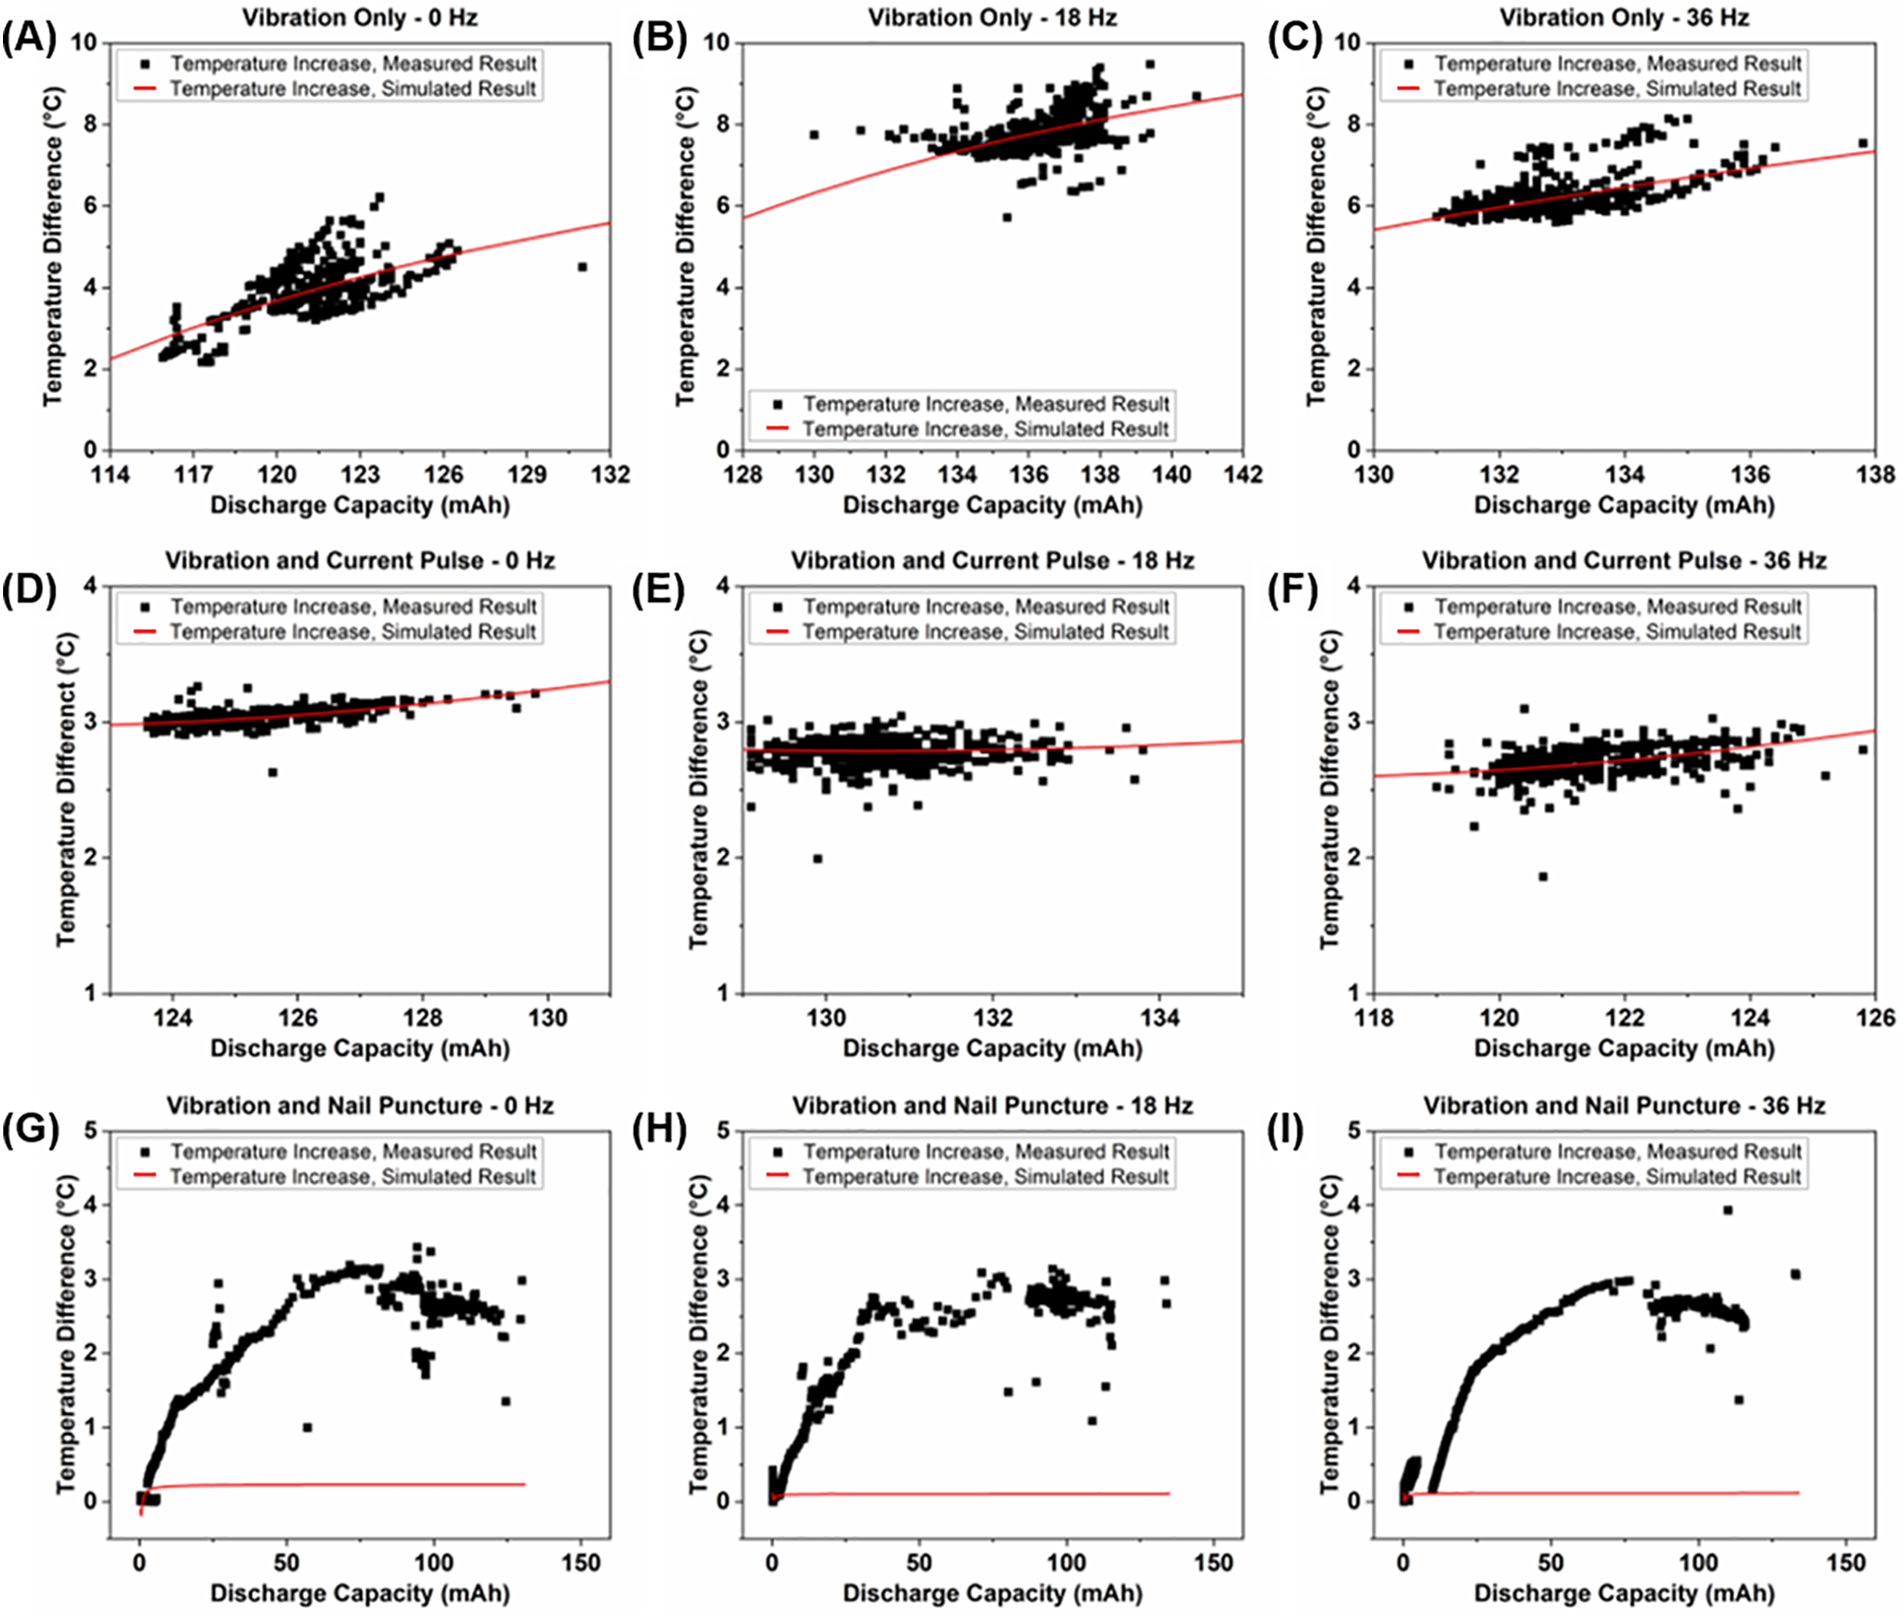
Figure 8: Relation between maximum temperature increase and capacity of (A–C) cells experiencing vibration loading only; (D–F) cells experiencing vibration loading and current pulses; and (G–I) cells experiencing vibration loading and nail punctures
The cells that experience vibration only, and the cells that experience both vibration and current pulses, show similar relationships between the amount of heat generated and discharge capacity. The cells that experience vibration and current pulses also exhibit a lower amount of heat generation throughout cycling. However, the cells that experience both vibrations and nail punctures show significant changes in the relationship between discharge capacity and heat generated to the point where the results do not fit the relationship explained by Eq. (3). The significantly lower amount of heat generated during cycling in these cells is due to many factors explained in the following section.
4.1 Internal Resistance and EIS
The cells experiencing nail punctures in conjunction with vibration loading exhibit a drastic increase in internal resistance over their lifetime, and the cell with the highest vibration frequency has the highest increase in internal resistance. These drastic changes in internal resistance are due to multiple factors caused both directly and indirectly by nail punctures. One reason for the increase in internal resistance is that when cell electrolyte is exposed to water vapor in the atmosphere, decomposition occurs which can lead to the creation of hydrogen fluoride and results in reduced conductivity. This also leads to increased corrosion and decreased performance due to higher resistances within a cell [41,42].
Our previous nail puncture work has also shown that a significant amount of physical damage occurs to the electrodes, especially the graphitic anode material which is the more brittle of the two materials [8,9]. Other research also shows that physical abuse from indentation and higher than normal operating temperatures (due to Joule heating from the momentary short caused by the nail puncture) causes brittle fracture and increased corrosion of the copper current collectors inside of cells [43,44]. The presence of vibrational loading, as well as increased vibration frequencies, likely aggravates the physical damage to the anode material and copper foil to cause higher levels of internal resistance in the cells experiencing damage from nail punctures.
The results of the EIS testing also show differences in impedance increases from the different types and combinations of abuse. One reason for the increase in impedance is likely that the tests combining vibration loading and current pulses were performed well after the tests implementing vibration only, resulting in more calendar aging of those cells. Calendar aging results in an increase in impedance due to causing higher polarization resistance and limiting diffusion, though this effect is normally not observed in DC resistance measurements as cycling is the main cause of increasing DC resistance [45,46]. Outside of the effects of calendar aging, the increase in both charge transfer resistance and impedance could also be due to the electrochemical abuse caused by the current pulses, which is especially seen at lower test frequencies. Intermittent current pulses during the charging and discharging of LIBs cause detrimental effects on cell performance, which is indicated in part by the increased charge transfer resistance that creates a less efficient electrochemical reaction in the cells [7,47].
Also, changes in impedances at low frequencies tend to occur due to fluctuations in lithium concentration within each of the electrodes [48]. The first current pulse occurs at 25% depth of discharge, which causes a momentary overcharge condition where the cells reach approximately 4.45 V. Over time these overcharges can result in the formation and growth of lithium dendrites, as well as the deposition of transition metals, which can result in higher levels of impedance and increased polarization of the cells [49,50]. Overall vibration loading does not appear to have any significant effect on the impedance of cells regardless of the frequency, though vibration can cause further increases in internal resistance if the cell electrodes and materials have experienced physical damage.
4.2 Capacity Degradation and Incremental Capacity
There is no clear distinction between the capacity decay behavior of the cells cycled under static conditions and the cells cycled with vibration loading for the cells that do not experience a nail puncture. Despite the difference in the testing condition, this agrees with the results of dynamic aging analysis by Brand et al. [5], Caposciutti et al. [51], and Hooper et al. [12]. In the work of Brand et al., the dynamic load was applied before the cycling of LIBs as required in the UN 38.3 standard [1], which is a go/no-go test. The studies performed by Caposciutti et al. and Hooper et al. used vibration profiles to represent operation in UAVs and EVs, respectively, and still observed little difference in capacity fade. This shows that for LIBs certified by the UN 38.3 standard, their capacity and service life are not obviously influenced by the dynamic loading condition within the range specified in UN 38.3, regardless of whether the dynamic load is applied in a real-time manner or if electrochemical abuse due to current pulses is applied. Therefore, for LIBs not expecting dynamic loads beyond the range specified in the UN 38.3 standard, the conventional go/no-go test appears to be sufficient for battery capacity and service life.
The cells that are physically damaged from nail punctures show a significantly accelerated reduction in operational capacity over their lifetime. This is due to both the physical damage to the cell components and the exposure to the atmosphere causing increased corrosion and electrolyte degradation, which is also explained in detail in our previous nail puncture studies on the same type of cells [8,9]. When vibrational loading is included with nail punctures, there is an observable difference in discharge capacity between the static cell and the cells that experience vibration loading starting at approximately cycle 100. The inclusion of vibration likely causes the further removal of active material from the electrodes that have already been compromised by the nail puncture, contributing to even more accelerated degradation.
No apparent difference in capacity degradation is seen between the two vibration frequencies when combined with a partial nail puncture, implying that the presence of vibration is more of a factor in capacity degradation than the exact frequency. Another factor contributing to the accelerated degradation could be the increased cell temperatures during the few cycles after the punctures. Operation at higher temperatures causes the degradation of active material, resulting in reduced capacities and shorter lifetimes of cells [52].
The temperature results from the cells that do not experience nail punctures show that heat generated during normal LIB cycling is related to the remaining capacity of the cell. The remaining capacity is higher during the initial cycles, and correspondingly the peak temperature during cycling is higher. The lower temperature rise of the cells incorporating current pulses is due mostly to the lower capacities from the calendar aging. When capacity decreases over cycling the peak temperature also decreases, given that the heat dissipation condition does not change. Therefore, if the dynamic input remains within the scope defined by UN 38.3 during LIB operation, the change in heat generation during regular battery service is expected to be minimal and steady. Based on the previous observation that catastrophic capacity decrease should not be expected when the in-service dynamic input remains within the scope defined by the UN 38.3, the peak temperature evolution can be predicted using Eq. (3).
The cells that also experience nail punctures again show a drastically different response to the testing. A nail puncture can cause significant changes to many of the terms used in the fitting equation that is used to predict temperature change. The physical damage causes a reduction in mass due to the removal of material and electrolyte evaporation, resistance increases significantly over the lifetime, and capacity severely degrades as explained earlier. While there is still an observable relationship between a decrease in discharge capacity and a decrease in temperature, the established relationship used to predict temperature change is no longer accurate due to the variability in the physical damage and temperature response of a cell to a nail puncture.
In this study, in-operando dynamic tests (related to the UN 38.3 standard) were carried out on Li-ion prismatic cells that combined vibration at different frequencies with current pulses and nail punctures. The vibration frequency was observed to have no significant influence on the operational performance of the cells, even when combined with the electrochemical abuse of current pulses. Combining vibration with physical abuse from nail punctures causes markedly accelerated degradation beyond that seen in cells that experience nail punctures with no vibration. Based on these observations, it can be concluded that no significant capacity decay or catastrophic failure should be expected on UN 38.3-certified cells when the in-service vibration load is within the scope defined in the testing standard, though the standard is not applicable when vibration is combined with significant physical damage.
The results show that vibrational loading causes a maximum increase in internal resistance by a factor of 1.26, and each of the cells completes its rated lifetime of 500 cycles without reaching their EOL capacity threshold. As no abrupt capacity decay is expected with the presence of in-service dynamic load, peak temperature in LIB cycling can be predicted based on the energy balance in LIBs. The conclusion is the same for cells that experience both vibration and current pulses, which have a maximum increase in internal resistance by a factor of 1.23 and also complete 500 cycles without reaching their EOL capacity threshold. However, combining vibrations with nail punctures can lead to significantly higher rates of internal resistance increase and accelerated degradation, indicated by the maximum increase in internal resistance by a factor of 22.1. Each of the cells with a nail puncture also reaches its EOL capacity within 50 cycles, much less than their rated lifetime. While this study has helped introduce an investigation into the detrimental effects caused by combinations of abuse to LIBs during operation, there are many other types and combinations of abuse that must be examined to develop a more thorough understanding. It is recommended that further studies be performed that incorporate multiple types of abuse mentioned in the UN 38.3 standard for the further development of specialized LIB testing methods and operational requirements.
Acknowledgement: The authors acknowledge the School of Aeronautics and Astronautics, Purdue University for their support in this project.
Funding Statement: Funding for this research has been provided by the Office of Naval Research (ONR) under the Grant N00014-20-1-2227 (Program Manager: Dr. Maria Medeiros and Dr. Corey Love).
Author Contributions: Casey Jones: Conceptualization, Methodology, Validation, Formal Analysis, Investigation, Data Curation, Writing—Original Draft, Visualization. Meghana Sudarshan: Methodology, Validation, Formal Analysis, Writing—Reviewing and Editing, Visualization. Vikas Tomar: Conceptualization, Resources, Writing—Reviewing and Editing, Supervision, Project Administration, Funding Acquisition. All authors reviewed the results and approved the final version of the manuscript.
Availability of Data and Materials: Data from this study may be made available upon reasonable request.
Conflicts of Interest: The authors declare that they have no conflicts of interest to report regarding the present study.
References
1. Vereinte, N. (2009). Recommendations on the transport of dangerous goods—manual of tests and criteria (Rev. 5). USA: United Nations Publication. [Google Scholar]
2. Command, N. S. S. (2020). Technical manual for navy lithium battery safety program responsibilities and procedures. USA: Naval Sea Systems Command. https://nps.edu/documents/111291366/111353854/TECHMAN+S9310-AQ-SAF-010+Rev3.pdf/1a956668-5a15-8bc4-3ad2-fcffb7790d06?t=1641234572299 [Google Scholar]
3. Battery Standards Testing Committee (2021). Vibration testing of electric vehicle batteries. https://standards.globalspec.com/std/14486578/j2380 [Google Scholar]
4. Doughty, D. H., Crafts, C. C. (2005). Electrical energy storage system abuse test manual for electric and hybrid electric vehicle applications. Journal of Power Sources, 139(1–2), 120–129. [Google Scholar]
5. Brand, M. J., Schuster, S. F., Back, T., Fleder, E., Stelz, M. et al. (2015). Effects of vibrations and shocks on lithium-ion cells. Journal of Power Sources, 288(10), 62–69. [Google Scholar]
6. Li, W., He, M., Wang, Y., Shao, F. (2023). Study on the capacity degradation mechanism and capacity prediction of lithium-ion battery under different vibration conditions in six degrees-of-freedom. Journal of Electrochemical Energy Conversion and Storage, 20(2), 021001. [Google Scholar]
7. Savoye, F., Venet, P., Millet, M., Groot, J. (2012). Impact of periodic current pulses on Li-ion battery performance. IEEE Transactions on Industrial Electronics, 59(9), 3481–3488. [Google Scholar]
8. Jones, C., Li, B., Tomar, V. (2021). Determining the effects of non-catastrophic nail puncture on the operational performance and service life of small soft case commercial Li-ion prismatic cells. eTransportation, 8(13), 100109. [Google Scholar]
9. Jones, C., Sudarshan, M., Serov, A., Tomar, V. (2022). Investigation of physical effects on prismatic lithium-ion cell electrodes after partial nail puncture using Raman spectroscopy and incremental capacity analysis. eTransportation, 12(10), 100174. [Google Scholar]
10. Li, B., Jones, C. M., Adams, T. E., Tomar, V. (2021). Sensor-based in-operando lithium-ion battery monitoring in a dynamic service environment. Journal of Power Sources, 486(13), 229349. [Google Scholar]
11. Steinberg, D. S. (2000). Vibration analysis for electronic equipment. USA: Wiley. [Google Scholar]
12. Hooper, J. M., Marco, J. (2014). Characterising the in-vehicle vibration inputs to the high voltage battery of an electric vehicle. Journal of Power Sources, 245(7), 510–519. [Google Scholar]
13. Zhang, L., Mu, Z., Gao, X. (2018). Coupling analysis and performance study of commercial 18650 lithium-ion batteries under conditions of temperature and vibration. Energies, 11(10), 2856. [Google Scholar]
14. Bruen, T., Hooper, J. M., Marco, J., Gama, M., Chouchelamane, G. H. (2016). Analysis of a battery management system (BMS) control strategy for vibration aged nickel manganese cobalt oxide (NMC) lithium-ion 18650 battery cells. Energies, 9(4), 255. [Google Scholar]
15. Heinzen, T., Plaumann, B., Kaatz, M. (2023). Influences on vibration load testing levels for BEV automotive battery packs. Vehicles, 5(2), 446–463. https://doi.org/10.3390/vehicles5020025 [Google Scholar] [CrossRef]
16. Waag, W., Käbitz, S., Sauer, D. U. (2013). Experimental investigation of the lithium-ion battery impedance characteristic at various conditions and aging states and its influence on the application. Applied Energy, 102(1), 885–897. [Google Scholar]
17. Zhao, S., Wu, F., Yang, L., Gao, L., Burke, A. F. (2010). A measurement method for the determination of dc internal resistance of batteries and supercapacitors. Electrochemistry Communications, 12(2), 242–245. [Google Scholar]
18. Wang, W., Wei, X., Choi, D., Lu, X., Yang, G. et al. (2015). Advances in batteries for medium and large-scale energy storage. In: Electrochemical cells for medium- and large-scale energy storage: Fundamentals, pp. 3–28. UK: Woodhead Publishing. [Google Scholar]
19. Wang, D., Bao, Y., Shi, J. (2017). Online lithium-ion battery internal resistance measurement application in state-of-charge estimation using the extended kalman filter. Energies, 10(9), 1284. [Google Scholar]
20. Sun, T., Xu, B., Cui, Y., Feng, X., Han, X. et al. (2021). A sequential capacity estimation for the lithium-ion batteries combining incremental capacity curve and discrete Arrhenius fading model. Journal of Power Sources, 484(27), 229248. [Google Scholar]
21. Dubarry, M., Truchot, C., Liaw, B. Y. (2012). Synthesize battery degradation modes via a diagnostic and prognostic model. Journal of Power Sources, 219, 204–216. [Google Scholar]
22. Han, X., Ouyang, M., Lu, L., Li, J., Zheng, Y. et al. (2014). A comparative study of commercial lithium-ion battery cycle life in electrical vehicle: Aging mechanism identification. Journal of Power Sources, 251, 38–54. [Google Scholar]
23. Dubarry, M., Svoboda, V., Hwu, R., Liaw, B. Y. (2006). Incremental capacity analysis and close-to-equilibrium OCV measurements to quantify capacity fade in commercial rechargeable lithium batteries. Electrochemical and Solid-State Letters, 9(10), A454. https://doi.org/10.1149/1.2221767 [Google Scholar] [CrossRef]
24. Dubarry, M., Svoboda, V., Hwu, R., Liaw, B. Y. (2007). Capacity loss in rechargeable lithium cells during cycle life testing: The importance of determining state-of-charge. Journal of Power Sources, 174(2), 1121–1125. [Google Scholar]
25. Zheng, L., Zhu, J., Lu, D. D. C., Wang, G., He, T. (2018). Incremental capacity analysis and differential voltage analysis based state of charge and capacity estimation for lithium-ion batteries. Energy, 150, 759–769. [Google Scholar]
26. Fly, A., Chen, R. (2020). Rate dependency of incremental capacity analysis (dQ/dV) as a diagnostic tool for lithium-ion batteries. Journal of Energy Storage, 29(10), 101329. [Google Scholar]
27. Zhang, L., Jiang, J., Zhang, W. (2017). Capacity decay mechanism of the LCO + NMC532/graphite cells combined with post-mortem technique. Energies, 10(8), 1147. [Google Scholar]
28. Zhang, C., Jiang, J., Zhang, L., Liu, S., Wang, L. et al. (2016). A generalized SOC-OCV model for lithium-ion batteries and the SOC estimation for LNMCO battery. Energies, 9(11), 900. https://doi.org/10.3390/en9110900 [Google Scholar] [CrossRef]
29. Gao, Y., Jiang, J., Zhang, C., Zhang, W., Ma, Z. et al. (2017). Lithium-ion battery aging mechanisms and life model under different charging stresses. Journal of Power Sources, 356, 103–114. [Google Scholar]
30. Song, S. W., Zhuang, G. V., Ross, P. N. (2004). Surface film formation on LiNi0.8Co0.1Al0.05O2 cathodes using attenuated total reflection IR spectroscopy. Journal of the Electrochemical Society, 151(8), A1162. [Google Scholar]
31. Bernardi, D., Pawlikowski, E., Newman, J. (1985). A general energy balance for battery systems. Journal of the Electrochemical Society, 132(1), 5–12. [Google Scholar]
32. Liu, G., Ouyang, M., Lu, L., Li, J., Han, X. (2014). Analysis of the heat generation of lithium-ion battery during charging and discharging considering different influencing factors. Journal of Thermal Analysis and Calorimetry, 116(2), 1001–1010. [Google Scholar]
33. Wu, X., Lv, S., Chen, J. (2017). Determination of the optimum heat transfer coefficient and temperature rise analysis for a lithium-ion battery under the conditions of harbin city bus driving cycles. Energies, 10(11), 1723. [Google Scholar]
34. Parasumanna, A. B. K., Karle, U. S., Saraf, M. R. (2019). Material characterization and analysis on the effect of vibration and nail penetration on lithium ion battery. World Electric Vehicle Journal, 10(4), 69. [Google Scholar]
35. Li, W., Jiao, Z., Xiao, Q., Meng, J., Mu, Y. et al. (2019). A study on performance characterization considering six-degree-of-freedom vibration stress and aging stress for electric vehicle battery under driving conditions. IEEE Access, 7, 112180–112190. [Google Scholar]
36. Choi, W., Shin, H. C., Kim, J. M., Choi, J. Y., Yoon, W. S. (2020). Modeling and applications of electrochemical impedance spectroscopy (EIS) for lithium-ion batteries. Journal of Electrochemical Science and Technology, 11(1), 1–13. [Google Scholar]
37. Betz, J., Brinkmann, J., Nölle, R., Lürenbaum, C., Kolek, M. et al. (2019). Cross talk between transition metal cathode and Li metal anode: Unraveling its influence on the deposition/dissolution behavior and morphology of lithium. Advanced Energy Materials, 9(21), 1900574. [Google Scholar]
38. Zheng, J., Xiao, J., Gu, M., Zuo, P., Wang, C. et al. (2014). Interface modifications by anion receptors for high energy lithium ion batteries. Journal of Power Sources, 250, 313–318. [Google Scholar]
39. Zhu, J., Su, P., Darma, M. S. D., Hua, W., Mereacre, L. et al. (2022). Multiscale investigation of discharge rate dependence of capacity fade for lithium-ion battery. Journal of Power Sources, 536, 231516. [Google Scholar]
40. Li, Y., Abdel-Monem, M., Gopalakrishnan, R., Berecibar, M., Nanini-Maury, E. et al. (2018). A quick on-line state of health estimation method for Li-ion battery with incremental capacity curves processed by Gaussian filter. Journal of Power Sources, 373(9), 40–53. [Google Scholar]
41. Stich, M., Göttlinger, M., Kurniawan, M., Schmidt, U., Bund, A. (2018). Hydrolysis of LiPF6 in carbonate-based electrolytes for lithium-ion batteries and in aqueous media. The Journal of Physical Chemistry C, 122(16), 8836–8842. [Google Scholar]
42. Sharifi-Asl, S., Lu, J., Amine, K., Shahbazian-Yassar, R. (2019). Oxygen release degradation in li-on battery cathode materials: Mechanisms and mitigating approaches. Advanced Energy Materials, 9(22), 1900551. [Google Scholar]
43. Hao, W., Xie, J., Wang, F. (2018). The indentation analysis triggering internal short circuit of lithium-ion pouch battery based on shape function theory. International Journal of Energy Research, 42(11), 3696–3703. [Google Scholar]
44. Zhao, Y., Fan, R., Dai, S., Lv, Y., Ren, Y. et al. (2021). Temperature-dependent degradation of the copper current collectors in lithium ion batteries electrolyte. International Journal of Electrochemical Science, 16(4), 210417. [Google Scholar]
45. Werner, D., Paarmann, S., Wetzel, T. (2021). Calendar aging of Li-ion cells—Experimental investigation and empirical correlation. Batteries, 7(2), 28. [Google Scholar]
46. Redondo-Iglesias, E., Venet, P., Pelissier, S. (2019). Efficiency degradation model of lithium-ion batteries for electric vehicles. IEEE Transactions on Industry Applications, 55(2), 1932–1940. [Google Scholar]
47. Chen, L. R., Chen, J. J., Ho, C. M., Wu, S. L., Shieh, D. T. (2013). Improvement of li-ion battery discharging performance by pulse and sinusoidal current strategies. IEEE Transactions on Industrial Electronics, 60(12), 5620–5628. [Google Scholar]
48. Li, S., Wu, Q., Zhang, D., Liu, Z., He, Y. et al. (2019). Effects of pulse charging on the performances of lithium-ion batteries. Nano Energy, 56, 555–562. [Google Scholar]
49. Li, H., Fu, L., Long, X., Liu, L., Zeng, Z. (2023). A study on overcharge behavior of high-power type lithium-ion battery with Li(Ni1/3Mn1/3Co1/3)O2 as cathode material. Journal of Thermal Analysis and Calorimetry, 148(12), 5423–5435. [Google Scholar]
50. Ouyang, D., Weng, J., Chen, M., Wang, J., Wang, Z. (2022). Sensitivities of lithium-ion batteries with different capacities to overcharge/over-discharge. Journal of Energy Storage, 52(1), 104997. [Google Scholar]
51. Caposciutti, G., Bandini, G., Marracci, M., Buffi, A., Tellini, B. (2021). Capacity fade and aging effect on lithium battery cells: A real case vibration test with UAV. IEEE Journal on Miniaturization for Air and Space Systems, 2(2), 76–83. [Google Scholar]
52. Gao, T., Bai, J., Ouyang, D., Wang, Z., Bai, W. et al. (2023). Effect of aging temperature on thermal stability of lithium-ion batteries: Part A—High-temperature aging. Renewable Energy, 203, 592–600. [Google Scholar]
Cite This Article
 Copyright © 2023 The Author(s). Published by Tech Science Press.
This work is licensed under a Creative Commons Attribution 4.0 International License , which permits unrestricted use, distribution, and reproduction in any medium, provided the original work is properly cited.
 Downloads
 Citation Tools