
 Submit a Paper
 Propose a Special lssue
 Open Access
ARTICLE

Energy Management and Capacity Optimization of Photovoltaic, Energy Storage System, Flexible Building Power System Considering Combined Benefit
1
Changjiang Institute of Survey, Planning, Design and Research, Wuhan, 430010, China
2
State Grid Hubei Economic Research Institute, Wuhan, 430071, China
3
Huazhong University of Science and Technology, Wuhan, 430074, China
4
Guangdong Power Grid Corp. Foshan Power Supply Bureau, Foshan, 528000, China
5
China Power Construction Engineering Consulting Central Southern Co., Ltd., Wuhan, 430071, China
* Corresponding Author: Hongfa Ding. Email:
(This article belongs to the Special Issue: Energy Systems Management and Climate Change)
Energy Engineering 2023, 120(2), 541-559. https://doi.org/10.32604/ee.2022.022610
Received 17 March 2022; Accepted 20 May 2022; Issue published 28 November 2022
 View Full Text
 Download PDF
Abstract
Building structures themselves are one of the key areas of urban energy consumption, therefore, are a major source of greenhouse gas emissions. With this understood, the carbon trading market is gradually expanding to the building sector to control greenhouse gas emissions. Hence, to balance the interests of the environment and the building users, this paper proposes an optimal operation scheme for the photovoltaic, energy storage system, and flexible building power system (PEFB), considering the combined benefit of building. Based on the model of conventional photovoltaic (PV) and energy storage system (ESS), the mathematical optimization model of the system is proposed by taking the combined benefit of the building to the economy, society, and environment as the optimization objective, taking the near-zero energy consumption and carbon emission limitation of the building as the main constraints. The optimized operation strategy in this paper can give optimal results by making a trade-off between the users’ costs and the combined benefits of the building. The efficiency and effectiveness of the proposed methods are verified by simulated experiments.Keywords
Nomenclature
| Acronyms | |
| PEFB | Photovoltaic, Energy Storage System, Flexible Building |
| HEMS | Home Energy Management Systems |
| ESS | Energy Storage System |
| PV | Photovoltaic |
| EAC | Equivalent Annual Cost |
| DC | Direct Current |
| MILP | Mixed Integer Linear Programming |
| LED | Light-Emitting Diode |
| SOC | The State of Charge of ESS |
| EV | Electric Vehicle |
| DER | Distributed Energy Resource |
| Indices | |
| t | Index for time intervals |
| d | Index for discharging of ESS |
| c | Index for charging of ESS |
| Variables | |
| Pbuy | The power purchased from the grid (kW) |
| Psell | The power sold to the grid (kW) |
| s1 | The area of PV modules installed on the roof (m2) |
| s2 | The area of PV modules installed at the sunrise side (m2) |
| τ | The time step (h) |
| Ppv | The power of all the PV modules (kW) |
| Cbuy | The paid electricity tariff (¥/kWh) |
| Csell | The sold electricity tariff (¥/kWh) |
| u | The charging/discharging state of ESS |
| S | The incremental benefit (¥) |
| C | The incremental cost (¥) |
| W | The combined benefit (¥) |
| Sc | The incremental carbon trading benefit (¥) |
| Sec | The incremental economic benefit (¥) |
| Sen | The incremental environmental benefit (¥) |
| Sso | The incremental social benefit (¥) |
| Cgird | The energy trading of the grid (¥) |
| C2 | The total initial investment cost (¥) |
| C1 | The EAC of the equipment (¥) |
| Istore | The EAC of the ESS per kWh (¥/kWh) |
| Cpv | The initial investment cost of PV module (¥) |
| Ipv | The EAC of PV module per square meter (¥/m2) |
| CAstore | The capacity of ESS (kWh) |
| Cstore | The initial investment cost of ESS (¥) |
| EESS | The maximum capacity of ESS (kWh) |
| Parameters | |
| ppv1 | The power of PV unit on the roof (kW/m2) |
| λ1 | The power generation coefficient on the roof |
| ppv2 | The power of PV unit at sunrise side (kW/m2) |
| s1,max | The maximum installed area of PV modules on the roof (m2) |
| λ2 | The power generation coefficient at sunrise side |
| s2,max | The maximum installed area of PV modules at the sunrise side (m2) |
| Gst | The reference value of solar irradiance (kW/m2) |
| H | The actual value of solar irradiance (kW/m2) |
| Cop | The operation and maintenance cost (¥) |
| ηcoal | The penetration rate of thermal power |
| Kunit | The carbon emission per unit of coal power (g/kW) |
| v | The proportion of clean energy in the local grid |
| a | The discount rate |
| Kc | The carbon emission baseline (g) |
| Pload | The load of the building (kW) |
| Ko | The carbon emissions generated by PEFB (g) |
| rc | The average carbon price (¥/g) |
| Gharm | The amount of harmful gases emitted by producing 1 kWh thermal power (g/kWh) |
| Iharm | The treatment cost to emit harmful gas (¥/g) |
| γ | The unit price of Sso of saving electricity (¥/kWh) |
| n | The service life (year) |
| s | The actual area of PEFB (m2) |
| kstore | The construction cost parameter of ESS |
| K | An auxiliary constraint |
| a1 | The operation and maintenance cost of PV module (¥/m2) |
| SOCmin | The lower limits of SOC |
| SOCmax | The upper limits of SOC |
| b1 | The operation and maintenance cost of ESS (kWh/m2) |
| c1 | The operation and maintenance cost of PEFB (¥/m2) |
| ηc | The charging efficiency of ESS |
| ηd | The discharging efficiency of ESS |
| The maximum discharging power of ESS (kW) | |
| The maximum charging power of ESS (kW) | |
The main way to cope with global climate change is to control greenhouse gas emissions, including through industrial emission reduction, low-carbon transportation, clean energy use, and energy conservation in living. Carbon emissions from the operation of buildings account for a large portion of the total carbon emissions of society as a whole. Buildings should also move from being energy consumers to contributors that support large-scale clean energy access for all while integrating energy use, capacity, and storage into one [1–3].
The application of distributed energy sources (DER) is an important direction for low carbon development in and concerning buildings. Photovoltaic technology is currently one of the main renewable energy sources for buildings; two such examples being building-integrated photovoltaic and building-attached photovoltaic. In 1991, a German company created the “photoelectric wall,” and the United States, Spain, and other countries have gradually built large numbers of photovoltaic building integration systems [4–8]. In 1994, the Japanese government began to implement the “New Sunshine Project”, which led to the gradual introduction of photovoltaic power generation systems into the homes of ordinary Japanese families [9].
In recent years, the concept of the photovoltaic energy storage system, the flexible building power system (PEFB) has been brought to greater life. It now includes photovoltaic power generation, DC/AC shiftable or non-shiftable load demands, bi-directional charging/discharging of ESS, flexible control, and energy management in buildings, which is initially expected to reduce carbon emission by about 25% during the building operation. In China, one module of the Shenzhen Future Building has established an integrated PEFB power system (DC building), equipped with a 150 kW photovoltaic system, ESS, DC air conditioning multi-connector system, LED lighting system, DC charging station, etc.
The PEFB power system is a flexible microgrid with a high percentage of distributed clean energy. However, different from a conventional microgrid, the research object of PEFB is a building, and the parameters and constraints of the building need to be considered. In this paper, we propose an optimal operation scheme for the PEFB power system. The optimization objective is to maximize the integrated benefit brought by the buildings to the economy, environment, and society; the carbon trading limit is an essential component of the optimization objective, and the annual nearly-zero energy consumption of the buildings and the electricity market trading are taken as the main constraints. The optimal optimization operation scheme of PEFB is derived, and the efficiency and effectiveness of the proposed methods are verified by simulation last.
The core of PEFB is the energy management of the building microgrid. The intelligent controller integrates the devices, ESS, distributed power supplies, and grid-side information and shares the data between the grid and the user to control the operating range of the user’s load, thus achieving the goal of lowering the cost of electricity and maintaining the comfort of the user. Current research on building microgrid are mainly focused on the establishment of an electricity consumption model, the optimization of electrical devices, and the optimization of energy.
1) The establishment of the electricity consumption model: In the modeling process, the main focus is on optimising the operation of the building loads and energy storage system, among others. Lu [10] ignored the air conditioning operation's influence on of the external environment, the model used the historical operation data of the air conditioning to build the air conditioning operation model. Marilena et al. [11,12] considered the influence of the energy of the surrounding environment and built the air conditioning model based on the energy conservation theorem. Faria et al. [13] simplified the water heater model and used a first-order physical model to model a water heater with added resistance.
2) The optimization of electrical devices: John et al. [14] used a real-time tariff policy to optimize household electrical equipment, taking electricity’s cost as the objective function. Hou et al. [15] proposed a holistic model to center users’ preference when scheduling the involved physical equipment of different natures. The energy scheduling of the smart home can be derived to guarantee both the lowest cost and the comfort for the users. Ricardo et al. [16] proposed a combined optimization strategy for different customer-side electricity consumption situations, which solves the demand for electricity consumption on the customer side under various load situations. Javadi et al. [17,18] reduced the system’s total costs and propose optimal models based on time-of-use tariffs and demand response programs.
3) Building energy management system [19–21]: Home energy management systems (HEMS) is one of the main manifestations of the building energy system. Javadi et al. [22] proposed some effective HEMS design for the self-scheduling of assets of a residential end-user; the problem is formulated as a single-objective stochastic optimization problem in a MILP framework, aimed at minimizing the energy bill and discomfort index. Javadi et al. [23] presented a pool trading model within a local energy community considering HEMSs and other consumers. The results show that through cooperation, end-users in the local energy community market can reduce the total electricity bill. Lotfi et al. [24] studied the cooperation between HEMSs and electric vehicle (EV) parking lot management systems, the proposed coordination framework is both technically beneficial for power grids and economically beneficial for EV owners.
In the field of green building, one of the combined benefits is an important indicator used to evaluate the building and buildings in general. Unlike the existing research, this manuscript combines the combined benefit evaluation index system with the optimal operation of the building microgrids. It proposes an optimal operation strategy that maximizes the incremental social, environmental, and economic benefits. On the other hand, the green building industry has also gradually had specific criteria for judging in the carbon trading market; however, few studies consider the above indicators of buildings during optimization. This manuscript puts the combined benefits and the carbon trading indicators of buildings into the optimization model, thus enhancing the optimal operation of building microgrids. The comparison of recent contributions in this field is concluded in Table 1 [15,25–32].

This paper are organized as follows: the materials, model and method are addressed in Section 2. The description of PEFB is first presented, and the optimization strategy of PEFB considering combined benefits are analyzed. Section 3 gives the summary of the whole optimal operation strategy. The simulation results are proposed and discussed in Section 4. Lastly, Section 5 comprises the relevant conclusions.
PV is the most suitable renewable energy technology for buildings. However, the large-scale development of PV on the building needs to focus on solving the problem of asynchrony due to changes in power generation and in power load. The topology of the PEFB power system is shown in Fig. 1. A low-voltage DC/AC busbar is the main connection line to connect PV modules, ESS, and other AC/DC loads. The communication busbar connects the communication between the modules. According to the signal generated from the flexible power supply control system, the modules will be connected to the common busbar if they need to be connected to the power grid.
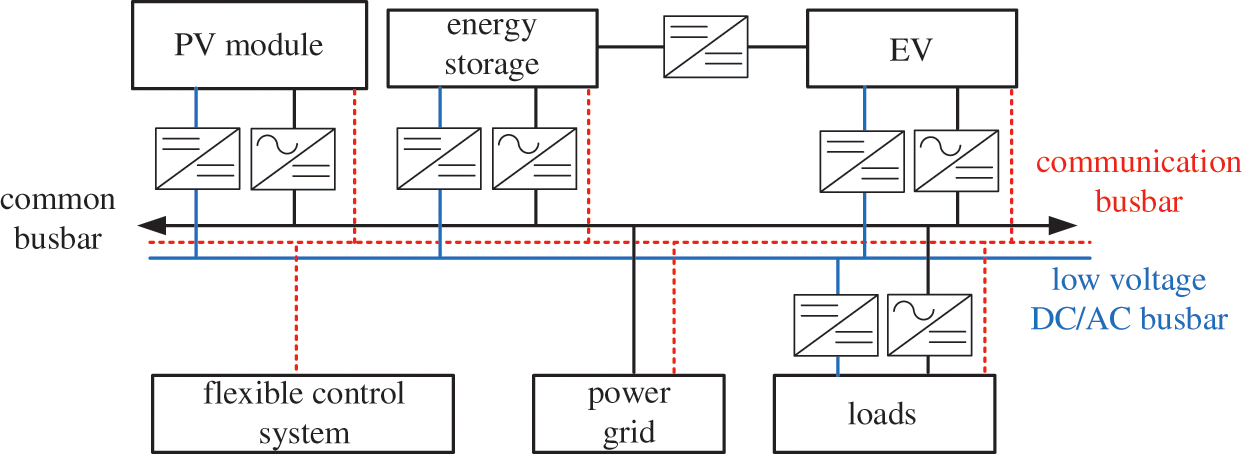
Figure 1: Topology of PEFB
PEFB is actually a flexible, demand response microgrid with a high proportion of distributed new energy, but unlike conventional microgrids, the object of this study is the building. In addition to the conventional microgrid constraints, PEFB also needs to consider the comprehensive benefits of the building in the operation process for the optimal allocation of equipment, as well as the principle of synergistic and optimal operation of different equipment functions. The combined benefits of the building are mainly determined by the incremental economic, social, and environmental benefits. PEFB is self-sufficient in electricity, reducing the cost of purchased electricity and thus increasing the incremental economic benefit. It is an environmentally friendly and low-carbon energy-saving system that increases energy utilisation and regeneration rates, thereby increasing the incremental environmental benefits. Furthermore, it reduces the use of coal power, reducing carbon emissions and thereby increasing the incremental social benefit. These features distinguish this building microgrid from other power systems and are the focus of this paper.
Next, the PEFB will be optimally modeled, except for by the conventional PV and ESS models (Section 2.2). The building characteristics will be further considered, and the combined benefit evaluation index and carbon trading index will be incorporated into the objective function, as shown in Section 2.3.
2.2 Optimization Model of PEFB Considering Combined Benefit
In order to achieve the optimal operation of the PEFB, the optimal strategy considering the operation of PV and ESSs needs to be developed. First of all, the model of this microgrid should be established.
Ppv represents the power of all the PV modules in PEFB, which is related to the tilt angle of the PV modules. ppv1 and ppv2 are the power of each PV unit of the roof and sunrise side PV unit, respectively. For PEFB, PV modules are mainly installed on the roof and sunrise side, λ1 and λ2 are the power generation coefficients of the roof and sunrise side, respectively. Generally speaking, λ1 = 1, λ2 < 1. s1 the area of PV modules on the roof and sunrise side, respectively. H is the actual value of solar irradiance, Gst is the reference value of solar irradiance.
2.2.2 Energy Storage System(ESS)
The balanced equation of the ESS [17,18]:
EESS is the maximum capacity of ESS. SOC(t) is the state of charge of the ESS at time t. φ is the ESS efficiency, and τ is the time step. Pcharge and Pdischarge are the charging/discharging power of ESS, ηcharge and ηdischarge are the charging/discharging efficiency, respectively.
P(t)buy and P(t)sell are the electricity power purchased and sold to the grid at each hour, respectively. P(t)load is the load of the building at time t.
2.2.4 Nearly-Zero Energy Consumption
PEFB has two ways of obtaining electricity, i.e., generating electricity through PV or purchasing electricity from the power grid. To achieve high clean energy penetration of PEFB, the concept of nearly-zero energy consumption is defined as the amount of electricity generated by a PEFB annually should be no less than the total amount of non-renewable electricity purchased by the system from the grid.
v is the proportion of clean energy in the local grid.
The time-of-use tariff policy is different for each area. Taking a city in the middle and lower reaches of the Yangtze River as an example, the tariff for commercial and industrial electricity is shown as:
Cbuy represents the electricity tariff. Pb is the general electricity cost per kWh.
As a low carbon and energy-efficient building system, the optimization objective of PEFB is defined as the maximization of the combined benefit W that the building brings to the overall society (the combined benefit), i.e., the difference between the incremental benefit S and the incremental cost C.
The incremental benefit S consists of incremental carbon trading benefit Sc, incremental economic benefit Sec, incremental environmental benefit Sen, and incremental social benefit Sso. The incremental cost C mainly includes the equipment cost of PEFB, the cost of purchasing and selling electricity to the grid Cgrid, and the operation and maintenance cost Cop. The equipment cost mainly includes PV modules, ESS, etc.
2.3.1 Incremental Carbon Trading Benefit
The amount of carbon trading in this paper is mainly calculated by the carbon emission during the process of building operation. China’s power is mainly composed of thermal power, hydroelectric power, nuclear power, wind power, and solar power; the carbon emissions during the use of electrical energy are mainly generated by burning coal in thermal power. The carbon emission per unit of coal power Kunit in China is about 838.6 g/kWh [33]. The carbon emission baseline Kc should be determined by population size, growth, socioeconomic structure, etc. [34,35]. The carbon emissions generated by PEFB during operation are defined as Ko. The average carbon price is defined as rc.
Currently, many places have allowed buildings and individuals to participate in carbon trading; the incremental carbon trading benefit Sc that PEFB can obtain from the carbon trading market is defined as:
ηcoal is the penetration rate of thermal power in the local power grid, Pbuy is the electricity the PEFB purchased from the power grid each hour.
2.3.2 Incremental Economic Benefit
Cbuy and Csell are the purchase and sale price of electricity tariff in the local grid, respectively.
2.3.3 Incremental Environmental Benefit
The incremental environmental benefit of PEFB to the atmosphere are defined as Sen:
The harmful gases produced by coal combustion mainly include NOx, SOx, CO, CO2, CmHn, etc. P(t)pv is the amount of electricity generated through PV per hour of the building, j is the type of different harmful gases, m is the total number of harmful gas types. Gharm is the amount of harmful gases emitted by producing 1 kWh of thermal power, and Iharm is the treatment cost required to emit harmful gases. Producing one kilowatt of electricity consumes about 0.3–0.5 kg of coal, and burning 1 kg of coal produces about 19S g SOx (S is the sulfur content of coal), 0.5–1 g CO, 0.15–0.5 g CmHn, and 7.5–27.5 g NOx [36].
2.3.4 Incremental Social Benefit
Incremental social benefit Sso is defined as the cost-saving in electricity investment and the social benefit generated by PEFB.
γ is the unit price of the comprehensive social benefit of saving electricity.
It is necessary to consider the time value of money; hence the investment and construction costs of equipment should be converted to equivalent annual value. Assuming that the equipment’s total initial investment and construction cost is C2, the service life is n years. The discount rate is a, the equivalent annual cost (EAC) C1 is calculated by:
The initial investment and construction cost of PV module Cpv:
where Ipv is the EAC of PV module per square meter.
The initial investment and construction cost of ESS:
where CAstore is the capacity of the ESS, Istore is the EAC of the ESS per kWh, kstore is the construction cost parameter of ESS.
The annual cost of electricity is Cgrid:
The operation cost is Cop:
where a1, b1, c1 are the parameters of operation and maintenance cost of PV module, ESS, and PEFB, respectively, s is the actual area of PEFB.
The state of charge of ESS SOC(t) at time t is determined by SOC(t−1) and the charging/discharging power, and it is constrained by the upper and lower limits SOCmin and SOCmax of its maximum charging/discharge power.
Pcharge and Pdischarge are the charging/discharging power,
The constraint of PV modules is determined according to the characteristics of the building, the constraint of the installed area is:
where s1,max, and s2,max is the maximum installed area of PV module on the roof and the sunrise side, s1 and s2 is the actually installed area of PV module, respectively.
2.4.3 Carbon Emission Constraint
In order to make benefit from carbon trading, improve energy efficiency and reduce the carbon emission of the buildings, we establish the carbon emission constraint, i.e., the amount of carbon emission Ko generated by the PEFB through purchasing electricity during its operation should be less than the building’s carbon emission baseline Kc.
This section summarises the optimization model and strategy developed in Section 2. The optimal operation strategy is concluded in Fig. 2. This main problem this paper seeks to address is in regards to improving the combined benefit of PEFB. Therefore, some optimization models of PEFB are established, which include the definition of incremental benefit S, and incremental cost C, and some constraints are given. The integrated benefit W is taken as the optimization objective. The optimization problem is finally solved by applying mixed-integer linear programming software (MILP).
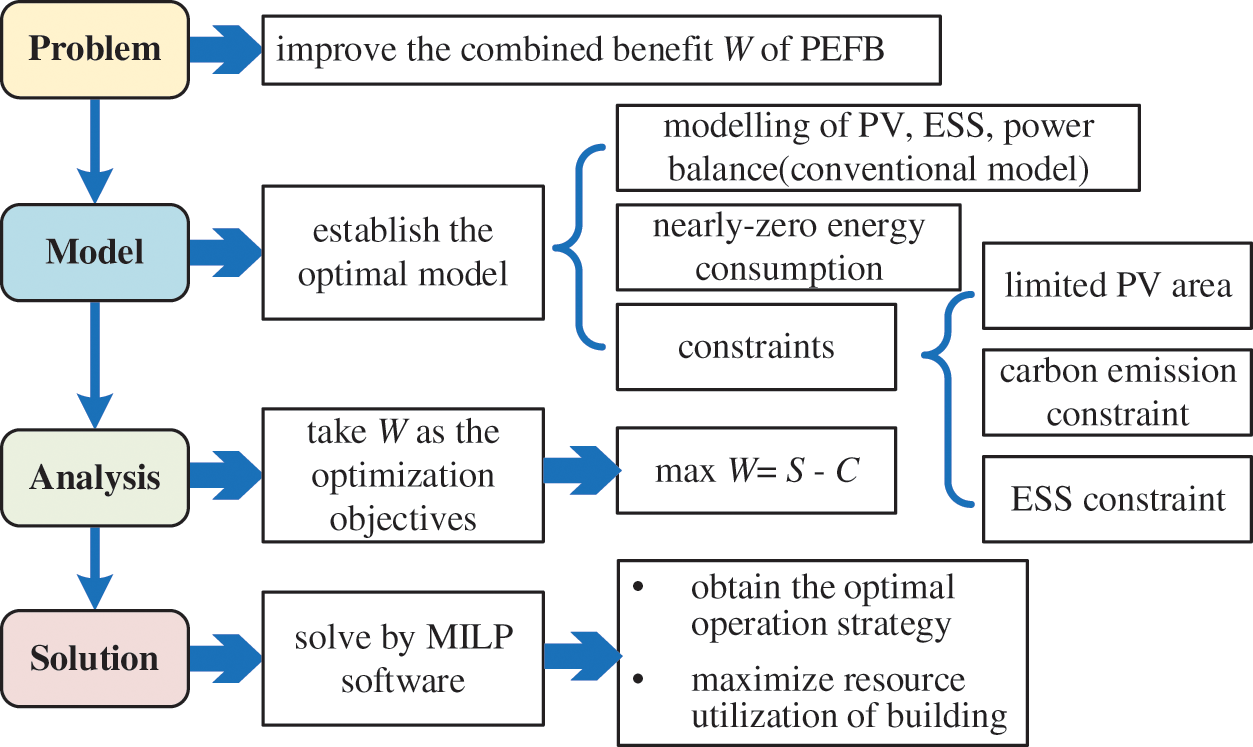
Figure 2: Optimal operation strategy
Two building types, residential buildings and commercial buildings, are used as examples in the simulation.
4.1 Optimal Operation for Residential Building
The residential building A1 is located in city A. The floor plan of the building and the area of the PV module that can be installed are shown in Fig. 3. The house is located on the top floor; the roof is a private space of the house that can be used to install PV modules. The net floor area of the house is 155 m2, and the maximum area for installing PV modules (optimum tilt angle: 23°) is 170 m2 on the roof. The sunrise side is designed as a PV wall (tilt angle: 90°), and the maximum area is 30 m2. As the application scenarios in the simulation are based on the places of China, the unit of benefits or prices in this paper is expressed as RMB (¥). The units can be changed accordingly if the scenarios are applied in other places or countries.
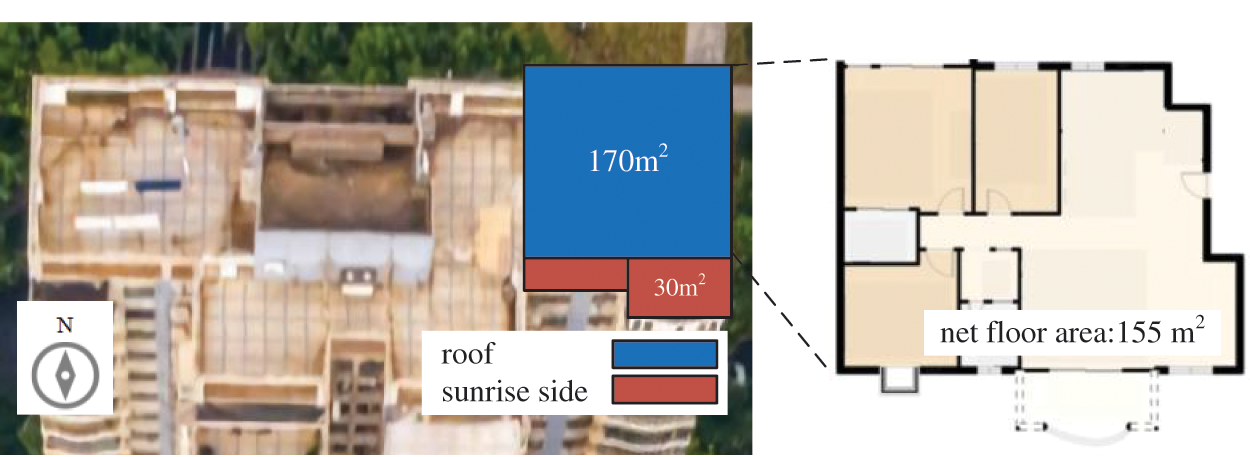
Figure 3: The residential building A1
PVsyst software is used to collect real solar irradiance data (collected every 2 h throughout one year) where the building is located; four typical days of the year are selected (spring-03/24, summer-06/11, autumn-09/25, and winter-11/06). Taking the power generation efficiency of PV modules at optimum tilt angle as 100%, the efficiency of the PV wall at 90° is 54% for this building. The power of the PV module is set as 180 W/m2 in this paper [37,38]. The electricity load of the house is collected during the four typical days mentioned above, as shown in Fig. 4.
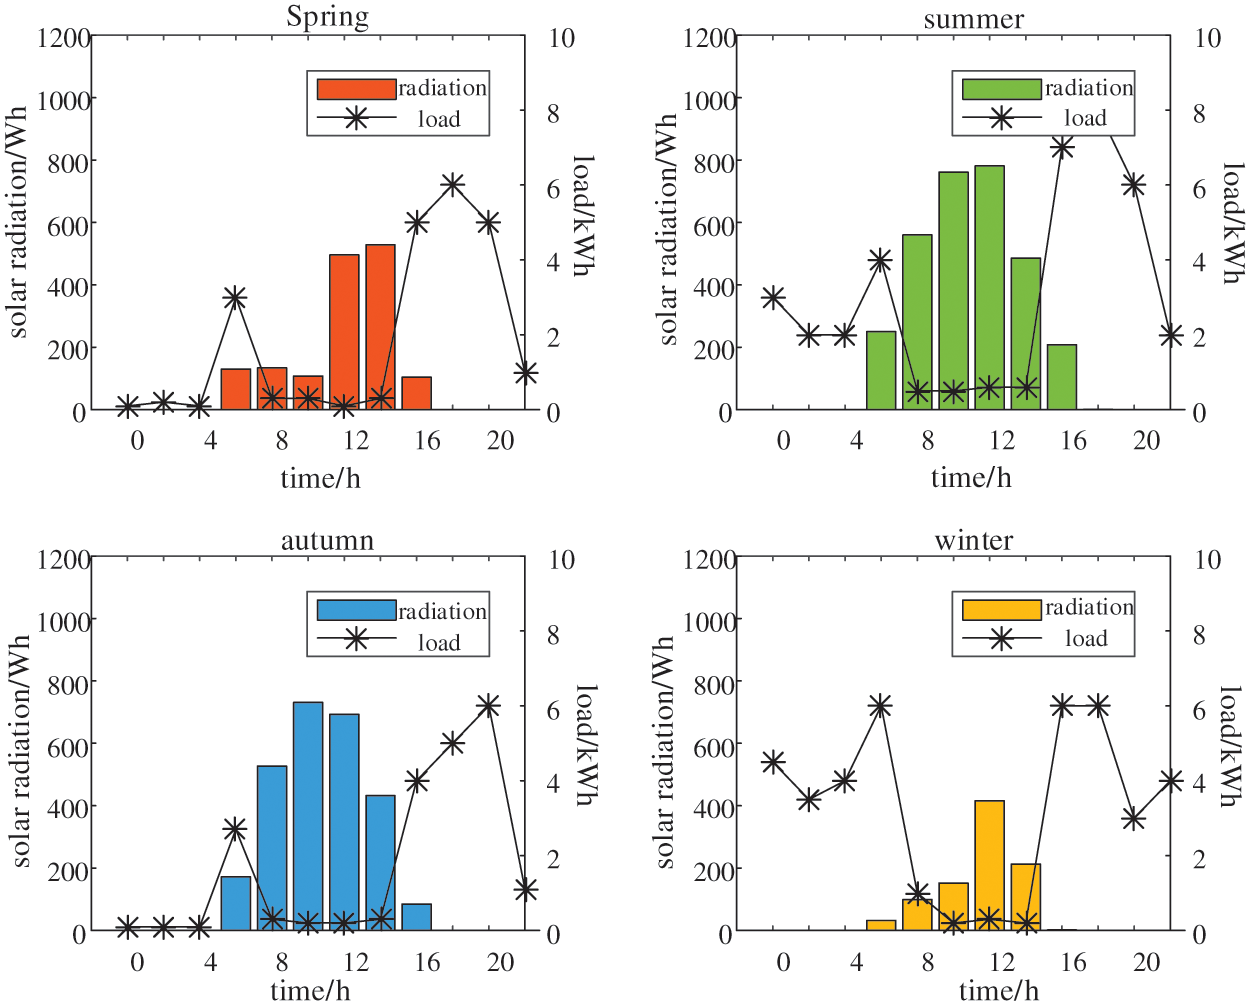
Figure 4: Average solar irradiance and electricity load (City A, residential building A1)
City A is located in China’s hot-summer and cold-winter zone, where the average solar irradiance is highest in autumn and summer and lowest in winter. In summer and winter, air conditioning is used for cooling or warming is needed in winter, so the overall electricity consumption of the building is relatively high in summer and winter.
The discharging/charging power of ESS for household use ranges from 3~15 kW; hence the maximum power of ESS is set as 10 kWh in this paper, and the efficiency is 90% [39,40]. The penetration rate of clean energy on the local grid is 38%. When the carbon price is 380 RMB/t, and the carbon emission baseline is 581 gCO2/m2 [34,35], the optimization results of this building are shown in Table 2; the optimal operation strategies (charging and discharging strategy, power trading strategy) are shown in Fig. 5.

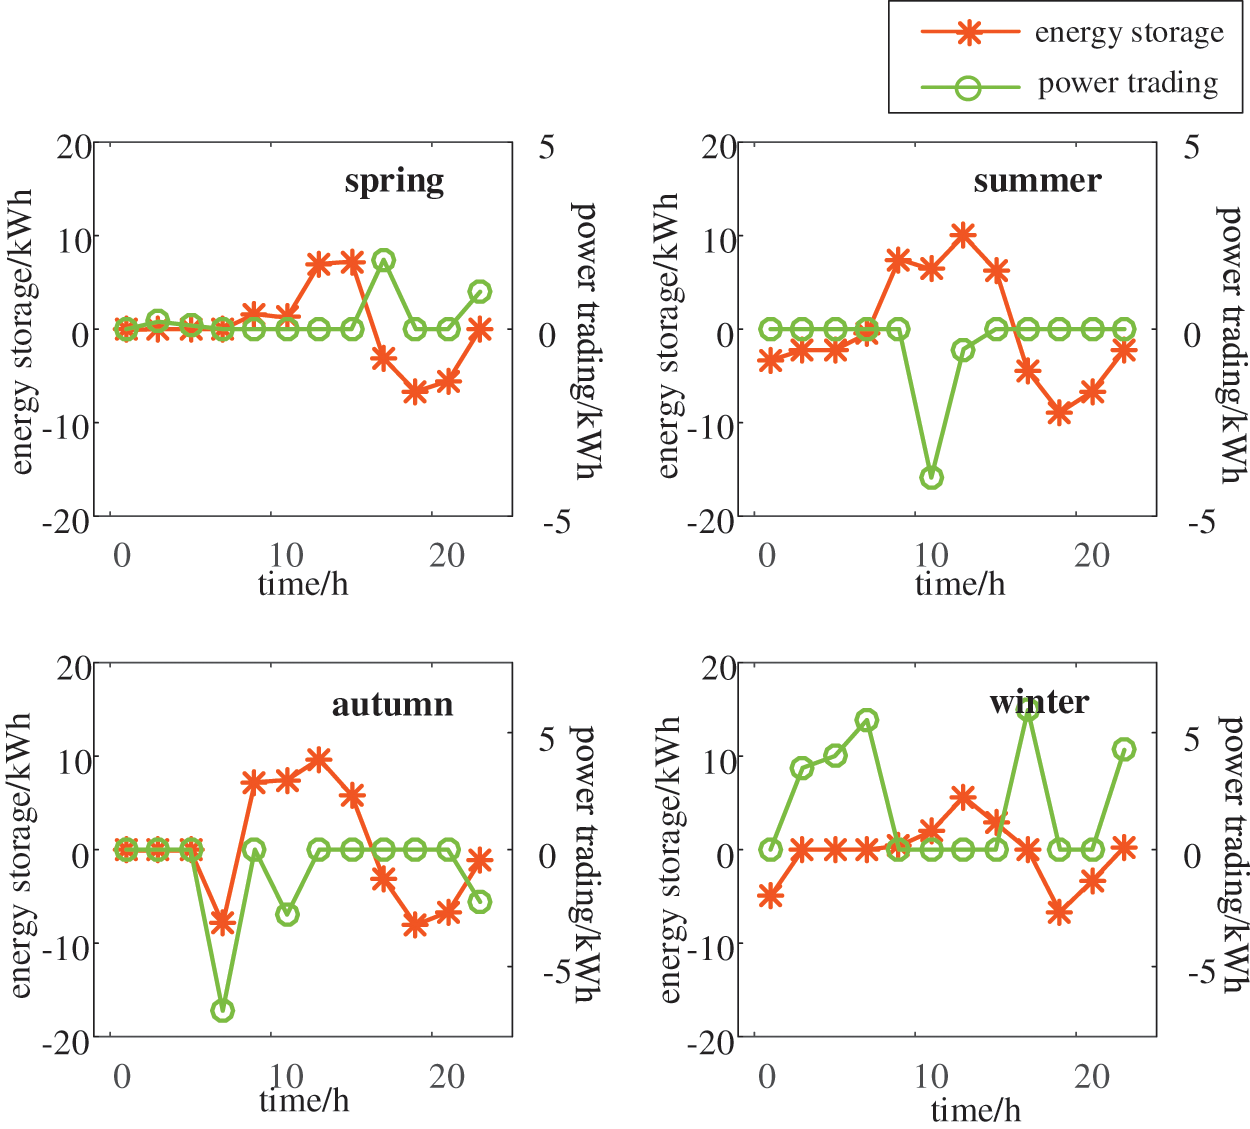
Figure 5: Optimal operation strategy (City A, residential building A1)
In this example, the PV module will be installed both on the sunrise side and roof; the combined benefit reaches 180,000 RMB, including a carbon trading income of 110,000 RMB. The capacity of the ESS should be at least greater than 11 MWh.
In Fig. 5, the left y-axis indicates the amount of charging/discharging electricity of the ESS, the right y-axis indicates the power trading strategy by PEFB. When the data is greater than 0, the ESS is charging or the system is purchasing electricity from the power grid. When the data is less than 0, the ESS is discharging or that the system is selling electricity to the power grid.
According to Table 2, it can be found that the combined benefit calculated by the proposed method is 340.1 RMB, including 290.0 RMB in carbon trading benefit. The house should be equipped with about 79 m2 PV modules at the optimal tilt angle on the roof, while no PV modules are installed on the sunrise side. This is probably because the sunrise side is less efficient in generating electricity, and the maximum area of the roof that can be equipped with PV modules is much larger than the optimal area of PV module installation required for this building, so there is no need to install PV modules on the sunrise side. The ESS capacity should be at least 30 kWh.
4.2 Optimal Operation for Commercial Building
This commercial building B1 is located in city B, which belongs to the hot summer and warm winter region. The picture of the building is shown in Fig. 6. The total floor area is 178,000 m2, the actual commercial area is 109,000 m2, the maximum PV area installed on the roof is 25,000 m2, and the sunrise side is 3,600 m2. The electricity load and local solar irradiance during the four typical days are shown in Fig. 7.
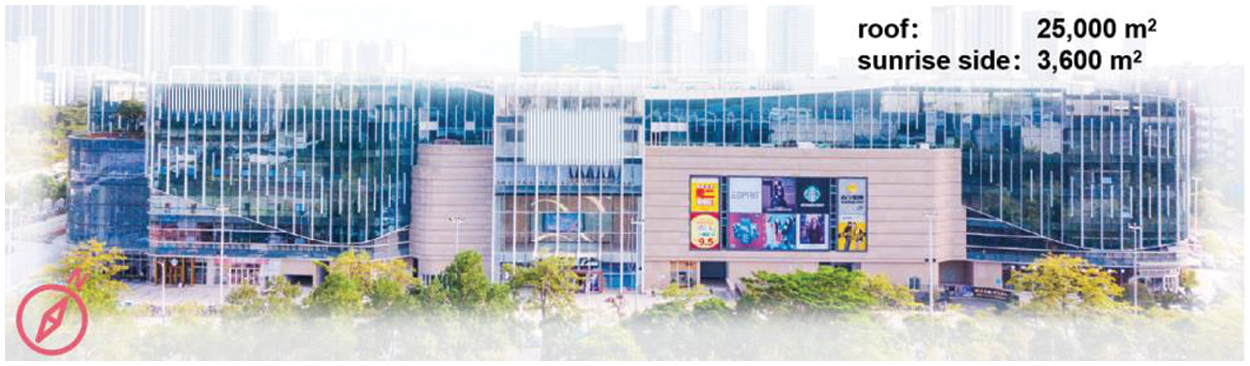
Figure 6: The commercial building B1
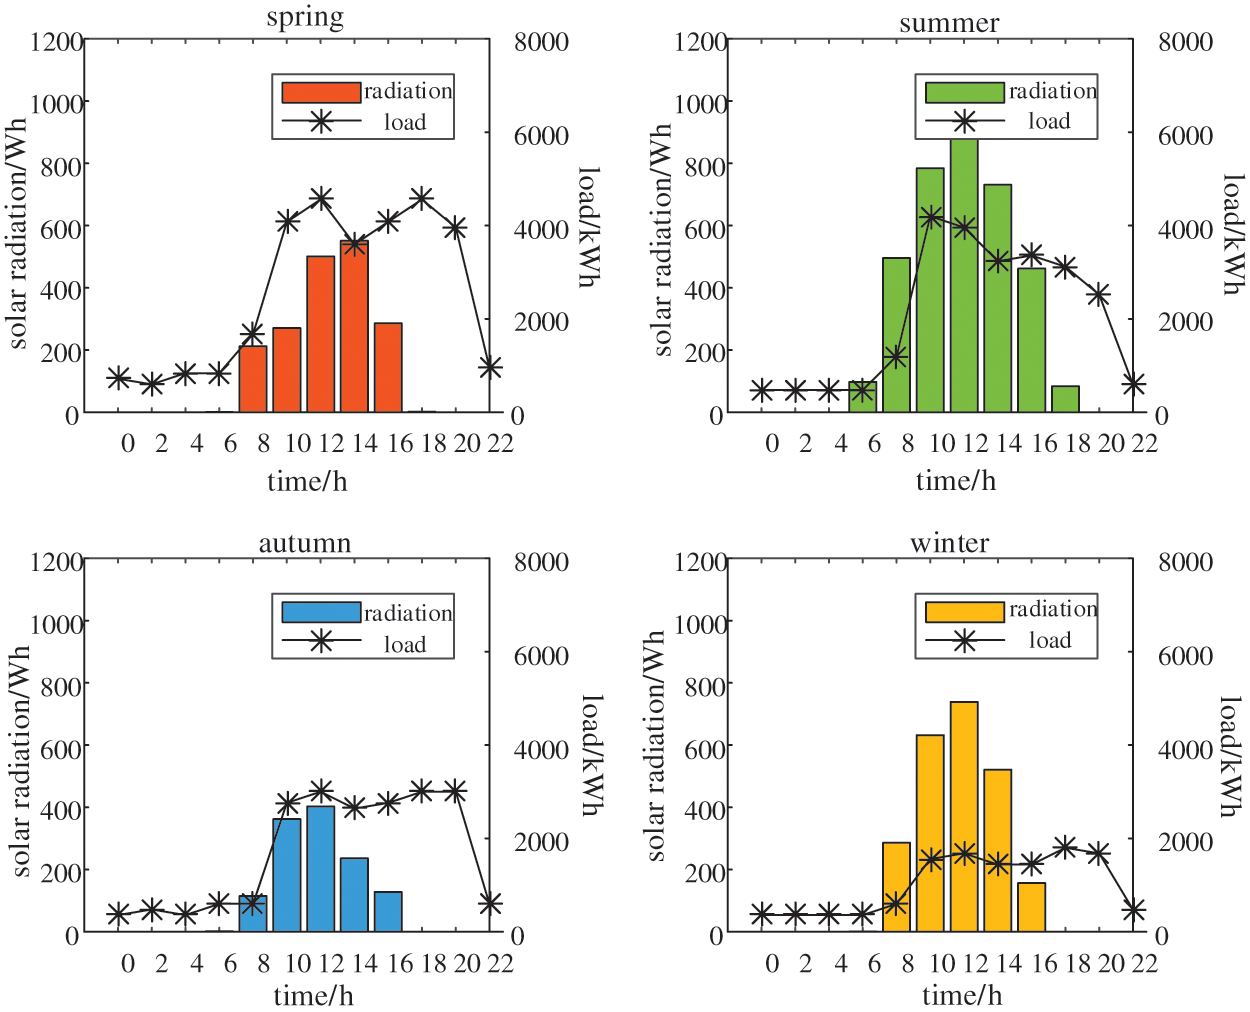
Figure 7: Average solar irradiance and electricity load (City B, residential building B1)
The load trend of the commercial building is similar to the trend of solar irradiance; the solar irradiance of city B is higher than that of city A as a whole. For an MW ESS (40-foot container), as an example, the maximum discharging power of a single system is 1 MW. Assuming that at least 10 ESSs can be connected, the maximum discharging/charging power is set as 10 MW in this paper. The clean energy penetration rate of the local grid is 25%. The carbon emission baseline of the commercial building is 501 gCO2/m2, and the carbon price is 380 RMB/t [34,35]. The optimization results of this building are shown in Table 3, and the optimal operation strategies (charging and discharging strategy, power trading strategy) are shown in Fig. 8.
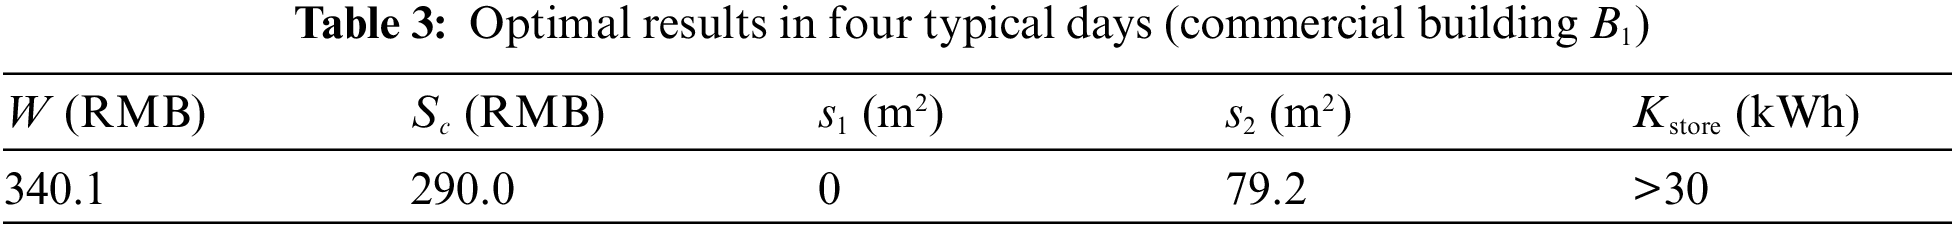
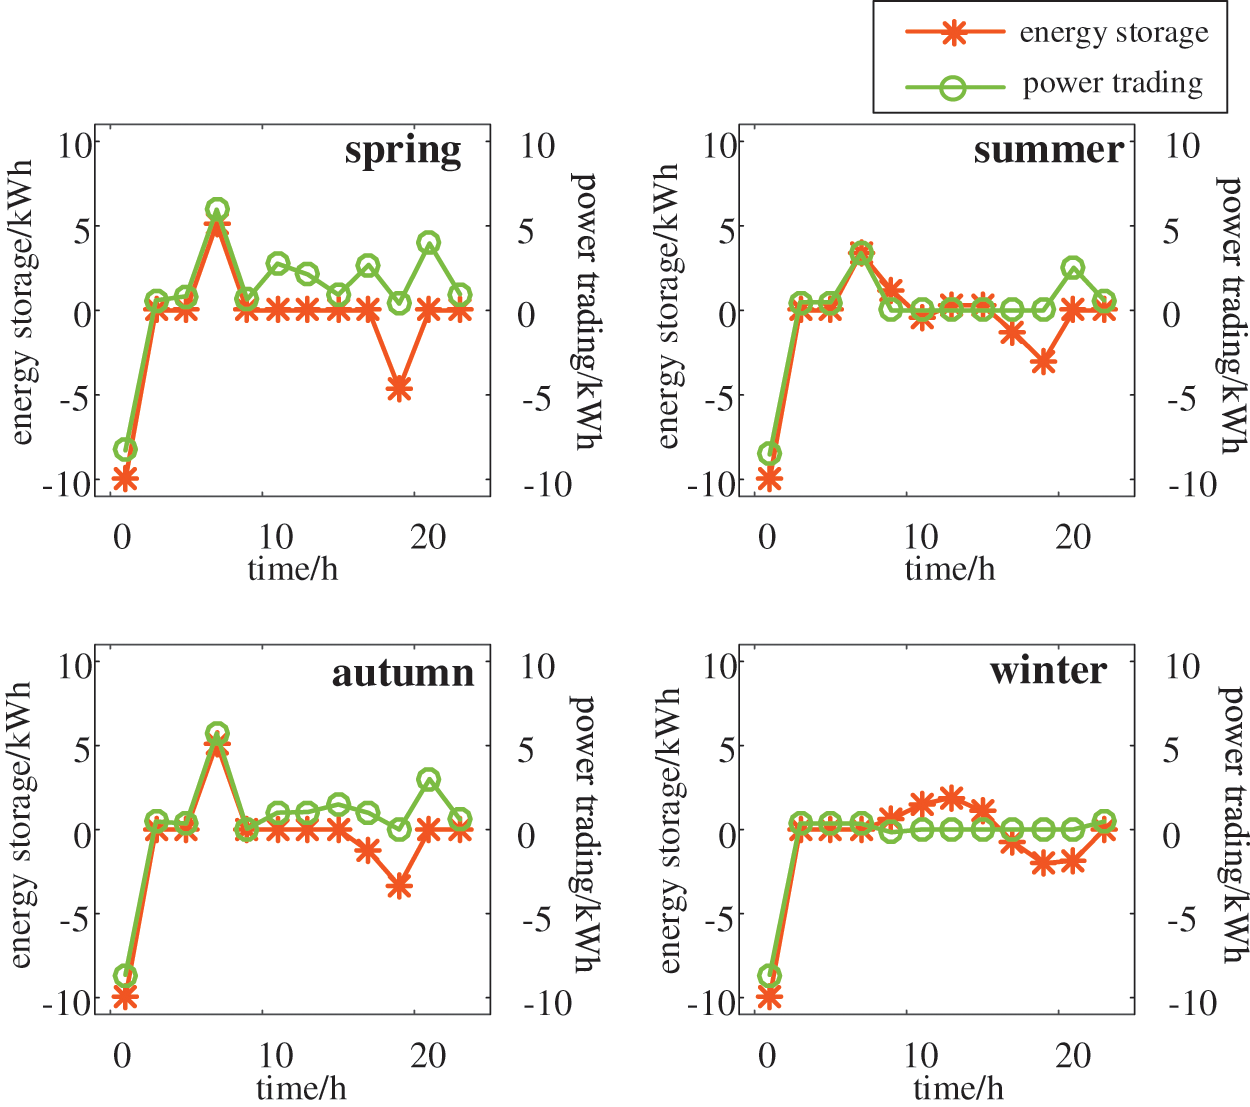
Figure 8: Optimal operation strategy (commercial building B1)
In this example, PV modules will be installed on the sunrise side and roof of the building with the maximum area, the combined benefit reaches 180,000 RMB, including 110,000 RMB in carbon trading revenue. The capacity of the ESS should be at least greater than 11 MWh.
4.3 Comparative Analysis for Different Carbon Trading Conditions
This section takes residential buildings as an example for detailed analysis. Considering that the current carbon trading policy is not yet perfect for an individual to participate, the carbon emission baseline for four typical days of a residential building in this paper is set as 581 gCO2/m2, or 131 gCO2/m2, according to existing references [34,35]. In 2021, the average carbon price in China will be about 50 RMB/t, and in Europe, it will be about 380 RMB/t. Therefore, four groups of optimization results can be obtained in Table 4; the proportion of carbon trading benefit in the combined benefit is shown in Fig. 9.
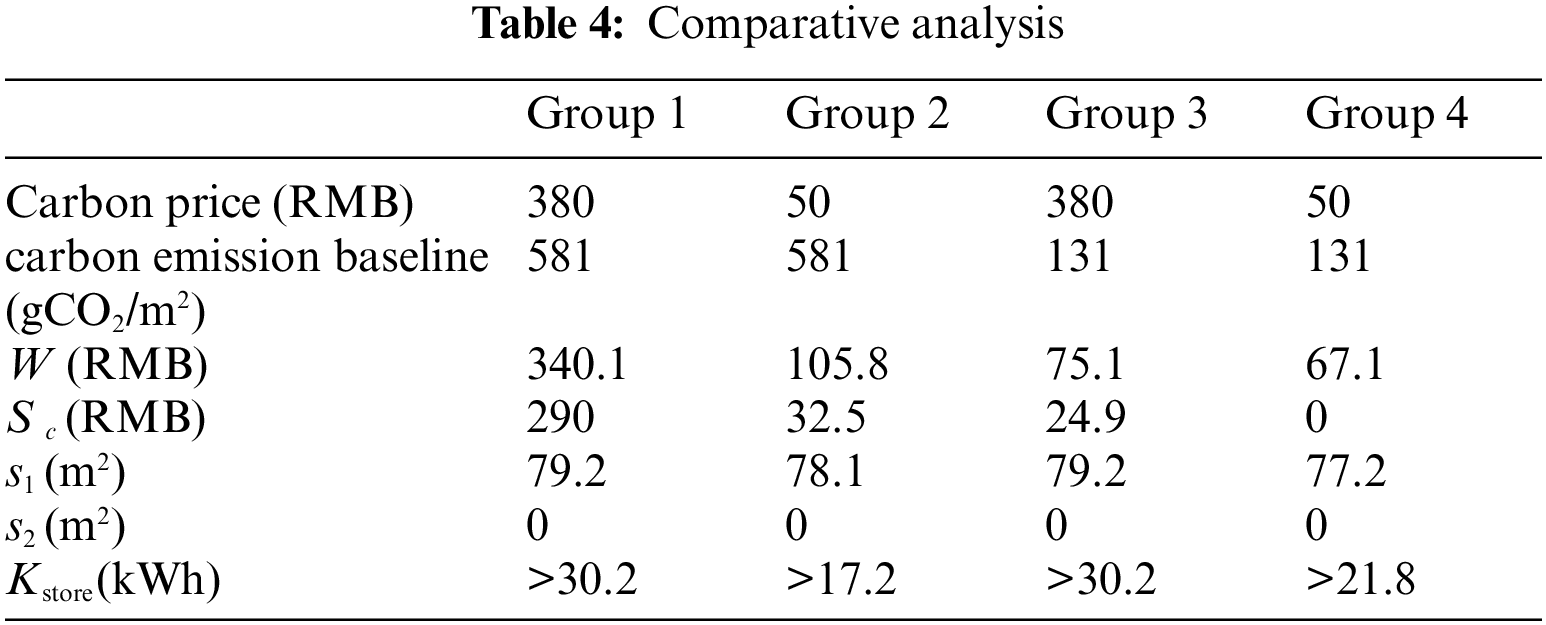
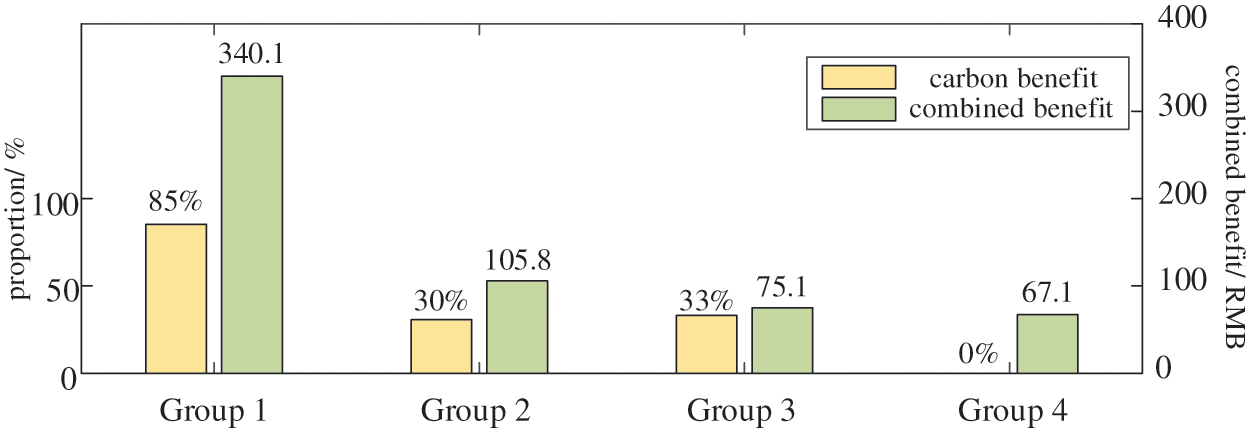
Figure 9: Proportion of carbon trading benefit
In Table 4 and Fig. 9, group 1 belongs to the “high carbon price + high carbon emission baseline” and it achieves the largest proportion of carbon trading benefit and the highest combined benefit. Groups 2 and 3 belong to “low carbon price + high carbon emission baseline” and high carbon price + low carbon emission baseline,” respectively; the corresponding combined benefit and carbon trading benefit are in the middle. Group 4 belongs to the “low carbon price + low emission baseline,” which has the lowest carbon trading benefit and combined benefit.
From the perspective of carbon reduction and environmental protection, the carbon emission baseline should be as low as possible. In contrast, the carbon price responds to the supply and demand of the real market. The specific value should not only be determined based on the actual carbon emission level but also needs to balance the current situation of the local carbon market, public acceptance, and other factors. Based on the analysis of this paper, the higher the carbon price and the higher the carbon emission baseline, the greater the benefit for PEFB users and the greater the promotion of establishing new energy buildings.
This study focuses on an optimal operation strategy considering carbon trading of PV modules, ESS, and a flexible building power systems (PEFB). Taking the combined benefit as the main optimization objective then, the overall optimal operation strategy of the building is calculated, which includes the optimal allocation results of the PV modules and ESS capacity, the operation of power trading with the power grid, and the ESS. A case study is conducted to demonstrate the effectiveness of the proposed method, and the following conclusions can be drawn.
(1) The proposed method has combined the optimized conditions of energy-efficient building and building microgrid together to obtain a better operation strategy for PEFB. It not only saves building users’ electricity costs but also increases the overall revenue.
(2) The conditions of carbon trading impact the combined benefit for PEFB. When the carbon price and carbon emission baseline of buildings are higher, the building users can obtain a greater benefit, but the actual carbon trading value should be determined by integrating the current situation of the local carbon market and other factors.
Acknowledgement: The authors would like to thank the editors and the anonymous reviewers for their useful feedback that improved this paper.
Funding Statement: The authors acknowledges the support by Ministry of Housing and Urban-Rural Development’s Science and Technology Plan Project 2022 (Hubei Province).
Conflicts of Interest: The authors declare that they have no conflicts of interest to report regarding the present study.
References
1. Dong, F., Wang, Y., Su, B., Hua, Y. F., Zhang, Y. Q. (2019). The process of peak CO2 emissions in developed economies: A perspective of industrialization and urbanization. Resources, Conservation and Recycling, 141, 61–75. [Google Scholar]
2. Muhammad, U., Salah, A., Karam, A., Ibrahim, A. (2022). A low-cost, real-time rooftop IoT-based photovoltaic (PV) system for energy management and home automation. Energy Engineering, 119(1), 83–101. DOI 10.32604/EE.2022.016411. [Google Scholar] [CrossRef]
3. Zhang, L., Chen, Z., Zhang, H., Ma, Z. H. (2020). Accurate study and evaluation of small PV power generation system based on specific geographical location. Energy Engineering, 117(6), 453–470. DOI 10.32604/EE.2020.013276. [Google Scholar] [CrossRef]
4. Khan, J., Ali, R., Zubair, M. (2022). Energy and life cycle assessment of zinc/water nanofluid based photovoltaic thermal system. Energy Engineering, 119(2), 827–846. DOI 10.32604/ee.2022.016344. [Google Scholar] [CrossRef]
5. Pantic, S., Candanedo, L., Athienitis, A. K. (2010). Modeling of energy performance of a house with three configurations of building- integrated photovoltaic/thermal systems. Energy Build, 42(10), 1779–1789. [Google Scholar]
6. Maturi, L., Lollini, R. D., Moser, W. S. (2015). Experimental investigation of a low cost passive strategy to improve the performance of building integrated photovoltaic system. Solar Energy, 111(3), 288–296. DOI 10.1016/j.solener.2014.11.001. [Google Scholar] [CrossRef]
7. Tian, W., Wang, Y., Ren, J., Zhu, L. (2007). Effect of urban climate on building integrated photovoltaics performance. Energy Conversion and Management, 48(1), 1–8. DOI 10.1016/j.enconman.2006.05.015. [Google Scholar] [CrossRef]
8. Candanedo, L. M., Athienitis, A. K., Candanedo, J. A., O’Brien, W. (2010). Transient and steady state models for open loop air based BIPV/T systems. ASHRAE Transactions, 116(1), 600–612. [Google Scholar]
9. IEA-PVPS (2020). Snapshot of Global PV Markets 2020. https://iea-pvps.org/wp-content/uploads/2020/04/IEA_PVPS_Snapshot_2020.pdf. [Google Scholar]
10. Lu, N. (2012). An evaluation of the HVAC load potential for providing load balancing service. IEEE Transactions on Smart Grid, 3(3), 1263–1270. [Google Scholar]
11. Marilena, M., Geoge, D. S., George, T., Vikas, C. (2015). Incentives and targeting policies for automated demand response contracts. IEEE International Conference on Smart Grid Communications, pp. 557–562. Miami, USA. [Google Scholar]
12. Seo, J., Ju, J., Jin, Y. K., Jaejo, L. (2016). Automated residential demand response based on advanced metering infrastructure network. International Journal of Distributed Sensor Networks, 12(2), 1–10. [Google Scholar]
13. Faria, P., Vale, Z. (2012). A simulation tool for demand response programs implementation. 1st International Workshop on Information Technology for Energy Applications, pp. 25–28. Lisbon, Portugal. [Google Scholar]
14. John, E. F., Owen, L. P. (2019). Communication and metering equipment for electricity spot pricing. IEEE Transactions on Power Apparatus and Systems, 10(6), 1363–1369. [Google Scholar]
15. Hou, X., Wang, J., Huang, T., Wang, P. (2019). Smart home energy management optimization method considering energy storage and electric vehicle. IEEE Access, 7, 144010–144020. DOI 10.1109/ACCESS.2019.2944878. [Google Scholar] [CrossRef]
16. Ricardo, J. B., Manuel, A. M., Filipe, J. S., Joao, A. P. (2019). Optimized bidding of an EV aggregation agent in the electricity market. IEEE Transactions on Smart Grid, 3(1), 443–452. [Google Scholar]
17. Javadi, M. S., Gough, M., Mansouri, S. A., Amir, A., Emad, N. et al. (2022). A two-stage joint operation and planning model for sizing and siting of electrical energy storage devices considering demand response programs. International Journal of Electrical Power & Energy Systems, 138(5), 107912. DOI 10.1016/j.ijepes.2021.107912. [Google Scholar] [CrossRef]
18. Javadi, M. S., Kimia, F., Rezanejad, M., Mohamed, L., Matthew, G. et al. (2019). Optimal sizing and siting of electrical energy storage devices for smart grids considering time-of-use programs. 45th Annual Conference of the IEEE Industrial Electronics Society, 19241613. Lisbon, Portugal. [Google Scholar]
19. Javadi, M. S., Gough, M., Lotfi, M., Mohamed, L., Ali, E. N. et al. (2020). Optimal self-scheduling of home energy management system in the presence of photovoltaic power generation and batteries. Energy, 210, 118568. DOI 10.1016/j.energy.2020.118568. [Google Scholar] [CrossRef]
20. Javadi, M. S., Nezhad, A. E., Firouzi, K., Kimia, F., Farnoosh, B. et al. (2020). Optimal operation of home energy management systems in the presence of the inverter-based heating, Ventilation and air conditioning system. 2020 IEEE International Conference on Environment and Electrical Engineering and 2020 IEEE Industrial and Commercial Power Systems Europe, pp. 1–6. Madrid, Spain. [Google Scholar]
21. Javadi, M. S., Lotfi, M., Osorio, G. J., Abdelrahman, A., Ali, E. N. et al. (2020). A multi-objective model for home energy management system self-scheduling using the epsilon-constraint method. 2020 IEEE 14th International Conference on Compatibility, Power Electronics and Power Engineering, pp. 1–6. Setubal, Portugal. [Google Scholar]
22. Javadi, M. S., Ali, E. N., Pedro, H. J., Matthew, G., Mohamed, L. et al. (2021). Self-scheduling model for home energy management systems considering the end-users discomfort index within price-based demand response programs. Sustainable Cities and Society, 68(4), 102762. [Google Scholar]
23. Javadi, M. S., Gough, M., Ali, E. N., Sérgio, F. S., Miadreza, S. et al. (2022). Pool trading model within a local energy community considering flexible loads, photovoltaic generation and energy storage systems. Sustainable Cities and Society, 79(2), 103747. DOI 10.1016/j.scs.2022.103747. [Google Scholar] [CrossRef]
24. Lotfi, M., Almeida, T., Javadi, M. S., Gerardo, J. O., Monteiro, C. et al. (2022). Coordinating energy management systems in smart cities with electric vehicles. Applied Energy, 307(4), 118241. DOI 10.1016/j.apenergy.2021.118241. [Google Scholar] [CrossRef]
25. Özkan, H. A. (2015). A new real time home power management system. Energy and Buildings, 97(2), 56–64. DOI 10.1016/j.enbuild.2015.03.038. [Google Scholar] [CrossRef]
26. Shakeri, M., Mohsen, S., Hamza, A., Salim, R. (2017). An intelligent system architecture in home energy management systems (HEMS) for efficient demand response in smart grid. Energy and Buildings, 138, 154–164. DOI 10.1016/j.enbuild.2016.12.026. [Google Scholar] [CrossRef]
27. Li, X., Thillainathan, L., van, P., Wai, L. W. (2018). Implemented IoT based self-learning home management system (SHMS) for Singapore. IEEE Internet of Things Journal, 5(3), 2212–2219. DOI 10.1109/JIOT.2018.2828144. [Google Scholar] [CrossRef]
28. Khalid, A., Javaid, N., Guizani, M., Musaed, A., Khursheed, K. et al. (2018). Towards dynamic coordination among home appliances using multi-objective energy optimization for demand side management in smart building. IEEE Access, 6, 19509–19529. DOI 10.1109/ACCESS.2018.2791546. [Google Scholar] [CrossRef]
29. Rezaee, J. A. (2019). Enhanced leader particle swarm optimisation (ELPSOA new algorithm for optimal scheduling of home appliances in demand response programs. Artificial Intelligence Review, 53(3), 2043–2073. DOI 10.1007/s10462-019-09726-3. [Google Scholar] [CrossRef]
30. Zhai, S., Wang, Z., Yan, X., Guanyu, H. (2019). Appliance flexibility analysis considering user behavior in home energy management system using smart plugs. IEEE Transactions on Industrial Electronics, 66(2), 1391–1401. DOI 10.1109/TIE.2018.2815949. [Google Scholar] [CrossRef]
31. Haghifam, S., Mojtaba, D., Kazem, Z., Heresh, S. (2020). Optimal operation of smart distribution networks in the presence of demand response aggregators and microgrid owners: A multi follower Bi-Level approach. Sustainable Cities and Society, 55, 102033. DOI 10.1016/j.scs.2020.102033. [Google Scholar] [CrossRef]
32. Duman, A. C., Erden, H. S., Ömer, G., Önder, G. (2021). A home energy management system with an integrated smart thermostat for demand response in smart grids. Sustainable Cities and Society, 65(1), 102639. DOI 10.1016/j.scs.2020.102639. [Google Scholar] [CrossRef]
33. Wang, Y., Zhou, S., Yao, Z., Xunmin, O. (2021). Life cycle modeling analysis of the interaction between carbon dioxide and air pollutant emissions of coal power in China. Electric Power, 54(8), 128–135. [Google Scholar]
34. Li, Y., Hu, J., Liu, J. (2010). Allowance benchmarking analysis of building industry for the shanghai emission trading pilot. Environment and Sustainable Development, 44(3), 132–136. [Google Scholar]
35. Ying, S. (2020). Research on allocation of carbon emission quotas of urban public buildings in China (Master Thesis). Beijing Jiaotong University, China. [Google Scholar]
36. Ministry of Ecology and Environment of the People’s Republic of China (2004). China: China Environmental Science Press. [Google Scholar]
37. Trinasolar. https://www.trinasolar.com/cn/product. [Google Scholar]
38. LONGi. https://www.longi.com/en/. [Google Scholar]
39. Tesla Powerwall. https://www.tesla.com/powerwall. [Google Scholar]
40. Envision. https://www.envision-group.com/. [Google Scholar]
Cite This Article
 Copyright © 2023 The Author(s). Published by Tech Science Press.
This work is licensed under a Creative Commons Attribution 4.0 International License , which permits unrestricted use, distribution, and reproduction in any medium, provided the original work is properly cited.
 Downloads
 Citation Tools