
 Submit a Paper
 Propose a Special lssue
 Open Access
ARTICLE

Numerical Simulation of Contamination Accumulation Characteristics of Composite Insulators in Salt Fog Environment
Department of Energy, Power and Mechanical Engineering, North China Electric Power University, Baoding, 071003, China
* Corresponding Author: Zeze Chen. Email:
Energy Engineering 2023, 120(2), 483-499. https://doi.org/10.32604/ee.2023.023649
Received 07 May 2022; Accepted 11 July 2022; Issue published 29 November 2022
 View Full Text
 Download PDF
Abstract
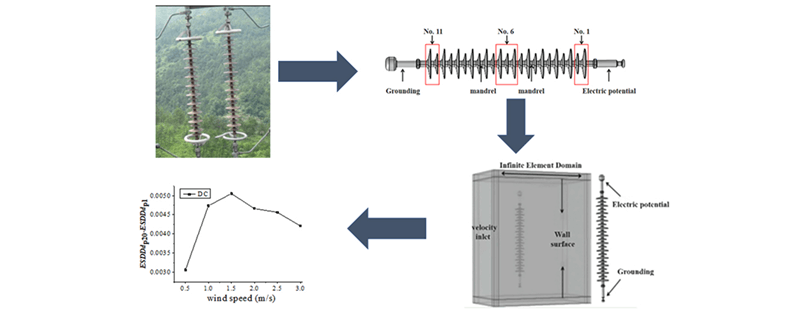
To investigate the fouling characteristics of the composite insulator surface under the salt fog environment, the FXBW-110/120-2 composite insulator was taken as the research object. Based on the field-induced charge mechanism, the multi-physical field coupling software COMSOL was used to numerically simulate the fouling characteristics, explored the calculation method of ESDD, and demonstrated its rationality. Based on this method, the pollution characteristics of the composite insulator under the pollution fog environment were studied, and the influence of wind speed, droplet size, and voltage type on the pollution characteristics of the composite insulator was analyzed. The results showed that: with the increase in wind speed, the amount of accumulated pollution of insulator increases in the range of droplet size, and the relationship between wind speed and accumulated pollution is approximately linear; at the same wind speed, the amount of accumulated pollution increases with the increase of droplet size under the action of DC voltage; when there is no voltage, the amount of dirt on the upper surface of the insulator is more than that on the lower surface, while it is the opposite under DC voltage.Graphic Abstract
Keywords
Insulation is an important part of overhead transmission lines, and its insulation performance is directly related to the safe and stable operation of power systems [1–3]. In recent years, haze weather has been frequent in China. When haze occurs, it not only increases the air humidity but also increases the concentration of pollutants in the air. Among them, the soluble salt content of insulator surface pollution is one of the main factors affecting the insulation performance of transmission line insulators, which will affect the safe operation of insulators [4–7]. Salt fog is a kind of fog with high electrical conductivity and contains many kinds of soluble salts. Compared with the smog environment, the frequency of transmission line pollution flashover accidents in a foggy environment is higher. Compared with the haze environment, the frequency of pollution flashover accidents of transmission lines in the smog environment is higher. Therefore, it is of great practical significance to study the pollution deposition characteristic of insulators under the pollution fog environment.
Domestic and foreign scholars have conducted extensive research on insulator fouling characteristics and obtained a lot of research results. Li [8] summarized the physical and chemical characteristics of fog in China for 40 years since 1958, and the results showed that: The water content of the fog was primarily in the range of 0.1~0.5 g/cm3; The density of fog droplets (in urban areas) was approximately 102~103 number/cm3; The droplet size was primarily concentrated in the range of 2~10 μm, and the number of droplets with a diameter of 3~4 μm was the largest, but the maximum diameter of the droplet could reach 50 μm.
However, there are few studies on pollution accumulation characteristics of insulators in salt fog environments. Wang et al. [9,10] compared the effects of clean fog and fog environment on flashover voltage of composite insulators and found that the flashover voltage changed greatly under fog conditions. Huang [11] explored the influence of haze environment on the state of insulators, and the research showed that the aging of composite insulators was aggravated and the flashover voltage was decreased under haze environments. Zhang et al. [12–15] studied the flashover voltage of insulator surfaces under different fog conductivity was measured by a self-built artificial haze test platform. They found that the flashover voltage of insulator decreased with the increase of salt density, which was primarily due to the positive correlation between fog conductivity and salt density of insulator surface. Sun et al. [16] studied the influence of insulator types on pollution accumulation characteristics under natural pollution conditions and found that the pollution of composite insulators under haze conditions was more serious than that of porcelain and glass insulators. Liu et al. [17] studied the influence of haze environment on the pollution accumulation characteristics of composite insulators. The results show that the greater the environmental humidity, the greater the surface salt density (ESDD) of the insulator. Meng et al. [18] used the self-built haze platform to study the composite insulator and obtained the conclusion that haze concentration and particle diameter had a significant impact on the pollution distribution of the flange. Tang et al. [19] explored the pollution accumulation characteristics of composite insulators through an artificial haze experimental platform, and the research showed that the wind speed had a terrific influence on the pollution accumulation characteristics of insulators.
In recent years, numerical simulation has been widely used because of its advantages of the short research cycle, low cost, and the influence of single factor on the pollution accumulation characteristics of insulators. Yang et al. [20] studied the influence of wind angle on insulator contamination by numerical simulation, and compared the results through experiments. The results showed that the numerical simulation results could better reflect the contamination status of insulator surface. Ren et al. [21] used numerical simulation software to explore the influence of particle size and voltage type on the amount of pollution. The results show that compared with AC voltage, DC voltage has more pollution. Lv et al. [22–24] simulated the influence of wind speed, particle charge, and voltage level on the pollution characteristics of insulator, and compares the results with the wind tunnel test results. The results show that the simulation results achieve acceptable reliability.
Most of the previous studies on the fouling characteristics of insulators under the environment of pollution fog were based on the experiments of natural fouling and artificial simulation, but the research on the fouling characteristics of insulators under the environment of pollution fog was based on the numerical simulation were rare, especially the research on the numerical simulation with the salt density as the evaluation index of the fouling characteristics was rarely reported. In this study, the composite FXBW-110/120-2 insulators commonly used on power transmission lines are taken as the research object, and the equivalent salt density is used as the evaluation index of the pollution characteristics. Multi-physics coupling software is used to simulate its pollution characteristics to analyze different wind speeds of the particle size, droplet size, and voltage type on the fouling characteristics of insulators.
2 Mathematical Model and Analysis of Particle Charge Mode
2.1 Mathematical Model and Control Equation of Flow Field
According to the principle of viscous fluid mechanics, it can be considered that the air around the insulator is an incompressible viscous fluid. Considering the relatively complex shape of the insulator, the streamline is prone to bend when the air flows through, so the incompressible turbulent RANS k-ε model is adopted [25]. The control equations are expressed in Eq. (1) [26].
where U is the velocity of the flow field, m/s; I is the principal stress tensor, Pa; μ and μT are respectively the dynamic viscosity of the air and turbulent dynamic viscosity, Pa·s; ρ is the air density, kg/m3; F is the volume force, N/m3; k is the turbulent kinetic energy, m2/s2; ε is the turbulent dissipation rate, m2/s3; Cμ is viscosity coefficient; σk, σε, Cε1, and Cε2 are the parameters of the turbulence model, and Pk is the turbulent energy term, W/m3.
2.2 Mathematical Model and Control Equation of Electric Field
In the electric field module, the steady-state analysis of the DC electric field is used. The control equations of the module are [27]:
where E is the space electric field intensity, V/m; D is the electric displacement intensity, C/m2; V is the potential, V; ε′0 is the relative permittivity and is material related; ε0 is the vacuum permittivity, 8.8541878 × 10⁻¹² F/m; ρv is the volume charge density, C/m3.
2.3 Mathematical Model and Control Equation of Particle Field
The mass fraction of droplet particles in the air is approximately 10−1 g/m3 [8], and the mass carrying rate of other kinds of particles in the air is also far less than 10%. Therefore, the particles suspended in the air are quite sparse and have obvious discrete properties. The interaction between particles is pretty tiny, so the interaction between particles can be ignored. In addition, to simplify the calculation, the following assumptions and simplifications are made for the droplets:
1. The droplets exist as spherical droplets, which do not agglomerate and decompose in the process of motion, so the diameter of droplets remains unchanged;
2. In the process of droplet movement, the parameters of air medium such as temperature, viscosity, and density remain unchanged;
3. The initial velocity of the droplet is equal to that of the free flow, and the effect of the droplet on the airflow field is ignored. So, the governing equation of droplet motion is.
Before the contamination particles move to the insulator surface, they are primarily affected by gravity, electric field force, and fluid drag force. In contrast, other forces can be ignored. Then, the droplet motion control equation is [28]:
where mp is the droplet mass, kg; v is the droplet velocity, m/s; t is the droplet movement time, s; Ft is the resultant force of particles, N; Fd, Fg, Fe are fluid drag force, gravity and electric field force, N; τp is the response time of droplets in the flow field ; ρp is the droplet density; dp is the droplet diameter; U is the velocity of the flow field, m/s; μ is the aerodynamic viscosity; e is the electric quantity of metachrge; Z is the droplet charge.
2.4 Charging Mode of Polluted Particles
Most of the particles in the atmosphere are charged. The charge and polarity of polluted particles are closely related to their physical properties and external environment. The main charging mechanisms of particles are corona charging, crushing charging, and contact charging. According to the charging mechanism, corona charging can be divided into two kinds: field charging and diffusion charging. Field charging is how ions make a directional motion under the action of electrostatic force and collide with particles. The diffusion charge is the primary charge when the particle diameter is less than 0.2 μm, and the field charge is primarily when the particle diameter is greater than 0.2 μm [29]. In this study, we primarily study the charging mode of microdroplets, so the field charging mode is more practical.
Given the charge of the droplet around the composite insulator, it can be approximately considered that the droplet is in a uniform electric field in a microelement, and the electric field intensity is E0. Assuming that the particles are initially uncharged, the electric potential Φr at a certain position on the outer surface of the particles is generated by the interaction of the external electric field E0 and the dipole moment M0 formed by the polarization of the particles in the electric field. The calculation equations of field charge saturation are as follows:
where M0 is the dipole moment produced by the polarization of droplets in an electric field, C·m; θ0 is the angle between the droplet surface position and the external electric field line, °; r is the distance from the center of the droplet, cm; ε0 is the dielectric constant of the vacuum; ε1 is the dielectric constant of the droplet; Ep is the polarization electric field strength inside the droplet, V/m; Qmax is the saturated charge of the droplet, C; τq is the charging time constant, generally 10−2~10−3, s; t is the Charge time for the droplets, s; εr is the relative dielectric constant of the droplet, εr = ε1/ε0.
When the dielectric constant ε1 = 80, the saturated charge of a 1~20 μm droplet under a 10 kV/m electric field is shown in Fig. 1.
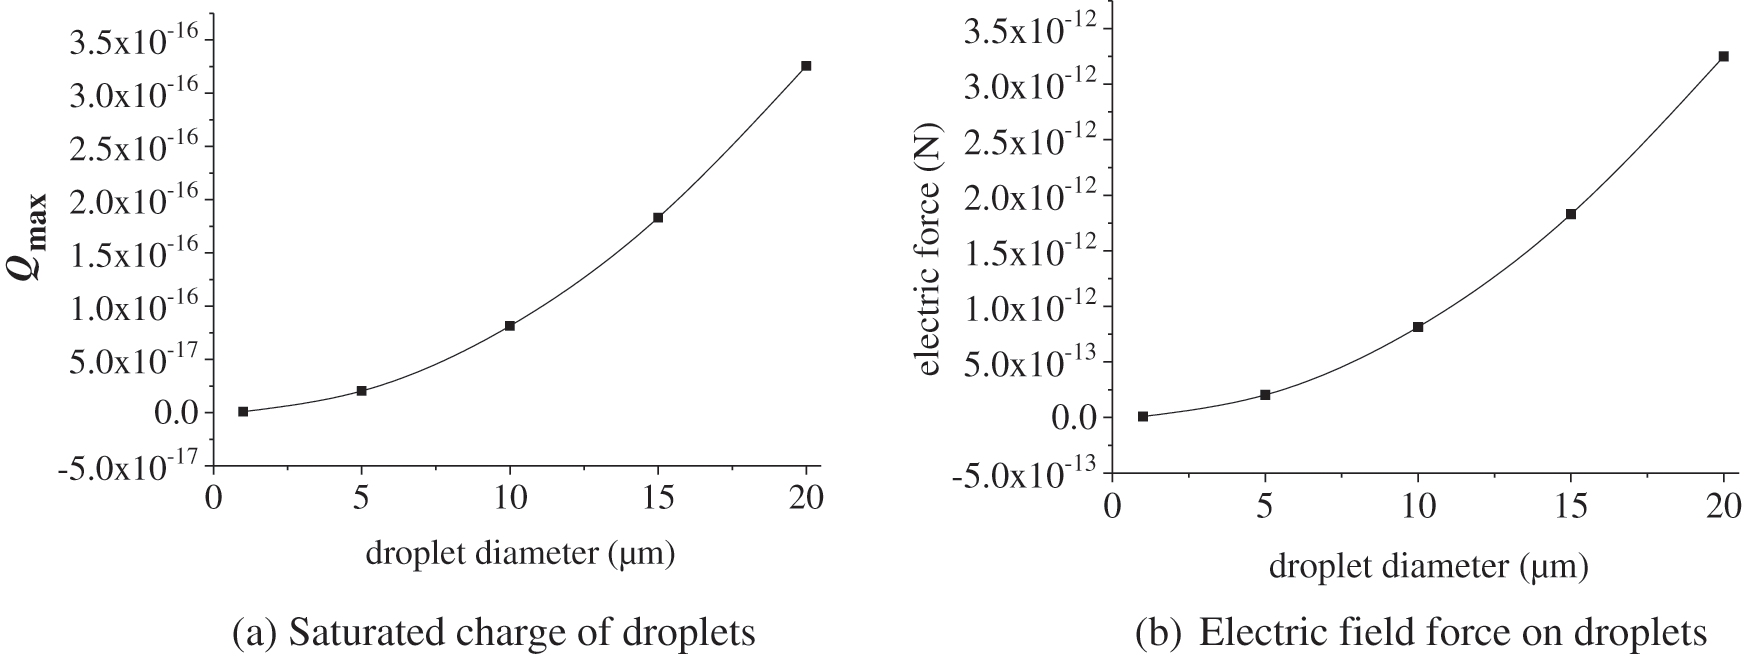
Figure 1: Relationship between the saturated charge of droplets and particle size at 10 kV/m
It can be seen from Fig. 1a that the saturated charge of the droplet increases with the increase of the droplet size, and the saturated charge is proportional to the square of the droplet size. It can be seen from Fig. 1b that under the electric field strength of 10 kV/m, the electric field force of the droplet increases with the increase of its particle size, and is proportional to the square of its particle size. The comparison between Figs. 1a and 1b show that the saturated charge of the droplet and the electric field force acting on the droplet are consistent with the droplet size.
3 Establishment of a Physical Model for Pollution Accumulation of Composite Insulators
3.1 Establishment of a Physical Model and Grid Generation
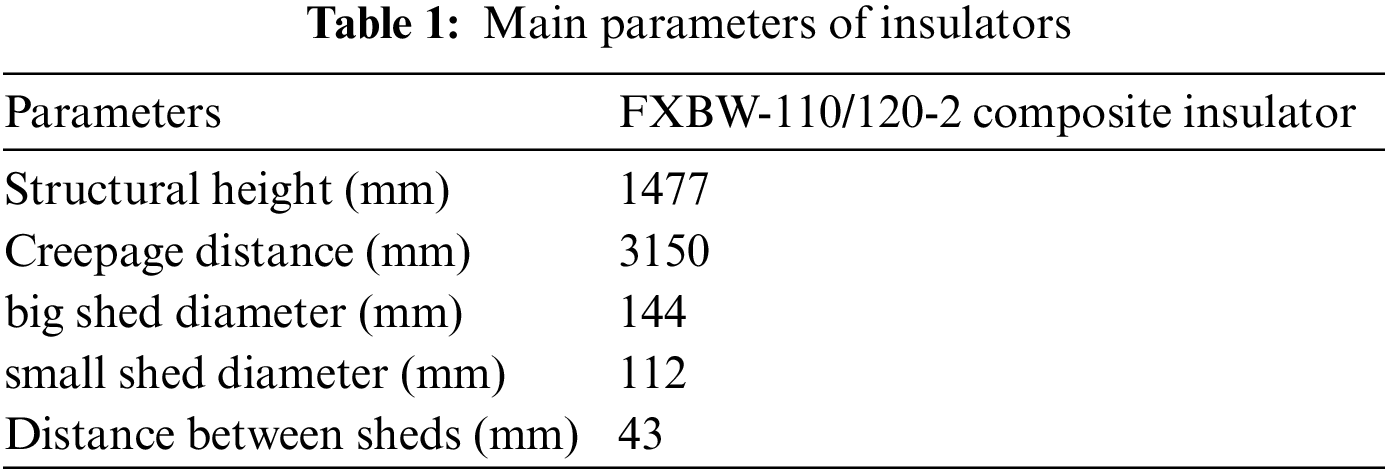
Modeling is established according to the structural parameters of the FXBW-110/120-2 composite insulator provided by the manufacturer, as shown in Fig. 2, and the specific geometric parameters are shown in Table 1.
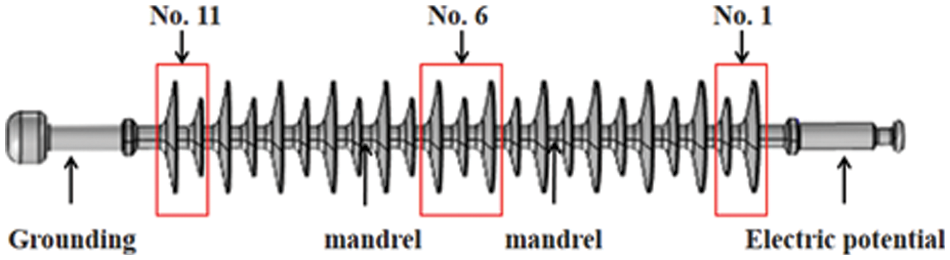
Figure 2: Composite insulator three-dimensional model
The full development of the flow field can truly reflect the flow field distribution near the composite insulator. Therefore, the calculation domain of the cuboid with the size of 2.2 m × 1.2 m × 2.0 m is established in the software. At the same time, a virtual region (infinite element domain) with a thickness of 100 mm is constructed outside the cuboid, whose outer boundary is the absorbing boundary of electromagnetic waves. It can more accurately simulate the electric field distribution around the insulator. After the grid-independence verification, when the number of grids is approximately 940,000, the influence of calculation accuracy and calculation time can be weighed well. The physical model and grid division are shown in Fig. 3 droplet diameter.
Figure 3: Composite insulator fouling simulation physical mode
3.2 The Setting of Single Value Condition
1) Setting of boundary conditions
Consider the turbulent flow field as a time-averaged steady flow. In the flow field, the inlet end is set as the velocity inlet and the outlet side is set as the pressure outlet; In an electric field, the “infinite element domain” is set as the default electrical insulation boundary condition. In the electric field, the fittings on the No. 1 umbrella skirt of the insulator are set as the high voltage end, and the fittings on the No. 11 umbrella skirt of the insulator are set as the grounding end. From the inlet, the droplets are released into the air duct in the form of transient release, and the inlet velocity is the same as the initial velocity of the flow field. Set the wall condition of the insulator to be adhesive, which means that the droplet will adhere to the insulator when it comes into contact with the insulator.
2) Setting of material parameters
The material of metal fittings at the high voltage end and grounding end of the composite insulator is set to aluminum alloy CZ42; The insulator material other than fittings is set as silicone rubber; Set the material of insulator outer area (including infinite element area) as air. The specific parameters of the material are shown in Table 2.
3.3 Calculation Basis and Evaluation Index of Accumulated Pollution
Lu [30] performed an experimental study on the platform of artificial haze. The haze environment under experimental conditions was formed by the combination of a fog environment simulated by salt solution with certain conductivity and a haze environment simulated by diatomite, talc powder, and so on. The results showed that: (1) compared with haze, fog played an important role in salt density; (2) there was a positive correlation between the salt density and environmental humidity. When the humidity reached 99%, the salt density increased obviously. In the haze environment, the salt density was approximately 10−3 mg/cm2 after 12 h of pollution accumulation; (3) the salt density was positively correlated with the fog-water conductivity, that is, the greater the fog-water conductivity, the greater the salt density. Therefore, it is reasonable to use the fog-water conductivity (determined by salt content) to measure the amount of insulator pollution caused by droplet deposition in salt fog. In this study, the equivalent salt density can be calculated by the relationship between the conductivity of the fog and the salt density.
Given the pollution fog dissolved with many kinds of salt ions, the salt content of sole one kind of salt-containing sole NaCl under the same conductivity is selected. The corresponding relationship (empirical value) between salt content (NaCl) and fog-water conductivity is shown in Table 3.
In this study, the equivalent salt density of the insulator surface is used as the evaluation index of insulator surface contamination in salt fog environment. ESDD (mg/cm2) should be converted to the amount of dirt deposited per unit area of the insulator surface (i.e., equivalent salt density) within a specified period using the Eq. (5)
where n is the total number of droplet deposition on the umbrella skirt surface, which can be obtained directly in the software; η is the mass fraction of salt in the droplet; mp is the mass of the single-particle, mg; ts is the duration of pollution accumulation in simulation test (the total duration of pollution accumulation in salt fog condition), h; tp is the duration of pollution accumulation simulation, h; S is the surface area of insulator, cm2.
4 Analysis of Simulation Results of Insulator Fouling Characteristics in Salt Fog Environment
It is known from reference [8] that the range of liquid water content in salt fog environment is generally of the order of 10−1 g/m3, the electrical conductivity of salt fog is in the range of 1000~3000 μS/cm, the average particle size of droplets is approximately 5~10 μm, and the value of wind speed is less than 3 m/s. According to the characteristics of the salt fog environment, the conductivity of salt fog is 2000 μS/cm, the fog water content is 0.1 g/m3, and the fouling time is 10 h.
The simulation results show that the equivalent salt density range is 0.004~0.027 mg/cm2, which is in good agreement with the experimental results in reference [30]. It is verified that the equivalent salt deposit density (ESDD) is used as the evaluation index of pollution accumulation characteristics and the rationality of its calculation method.
4.1 Analysis of the Influence of Wind Speed on Fouling Characteristics
Based on the whole volume pollution of the insulator surface, the influence of wind speed range (0.5, 1, 1.5, 2, 2.5, 3) m/s on the pollution accumulation characteristics of the composite insulator is analyzed.
Under different particle sizes, the curve of the whole volume pollution on the insulator surface with the wind speed is shown in Fig. 4.
Figure 4: Relationship between deposition amount and wind speed under different droplet sizes
It can be seen from Fig. 4 that with the increase of wind speed, the amount of fouling in each particle size range of droplets increases, and the wind speed and the amount of fouling are approximately linear. The reason is that when the concentration of environmental droplets is constant, the increase in wind speed will cause more droplets to blow near the insulator in a unit of time, so the amount of pollution will be larger, which is consistent with the reality.
As shown in Fig. 4, when the droplet size is 1 μm, the amount of fouling accumulated under the two voltage types is virtually the same; with the increase of droplet size, the amount of fouling under DC voltage gradually exceeds that without voltage, and the difference is more and more obvious. The results show that when the droplet size is small, the electric field force of the droplet is less than the fluid drag force and gravity. At the same time, with the increase of particle size, the electric charge of the droplet increases, so the effect of electric field force is increasingly obvious.
4.2 Analysis of the Influence of Droplet Size on Fouling Characteristics
Under different wind speeds, the change of insulator fouling volume with droplet size is shown in Fig. 5. Whether under DC voltage or no voltage, the variation trend of fouling amount with droplet size is similar. When there is no voltage effect, the effect of droplet size on the amount of accumulated pollution is not obvious. The amount of accumulated pollution decreases with the increase of droplet size, but the decrease range is not significant. Under the action of DC voltage, the amount of accumulated pollution increases with the increase of particle size, but the increasing speed of accumulated pollution varies with different wind speeds.
Figure 5: Relationship between deposition amount and droplet size under different wind speeds
Fig. 6 shows the variation of the difference between the accumulated pollution and the wind speed when the droplet size is 20 and 1 μm under the action of DC voltage.
Figure 6: Relationship between deposition amount and wind speed under DC voltage
From Fig. 6, it can be seen that the different of fouling amount (ESDDdp20-ESDDdp1) increases at first and then decreases with the increase of wind speed when the droplet size is 20 and 1 μm, and there is a peak value when the wind speed is 1.5 m/s. The reasons are as follows: in the case of small wind speed, the electric field force plays a leading role; with the increase of wind speed, the electric field force changes little, but the effect of fluid drag force is strengthened. Therefore, the number of fog droplets settling on the insulator umbrella surface due to the action of electric field force is reduced, and it can be seen that the combined action of drag force and electric field force leads to this changing trend.
4.3 Analysis of the Influence of Voltage Type on Pollution Characteristics
The effect of electric field force in the process of pollution accumulation cannot be ignored, so it is more intuitive to understand the influence of electric field force on the characteristics of insulator pollution accumulation by analyzing the pollution accumulation on the upper and lower surfaces of insulator. Fig. 7 shows the variation of pollution on the surface area of the insulator with wind speed under the action of different voltage types.
Figure 7: Relationship between the deposition amount of the upper and lower surface area of the insulator and wind speed
It can be seen from Fig. 7 that under the action of different voltage types, the pollution on the upper and lower surface areas of the insulator increases with the increase of wind speed, and the pollution accumulation is approximately linear with the wind speed. In the no voltage, the amount of contamination on the upper surface of the insulator is more than that on the lower surface, and the difference between the upper and lower surface area is more obvious with the increase in droplet size. The reason is that the larger the particle size, the greater the gravity of the droplets. Therefore, large droplets are easier to settle on the upper surface, resulting in a great difference in the amount of dirt accumulated on the upper and lower surfaces.
Under the action of DC voltage, the amount of dirt on the lower surface of the insulator is more than that on the upper surface; with the increase in droplet size, the difference in pollution between the upper and lower surface area increases gradually. The reasons are as follows: under the condition of field charge, the droplets are charged with a positive charge, and the effect of DC voltage increases the electric field force on the particles; the electric field force on the droplets is much larger than that of gravity, and the electric field force is opposite to the direction of gravity. Therefore, the droplets are more likely to collide with the lower surface of the insulator under the action of the electric field force, rather than deposit on the upper surface, so the amount of dirt on the lower surface of the insulator is more than that on the upper surface. With the increase of droplet size, the electric charge increases, the electric field force increases, and the difference in dirt accumulation between the upper and lower surfaces increases.
4.4 Distribution Characteristics and Analysis of Pollution along with Umbrella Skirt
To analyze the fouling characteristics of insulators in the foggy environment more systematically, the distribution law of fouling amount along the insulator umbrella skirt will be studied in this section.
Fig. 8 shows the distribution rule of accumulated pollution along the insulator apron under 36 working conditions without voltage or DC voltage when the droplet size is (1, 10, 20) μm and the wind speed is (0.5, 1, 1.5, 2, 2.5, 3) m/s.
Figure 8: The amount of dirt accumulated along with the shed at different particle sizes under the two voltage types
As can be seen from Fig. 8, when there is no voltage, the amount of dirt accumulation is uniformly distributed along with the umbrella skirt, because the structure of each umbrella skirt of the composite insulator is similar. Under the action of DC voltage, the amount of accumulated pollution along the umbrella skirt changes greatly (except when the droplet size is 1 μm). The specific performance is that the pollution accumulation of insulator No. 1 umbrella skirt and No. 11 umbrella skirt is more than that of other umbrella skirts, and the amount of dirt accumulation is approximately U-shaped along with the umbrella skirt. Due to the large electric field intensity around the insulator high voltage end and grounding end, according to the field charge mechanism, the saturated charge of the droplet is proportional to the electric field intensity at its location. Therefore, the droplets around the high voltage end and grounding end of the insulator carry more charges, and the electric field force of droplets around the umbrella skirt of No. 1 and No. 11 is much larger than that around other umbrella skirts. Under the action of electric field force, droplets are more concentrated in the deposition of umbrella skirts at both ends of the insulator, resulting in obvious U-shaped distribution of insulator contamination along with the umbrella skirt.
Under the action of DC voltage, the charge of droplets with a particle size of 1 μm is tiny, so the action of electric field force is insignificant. Therefore, the droplets are primarily affected by fluid drag force and gravity, resulting in little change in the distribution of fouling. The electric charge increases with the increase of droplet size, so the effect of electric field force is strengthened, and the distribution of dirt accumulation along the U shape of the umbrella skirt is more and more obvious. When the droplet size is the same, the electric field force of the droplet is constant. With the increase in wind speed, the stronger the fluid drag force of the droplet is, and the distribution of dirt accumulation along the U-shaped umbrella skirt is also weakened. Therefore, under the action of DC voltage, the distribution of accumulated pollution along the insulator umbrella skirt is closely related to the electric field force. In practical engineering, strengthening the cleaning work of the insulator high voltage end and ground end can effectively reduce the flashover risk.
1. The simulation results show that the equivalent salt density range is 0.004~0.027 mg/cm2, which is consistent with the actual value. Therefore, it is verified that the equivalent salt density ESDD as the evaluation index of pollution characteristics and its calculation method is reasonable.
2. Under the action of DC or no voltage, the overall pollution volume of insulators increases with the increase of wind speed, which is approximately linear.
3. At the same wind speed, with the increase of droplet size, the amount of fouling under DC voltage gradually exceeds that without voltage (except for particle size 1 μm), and the difference between DC voltage and no voltage is increasing.
4. When there is no voltage, the pollution on the upper surface of the insulator is more than that on the lower surface, and it is the opposite under the action of DC voltage; under the action of two kinds of voltage, with the increase of droplet size, the pollution difference between upper and lower surface area of insulator is more obvious.
5. When there is no voltage, the amount of accumulated pollution is evenly distributed along with the insulator umbrella skirt; At DC voltage, under each droplet size (except 1 μm), the amount of fouling is approximately U-shaped distribution along with the umbrella skirt; the larger the droplet size is and the lower the wind speed is, the more obvious the U-shaped distribution of fogging amount is.
Funding Statement: The authors received no specific funding for this study.
Conflicts of Interest: The authors declare that they have no conflicts of interest to report regarding the present study.
References
1. Hu, C. M., Xie, C. Z., Yuan, C., Li, L. (2015). A review on influence mechanism of haze on external insulation characteristics of transmission and transformation equipment. Power System Protection and Control, 43(16), 147–154. [Google Scholar]
2. Li, D. Y., Zhang, G. X., Wang, T. Y. (2021). Dominant factors affecting flashover by the presence of surface charge under AC voltage. High Voltage Engineering, 47(12), 4199–4206. [Google Scholar]
3. Zhang, R. Z., Zhou, K., Ye, K., Cai, Y. M., Yang, L. et al. (2021). Study on smog contamination characteristics of outdoor insulator surface in Beijing and their influences. Proceedings of the CSU-EPSA, 33(6), 1–6. [Google Scholar]
4. Mohamad, A. A., Ali, R. S. (2014). A new procedure for determination of insulators contamination in electrical distribution networks. International Journal of Electrical Power & Energy Systems, 61(4), 380–385. DOI 10.1016/j.ijepes.2014.03.034. [Google Scholar] [CrossRef]
5. Abouzeid, A. K., El-Hag, A., Assaleh, K. (2018). Equivalent salt deposit density prediction of silicone rubber insulators under simulated pollution conditions. Electric Power Components and Systems, 46(10), 1123–1133. DOI 10.1080/15325008.2018.1488303. [Google Scholar] [CrossRef]
6. Gao, S. (2019). Haze adsorption on insulator surface and its influence on external insulation characteristics (Master Thesis). Tianjin University, China. [Google Scholar]
7. Shen, N., Xu, P. (2019). Overview of the impact of haze mixture in the atmosphere on transmission line equipment. Science and Technology Innovation Herald, 16(34), 129–131. [Google Scholar]
8. Li, Z. (2001). Studies of fog in China over the past 40 years. Acta Meteorologica Sinica, 59(5), 616–624. [Google Scholar]
9. Wang, L. M., Li, J. C., Mei, H. W., Lu, M., Liu, Z. H. et al. (2019). Flashover characteristics of post insulators under fog and haze conditions. High Voltage Engineering, 45(2), 433–439. [Google Scholar]
10. Xu, Y. Z., Ge, Q. Y., Li, G. X. (2017). Research on leakage current characteristics of insulator under fog and haze. Research and Exploration in Laboratory, 36(3), 36–40. [Google Scholar]
11. Huang, Y. (2021). Effect of haze environment on corona aging process and flashover voltage of silicone rubber (Master Thesis). Chongqing University of Technology, China. [Google Scholar]
12. Zhang, C., Hu, J., Li, J., Liu, D., Wang, L. et al. (2018). Experimental study on the contamination deposition characteristics of insulators in a fog-haze environment. IET Generation, Transmission & Distribution, 12(2), 406–413. DOI 10.1049/iet-gtd.2017.0686. [Google Scholar] [CrossRef]
13. Liang, Y., Li, Z., Jiang, X. L., Guo, Y. J., Meng, Z. G. (2017). Effect of fog water conductivity on AC fog flashover characteristics of FXBW-35/70 composite insulator. High Voltage Apparatus, 53(10), 94–99. [Google Scholar]
14. Guo, Y., Jiang, X., Liu, Y., Meng, Z., Li, Z. (2016). AC flashover characteristics of insulators under haze-fog environment. IET Generation, Transmission & Distribution, 10(14), 3563–3569. DOI 10.1049/iet-gtd.2016.0284. [Google Scholar] [CrossRef]
15. Ren, A., Liu, H., Wei, J., Li, Q. (2017). Natural contamination and surface flashover on silicone rubber surface under haze-fog environment. Energies, 10(10), 1580. DOI 10.3390/en10101580. [Google Scholar] [CrossRef]
16. Sun, Y. F., Tu, Y. P., Wang, C., Wang, S. H., Cheng, Y. C. et al. (2015). Contamination and AC pollution flashover characteristics of insulators under fog-haze environment. 2015 IEEE 11th International Conference on the Properties and Applications of Dielectric Materials (ICPADM), pp. 596–599. Sydney, Australia. [Google Scholar]
17. Liu, Y., Zong, H. B., Gao, S., Du, B. X. (2020). Contamination deposition and discharge characteristics of outdoor insulators in fog-haze condition. International Journal of Electrical Power and Energy Systems, 121(5), 106176. DOI 10.1016/j.ijepes.2020.106176. [Google Scholar] [CrossRef]
18. Meng, H., Shi, W. J., Zhang, H. L., Zhang, Z. J., Jiang, X. L. (2021). Research on the pollution characteristics of insulators in the simulated haze environment. Transactions of China Electrotechnical Society, 13, 11–15. [Google Scholar]
19. Tang, X. Y., Zhang, X. Q., Li, Y., Guo, Y. J., Li, P. D. et al. (2019). Study on contamination characteristics of roof insulators under artificial simulated fog-haze and airflow environment. 2019 2nd International Conference on Electrical Materials and Power Equipment (ICEMPE), pp. 78–84. Guangzhou, China. [Google Scholar]
20. Yang, J. X., Mei, H. W., Zhang, F. Z., Wang, T. T., Liao, Y. F. et al. (2020). Simulation study on contamination accumulation characteristics of insulator by feature particle tracking method. High Voltage Apparatus, 56(12), 124–132+140. [Google Scholar]
21. Ren, A., Bi, X. T., Qin, L. W., Cheng, X. Q., Li, Q. Q. (2017). Numerical simulation and prediction on pollution accumulation characteristics of HVDC insulator. High Voltage Engineering, 43(5), 1572–1580. [Google Scholar]
22. Lv, Y. K., Wang, J., Zhang, X. M., Liu, Y. P., Wang, J. W. (2021). Numerical simulation of the influence of particle charge on the fouling characteristics of XSP-160 porcelain three-umbrella insulator. Insulators and Surge Arresters, 64(5), 197–204. [Google Scholar]
23. Lv, Y. K., Zhao, W. P., Pang, G. L., Li, Z. C., Wei, S. K. (2018). Simulation of contamination deposition on typical shed porcelain and composite insulators. Transactions of China Electrotechnical Society, 33(1), 209–216. [Google Scholar]
24. Lv, Y. K., Zhao, W. P., Song, Q. Z. (2020). Simulation on deposition characteristics of contamination particles in fog-haze environment. IEEE Access, 8, 26119–26128. DOI 10.1109/ACCESS.2020.2971634. [Google Scholar] [CrossRef]
25. Wang, L. M., Liu, T., Meng, H. W., Xiang, Y. (2015). Research on cntanination deposition cacerisits of post insulator based on computational fluid dynamics. High Voltage Engineering, 41(8), 2741–2749. [Google Scholar]
26. Tao, W. Q. (2001). Numerical heat transfer. China: Xi’an Jiaotong University Press. [Google Scholar]
27. Zhang, D. D., Zhang, Z. J., Jiang, X. L., Hu, J. L., Liu, X. H. (2018). Wind tunnel DC contamination performance of typical suspension insulator and its analysis. Transactions of China Electrotechnical Society, 33(19), 4636–4645. [Google Scholar]
28. Dong, H. Y., Zhang, Y. P., Dou, J. M., Dong, H. L., Su, K. (2019). Numerical analysis of contamination characteristics of new type insulator for catenary cantilever. High Voltage Engineering, 45(7), 2267–2275. [Google Scholar]
29. Luo, Z. Y., Jiang, J. P., Zhao, L., Chen, H., Fang, M. X. et al. (2014). Research on the charging of fine particulate in different electric fields. Zhongguo Dianji Gongcheng Xuebao/Proceedings of the Chinese Society of Electrical Engineering, 34(23), 3959–3969. [Google Scholar]
30. Lu, M. (2017). Haze and external insulation configuration of transmission and transformation equipment. China: China Electric Power Press. [Google Scholar]
Cite This Article
 Copyright © 2023 The Author(s). Published by Tech Science Press.
This work is licensed under a Creative Commons Attribution 4.0 International License , which permits unrestricted use, distribution, and reproduction in any medium, provided the original work is properly cited.
 Downloads
 Citation Tools