
 Submit a Paper
 Propose a Special lssue
 Open Access
ARTICLE

Determination of Effectiveness of Energy Management System in Buildings
1 University of Rochester, Rochester, NY, 14627, USA
2 Industrial and Management Systems Engineering, West Virginia University, Morgantown, WV, 26505, USA
3 Mechanical and Aerospace Engineering, West Virginia University, Morgantown, WV, 26505, USA
* Corresponding Author: Bhaskaran Gopalakrishnan. Email:
Energy Engineering 2023, 120(2), 561-586. https://doi.org/10.32604/ee.2023.025218
Received 28 June 2022; Accepted 05 September 2022; Issue published 29 November 2022
 View Full Text
 Download PDF
Abstract
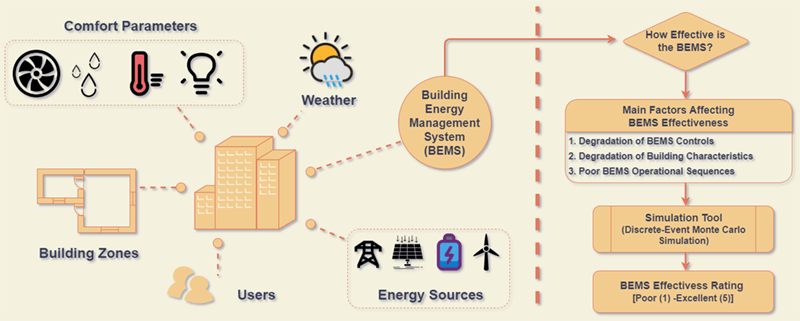
Building Energy Management Systems (BEMS) are computer-based systems that aid in managing, controlling, and monitoring the building technical services and energy consumption by equipment used in the building. The effectiveness of BEMS is dependent upon numerous factors, among which the operational characteristics of the building and the BEMS control parameters also play an essential role. This research develops a user-driven simulation tool where users can input the building parameters and BEMS controls to determine the effectiveness of their BEMS. The simulation tool gives the user the flexibility to understand the potential energy savings by employing specific BEMS control and help in making intelligent decisions. The simulation is developed using Visual Basic Application (VBA) in Microsoft Excel, based on discrete-event Monte Carlo Simulation (MCS). The simulation works by initially calculating the energy required for space cooling and heating based on current building parameters input by the user in the model. Further, during the second simulation, the user selects all the BEMS controls and improved building envelope to determine the energy required for space cooling and heating during that case. The model compares the energy consumption from the first simulation and the second simulation. Then the simulation model will provide the rating of the effectiveness of BEMS on a continuous scale of 1 to 5 (1 being poor effectiveness and 5 being excellent effectiveness of BEMS). This work is intended to facilitate building owner/energy managers to analyze the building energy performance concerning the efficacy of their energy management system.Graphic Abstract
Keywords
Nomenclatures
| ACH | Air Change per Hour |
| AI | Artificial Intelligence |
| BE | Building Envelope |
| BEMS | Building Energy Management System |
| BMS | Building Management System |
| CFM | Cubic Feet per Minute |
| COP | Coefficient of Performance |
| DBT | Dry Bulb Temperature |
| DCV | Demand Controlled Ventilation |
| DOE | Department of Energy |
| DR | Demand Response |
| DRL | Deep Reinforcement Learning |
| DRP | Demand Response Program |
| EIA | Energy Information Administration |
| GA | Genetic Algorithm |
| GHG | Greenhouse Gas |
| HEMS | Home Energy Management System |
| HVAC | Heating, Ventilation, and Air Conditioning |
| IAQ | Indoor Air Quality |
| LSTM | Long-Short Term Memory |
| MCS | Monte Carlo Simulation |
| MILP | Mixed-Integer Linear Programming |
| NN | Neural Network |
| OH | Operating Hour |
| PV | Photovoltaic |
| SAT | Supply Air Temperature |
| SHEMS | Smart Home Energy Management System |
| SHR | Sensible Heat Raio |
| TEE | Target Energy Efficiency |
| TL | Transfer Learning |
| VAV | Variable Air Volume |
| VBA | Visual Basic Application |
| WF | Weather Factor |
The term “Energy Management” encompasses strategic planning and operation of energy generating and/or consuming units. It can be broadly defined as the systematic, organized, and proactive management of energy use in organizations, industries, or buildings to meet the economic and environmental necessities. The main aims of energy management are the conservation of the resource, protection of the climate, and saving costs. At the same time, the consumers have continuous access to the energy they require. The core principles which are generally followed for energy management include but are not limited to collecting the energy data and metering the consumption of energy, seeking opportunities to save energy, implementing actions to save energy, and making a record of the progress and ongoing improvements.
In today's world, energy management is considered the groundwork for saving energy at an organizational level. Further, due to the increasing demand and decreasing supply of non-renewable natural resources such as gasoline and coal, costs are likely to rise. Also, the standards of sustainability are pushed more to higher limits by the regulations. Managing energy use does not always involve a considerable investment of capital or complex analysis. It can be started by monitoring and evaluating the profile of energy consumption over time. Sometimes, making minor modifications to the energy spending behavior can lead to savings. Whatever the conditions, energy management is about developing a foundation of information for intelligent decision-making and using the information to reduce energy consumption.
Since 2012, the number of facilities has grown by 6% and the floor space by 11% in the U.S. More than half of commercial buildings in the U.S. were built between 1960 and 1999, and 25% have been made since 2000. The number of buildings has increased from 3.8 million to 5.9 million, and the amount of commercial floor area has increased from 51 billion square feet to 97 billion square feet. Among all commercial buildings, 48% were represented by warehouse and storage, service, and office buildings and had 42% of total retail building floor space [1]. About 93% of the total energy consumed in commercial buildings in 2012 was electricity and natural gas. Natural gas is typically used to heat water, interior space, and operate cooling equipment in commercial buildings. About 32% of the total energy consumed in a commercial building in 2012 was from natural gas and 61% from electricity. The significant contribution to electricity in commercial buildings is due to lighting [2].
This research aims to simulate the energy consumption of the building by varying the control aspects of the BEMS. Initially, based on the number of rooms in the building and the type of rooms, the user can input various data such as dimensions of the rooms, thermostat setting (setpoint and setback temperature) for each room. Furthermore, users can also input the geographical position, energy source for heating and cooling the building. Microsoft Excel®, based on the discrete-event Monte Carlo Simulation (MCS), is used to simulate the energy consumption pattern. A heuristic approach is used for generating random variables for occupancy. This model calculates the energy consumption rate at 30-min intervals for one year. Users can understand the energy consumption by HVAC units with the BEMS controls and compare them against their HVAC energy consumption data. Develop a Microsoft Excel-based (Visual Basic Application) Monte Carlo simulation, which can forecast the occupancy level at the different time frames of the day.
2.1 Current Scenario of Energy Consumption by Buildings
The building sector in the U.S. accounted for about 39% (38 quadrillion BTUs) of primary energy consumption in 2016. This figure is more than the other two uses: transportation (29%) and industry (32%). The commercial and residential buildings were accountable for 18% and 21% of the primary energy consumption within the building sector [3].
Jamil et al. [4] presented a paper with a review of building energy management systems. The authors emphasized that building an energy management system acts as a bridge between the electric grid and the consumer side to realize the demand response and make the dream of an intelligent grid visible. They concluded that energy management in a building can be performed economically and efficiently using available BEMS technologies. Mei [5] described BEMS as the computer-based control system that monitors and controls the electrical and mechanical aspects such as heating, cooling, ventilation, power systems, and lightings. The author also claimed that installing BEMS energy savings of 10%–20% can be achieved than stand-alone controllers. The author, however, emphasized the importance of scheduled maintenance of the BEMS system and keeping its setting up to date to match the user comfort and realize more energy savings.
Syed et al. [6] discussed the Building Energy Management System in their paper published in 2018. The authors also examined the control system, integration, and interfacing of BEMS units. Numerous benefits of the BEMS system were also delineated, including but not limited to enabling users to analyze, collate and transform the data into meaningful information, allowing them to monitor the consumption of energy and determine the waste. The authors further discussed the BEMS architecture and several energy monitoring systems such as direct, indirect, and hybrid monitoring systems. Chen et al. [7] presented a paper in the 2016 3rd International Conference on Green Technology and Sustainable Development discussing designing and implementing a Building Energy Management System. The report highlights the utilization of a considerable amount of infographic and data visualization design elements in conjunction with interactive and dynamic charts that help users gain insights into critical building performance data. The developed design has general power and demand measurement, Time of Use (TOU) metrological management, and a power quality monitoring system. Hernandez et al. [8] presented a paper regarding the review of strategies for building energy management systems. The authors concluded that most of the studies only focused on decreasing the HVAC system's energy consumption, leaving alone the other subsystems of the building, which might significantly contribute to energy consumption depending upon the building type. Djuric et al. [9] presented a paper using the BEMS data and optimization tool to estimate the heating system performance. The authors considered a building with a total area of 13,700 m2, three floors, and a basement. The authors collected data through an on-site survey, BEMS, and additional measurements, including indoor air temperature in four offices, outdoor air temperature, ultrasound flow meter, and energy consumption by hot water using thermocouples.
2.3 Study of Control Aspects of BEMS
Pacific Northwest National Laboratory (PNNL) published a report [10] that discussed the training guide for retuning the building. The authors highlighted the re-tuning of the building based on occupancy scheduling, night, and weekend temperature setback, and cycling of supply fans during unoccupied hours. The authors claimed that if the control aspects of the building are controlled adequately during the unoccupied mode, it can significantly reduce costs in commercial buildings. The authors also claimed that with proper setback control, the difference between the baseload to the peak load can be a minimum of 30% but can be as high as 80%. These savings were also illustrated through charts for better understanding. Verma et al. [11] presented a paper that discussed controlling the lighting automatically in an optimized way in a hotel building to achieve energy efficiency. The authors described various categories for lighting control, such as occupancy-based control, schedule-based control, and daylight-based control. From the study, the authors claimed that automatic lighting control with dimming can reduce the total consumption of energy by 37% and consumption of lighting energy by 55%. Hence, the authors concluded that dimming and switching control of lighting contribute to saving energy, but the latter have more savings at the expense of occupant’s comfort.
Lawrence Berkeley National Laboratory (LBNL) published a report [12] describing occupancy-based energy management in buildings. The authors conducted field studies and modeling analyses of the structure based on occupancy through the building. The authors divided the projects into three parts: Feasibility and efficacy study, refine hardware and software tools, and link with other DOE programs, and finally, implantation and testing of the prototype. The authors concluded that each zone in the building could result in an HVAC energy consumption reduction of nearly 15%. Liu et al. [13] discussed using various technologies such as building occupancy sensors and sensor networks for controlling the terminal box. The authors used building occupancy sensors to count the occupancy for all the rooms and deliver the measured data to the signal processing station through the sensor network. The system architecture, control strategy, and available sensor technology were explained in this paper. Ardiyanto et al. [14] presented a paper discussing the energy savings in buildings through HVAC setpoint interventions based on occupancy. The authors considered occupant thermal comfort and energy savings as the two prominent aspects in controlling the HVAC operation in the building. The authors aimed to devise a method to save energy by adjusting HVAC setpoints based on comfort measured using Predicted Mean Vote (PMV) and occupancy information. The results showed that the HVAC electrical consumption decreased by 14% when the proposed HVAC setpoint adjustment method was employed.
Mandlem et al. [15] discussed using Smart Thermostat-based BEMS for energy efficiency effectiveness in a residential building. The main factors that the authors considered were occupancy of the rooms, weather factor, the volume of the space, building envelope, and thermostat set point. The model was validated against a typical household where the difference between the simulated and the actual energy consumed was 5 MMBtu with an error of 15%. A report [16] published by Iowa State University titled “Experimental and simulation study of demand-controlled ventilation” highlights the comparison of energy use and CO2 concentration for a multizone building utilizing three ventilation control strategies. A report [17] published by Iowa State University titled “Experimental and simulation study of demand-controlled ventilation” highlights the comparison of energy use and CO2 concentration for a multizone building utilizing three ventilation control strategies: occupancy-based DCV, constant ventilation, and CO2 based DCV. The authors compared the building’s energy consumption using these three winter, summer, and transition seasons.
2.4 Recent Development with AI and Smart Controls
Farzaneh et al. [18] introduced an evaluation framework for assessing the recent research conducted across the major AI domains, including energy, comfort, design, and maintenance. The authors reviewed the studies in application of artificial intelligence (AI) technologies in smart buildings through the concept of a building management system (BMS) and demand response programs (DRPs). Wang et al. [19] presented a multi-objective optimization method that considers two main purposes including energy consumption cost and user satisfaction. The authors developed the algorithm based on a new improved version of the butterfly algorithm for increasing the convergence speed. Himeur et al. [20] did a review of existing anomaly detection frameworks for building energy consumption based on artificial intelligence. In this study, the authors introduced a comprehensive taxonomy to classify existing algorithms based on different modules and parameters adopted, such as machine learning algorithms, feature extraction approaches, anomaly detection levels, computing platforms and application scenarios.
Elsisi et al. [21] proposed a deep learning-based people detection system utilizing the YOLOv3 algorithm to count the number of persons in a specific area. The proposed system enhances decision making about energy consumption. The number of persons and the status of the air conditioners are published via the internet to the dashboard of the IoT platform. Elnour et al. [22] proposed a neural network (NN) based model predictive control management and optimization system for the heating, ventilation, and air conditioning (HVAC) system of a sports facility. This model provides an integrated dynamic optimization method that accounts for future system behavior in the decision-making process, consisting of a prediction element and an optimizer. Elnour et al. [23] presented a review and in-depth discussion of existing solutions in building operation management and optimization for sports facilities in different climate zones.
Can Duman et al. [24] proposed a mixed-integer linear programming (MILP)-based home energy management systems (HEMS) that performs day-ahead load scheduling for cost-minimization and provides optimal demand response (DR) and photovoltaic (PV) self-consumption. The fuzzy logic-based thermostat aims efficient DR of air-conditioning and maintenance of thermal comfort. Saidu Aliero et al. [25] presented an analysis of smart home energy management system (SHEMS) with the goal to identify current trends and challenges for future improvement. The authors described opportunities for future research that ensure energy-efficient smart homes free of unnecessary energy consumption, health challenges, and cyber security attacks. Himeur et al. [26] presented a review of the applicability of transfer learning (TL) for energy systems by adopting a well-defined taxonomy of existing TL frameworks. The authors carried out an in-depth analysis to identify the pros and cons of current techniques and discuss unsolved issues. Luo et al. [27] proposed a building energy consumption forecasting system that uses hybrid genetic algorithm (GA) and long-short term memory (LSTM) neural network model for accurate and robust energy prediction. This prediction model can play an essential role in various areas, including daily building energy management, decision making of facility managers, building information model designs, net-zero energy operation, climate change mitigation and circular economy.
Lissa et al. [28] proposed a deep reinforcement learning (DRL) algorithm for indoor and domestic hot water temperature control, aiming to reduce energy consumption by optimizing the usage of photovoltaic (PV) energy production. The algorithm is calibrated to not exceed more than 1% of the time out the specified temperature setpoints. Mariano-Hernández et al. [29] presented a review of management strategies for building energy management systems for improving energy efficiency. The authors found that different management strategies can be used to achieve energy savings based on the type of the building.
Aliero et al. [30] presented an analysis of SHEMS with the goal to identify current trends and challenges for future improvement. The authors described opportunities for future research that ensure energy-efficient smart homes free of unnecessary energy consumption, health challenges, and cyber security attacks. Jradi et al. [31] proposed a software that has three major capabilities, initial BMS auditing, BMS retro-commissioning and continuous building commissioning. The software development is a part of the BuildCOM project which is driven by the industry and customer needs, and it responds to the increasing demands for energy efficiency, comfort, and safety in the building.
Everyone at some point in their lives has come across the term “Energy Management,” particularly in recent years, where conservation of energy is getting foremost importance for the future of organizations worldwide. Due to increased fuel cost, increasingly aggressive environmental targets, and concerns over energy security, every organization is becoming competitive to reduce its operational cost. Savings in energy cost provides the organization a competitive edge to flourish in the market.
Many organizations install BEMS for the management of energy in their buildings. The reduced cost of sensors, analytics software, and data storage has made BEMS affordable to install, even for small businesses. The sensors are used in monitoring the operational conditions of the building and building equipment, such as monitoring airflow in the building, exposure to sunlight, and temperature. Then, the controllers of the devices process all the collected data from the sensors, and the actuators perform suitable actions for optimizing the physical settings.
Installation of BEMS requires considerable capital investment, and any organization expects a lower payback period on investment through energy savings. If the operating characteristics of the building are not correct, then the performance of the BEMS cannot be achieved as expected. There are various conditions where BEMS cannot function efficiently, such as infiltration and exfiltration of air through cracks in the building envelope, doors and windows openings, poor building insulating material, single-pane doors and windows, and excessive internal heat loads. Moreover, the BEMS also does not run effectively during poor control system operation of the thermostat, excessive ventilation to the building than required, conditioning of unoccupied spaces, and constant SAT.
The transmission loss of heat is reduced with proper insulation of the building, upgrading of windows and doors. Furthermore, the heat loss due to infiltration is also reduced by installing appropriate frames in doors and windows and other sealing cracks in the building envelope. This reduces the load on the HVAC system. Hence, it does not have to run continuously. Moreover, by upgrading thermostat controls such that setback temperature could be set during unoccupied periods, the load on the HVAC system would decrease tremendously. In addition, using a CO2 sensor for demand-controlled ventilation, the HVAC system conditions only required amount of air to the building according to the number of occupants in the building.
2.6 Potential of Proposed Research
Currently, no literature has provided any tool to determine the effectiveness of the energy management system of the building based on varying BEMS controls. In this research work to resolve this problem, a simulation model was developed for determining the effectiveness of an energy management system for buildings. The developed model in this research is user-interactive; hence, the user can change the model's parameters to determine the effectiveness of BEMS of their building. Therefore, in this way, the potential for energy savings by using the appropriate BEMS controls was determined, and the current effectiveness of the BEMS was evaluated. This tool can also determine the peak ventilation air requirement for a building to meet the indoor air quality based on ASHRAE Standard 62.1–2019 that could help in preliminary study for sizing ventilation components of a building. Furthermore, this research also helps in the reduction of GHG emissions by exploring the ineffectiveness of BEMS operation and quantifying the amount of GHG emissions reduced in terms of pounds of CO2 emissions saved per year.
Several assumptions have been made during the development of this simulation program. They are listed below:
1. The time interval for the simulation has been considered 30 min. So, it will not detect any event in terms of occupancy between 0–30 min intervals.
2. The temperature of the return air is assumed to be the same as that of the room temperature.
3. The loss of energy for the return air is neglected, and the mixture of outside air and return air is considered an ideal mixture.
4. The weather condition is considered to be constant for every 8 h.
5. The values in the occupancy chart are assumed to be the same for similar types of the room but can be changed according to user requirements.
6. Relative humidity of thermal comfort conditions is assumed to be at 50 percent.
7. A natural disaster is ignored in this simulation.
3.2 Overview of Research Approach
This work involves determining the effectiveness of the BEMS system by simulation of the control aspects of the BEMS. The simulation takes information about the types of rooms in the building, the dimension of the rooms, information about the building envelope and location, setpoint, and setback temperature at each room during the summer and winter months. The research workflow can be segmented into steps and delineated in the following list:
Step-1: Select the building in terms of the number of zones and type of zones.
Step-2: Determine the operational characteristics of the building along with BEMS controls.
Step-3: Define charts for occupancy (i.e., Expected occupant percentage) based on the time of the day and day of the week for each type of zone.
Step-4: Determine various HVAC energy consumption factors such as the dimension of individual zones, thermostat settings (i.e., setpoint and setback temperatures) for summer and winter months. Further, also choose the climatic region according to the location of the building among the given nine climatic regions of the U.S. Also, specify the type of building envelope and determine the sensible heat ratio for individual zones.
Step-5: Determine the expected number of occupants at each room based on the time of the day and day of the week for each type of zone based on Monte Carlo Simulation.
Step-6: Determine the new Air Change per Hour (ACH) and outside air requirement (cfm) for every 30-min time interval for each zone. This calculation is based on the number of occupants and the area of the room.
Step-7: Calculate the HVAC energy consumption for every 30-min–for one year for each type of zone.
Step-8: Furthermore, calculate the total HVAC energy consumption of the building by the addition of energy consumption of individual rooms (Base Case).
Step-9: Furthermore, perform a similar calculation for the TEE Case where all BEMS controls are enabled with improvement in building envelope to determine the annual energy consumption of the building.
Step-10: Compare the annual energy consumption of the building for the Base Case with the TEE Case to determine the percentage change in energy consumption. Based on the difference in energy consumption between the TEE Case and Base Case, assign a rating of BEMS effectiveness on a scale from 1–5, where 1 being poor condition and 5 being an excellent condition.
Step-11: Determine the annual reduction of GHG emissions by enhancing the effectiveness of BEMS.
Primarily, two cases, the Base Case and TEE Case, are developed to determine the BEMS system's effectiveness.
Base Case: This case is based on the building's user defined BEMS controls and building envelope level. This case gives the energy required for space cooling and heating given the present condition of the building.
TEE Case: In this case, all four BEMS controls are input to the model, and the building envelope level is in good condition, i.e., no infiltration of air, double pane windows and doors, and good building envelope insulation. The energy required for space cooling and heating obtained from this case is used to calculate the effectiveness of BEMS of the building by comparing against the data obtained from the Base Case.
3.4 Principle of Data Analysis
The system requires some input from the user to calculate the HVAC energy consumption of the building with some BEMS controls. To be specific, the user has the option to input the total number of rooms in the building, type of individual rooms, the dimension of each room, thermostat setting for each room, geographical position according to climatic region, percentage of an outdoor air intake, BEMS controls, fuel type, and fuel cost. All these factors have been accounted as input data to the simulation. The proposed simulation is interactive, which allows its users to change the value of the variables. The simulation is performed in Microsoft Excel® based on the discrete event Monte Carlo Simulation (MCS) using the Visual Basic Application (VBA). A uniformly distributed random number will be generated in excel. To determine the expected number of occupants, heuristic rules will be applied for comparing the automatically generated random number and value from the occupancy chart.
3.5 Energy Calculation Factors
All the energy calculation factors can be divided into two categories–major factors and minor factors. Major factors are those that directly impact energy accounting. Major factors are occupancy level and type of room. On the other hand, the minor factors are the ones that are present in all different scenarios, such as building envelope, level of thermostat, area of the room, geographical location.
In this study, only 18 states were selected for the simplicity of the simulation model. Two weather stations from each of the 18 states are included in this simulation model. The user is asked to select the “state” and “nearest weather station” from the available options. Based on the chosen state, two weather stations will be available to choose from, and based on the selected weather station, the elevation (ft.), heating dry bulb temperature (DBT), cooling DBT, and humidity ratio are determined from values referenced from the 2017 ASHRAE Handbook [32].
This simulation aims to determine the effectiveness of BEMS by calculating the annual HVAC energy consumption with varying BEMS controls and building operating parameters. In this research, energy consumption has been shown for one year for the given building using VBA. The program developed here is very user-interactive, where the user can select various inputs to define the scenario appropriately. Additionally, the users can change the expected occupancy levels for a more precise simulation of the building under consideration.
3.6.1 Users Inputs and Outputs
The energy consumption simulation program has been divided into five sections: User manual, Inputs, Reference, Climatic data, and Occupancy. At first, the “User Manual” sheet of MS excel describes the complete process step by step to guide the users through the simulation process. Next, the “Inputs” sheet of the Microsoft Excel software asks a user to select several rooms in the building. Additionally, the user also must provide the type of rooms, a dimension of the room, setpoint and setback thermostat temperature for summer and winter months, location of the building (Climatic Zone, State and City). The reference sheet contains information required for energy calculation based on the weather, Occupancy chart, ASHARE standard for people, and area outdoor air rate for various types of rooms and fuel types. Upon providing all the information on the input page, the program starts the calculation and shows the expected number of occupants and outdoor air (cfm) requirements for each room. At the very end, the tool will ask for the source of energy for heating the building, the average cost of electricity ($/kWh), and an average cost of natural gas ($/MMBtu).
3.6.2 Description of Energy Consumption Calculation
In this study, user input values are taken into consideration for determining the building operating parameters. The user can also select the BEMS controls that are used in the building from the given option. Based on these inputs, the energy consumption of the building was calculated [33,34].
Air-Change per Hour (ACH): At full occupancy, the value of ACH is used according to the given ASHRAE Standard 62.1–2019 for a particular type of room. But, during part-load occupancy, the value of ACH is calculated proportionally to the level of occupancy. For example, at half occupancy, the rate of ACH is also halved. However, during no occupancy, the ACH is calculated based on dimensions of the room and area outdoor air rate.
During no-occupancy:
where,
Supply Air Requirement: Based on the ACHnew, the required supply air (cfm) is determined
where,
Outdoor Air Requirements: The outside air required for a specific type of space can be calculated as:
where,
Return Air Thermal Conditions: The thermal conditions (temperature and humidity ratio) of the return air are determined from two factors: temperature, humidity ratio of return air from each zone, and amount of air (cfm) returned from each zone. The temperature of the return air can be calculated as follows:
Here, the dry-bulb temperature of outside air is determined according to the location selected by the user.
The humidity ratio of the mixed air can be calculated as:
where,
Here, the humidity ratio of the outside air is determined according to the location selected by the user.
Humidity Ratio of Supply Air: The thermal conditions (temperate, humidity ratio) of supply air are required to determine energy consumed by the heating or cooling unit. The supply air temperature is estimated based on the level of occupancy, building envelope condition, and weather factor [35]. The rule is designed to select SAT based on those two factors.
Sensible load calculation:
As an example, the sensible cooling load during summer months for zone 1 is calculated as:
where,
The sensible heating load during winter months for zone 1 is calculated as:
The total load for zone 1 is calculated as:
where,
Similarly, the total sensible load and total heating/cooling load for all the zones in the building are calculated to determine the total heating/cooling load of the building.
The humidity ratio of the supply air during summer months for zone 1 is calculated as:
where,
The humidity ratio of the supply air during winter months for a zone is calculated as:
Similarly, the humidity ratio of the supply air for all the zones is calculated.
Load on Heating/Cooling Unit: The load on the heating or cooling unit is determined based on the heating or cooling degree days for a given climatic region selected by the user. For example, during the summer months, the cooling load for the cooling unit is calculated, whereas during the winter months heating load for the heating unit is calculated.
Cooling unit load: The cooling unit load is determined by calculating the sensible and latent cooling load for the cooling and dehumidification unit. For example, the sensible cooling unit load for zone 1 is calculated as:
where,
The latent cooling unit load for zone 1 is calculated as:
where,
Similarly, the sensible and latent cooling unit loads for all the zones are determined accordingly.
Heating unit load: The heating unit load is determined by calculating the sensible heating unit load. For example, the sensible heating unit load for zone 1 is calculated as:
where,
Similarly, the sensible heating load for all the zones is determined accordingly.
HVAC: The HVAC energy consumption for zone 1 can be calculated as:
During Summer Months,
where,
Here, the total cooling load is determined from the above calculation in “Cooling unit load.” COP of the HVAC unit is input by the user. Similarly, the total energy consumption during summer is calculated by summation of cooling energy consumption from all the zones in the building.
During Winter Months, for electric heating system:
And for gas heating system:
where,
Similarly, the heating energy consumption for all the zones is calculated by summation of heating energy consumption from all the zones in the building.
Hence, the total annual energy consumed by the HVAC system is determined by the summation of the energy consumed during the summer months and winter months.
where,
3.6.3 Rating for Effectiveness of BEMS
For determining the effectiveness of BEMS, two types of energy sources are considered in this simulation tool, i.e., electricity and natural gas. To normalize both kinds of energy sources for comparison, they are converted to their respective cost. The average cost of electricity ($/kWh) is used that is calculated by dividing the total electricity cost in a year by total electricity (kWh) consumption. This electricity cost includes all the expenses included in the electric bill, such as demand charge, customer charge, and taxes. Similarly, the average natural gas cost ($/MMBtu) is used for determining the cost of natural gas. Moreover, the total cost for electricity and natural gas is determined for each month, and the percentage of electricity and the natural gas cost is calculated for respective months.
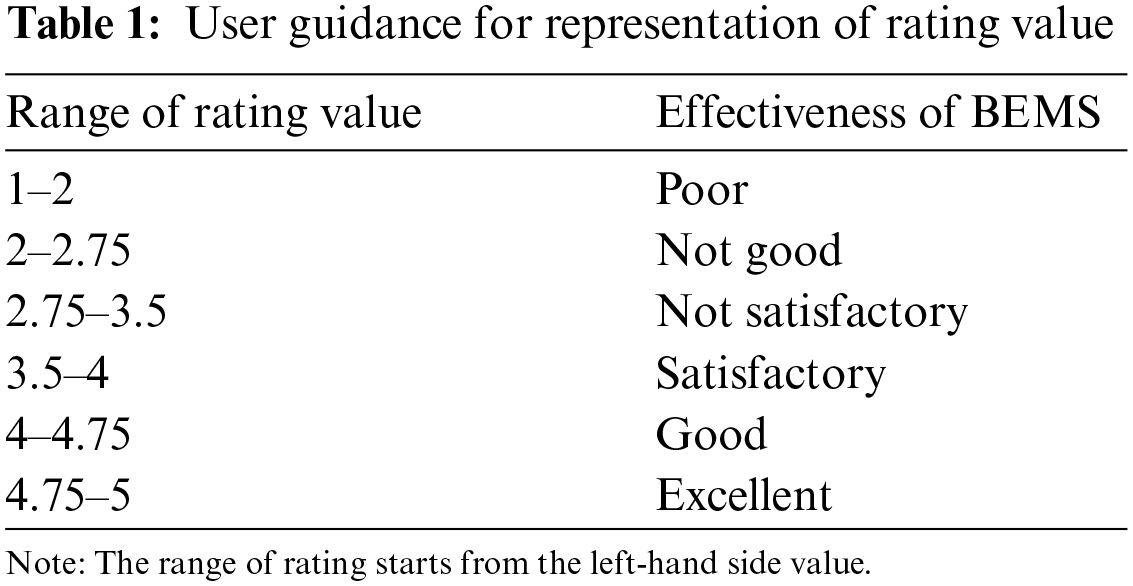
Furthermore, a continuous scale of 1 to 5 is used to determine the effectiveness of BEMS, where a rating of 1 represents poor, and 5 represents excellent energy management system, respectively. The rating of BEMS starts with 1, and the remaining 4 scores are assigned to the electrical and natural gas energy based on the percentage of their energy cost for each month. Once the energy consumption data for the Base Case and TEE Case has been determined, the percentage difference of the TEE Case from the Base Case is calculated for both electricity and natural gas. Moreover, the total scale assigned for electricity and natural gas is multiplied with the remaining percentage value than what was obtained from the TEE Case and Base Case difference for electricity and natural gas.
The overall effectiveness of the BEMS is determined in similar way by taking energy consumption data. A rating Table 1 is given below for guiding users regarding the meaning of the rating value.
3.6.4 Reduction of GHG Emissions for Site Energy and Source Energy
In this research, the reduction of CO2 emission was calculated based on annual energy savings by adding BEMS controls and/or improvement in the building envelope. The site energy usage obtained from the first simulation (i.e., Base Case) and second simulation (i.e., TEE Case) and reduction of energy between the two cases are converted to source energy by multiplying with 2.8 for electrical energy source and 1.05 for natural gas. Furthermore, the reduction of CO2 emission was calculated by multiplying the CO2 emission rate of 2.19 lbs/kWh for electrical energy and 113 lbs/MMBtu of natural gas for both site and source energy. Finally, the total reduction of CO2 emission was obtained by summing the each of energy source for site energy and source energy.
3.7 Simulation Excel Input Tabs Details
This excel-based effectiveness of energy management system determination of buildings contains five worksheets named User Manual, Reference, Inputs, Occupancy, and Climatic Data.
This worksheet includes all the different types of rooms where occupancy can impact air supply. The occupancy level, i.e., percentage of total allowable occupants as shown in Fig. 1, is considered during the calculation of ventilation requirements.
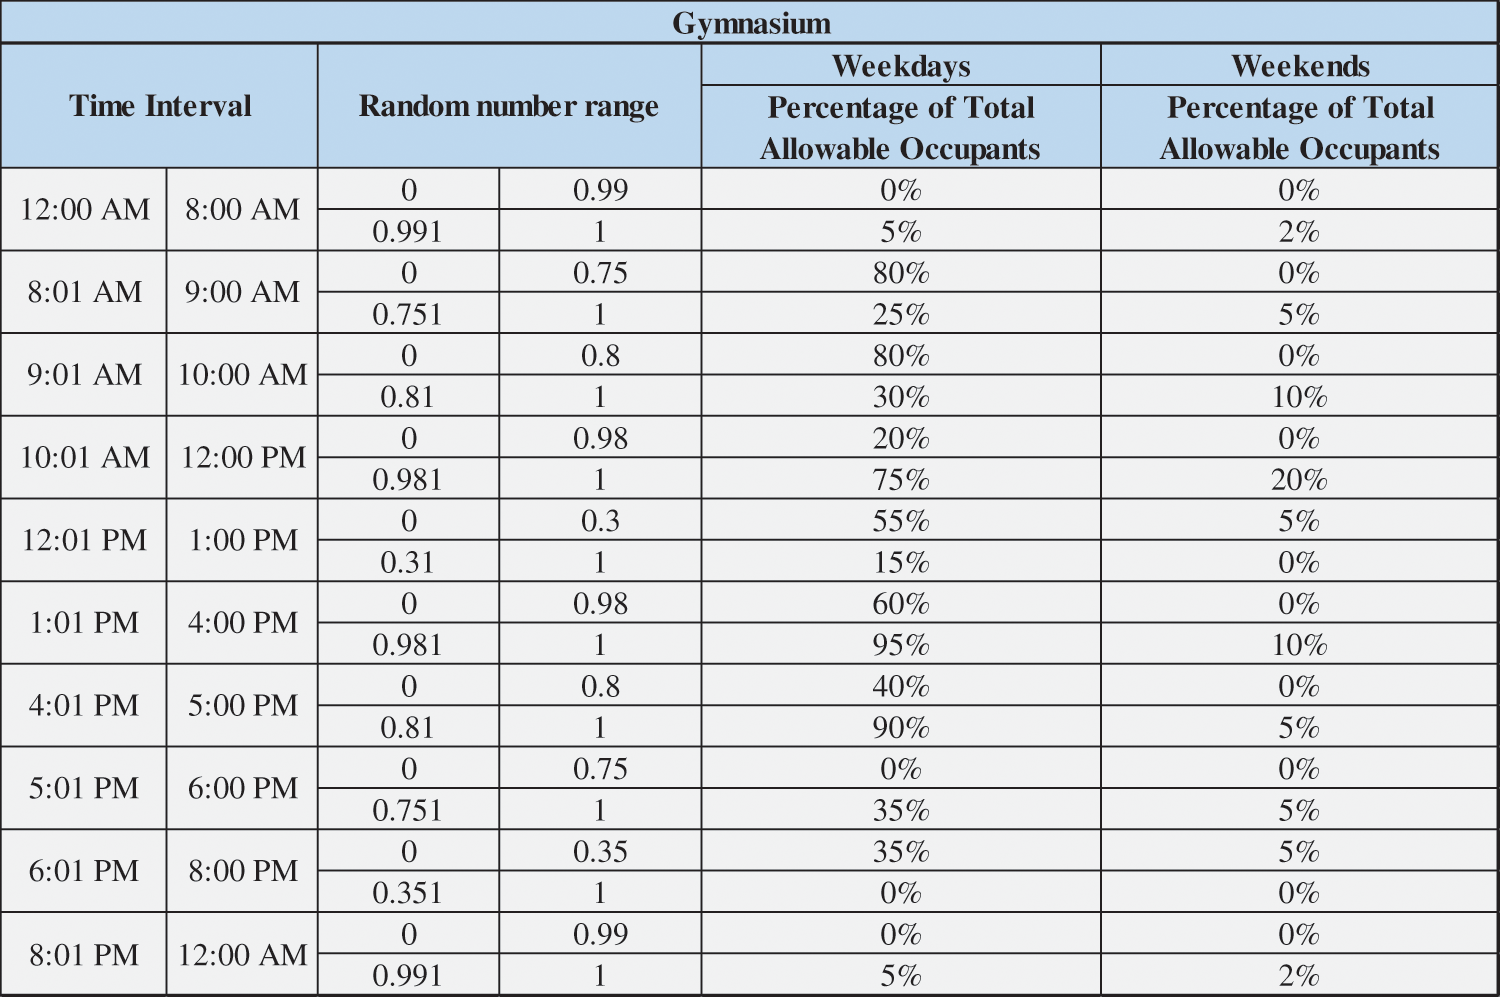
Figure 1: Occupancy chart
The objective of the “Reference” worksheet is to save all the required information to run the simulation. It contains data such as people's outdoor air rate (cfm/person), area outdoor air rate (cfm/ft2), Occupant density (#/1000 ft2), and ACH for 16 different types of rooms.
3.7.3 “Climatic Data” Worksheet
This worksheet contains information regarding climatic data for nine regions. For simplification, only two states from each region and only two weather stations from each state are considered for the simulation. For each of the weather stations, further data such as elevation (ft), heating DBT (oF), cooling DBT (oF), and humidity ratio (grains of moisture/grains of dry air) is provided in the sheet. The worksheet “Climatic Data” is shown in Fig. 2.
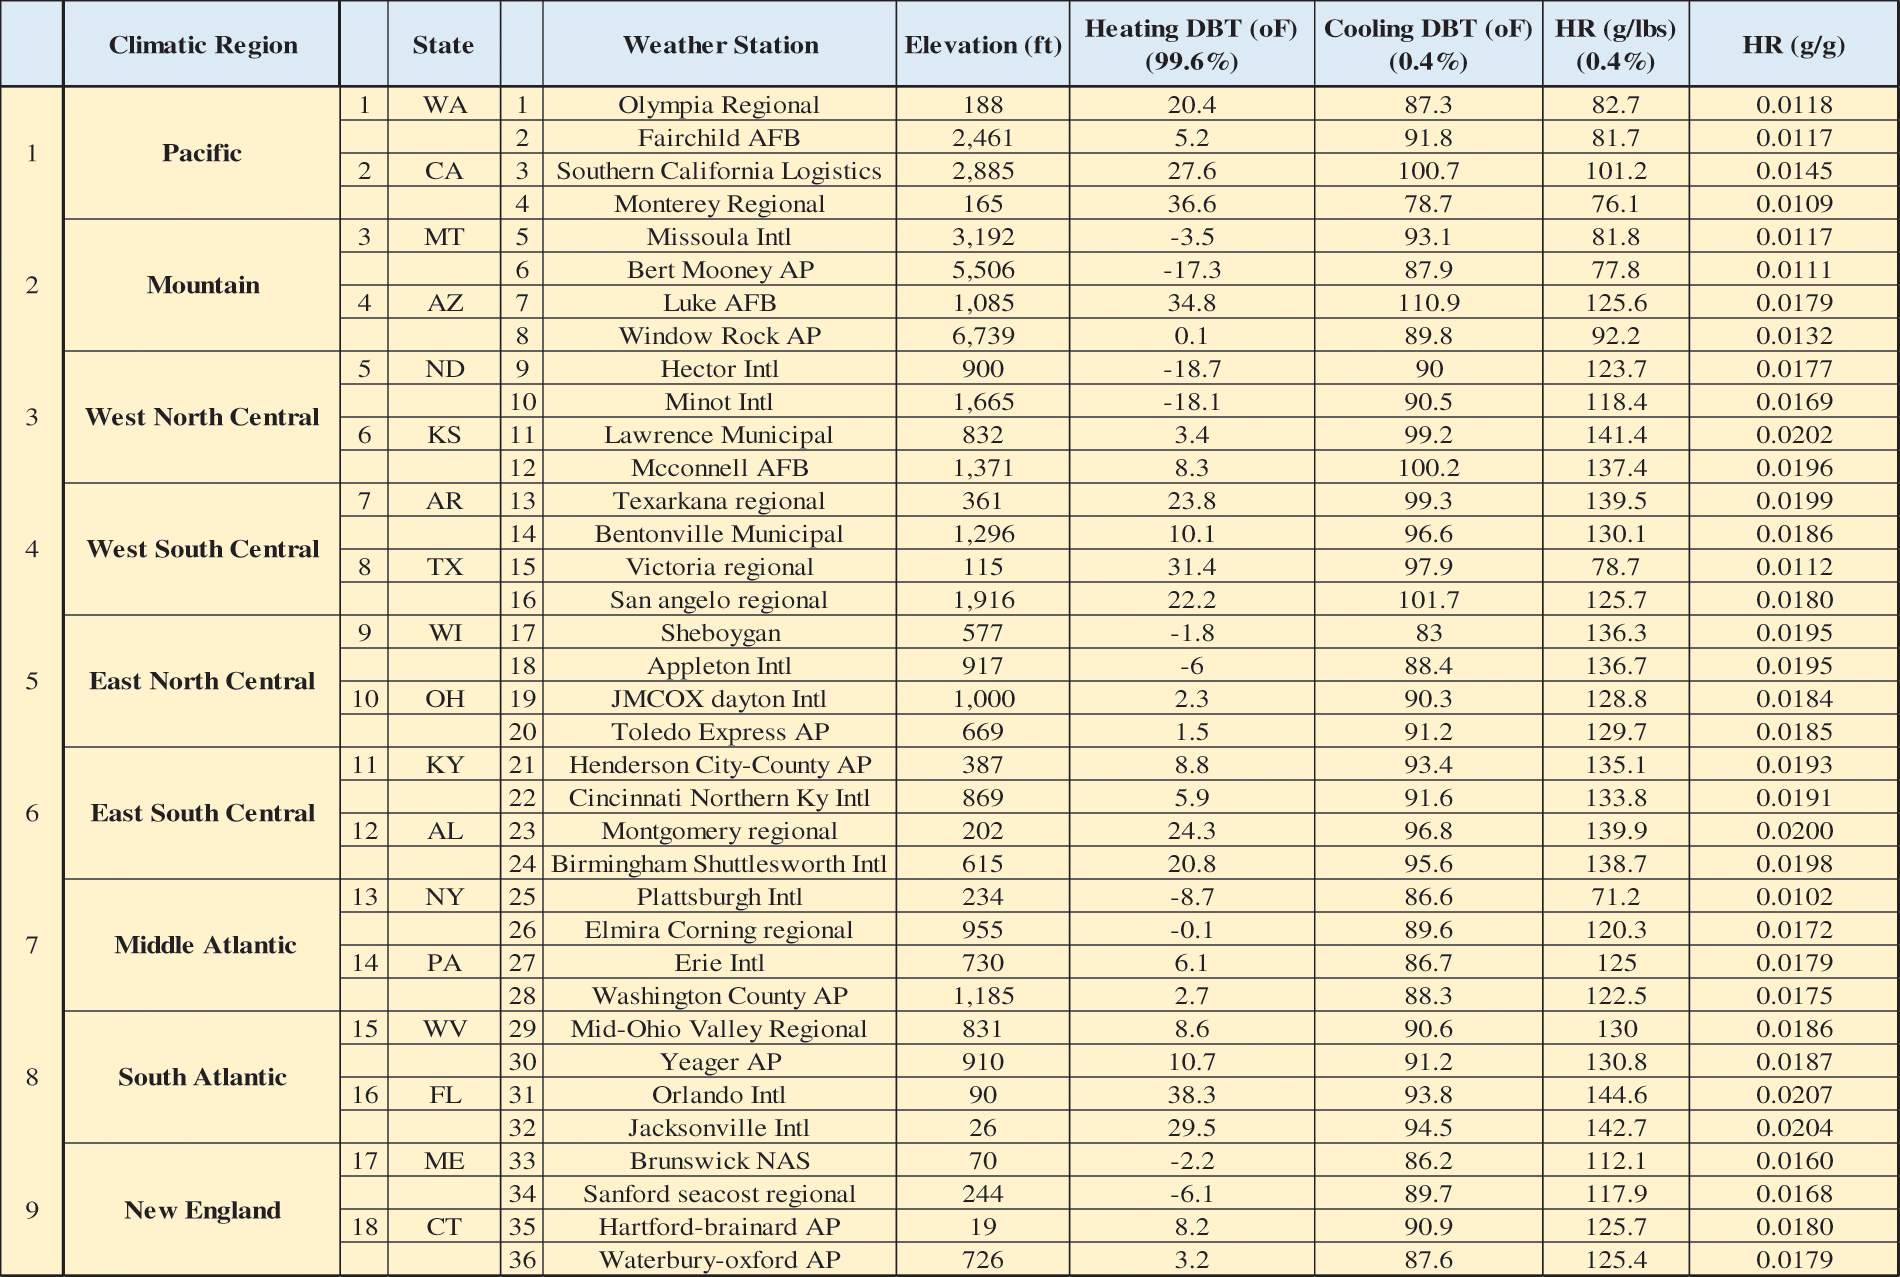
Figure 2: Climatic data from 2017 ASHRAE handbook [32]
Once the information is provided on the “User Manual” worksheet, the model directs the user to the sheet “Inputs.” The user must select all the rooms from the given list and level for the building envelope from the drop-down menu for each room. The model explains to the user to decide on what level of building envelope to select. Further, the user must enter the room's dimensions (area and height), thermostat settings for setpoint, and setback temperature for summer and winter. The screenshot of the sheet “Inputs” is shown in Fig. 3.
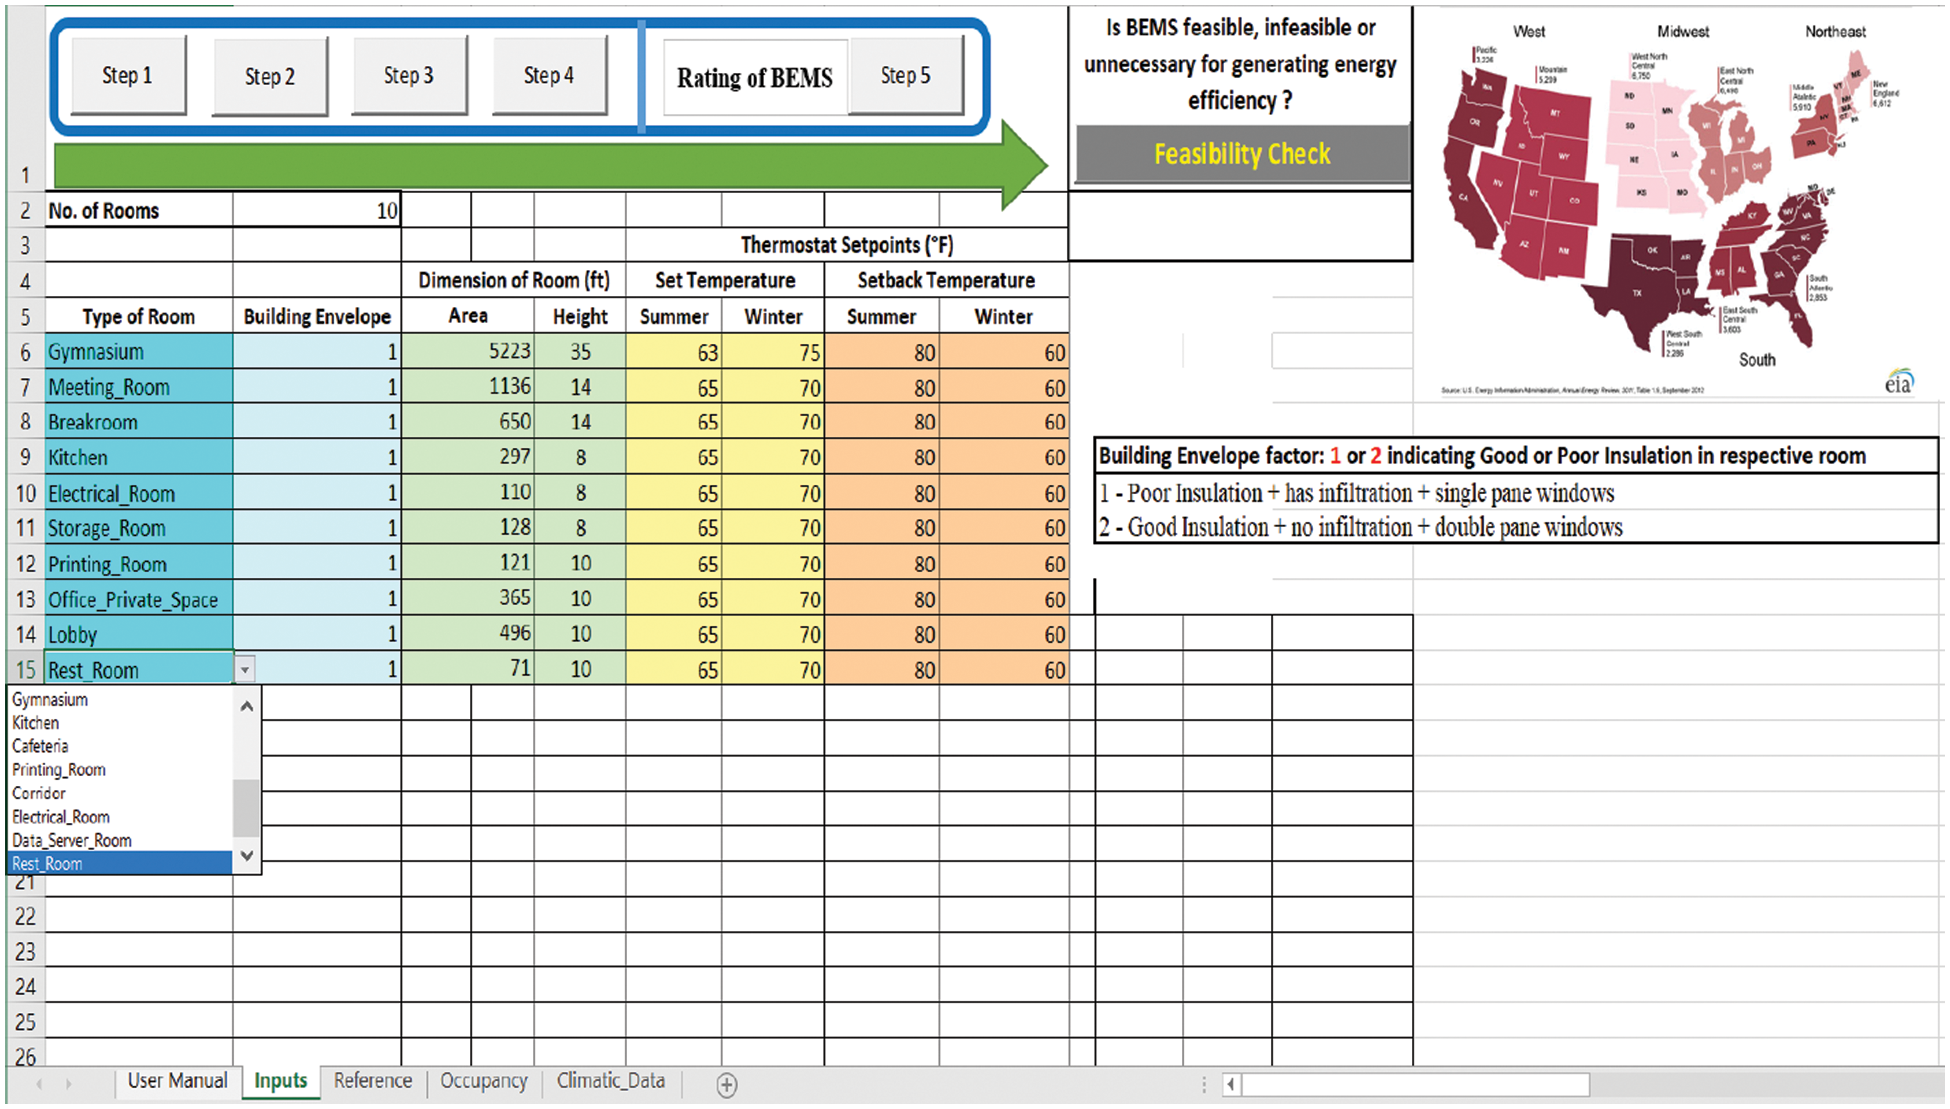
Figure 3: “Inputs” worksheet
4 Simulation System Execution, Results and Discussion
For the demonstration of the simulation tool, a community center in Huntington, West Virginia, has been selected. The reason for choosing this community center is that it has multiple types of zones such as Gymnasium, Breakroom, Meeting Room, and Office spaces with different occupancy levels at different periods throughout the day. Hence, this building is considered an ideal building to determine the effectiveness of the energy management system. The floorplan of the community center is shown in Fig. 4.
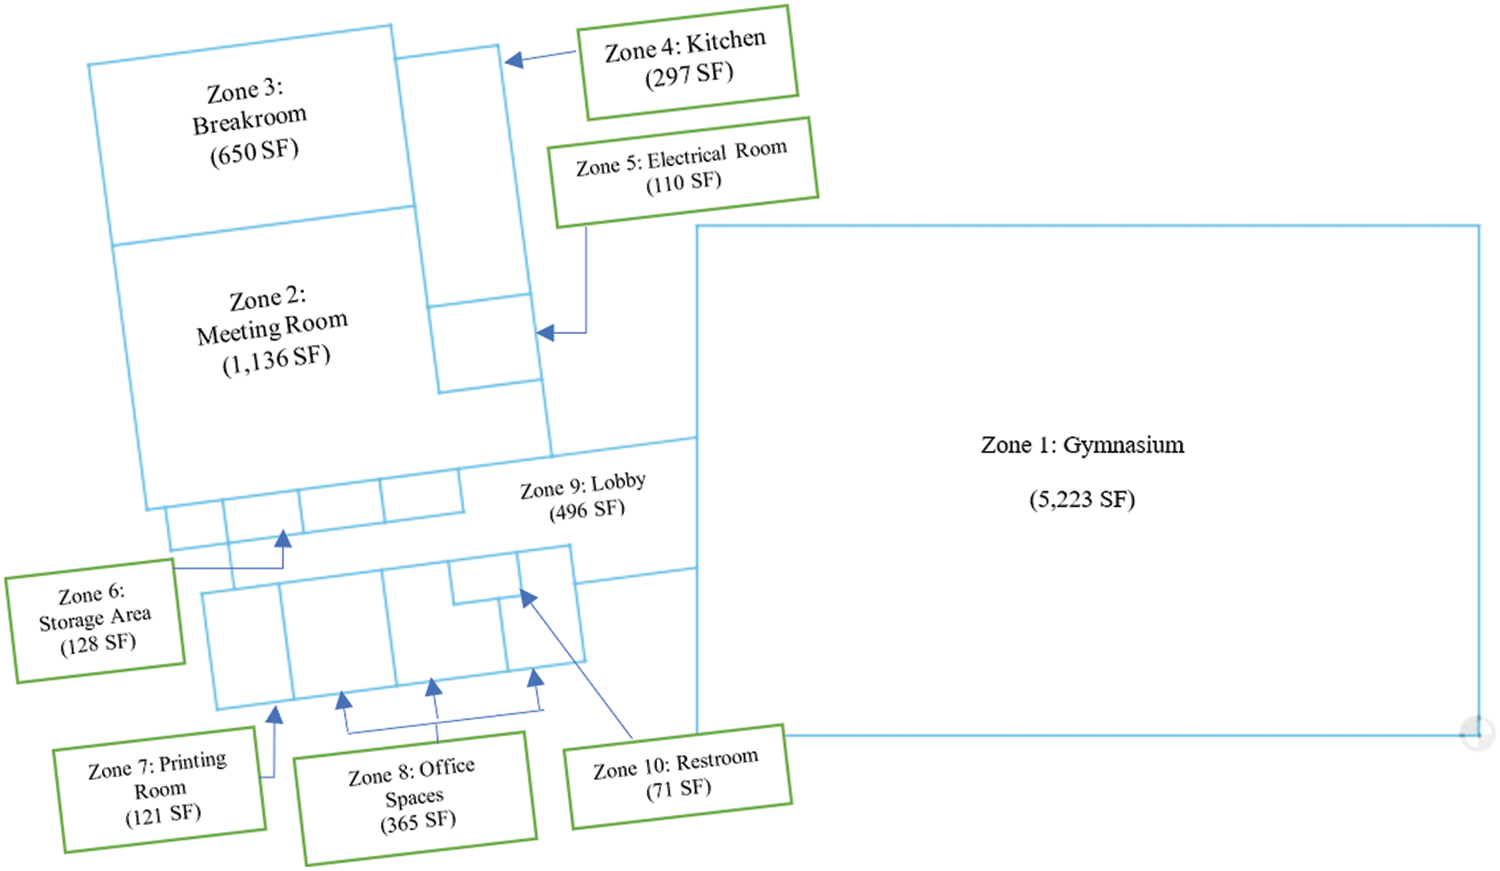
Figure 4: Floorplan of the community center
Considering all the current operating characteristics of the building, the annual energy required for the HVAC system of the building is determined by using the simulation tool.
4.2 Simulation Demonstration with Community Center Building
The simulation is performed in two runs. For the first run (Base Case), the current operating characteristics of the building with current BEMS controls are input into the model.
4.2.1 Simulation with User-Defined/Base Case
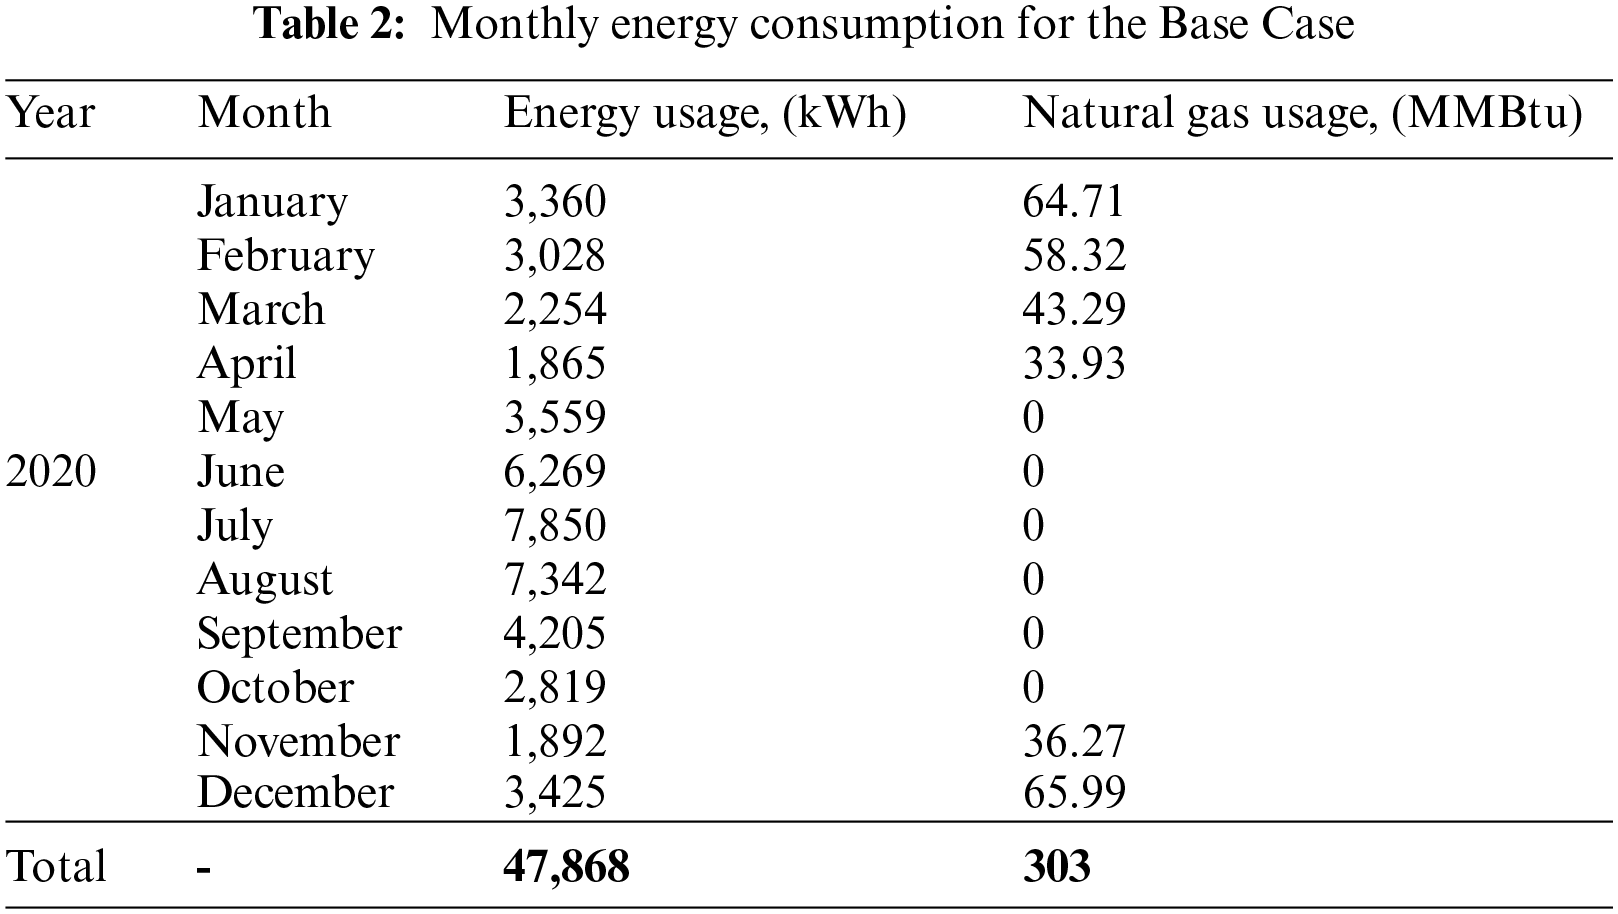
The user is asked to select the BEMS controls used in the building. The user is asked to input the approximate percentage of outdoor air intake inside the building for ventilation. The user has to manually input the thermostat setting, area, and height of the individual room. The simulation will summarize the total energy required for space heating and cooling for all twelve months, as shown in Table 2.
4.2.2 Simulation with all BEMS Controls and Improved Building Envelope
Table 3 summarizes the total energy needed for space heating and cooling for all twelve months during the TEE Case.
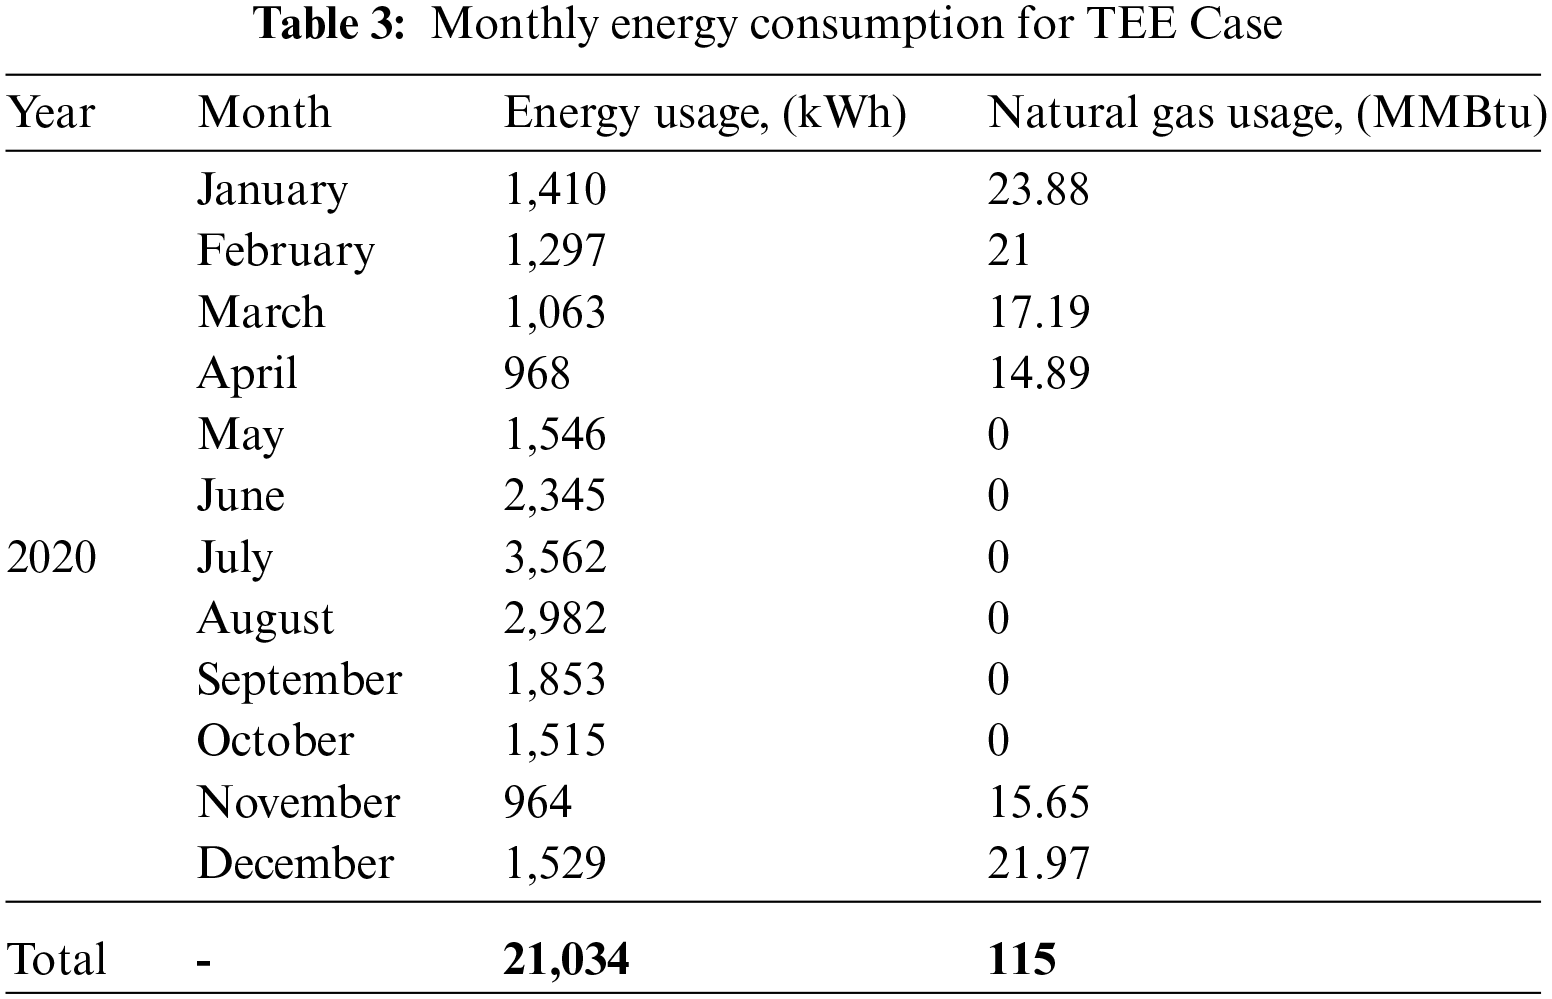
The simulation determined that the total annual electrical energy (kWh) and natural gas (MMBtu) required for the Base Case was 47,868 kWh and 303 MMBtu, respectively. While, for the TEE Case considering all the BEMS controls and improved building envelope insulation, the total annual electrical energy (kWh) and natural gas (MMBtu) required is 21,034 kWh and 115 MMBtu, respectively. The electrical energy consumption was reduced by approximately 56%, and the natural gas consumption was reduced by about 62%.
Table 4 compares the difference in energy consumption for electricity (kWh) and natural gas (MMBtu) monthly. Further, the effectiveness of BEMS is also determined every month.
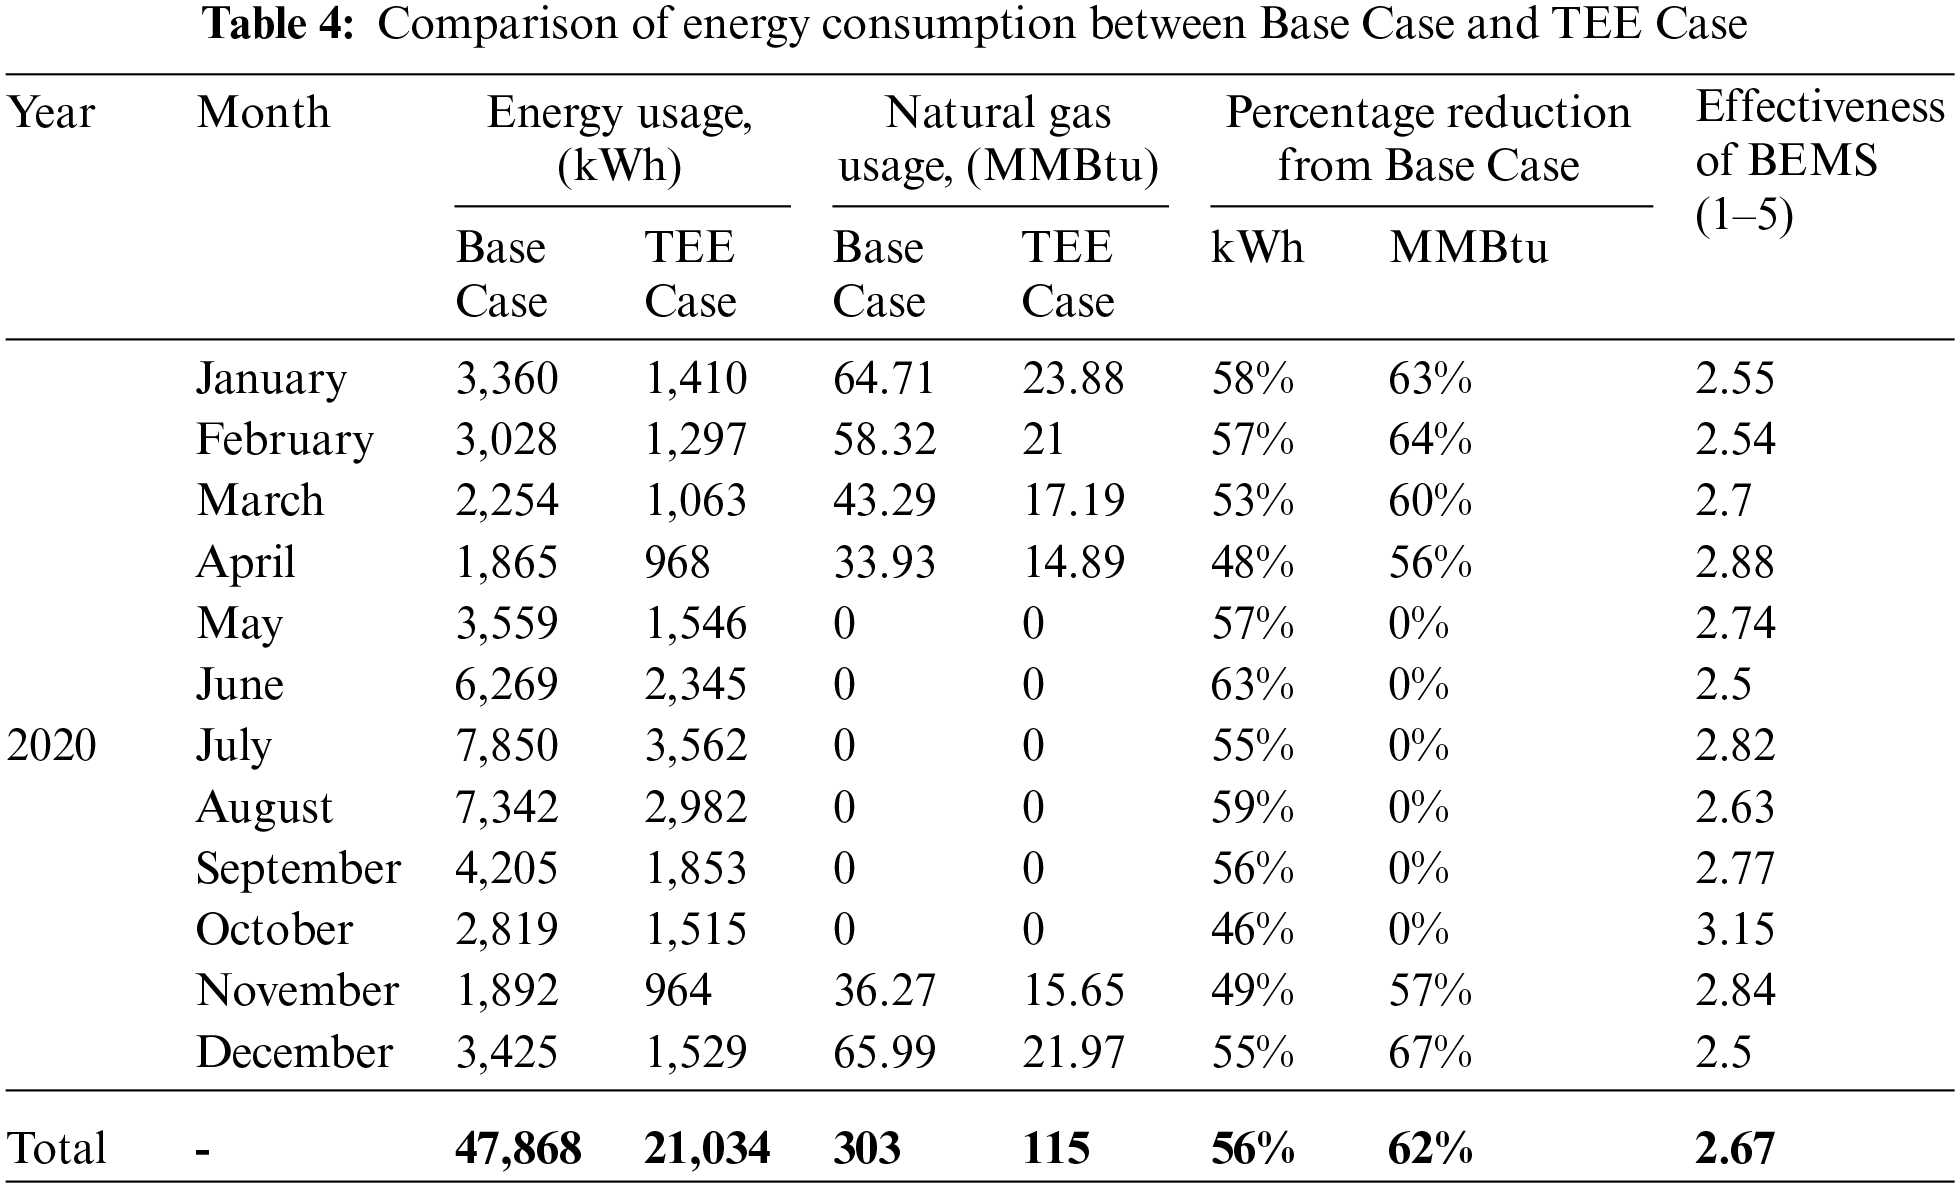
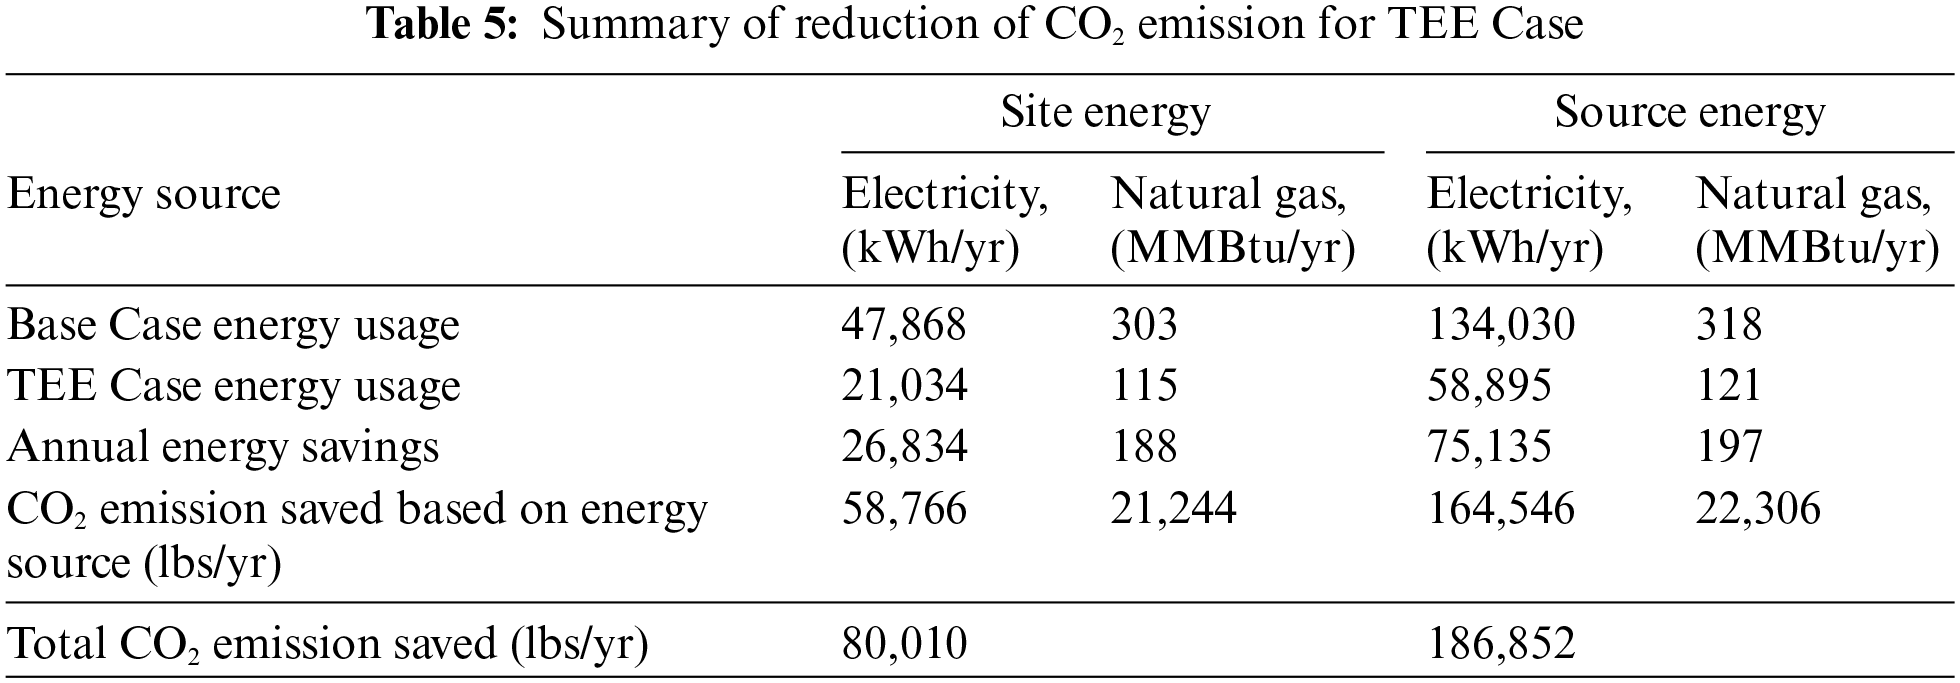
Table 5 shows the summary of the reduction of CO2 emission for the TEE Case. By upgrading the building to TEE Case from Base Case, the reduction of CO2 for site energy is 80,010 lbs/yr, and for source, energy is 186,852 lbs/yr.
Figs. 5 and 6 show that the highest electricity demand for space cooling during July has reduced from 7,850 to 3,562 kWh. This reduces the energy cost of the building and reduces the overall demand cost for electricity. Further, the highest demand for natural gas during December of 66 MMBtu declined to 23.88 MMBtu in January in the TEE Case. Hence, by adding the BEMS controls, the overall need for space cooling and heating can be reduced. This reduces the cost associated with energy consumption and opens areas for downsizing the HVAC components while upgrading the system. Downsizing the HVAC equipment can further help to minimize the excess waste of energy.
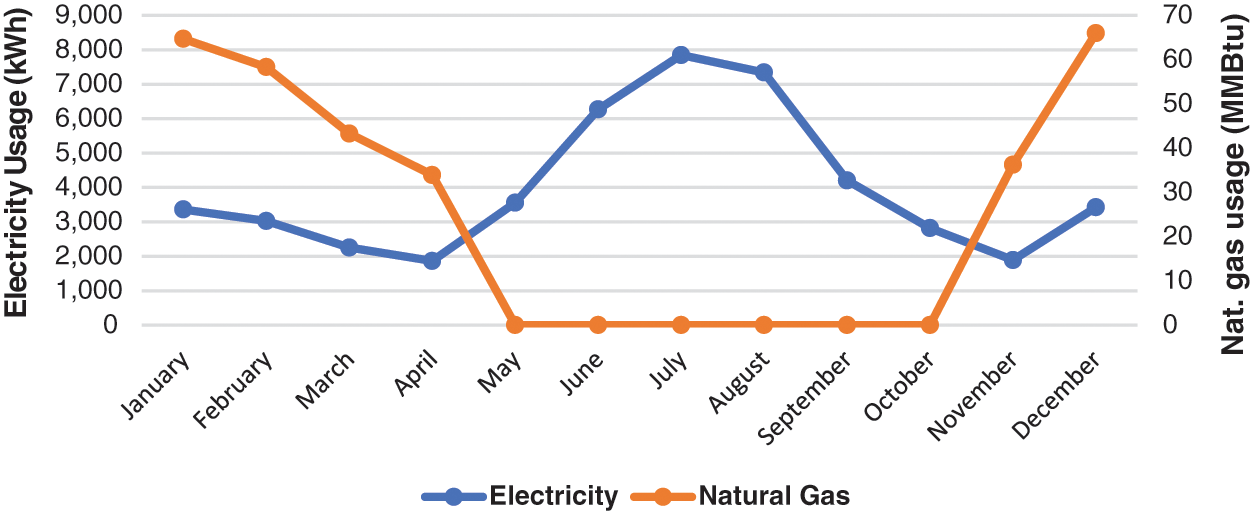
Figure 5: Energy consumption pattern for the Base Case

Figure 6: Energy consumption pattern for TEE Case
The following Figs. 7 and 8 compare the electric energy consumption and natural gas consumption for the Base Case and TEE Case.
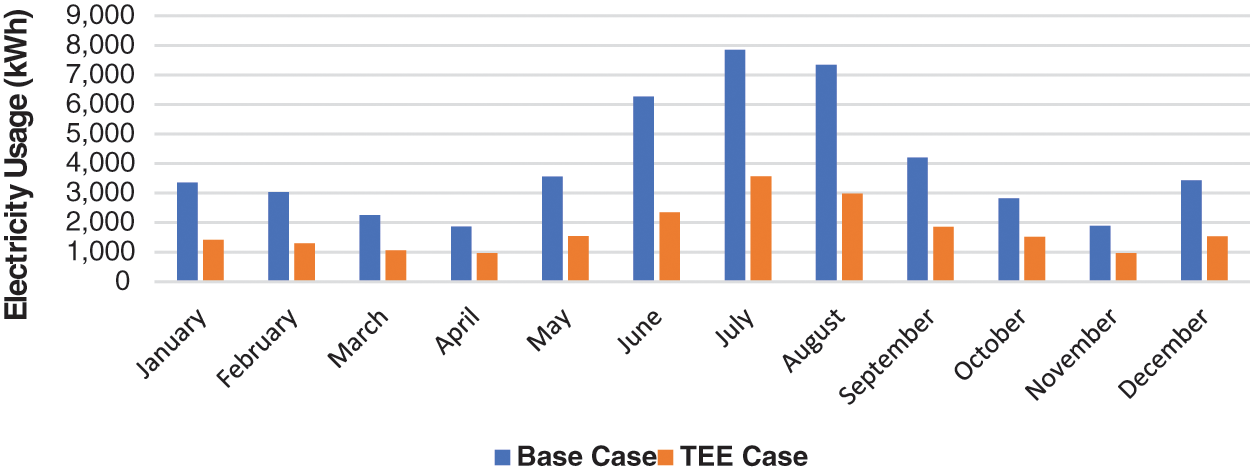
Figure 7: Comparison of electrical energy consumption between Base Case and TEE Case
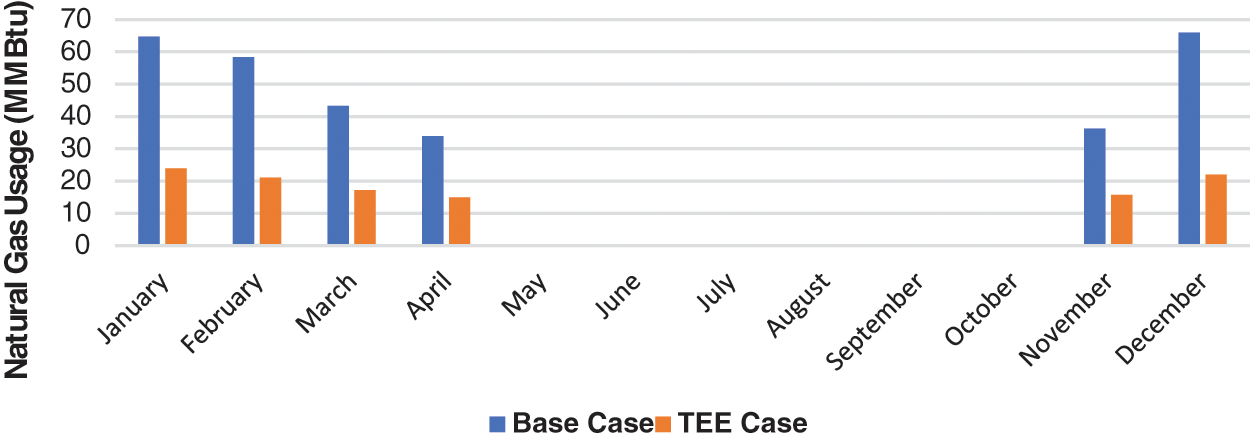
Figure 8: Comparison of natural gas consumption between Base Case and TEE Case
From Fig. 9, it can be seen that the efficacy of BEMS ranges from 2.5 to 3.15. The overall usefulness of BEMS is determined to be 2.67. According to the rating chart, as shown in Table 1, the effectiveness of BEMS is considered “Not Good”.
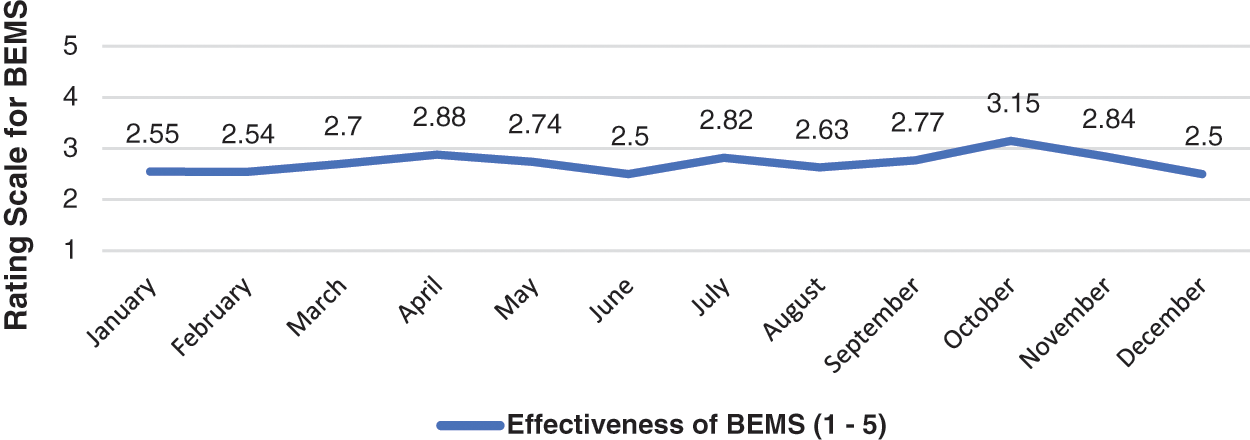
Figure 9: Effectiveness of BEMS for Base Case
The simulation tool is designed to handle any number of rooms; however, the constraint would be the time required for the simulation run, available BEMS controls, and building parameters to input in the model. Only four BEMS controls are considered in this study, and limited building parameters can be input into the model. Furthermore, multiple tests were performed to determine the time required for a various number of rooms, and it was found that the total time needed to simulate three rooms was 15–20 min, five rooms were 25–30 min, ten rooms were 35–45 min, and 15 rooms were 50–60 min. A default time of 10 min is included in above mentioned time duration for the input of the values from the user. The simulation was run on a computer with Intel Core i7-8550U CPU @ 1.80 GHz (8 CPUs) and 8,192 MB RAM. The simulation would take less time if run on a computer with better computing capabilities.
Further, with advanced computing computers, the simulation tool can perform faster even with a more significant number of rooms. This simulation tool would be a helpful tool to get a quick estimate of the energy required for space heating and cooling of the building. Further, it would also help in understanding the requirement of outside air for maintaining the IAQ. Moreover, it can act as a bridge between building owner/energy managers and advanced energy modeling tools to benchmark the effectiveness of their BEMS. Since energy modeling of a building is cumbersome work and would require professional help to model the building in the software. By using this simulation tool, building owners can easily understand the energy required for space heating and cooling the building and the effectiveness of their BEMS.
In this study, the effect of building operating characteristics and BEMS controls on energy consumption for heating and cooling the building is studied. The study was carried out by developing an MS Excel-based decision support system where users can enter the input parameters related to their building operating characteristics and BEMS controls. A rating of the BEMS is calculated on a continuous scale of 1–5 based on the estimated annual energy consumption. These data could benefit energy managers or building owners to design the HVAC system and add control systems based on their necessity. Further, this rating could also help benchmark the energy consumption of the building against their past energy consumption data.
The limitations are described below:
– Only electricity and natural gas are accounted as a source of energy for cooling and heating the building.
– The model uses many input boxes, and none of them take any character (alphabet/words) or 0 or anything out of the range.
– The model is capable of handling only 16 different types of rooms/spaces. If a building has a different kind of room than available in the model, then the analysis of the building cannot be performed.
– The thermostat settings are set constant throughout the year. Hence, the actual variation in the settings of a thermostat is not accounted for in the model.
– Nine climatic regions, two states from each climatic region, and two weather stations from each state only have been considered for this study.
– Only dehumidification is accounted for energy calculation and not the humidification process for simplicity in calculations.
– The seasonal factor is generated for zone 1 and will remain constant for all the other zones for particular hours.
Future work on this research study involves increasing the number of operating parameters of BEMS controls to determine the effectiveness of a much complex building energy management system. A summary of possible forthcoming work related to this study are listed below:
1. Inclusion of more BEMS controls/operating parameters such as advanced metering infrastructure to analyze electric demand and consumption patterns for a building, automated demand response controls, and benchmarking of energy consumptions.
2. Accounting for more energy sources other than electricity and natural gas. Many commercial buildings also use district steam and fuel #2 oil.
3. Including all of the states of the United States for the study. This will help analyze the effectiveness of BEMS of commercial buildings from any part of the U.S.
Acknowledgement: This research work acknowledges that three of the authors worked at the Industrial Assessment Center at West Virginia University while two of the authors were faculty members at West Virginia University.
Funding Statement: The first three authors who conducted this research were partly funded by the Industrial Assessment Center Project, supported by grants from the US Department of Energy and by the West Virginia Development Office.
Conflicts of Interest: The authors declare that they have no conflicts of interest to report regarding the present study.
References
1. U.S. Energy Information Administration (2018). 2018 Commercial buildings energy consumption survey. Washington DC: U.S. Energy Information Administration. [Google Scholar]
2. U.S. Energy Information Administration (2016). 2012 Commercial building energy consumption survey. Washington DC, USA: EIA. [Google Scholar]
3. Office of Energy Efficiency & Renewable Energy (2020). Innovation in sensors and controls for building energy management. Wahington DC: U.S. Department of Energy. [Google Scholar]
4. Jamil, M., Mittal, S. (2017). Building energy management system: A review. 14th IEEE India Council Internation Conference (INDICON), Roorkee. DOI 10.1109/INDICON.2017.8488004. [Google Scholar] [CrossRef]
5. Mei, P. J. (2011). Building energy management systems (BEMS)-energyzine. In: Energy in building and industry. Rugeley, UK. [Google Scholar]
6. Sayed, K., Gabbar, H. A., H., A. (2017). Building energy management systems (BEMS). In: Energy conservation in residential, commercial, and industrial facilities, pp. 15–81. NJ, USA: John Wiley & Sons. [Google Scholar]
7. Chen, C. N., Cho, M. Y., Lee, C. H. (2016). Design and implementation of building energy management system. 3rd International Conference on Green Technology and Sustainable Development, USA. [Google Scholar]
8. Hernandez, D. M., Callejo, L. H., Lamadrid, A. Z., Perez, O. D., Garcia, F. (2021). A review of strategies for building energy management system: Model. Journal of Building Engineering, 33, 1–12. [Google Scholar]
9. Djuric, N., Novakovic, V., Frydenlund, F. (2008). Heating system performance estimation using optimization tool and BEMS data. Energy and Buildings, 40(8), 1367–1376. DOI 10.1016/j.enbuild.2007.12.006. [Google Scholar] [CrossRef]
10. Pacific Northwest National Laboratory (2012). Building re-tuning training guide: Occupancy scheduling: Night and weekend temperature set back and supply fan cycling during unoccupied hours. Richmond: Pacific Northwest National Laboratory. [Google Scholar]
11. Verma, N., Jain, A. (2018). Optimized automatic lighting control in a hotel building for energy efficiency. 2018 International Conference on Power Energy, Environment and Intelligent Control (PEEIC), Greater Noida, India. [Google Scholar]
12. Sohn, M. D., Black, D. R., Price, P. N., Lin, Y., Brahme, R. (2010). Occupancy-based energy management in buildings: Final report to sponsors. California: Lawrence Berkeley National Laboratory. [Google Scholar]
13. Liu, G., Brambley, M. R. (2011). Occupancy based control strategy for variable-air-volume (VAV) terminal box systems. ASHRAE Transactions, 117(2), 244–253. [Google Scholar]
14. Ardiyanto, D., Pipattanasomporn, M., Rahman, S., Hariyanto, N., Suwarno (2018). Occupant-based HVAC set point interventions for energy savings in buildings. Green Energy for Sustainable Development. Thailand. [Google Scholar]
15. Mandlem, K., Gopalakrishnan, B., Nimbarte, A., Mostafa, R., Das, R. (2020). Energy efficiency effectiveness of smart thermostat based BEMS. Energy Engineering, 117(4), 165–183. DOI 10.32604/EE.2020.011406. [Google Scholar] [CrossRef]
16. Zhang, L. (2008). Experimental and simulation study of demand-controlled ventilation. Iowa: Iowa State University. [Google Scholar]
17. Zio, E. (2013). The Monte Carlo Simulation method for system reliability and risk analysis. London: Springer London. [Google Scholar]
18. Farzaneh, H., Malehmirchegini, L., Bejan, A., Afolabi, T., Mulumba, A. et al. (2021). Artificial intelligence evolution in smart buildings for energy efficiency. Applied Sciences, 11(2), 763. DOI 10.3390/app11020763. [Google Scholar] [CrossRef]
19. Wang, X., Mao, X., Khodaei, H. (2021). A multi-objective home energy management system based on internet of things and optimization algorithms. Journal of Building Engineering, 33(14), 101603. DOI 10.1016/j.jobe.2020.101603. [Google Scholar] [CrossRef]
20. Himeur, Y., Ghanem, K., Alsalemi, A., Bensaali, F., Amira, A. (2021). Artificial intelligence based anomaly detection of energy consumption in buildings: A review, current trends and new perspectives. Applied Energy, 287(3), 116601. DOI 10.1016/j.apenergy.2021.116601. [Google Scholar] [CrossRef]
21. Elsisi, M., Tran, M. Q., Mahmoud, K., Lehtonen, M., Darwish, M. M. (2021). Deep learning-based Industry 4.0 and internet of things towards effective energy management for smart buildings. Sensors, 21(4), 1038. DOI 10.3390/s21041038. [Google Scholar] [CrossRef]
22. Elnour, M., Himeur, Y., Fadli, F., Mohammedsherif, H., Meskin, N. et al. (2022). Neural network-based model predictive control system for optimizing building automation and management systems of sports facilities. Applied Energy, 318(8), 119153. DOI 10.1016/j.apenergy.2022.119153. [Google Scholar] [CrossRef]
23. Elnour, M., Fadli, F., Himeur, Y., Petri, I., Rezgui, Y. et al. (2022). Performance and energy optimization of building automation and management systems: Towards smart sustainable carbon-neutral sports facilities. Renewable and Sustainable Energy Reviews, 162(4), 112401. DOI 10.1016/j.rser.2022.112401. [Google Scholar] [CrossRef]
24. Can Duman, A., Erden, H. S., Gönül, Ö., Güler, Ö. (2021). A home energy management system with an integrated smart thermostat for demand response in smart grids. Sustainable Cities and Society, 65(1), 102639. DOI 10.1016/j.scs.2020.102639. [Google Scholar] [CrossRef]
25. Aliero, M. S., Naseer Qureshi, K., Pasha, M. F., Jeon, G. (2021). Smart home energy management systems in internet of things networks for green cities demands and services. Environmental Technology & Innovation, 22(4), 101443. DOI 10.1016/j.eti.2021.101443. [Google Scholar] [CrossRef]
26. Himeur, Y., Elnour, M., Fadli, F., Meskin, N., Petri, I. et al. (2022). Next-generation energy systems for sustainable smart cities: Roles of transfer learning. Sustainable Cities and Society, 85(24), 104059. DOI 10.1016/j.scs.2022.104059. [Google Scholar] [CrossRef]
27. Luo, X. J., Oyedele, L. O. (2021). Forecasting building energy consumption: Adaptive long-short term memory neural networks driven by genetic algorithm. Advanced Engineering Informatics, 50(3), 101357. DOI 10.1016/j.aei.2021.101357. [Google Scholar] [CrossRef]
28. Lissa, P., Deane, C., Schukat, M., Seri, F., Keane, M. et al. (2021). Deep reinforcement learning for home energy management system control. Energy and AI, 3(1), 100043. DOI 10.1016/j.egyai.2020.100043. [Google Scholar] [CrossRef]
29. Mariano-Hernández, D., LHernández-Callejo, L., Zorita-Lamadrid, A., Duque-Pérez, O., Santos García, F. (2021). A review of strategies for building energy management system: Model predictive control, demand side management, optimization, and fault detect & diagnosis. Journal of Building Engineering, 33, 101692. DOI 10.1016/j.jobe.2020.101692. [Google Scholar] [CrossRef]
30. Aliero M. S., Qureshi K. N., Pasha M. F., Jeon G. (2021). Smart home energy management systems in internet of things networks for green cities demands and services. Environmental Technology & Innovation, 22(4), 101443. DOI 10.1016/j.eti.2021.101443. [Google Scholar] [CrossRef]
31. Jradi, M., Boel, N., Madsen, B. E. (2021). BuildCOM: Automated auditing and continuous commissioning of next generation building management systems. Energy Informatics, 4(1), 2. DOI 10.1186/s42162-020-00136-2. [Google Scholar] [CrossRef]
32. ASHRAE (2017). 2017 ASHRAE Handbook-Fundamentals. ASHRAE. https://www.ashrae.org/technical-resources/ashrae-handbook/table-of-contents-2017-ashrae-handbook-fundamentals. [Google Scholar]
33. CheCalc (2015). Psychrometric Calculations. https://checalc.com/calc/wetBulb.html. [Google Scholar]
34. Silberstein, E., Obrzut, J., Tomczyk, J., Whitman, B., Johnson, B. (2017). Refrigeration and air conditioning technology. Eighth edition. USA: Cengage Learning. [Google Scholar]
35. Weather Spark (2016). Average Weather in Huntington West Virginia, United States. https://weatherspark.com/y/17230/Average-Weather-in-Huntington-West-Virginia-United-States-Year-Round#Sections-Sources. [Google Scholar]
Cite This Article
 Copyright © 2023 The Author(s). Published by Tech Science Press.
This work is licensed under a Creative Commons Attribution 4.0 International License , which permits unrestricted use, distribution, and reproduction in any medium, provided the original work is properly cited.
 Downloads
 Citation Tools