
 Submit a Paper
 Propose a Special lssue
 Open Access
ARTICLE

Optimization of Electricity Purchase and Sales Strategies of Electricity Retailers under the Condition of Limited Clean Energy Consumption
1 Changsha University of Science & Technology, Changsha, 410114, China
2 State Grid Shaoyang Electric Power Company, Shaoyang, 422099, China
3 State Grid Ganzhou Electric Power Company, Ganzhou, 341099, China
* Corresponding Author: Peng Liao. Email:
(This article belongs to the Special Issue: Key Technologies of Renewable Energy Consumption and Optimal Operation under )
Energy Engineering 2023, 120(3), 701-714. https://doi.org/10.32604/ee.2022.024301
Received 27 May 2022; Accepted 10 August 2022; Issue published 03 January 2023
 View Full Text
 Download PDF
Abstract
In the process of my country’s energy transition, the clean energy of hydropower, wind power and photovoltaic power generation has ushered in great development, but due to the randomness and volatility of its output, it has caused a certain waste of clean energy power generation resources. Regarding the purchase and sale of electricity by electricity retailers under the condition of limited clean energy consumption, this paper establishes a quantitative model of clean energy restricted electricity from the perspective of power system supply and demand balance. Then it analyzes the source-charge dual uncertain factors in the electricity retailer purchasing and selling scenarios in the mid- to long-term electricity market and the day-ahead market. Through the multi-scenario analysis method, the uncertain clean energy consumption and the user’s power demand are combined to form the electricity retailer’s electricity purchase and sales scene, and the typical scene is obtained by using the hierarchical clustering algorithm. This paper establishes a electricity retailer’s risk decision model for purchasing and selling electricity in the mid- and long-term market and reduce-abandonment market, and takes the maximum profit expectation of the electricity retailer from purchasing and selling electricity as the objective function. At the same time, in the medium and long-term electricity market and the day-ahead market, the electricity retailer’s purchase cost, electricity sales income, deviation assessment cost and electricity purchase and sale risk are considered. The molecular results show that electricity retailers can obtain considerable profits in the reduce-abandonment market by optimizing their own electricity purchase and sales strategies, on the premise of balancing profits and risks.Graphic Abstract
Keywords
At present, the reform of the global energy structure is in full swing, and vigorous development of clean energy has become an irreversible trend of the times. Facing the increasingly serious contradiction between energy development and utilization and the deterioration of resources and environment, China is vigorously developing low-carbon energy and renewable energy, reducing its dependence on traditional fossil energy, and building a comprehensive energy supply system with clean energy as the core.
While the energy transition has brought rapid development to the clean energy industry, it has also brought enormous challenges. The output of clean energy units, mainly hydropower, wind power and photovoltaic power generation, is affected by the characteristics of water power, wind power, and light resources in the natural environment. Due to the seasonal rotation and the alternation of day and night, it presents seasonal and periodical fluctuation characteristics. The distribution of clean energy resources and load demand have the characteristics of reverse distribution in the spatial and temporal dimensions. During the superimposed period of the flood season and the strong wind season, the imbalance between power supply and demand is prominent, and clean energy consumption is difficult [1].
Under the condition that the consumption of clean energy is limited, electricity retailers can not only purchase electricity through the monthly wholesale market, but also purchase electricity through the reduce-abandonment market. The market is organized by the electricity trading center when it predicts the difficulty of clean energy consumption. However, the output of clean energy units such as hydropower, wind power and photovoltaic power generation is affected by the distribution of water, wind, and light resources in the natural environment. Due to seasonal rotation and day-night alternation, it presents seasonal and time-period fluctuation characteristics. The theoretical maximum output and the amount of electricity to be consumed are great uncertainty [2,3]. In the reduce-abandonment market, the changes in the electricity to be consumed by clean energy will affect the electricity generators’ declared electricity volume and declared price in the electricity wholesale market, resulting in the uncertainty of the market clearing electricity price and clearing electricity volume.
For electricity retailers, the profit from purchasing and selling electricity comes from the difference between the price of electricity purchased and sold in the retail market and the wholesale market [4]. The fluctuation of electricity purchase price will directly affect the electricity purchase cost of electricity retailers, which will bring certain risks to the electricity retailer’s electricity purchase and sale strategy [5,6]. This paper firstly uses the multi-scenario analysis method to combine the uncertain time-based clean energy consumption limited electricity consumption and user electricity demand data into different electricity purchase and sale scenarios, and based on the scene clustering technology, the many electricity purchase and sale scenarios are simplified into several categories typical electricity purchase and sale scenarios, so as to convert uncertain parameters into multiple deterministic parameters that are easy to solve. Then, considering various electricity purchase and sale scenarios and their occurrence probability [7,8], analyze and calculate the profit and loss of electricity retailers in various typical scenarios. And the conditional value-at-risk (CVaR) method is used to evaluate the loss risk and comprehensively evaluate the profit risk level, and finally make the optimal purchase and sale decision under the condition of balancing profit and risk [9].
2 Analysis of the Limited Consumption of Clean Energy
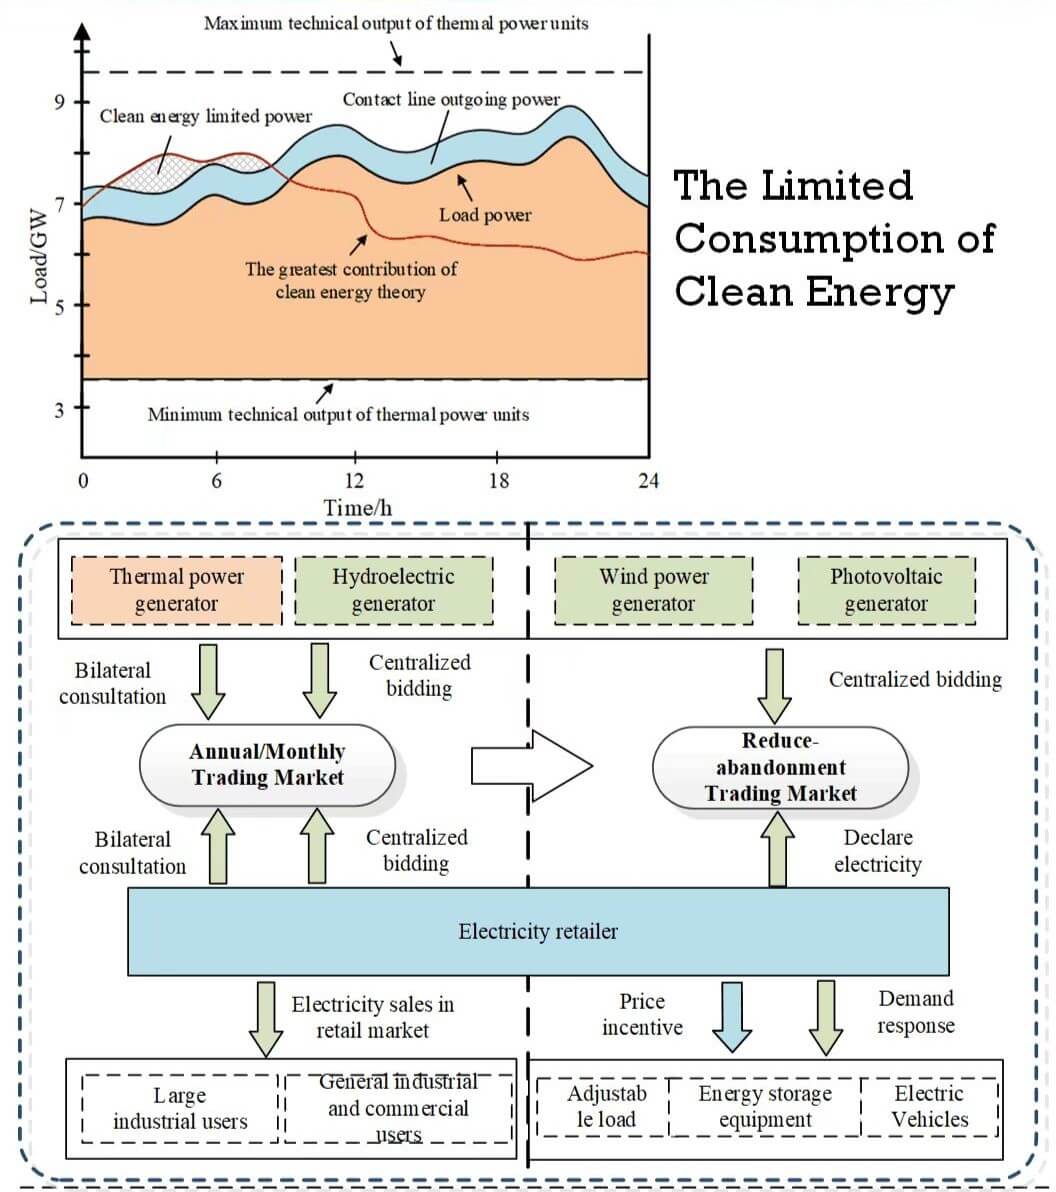
The four links of power generation, transmission, distribution and utilization in the power system are carried out at the same time and completed in an instant, and the power load has obvious randomness [10,11]. In order to ensure the real-time balance of the system, the conventional power output must be adjusted to dynamically track the load changes. Only when the system regulation ability is greater than the load change, the power system can operate safely and stably [12]. After a high proportion of wind, photovoltaic power generating units and radial hydropower generating units with no adjustment capability are connected to the power system, conventional units not only need to track the load changes on the user side, but also stabilize the power generation side wind, photovoltaic power output and radial hydropower output fluctuations, to ensure the dynamic balance of power generation and electricity consumption in the power system [13]. When the regulation capacity provided by the conventional units in the system is not enough to balance load changes and clean energy output fluctuations [14], wind, photovoltaic power generation units and radial hydroelectric units without regulation capacity will reduce the output level, resulting in abandoned water, wind and photovoltaic power [15]. Therefore, the limited consumption of clean energy is closely related to the situation of clean energy power generation resources, system adjustment capacity, and load demand level [16]. When there is no line blockage in the power system in the area, the actual power generation of clean energy is the difference between the “total system load curve and external power curve” and the minimum technical output of the thermal power unit [17]. The clean energy power generation resources are better in the flood season and strong wind season, and the theoretical maximum power generation is greater than the actual power generation of clean energy, that is, the consumption of clean energy is limited [18]. The limited amount of clean energy consumption is the difference between the theoretical maximum power generation and the actual power generation, as shown in Fig. 1.

Figure 1: Clean energy consumes limited electricity
For any time
In the above equations,
Integrating Eq. (1), the limited electricity consumption of clean energy in period t can be expressed as:
In the above equations:
Considering that the consumption of clean energy is limited in the period
In the above equation:
To sum up, the limited electricity consumption of clean energy in period
In the above equation:
3 Electricity Retailer’s Operation Mode to Promote New Energy Consumption
3.1 Operational Framework of Electricity Retailers Considering Reduce-Abandonment Market
In general, electricity retailers only participate in medium and long-term transactions. Electricity retailers purchase electricity through centralized bidding, bilateral negotiation and other transaction modes in the wholesale market, and sell electricity to retail users through bilateral negotiation in the retail market, and their income comes from the price difference between the wholesale market and the retail market.
During the period when the consumption of clean energy is limited, the Electricity Trading Center organized reduce-abandonment transactions a few days ago. The electricity retailer purchases the electricity to be consumed at a lower price in the reduce-abandonment market. Through demand-side flexible resource management, users are encouraged to increase the response electricity on the basis of maintaining the original purchased electricity and complete the electricity purchase and sale transaction of the clean energy to be consumed. By designing a reasonable demand response mechanism and optimizing incentive pricing decisions, the interest rate difference between the purchase and sale of electricity can be used to obtain sufficient profits and achieve a win-win situation for clean energy generators, electricity retailers and electricity users. The service objects of electricity retailers are composed of general industrial and commercial users, large industrial users, adjustable loads, electric vehicle users, and energy storage equipment. The operation mode of electricity retailers under the condition of restricted clean energy consumption is shown in Fig. 2.

Figure 2: The operation mode of electricity retailer considering new energy consumption
3.2 The Clearing Process of Reduce-Abandonment Market Unilateral Centralized Bidding
The reduce-abandonment market adopts unilateral centralized bidding transaction on the power generation side, and clears it according to the unified price difference. The clearing calculation principle is based on “priority of price difference, priority of time and priority of environmental protection”. The transaction organization process is as follows:
(1) The demander’s electricity declaration. According to their own electricity demand, electricity retailers and major electricity users declare the electricity quantity through the electricity trading center platform, and obtain the total demand electricity
(2) Power generators bid unilaterally. Power generators declare electricity and prices through the power trading center platform. Suppose a total of n clean energy power generators participate in the reduction and abandonment session, and the electricity and price declared by the i-th clean energy power generator are
In the above equation:
The electricity trading center sorts the declared electricity quantities according to the order of the declared price from low to high. When the above conditions are all the same, the electricity trading center will combine and sort multiple declared electricity quantities with the same conditions, thereby forming a seller’s electricity quantity declaration queue with monotonically increasing prices.
(3) The transaction price is cleared. The electricity trading center takes the electricity data from the declared electricity quantity queue in sequence according to the price, and increases the pre-transaction electricity quantity queue data accordingly. When the declared power of the first m power generators in the seller’s declared power queue satisfies the Eq. (8), that is, when the total pre-transaction power is equal to the total demand for the reduce-abandonment market, the clearing calculation is ended.
The reduce-abandonment market clearing price is equal to the last quotation entered into the transaction volume queue, that is, the declared electricity price
(4) Safety check. The power trading center forms an unconstrained transaction result according to the pre-transaction volume of each market entity, and submits it to the power dispatching agency for safety verification. After the verification, the official clearing result will be formed, which will be announced by the trading center.
4 Optimization of Electricity Purchase and Sale Strategies of Electricity Retailers under the Condition of Limited New Energy Consumption
4.1 Cluster Analysis of Electricity Retailer’s Electricity Purchase and Sale Scenarios
The profit of electricity retailers comes from the difference between the purchase and sale of electricity in the retail market and the wholesale market. In the above-mentioned mid-to long-term and reduce-abandonment electricity purchase and sale business in the two-tier market, due to the uncertainty in the consumption of restricted electricity by new energy sources and the uncertainty of users’ electricity demand, the profits of electricity retailers are also faced with uncertain risks. In this paper, the electricity purchase and sale scenario is composed of new energy consumption limited electricity consumption and user electricity demand during each period of the special execution day. Assuming that a total of T times of reduce-abandonment market are organized in the decision-making cycle, all electricity purchase and sale scenarios are expressed as:
In the above equations:
Since it is difficult to determine the number of clustering results in the clustering of electricity purchase and sales scenarios, this paper uses the hierarchical clustering algorithm in structural clustering to cluster all scenarios. The collection of electricity purchase and sales scenarios after clustering is:
In the above equation:
4.2 Electricity Retailer’s Electricity Purchase Cost Model by Time Period
The electricity purchase cost of electricity retailers includes the mid- to long-term monthly wholesale market electricity purchase cost and the day-to-day special demand response electricity purchase cost. The medium and long-term monthly market is mainly divided into bilateral negotiation transactions and centralized bidding transactions.
The centralized bidding transaction adopts the high-low matching method for clearing. The prices declared by power generators are sorted from high to low, and the prices declared by electricity retailers are sorted from low to high and matched and cleared. The clearing price is the average value of the declared prices of both parties. Since it is the period when clean energy is to be consumed, thermal power usually operates in the minimum mode, and the supply capacity of the electricity market is greater than the demanded electricity. Therefore, it is assumed that the electricity retailer declares that the demanded electricity can be fully traded. The electricity purchase costs of electricity retailers in this market are:
In the above equation:
Electricity retailers purchased electricity through bilateral negotiation transactions and unilateral centralized bidding transactions in a reduce-abandonment market recently. After the bilateral negotiation transaction is completed, the electricity retailer declares the demand for electricity, and forms a transaction listing. The electricity generators obtain electricity through price competition, and clear the market according to the declared price. The electricity purchase cost of the electricity retailer in the reduce-abandonment market is:
In the equation:
4.3 Electricity Retailer’s Electricity Sales Revenue Model by Time Period
The electricity retailer’s electricity sales revenue also includes the monthly electricity sales revenue and the previous day’s special demand response electricity sales revenue. In monthly electricity sales, electricity retailers usually sign a fixed-price package contract with users at the end of the previous month, and the contract price is executed within a month and remains unchanged. Then the monthly electricity sales revenue of the electricity retailer can be expressed as:
In the equation:
In the day-ahead demand-response power sales, in order to encourage power users with flexible resources to increase their power purchases, electricity retailers will give users economic incentives according to the step-by-step incentive price. At this time, the power sales revenue can be expressed as:
In the equation: N is the number of optional incentive grades provided by the electricity retailer,
4.4 A Cost Model for Evaluating the Deviation of Electricity Retailers by Time Period
During the actual purchase and sale of electricity by electricity retailers, there is uncertainty in the actual electricity consumption of users, which causes a certain deviation between the total electricity consumption of the electricity retailer’s electricity purchase contract and the actual total electricity consumption. When the deviation between the electricity demand curve declared by the electricity retailer in the reduce-abandonment market and the actual electricity consumption curve exceeds a certain range, the electricity retailer will be punished by theelectricity trading center. The deviation assessment cost of the electricity retailer is composed of the deviation assessment cost of each time period, which can be expressed as:
In the above equations:
4.5 An Optimal Decision-Making Model Considering the Uncertainty of Clean Energy Consumption-Limited Scenarios
4.5.1 Optimization Decision Objective Function
In scenario
Then the expected profit function of the electricity retailer is the sum of the products of all scenario profits and scenario probabilities:
In view of the uncertainty of the results of the reduce-abandonment market caused by the uncertainty of the amount of electricity to be consumed by clean energy sources, electricity retailers may face certain losses in their demand response incentives. In this paper, the loss of electricity purchase and sale of electricity retailers is defined as the difference between the actual profit of a certain scenario and the expected profit of all scenarios, that is:
In this paper, the conditional value-at-risk (CVaR) method is used to describe the loss of this part of the profit. Then the CVaR of the electricity retailer’s electricity purchase and sale income can be expressed as [19]:
In the above equations:
When electricity retailers make decisions on purchasing and selling electricity and incentivizing pricing, they must consider the costs and benefits of the mid-to-long-term market and the reduce-abandonment market, and take into account the risk of loss from implementing demand response incentives. Therefore, the objective function of the electricity retailer’s decision to purchase and sell electricity is:
In the above equation: k is the risk aversion coefficient of the electricity retailer. The larger the k is, the less the power retailer can accept the risk of loss. On the contrary, the smaller the k is, the stronger the risk tolerance of the electricity retailer is.
4.5.2 Optimizing Decision Constraints
(a) Individual Rational Constraints
Introduce individual rational constraints in mechanism design to motivate users to voluntarily participate in demand response. It shows that the formulation of incentive electricity price must make the profit obtained by voluntary participation users at least greater than 0 [20], and its mathematical expression is as follows:
(b) Incentive Compatibility Constraint
Rational users, in order to pursue the maximization of demand response revenue, will inevitably choose the most suitable incentive gear for themselves, then:
(c) Incentive Price Constraint
Only when the set incentive price
(d) Market Purchase and Sale of Electricity and Electricity Balance Constraints
(e) Power Generation Capacity Constraints
The electricity sales of clean power generators in the reduce-abandonment market must meet the constraints of the maximum power generation capacity.
In the above equation:
(f) User Responds to Battery Constraints
In the above equation:
(g) Deviation Power Constraint
In the above equation:
5 Simulation and Numerical Results
It is assumed that the electricity retailer’s bilateral negotiated contract price with all electricity users in the retail market is 502 yuan/MWh. In the mid-to-long-term electricity wholesale market, the electricity price for the bilateral negotiation between electricity retailers and generators is315 yuan/MWh, and the clearing price for centralized bidding transactions is 329 yuan/MWh. The proportion of electricity that is exempted from the monthly electricity purchase and sale by the electricity trading center for electricity retailers is
5.1 Scene Clustering Results and Evaluation
Referring to the power generation and consumption data of the power system in a high-proportion clean energy area, the daily clean energy power data and user load data are obtained. After generating all the scene sets, the hierarchical clustering algorithm is used to cluster the scenes. The clustering tree diagram is shown in Fig. 3.

Figure 3: Hierarchical clustering dendrogram
It can be seen from the clustering dendrogram that when the number of sample categories is 3, the distance between classes is the largest, and the clustering effect is the best. The clustering results are shown in Table 1.

Scenario 1 is an extreme situation where a large amount of water and electricity is coming from hydropower, the electricity to be consumed by clean energy reaches a peak, and the load demand is low. The frequency is higher; in scenario 3, there is less clean energy to be consumed, and the load demand is higher, so the price of electricity for the reduce-abandonment market is higher.
5.2 The Influence of Different Risk Aversion Coefficients on the Profit of Electricity Retailer’s Purchase and Sale of Electricity
For different types of users with flexible resources, different demand response elasticity coefficients are set, and the influence of different demand elasticity coefficients on the profit of electricity purchase and sale of electricity retailers is analyzed.
As can be seen from Fig. 4, with the increase of the elastic coefficient of electricity user demand, the demand response power generated by the user also increases, and the incentive cost invested by the electricity retailer also continues to rise. However, on the other hand, the increase in the amount of electricity in response to user demand enables electricity retailers to declare more listed electricity in the reduce-abandonment market a few days ago, and their profits are also increasing by taking advantage of the price difference between electricity purchases and sales. Therefore, electricity retailers can increase the enthusiasm of users to respond to demand and expand the scale of demand response, so as to obtain greater profits in the reduction and abandonment session.

Figure 4: Changes in the profit of electricity retailers from purchasing and selling electricity under different elasticities of demand
Aiming at the problem of electricity retailer’s purchase and sale of electricity under the condition of limited clean energy consumption, this paper firstly analyzes the source-load dual uncertainty factors in the electricity retailer’s mid- to long-term electricity market and the process of special electricity purchase and sale in the past few days. Then, through the multi-scenario analysis method, the uncertain clean energy consumption limited power consumption and user electricity demand are composed of different electricity purchase and sales scenarios, and the hierarchical clustering algorithm is used to obtain typical electricity purchase scenarios. Then, considering the electricity retailer’s electricity purchase cost, deviation assessment cost, electricity sales revenue and electricity purchase and sales risk, and taking the maximum profit expectation of electricity retailer’selectricity purchase and sales as the objective function, establishes the electricity retailer’s mid- and long-term market-days in the reduce-abandonment market. The risk decision model of purchasing and selling electricity. The influence of relevant factors on the profit of electricity purchase and sale of electricity retailers is analyzed by numerical example simulation, and the following conclusions are obtained: Under the condition of limited consumption of clean energy, electricity retailers can make considerable profits in the medium and long-term and reduce-abandonment market by using the demand response mechanism to fully utilize the flexible resources of users and optimize their own electricity purchase and sale strategies on the premise of balancing profits and risks. At the same time, the incentive-based demand response carried out by electricity retailers can also absorb clean energy electricity in the system, achieving a win-win situation among power generators, electricity retailers and demand response users.
Funding Statement: The authors received no specific funding for this study.
Conflicts of Interest: The authors declare that they have no conflicts of interest to report regarding the present study.
References
1. Shu, Y., Zhang, Z., Guo, J., Zhang, Z. (2017). Analysis of key factors of new energy consumption and research on solutions. Chinese Journal of Electrical Engineering, 37(1), 1–9. [Google Scholar]
2. Huang, D., Shu, Y., Ruan, J., Hu, Y. (2009). Ultra high voltage transmission in China: Developments, current status and future prospects. Proceedings of the IEEE, 97(3), 555–583. DOI 10.1109/JPROC.2009.2013613. [Google Scholar] [CrossRef]
3. Zhou, X., Chen, S., Lu, Z. (2013). Review and prospect of power grid and power grid technology development—On three generations of power grid. Chinese Journal of Electrical Engineering, 33(22), 1–11+22. [Google Scholar]
4. Xu, J. (2017). Research on demand response management and energy storage allocation of power retailers considering risk aversion (Master Thesis). Changsha University of Science and Technology, China. [Google Scholar]
5. Lu, B. (2017). Research on the operation strategy of electricity sales companies considering risk and demand response (Master Thesis). Southeast University, China. [Google Scholar]
6. Luo, S., Jiang, C., Wang, X., Yang, M., Wang, J. et al. (2019). Electricity purchase and sale strategies and risk assessment of electricity sales companies under the background of new electricity reform. Power Grid Technology, 43(3), 944–953. [Google Scholar]
7. Wang, L., Zhang, L., Zhang, F., Jin, D. (2018). Decision-making and risk assessment of electricity purchase and sale business of electricity sales companies. Automation of Electric Power Systems, 42(1), 47–54+143. [Google Scholar]
8. Song, Y., Wang, G., Cai, H., Gao, C., Chen, T. (2020). A review of the research on electricity purchase and sale decisions of electricity sales companies. Power Demand Side Management, 22(6), 85–89. [Google Scholar]
9. Gao, Y. (2019). Research on electricity purchase and sales strategy of electricity sellers considering renewable energy quota system (Master Thesis). Huazhong University of Science and Technology, China. [Google Scholar]
10. Caron, S., Kesidis, G. (2010). Incentive-based energy consumption scheduling algorithms for the smart grid. 2010 First IEEE International Conference on Smart Grid Communications, pp. 391–396. DOI 10.1109/SMARTGRID.2010.5622073. [Google Scholar] [CrossRef]
11. Yan, Q., Qin, C., Nie, M. (2019). Designing household retail electricity packages based on a quantile regression approach. Energy Strategy Reviews, 25, 1–10. DOI 10.1016/j.esr.2019.04.006. [Google Scholar] [CrossRef]
12. He, Y., Wang, M., Yu, J., He, Q., Sun, H. et al. (2020). Research on the hybrid recommendation method of retail electricity price package based on power user characteristics and multi-attribute utility in China. Energies, 13(11), 2693. DOI 10.3390/en13112693. [Google Scholar] [CrossRef]
13. Chen, L., Yang, Y., Yao, J., Yang, S., Song, J. et al. (2013). Design of demand response incentive mechanism based on electric power integration. Automation of Electric Power Systems, 37(18), 82–87. [Google Scholar]
14. Huang, H., Hu, X., Li, X., Yang, J. (2014). A practical optimal compensation pricing model for incentive interrupted loads. Power Grid Technology, 38(8), 2149–2154. [Google Scholar]
15. Fahrioglu, M., Alvarado, F. L. (2000). Designing incentive compatible contracts for effective demand management. IEEE Transactions on Power Systems, 15(4), 1255–1260. DOI 10.1109/59.898098. [Google Scholar] [CrossRef]
16. Ramos, A., Jonghe, C. D., Six, D., Belmans, R. (2013). Asymmety of information and demand response incentives in energy markets. 10th International Conference on EEMICI, Stockholm,Sweden. [Google Scholar]
17. Shu, Y., Zhang, Z., Guo, J., Zhang, Z. (2017). Analysis of key factors of new energy consumption and research on solutions. Chinese Journal of Electrical Engineering, 37(1), 1–9. [Google Scholar]
18. Zhang, P., Xiong, W. (2014). Research on the correlation model of wind-solar hybrid power generation system based on Copula method. Electrical Measurement and Instrumentation, 51(17), 93–98+116. [Google Scholar]
19. Mnatsakanyan, A., Kennedy, S. (2013). Optimal demand response bidding and pricing mechanism: Application for a virtual power plant. 1st IEEE Conference on Technologies for Sustainability (SusTech), pp. 167–174. Portland, OR, USA. DOI 10.1109/SusTech.2013.6617315. [Google Scholar] [CrossRef]
20. Zhang, J. (2015). Research on demand response-oriented controllable load menu pricing method (Master Thesis). Changsha University of Science and Technology, China. [Google Scholar]
Cite This Article
 Copyright © 2023 The Author(s). Published by Tech Science Press.
This work is licensed under a Creative Commons Attribution 4.0 International License , which permits unrestricted use, distribution, and reproduction in any medium, provided the original work is properly cited.
 Downloads
 Citation Tools