
 Submit a Paper
 Propose a Special lssue
 Open Access
ARTICLE

Research on Comprehensive Control of Power Quality of Port Distribution Network Considering Large-Scale Access of Shore Power Load
Tianjin University, Tianjin, 300110, China
* Corresponding Author: Yuqian Qi. Email:
Energy Engineering 2023, 120(5), 1185-1201. https://doi.org/10.32604/ee.2023.025574
Received 20 July 2022; Accepted 25 October 2022; Issue published 20 February 2023
 View Full Text
 Download PDF
Abstract
In view of the problem of power quality degradation of port distribution network after the large-scale application of shore power load, a method of power quality management of port distribution network is proposed. Based on the objective function of the best power quality management effect and the smallest investment cost of the management device, the optimization model of power quality management in the distribution network after the large-scale application of large-capacity shore power is constructed. Based on the balance between the economic demand of distribution network resources optimization and power quality management capability, the power quality of distribution network is considered comprehensively. The proposed optimization algorithm for power quality management based on Matlab and OpenDSS is proposed and analyzed for port distribution networks. The simulation results show that the proposed optimization method can maximize the power quality management capability of the port distribution network, and the proposed optimization algorithm has good convergence and global optimization finding capability.Keywords
The implementation of the “electric energy substitution” strategy has promoted the transformation of the energy development mode and played a crucial role in the high-quality development of energy in China in the future. Among them, the construction of port shore power is an important measure to promote the “electric energy substitution” strategy. Ships docked at the port use the shore power system, which can effectively realize the energy saving and emission reduction of the port, im-prove the environmental status of the port area, and make it develop in harmony with the city [1]. However, because the time distribution characteristics of large-capacity shore power loads are not only related to the docking density and docking time of ships, but also related to the proportion of ships accessing shore power, which is highly random, thus seriously affecting the smooth operation of the power grid. In addition, with the large-scale access of shore power loads, the distance between the power receiving equipment and the power supply equipment is relatively long, and the equipment has not been updated, which brings serious power such as voltage oscillation, inrush current and frequency in-stability to the port distribution network Quality issues. Therefore, comprehensive management of the power quality of the port distribution network with large-scale application of shore power loads can be used to improve the power quality of the port distribution network, pro-mote the implementation of the “power substitution” strategy, and help achieve the dual-carbon goal.
At present, the research on comprehensive management of power quality in distribution network mainly focuses on the following three problems: harmonic problem, three-phase unbalance problem and low volt-age problem. Regarding the harmonic problem, literature [2–7] analyzed the harmonic characteristics of various typical harmonic sources such as conventional DC drop point, flexible straight drop point, traction locomotive, new energy power generation, electric arc furnace, and comprehensive nonlinear load, and proposed passive control technology for harmonic control by adding passive filters, and active control technology for harmonic control by using pulse width modulation technology and increasing the number of phases or pulses of the converter. Regarding the problem of three-phase unbalance, literature [8–12] analyzed its main hazards, including increasing network loss, threatening network operation safety, shortening motor life, etc., and proposed manual commutation, automatic commutation, and distribution network reconfiguration, three-phase balance and other operational measures, as well as a series of governance measures based on power electronic technology. Regarding the low voltage problem, literature [13,14] proposed three governance methods, including distribution network transformation and operation mode adjustment, adding governance equipment, and raising the terminal by dispersing photovoltaic and wind power generation in the low-voltage distribution network. New technology approach to voltage. However, the above studies all start from different optimization objectives, different optimization solution algorithms, etc., mainly focus on the harmonic and voltage deviation problems of urban regional distribution networks to configure power management equipment, and the power quality management of the port distribution network after the application of large-capacity shore power is not carried out. In terms of power management of port distribution network, literature [15] summarized the comprehensive management method of shore power system from three aspects: insulation monitoring, shore power equipment safety improvement technology and fault diagnosis, so as to improve the safety and stability of shore power system. Aiming at the problem that the connection of shore power to the ship’s power grid causes current surges, damages the ship’s electrical equipment, and leads to the instability of the ship’s power grid system, literature [16] proposed a flexible grid-connected control method for shore power based on virtual synchronous generators. The output characteristics of the shore power supply can match the characteristics of the ship’s generator, so as to realize the smooth operation of the shore power system. Literature [17] proposed an improved shore power droop control strategy, which simulates the electrical and mechanical characteristics of the ship’s diesel synchronous generator, and the shore power can be directly controlled by the power management system PMS, thereby greatly improving the ship’s power System stability and power quality. Literature [18] analyzed the power quality problems brought by the large-capacity shore power grid connection, and proposed a reactive power compensation optimization scheme for the load fluctuation problem. Literature [19] analyzed the Based on the power quality problem of the port power grid and its load operation characteristics, a power quality assessment method for port electrical equipment is proposed. Literature [20] established a shore power refined load model, and considered the shore power load elasticity and proposed a method. Planning methods for integrated energy systems in ports.
To sum up, most of the existing research objects of comprehensive power quality management are urban, rural and other regional distribution networks or microgrids, and there are few researches on comprehensive management of power quality problems in port distribution networks. Therefore, in view of the shortcomings of the existing research, this paper establishes a comprehensive management model for the power quality of the port distribution network with the large-scale access of shore power loads. Taking the power quality and safety indicators as constraints, and taking the best harmonic suppression effect and the minimum investment cost of power quality control devices as objective functions, the multi-objective optimization of the installation location and parameter selection of power quality control devices in the port distribution network is carried out. The harmonic control scheme of distribution network under different load scales of port distribution network is obtained.
The main contributions of this study are as follows:
1. This paper is the first time to conduct governance research on the power quality problem of port distribution network with large-scale access of shore power, which can effectively solve the voltage deviation, harmonic and other problems brought by shore power.
2. The particle swarm optimization algorithm based on the joint simulation platform of MATLAB and OpenDSS is proposed, which avoids the nonlinear power flow constraint problem and greatly reduces the number of iterations.
3. The power quality control simulation based on the actual port distribution network verifies the effectiveness of the proposed scheme.
2 Scenario Analysis of Large-Scale Shore Power Access
Ship shore power is a special power supply for ship loads. The power supply adopts three-phase three wire power supply mode and is mainly composed of three parts: shore power supply system, ship shore interaction part and ship power receiving system. Among them, the onshore power supply system is to connect the power from the high-voltage substation to the terminal junction box, which can complete the corresponding voltage level transformation, frequency conversion, uninterrupted switching with the ship’s power receiving system and other functions according to the voltage and frequency requirements of the berthing ship. The ship shore interaction part refers to the cable connection equipment connecting the terminal box and the ship’s power receiving device. The ship’s power receiving system is to install a specific shore power receiving system on the basis of the ship’s inherent power distribution system. The structural diagram of the shore power system is shown in Fig. 1.
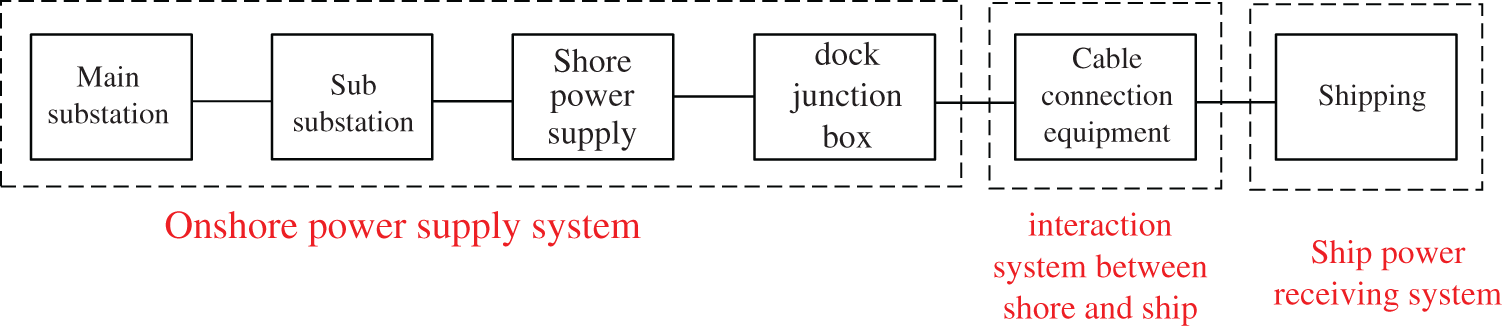
Figure 1: Structure of ship shore power system
When the ship load is connected to the port distribution network through the shore power supply, it will produce a huge impact load on the port distribution network. The shore power system is composed of many nonlinear devices such as frequency converters, resulting in multiple harmonics in the distribution network. With the increase of the connected load capacity, the greater the voltage drop of each distribution line, the greater the harmonic distortion rate, resulting in the voltage instability of the shore power distribution network system.
Shore power supply is sensitive to the background harmonic of distribution network. In order to reduce the harmonic current content emitted by the large-scale connected shore power supply, the background harmonic voltage of distribution network must be controlled within a reasonable range. At the same time, with the increase of the scale of shore power load access, the power loss in the port distribution network also gradually increases. To sum up, the focus of power quality control of port distribution network should be harmonic filtering and reactive power compensation. The power quality management strategy of port distribution network should adopt the hybrid management scheme of passive filter (FC) and Static Var Generator (SVG). In practical application, because the load capacity of a single substation is relatively small and the number of substations is large, when the substation is equipped with power quality control devices, the capacity configuration of a single control device is too small and the economy is poor. Therefore, the power quality control device of the port distribution network should be configured in the central substation or the general step-down station, and decentralized compensation should be carried out in the central substation and the general step-down station, as shown in Fig. 2.
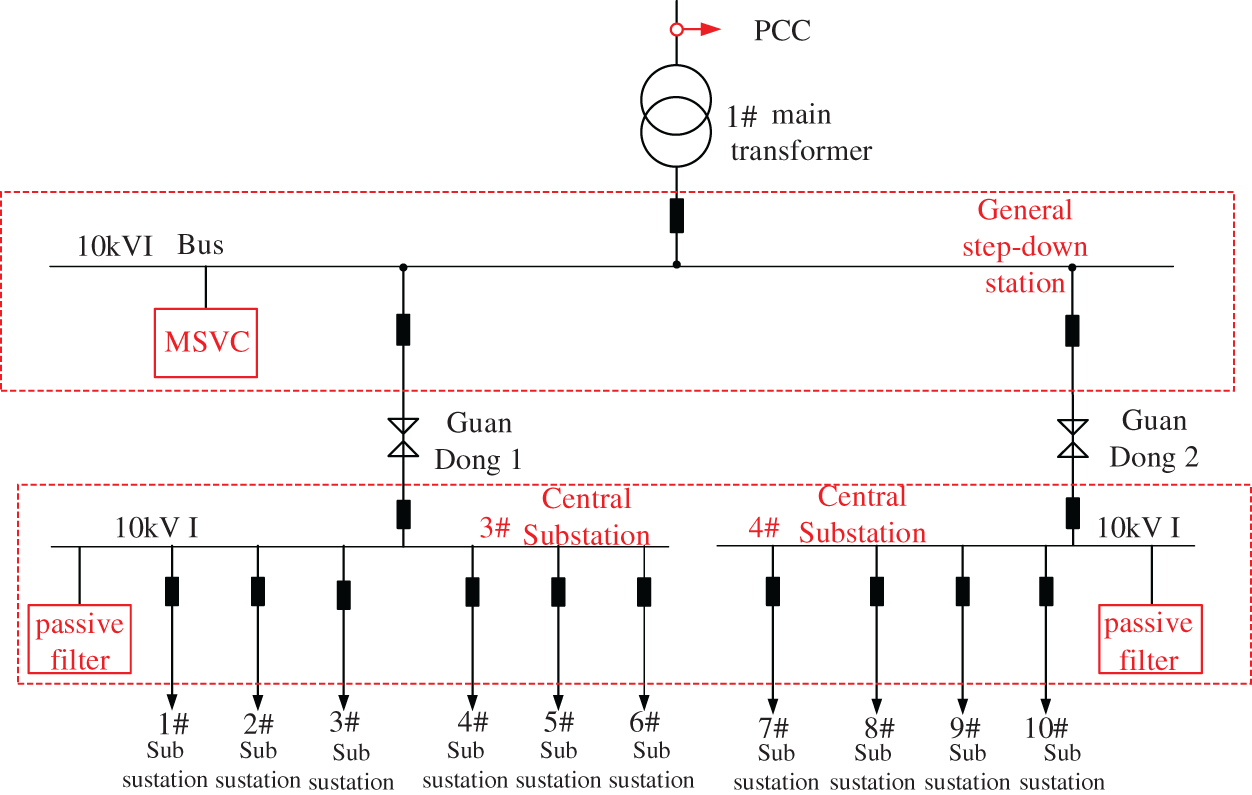
Figure 2: Configuration diagram of power quality control device for port distribution network
Considering that there are a large number of 5th, 7th, 11th, 13th, 17th and even ultra-high harmonics in the port distribution network, the passive filter should be configured with three branches: 5th single tuning +7th single tuning +11th second-order high pass filter, of which the 5th and 7th single tuning filters mainly realize the filtering of 5th and 7th harmonics, and the 11th second-order high pass filter realizes the filtering of 11th and above harmonics. The filter combination method meeting the requirements is shown in Fig. 3.
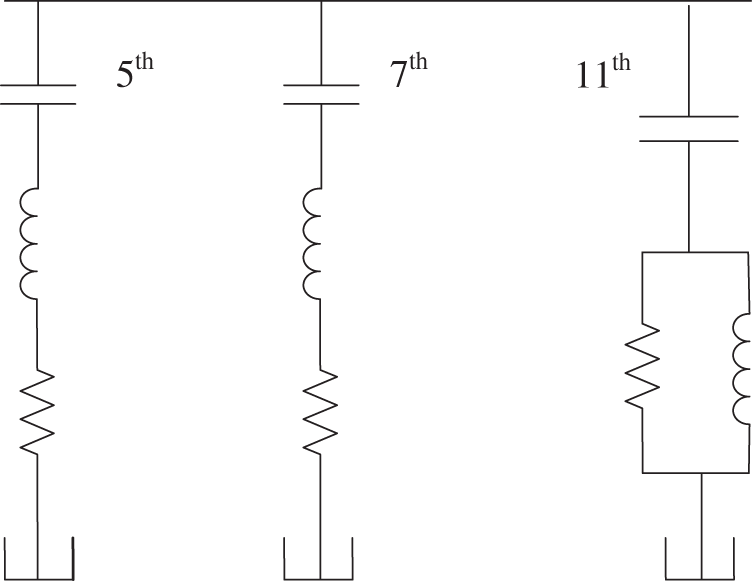
Figure 3: High-pass filter topology that meets the requirements
The filtering effect is related to the installation position and installation capacity. If the position of the filter is changed, the filtering effect will be different. The comparison effect of the filter connected to the 2 node and the filter connected to the 3 node is shown in Fig. 4.
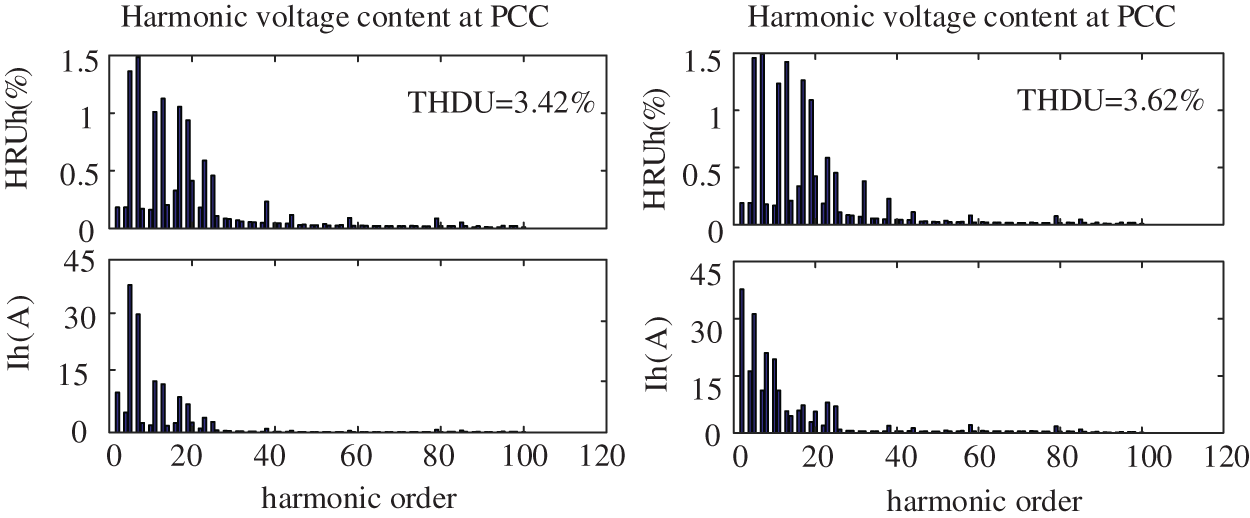
Figure 4: Configuration diagram of power quality control device for port distribution network
Therefore, taking the position and capacity of the filter as the different dimensions of the particle swarm algorithm, and bringing it into the optimization model for optimization processing, the best position and capacity of the filter can be obtained.
3 Comprehensive Management Model of Power Quality of Distribution Network after Large-Scale Application of Shore Power
The bridge crane, shore power and other power electronic equipment in the port distribution network are typical non-linear impact loads. In the process of large-scale application of shore power loads, it will not only cause the voltage distortion rate of the power grid to exceed the standard, cause the harmonic loss to increase, and even cause large reactive power impact, cause voltage sag, and endanger the safety of the operation of the port distribution network. Therefore, the comprehensive power quality control of port distribution network should consider the harmonic and voltage sag of port distribution network. At the same time, in order to fully tap the cost and functional advantages of governance equipment, this paper establishes a multi-objective FC and SVG collaborative optimization configuration model with the goal of minimizing the total investment cost and optimizing the power quality level of FC and SVG, respectively.
After the large-scale shore power load is connected to the port distribution network, the power quality will be greatly affected. From the aspects of economy and reliability of network operation, the method of installing power quality management devices in the port distribution network should be adopted for the power quality management of the port distribution network with large-scale access of shore power. Among them, passive filters are installed in the central substation for harmonic filtering. Taking the minimum total investment of the treatment device, the best resonance suppression effect, the mini-mum voltage deviation, and the minimum network loss as the objective function, the capacity configuration and parameter selection of the harmonic treatment device are multi-objective optimization. The established multi-objective optimization model is as formula to show:
In the formula,
The constraints of reactive power optimization control variables need to meet the constraints of node active and reactive power balance, as shown in equations, respectively.
In the formula,
The inequality constraints for the large-scale application of shore power are divided into control variable constraints and state variable constraints.
The capacity of the resonance treatment device and the parameterizer is selected as the control variable constraint, including the upper and lower limit constraints of the reactive power compensation capacity of the filter branch, as shown in Eq. (8):
The upper limit constraint on the total reactive power compensation is shown in formula (9):
The upper and lower bounds on the control variable for the filter branch quality factor are shown in formula (8):
s the control variable of the reactive power compensation capacity of the hth filter branch;
Select the voltage deviation of each node, the total harmonic distortion rate of each node voltage, the fundamental power factor of the PCC point, and the line load rate as state variable constraints, including the upper limit constraint of the bus voltage total harmonic distortion rate, as shown in formula (9):
The upper limit constraint of the line load rate is shown in formula (10):
The upper and lower limit constraints of the node voltage are shown in formula (11):
The lower limit constraint of the fundamental power factor of the total incoming line at the PCC point of the power grid is shown in formula (12):
In the formula,
The inspiration proposed by the PSO algorithm comes from the process of flight migration of birds during foraging. The velocity update formula of particles in the particle swarm algorithm is shown in formula (13), and the position update formula is shown in formula (14).
In the formula,
3.4 Multi Objective Optimization Algorithm Based on MATLAB and OpenDSS
In view of the power quality problems after large-scale shore power is connected to the distribution network, it is necessary to carry out comprehensive power quality management and configuration for the distribution network. Therefore, while optimizing the solution objectives, it is necessary to calculate the three-phase power flow of the distribution network to obtain the value of the decision variables. However, the traditional solution algorithm and power flow algorithm based on MATLAB will lead to a longer solution time. OpenDSS platform has a fast speed for power flow meter of distribution network, but it cannot write a solution algorithm, while MATLAB platform has a high speed and good convergence for the implementation of the solution algorithm. Therefore, based on the advantages of MATLAB and OpenDSS, this paper proposes a multi-objective optimization algorithm based on MATLAB and OpenDSS. The algorithm flow is shown in Fig. 5.
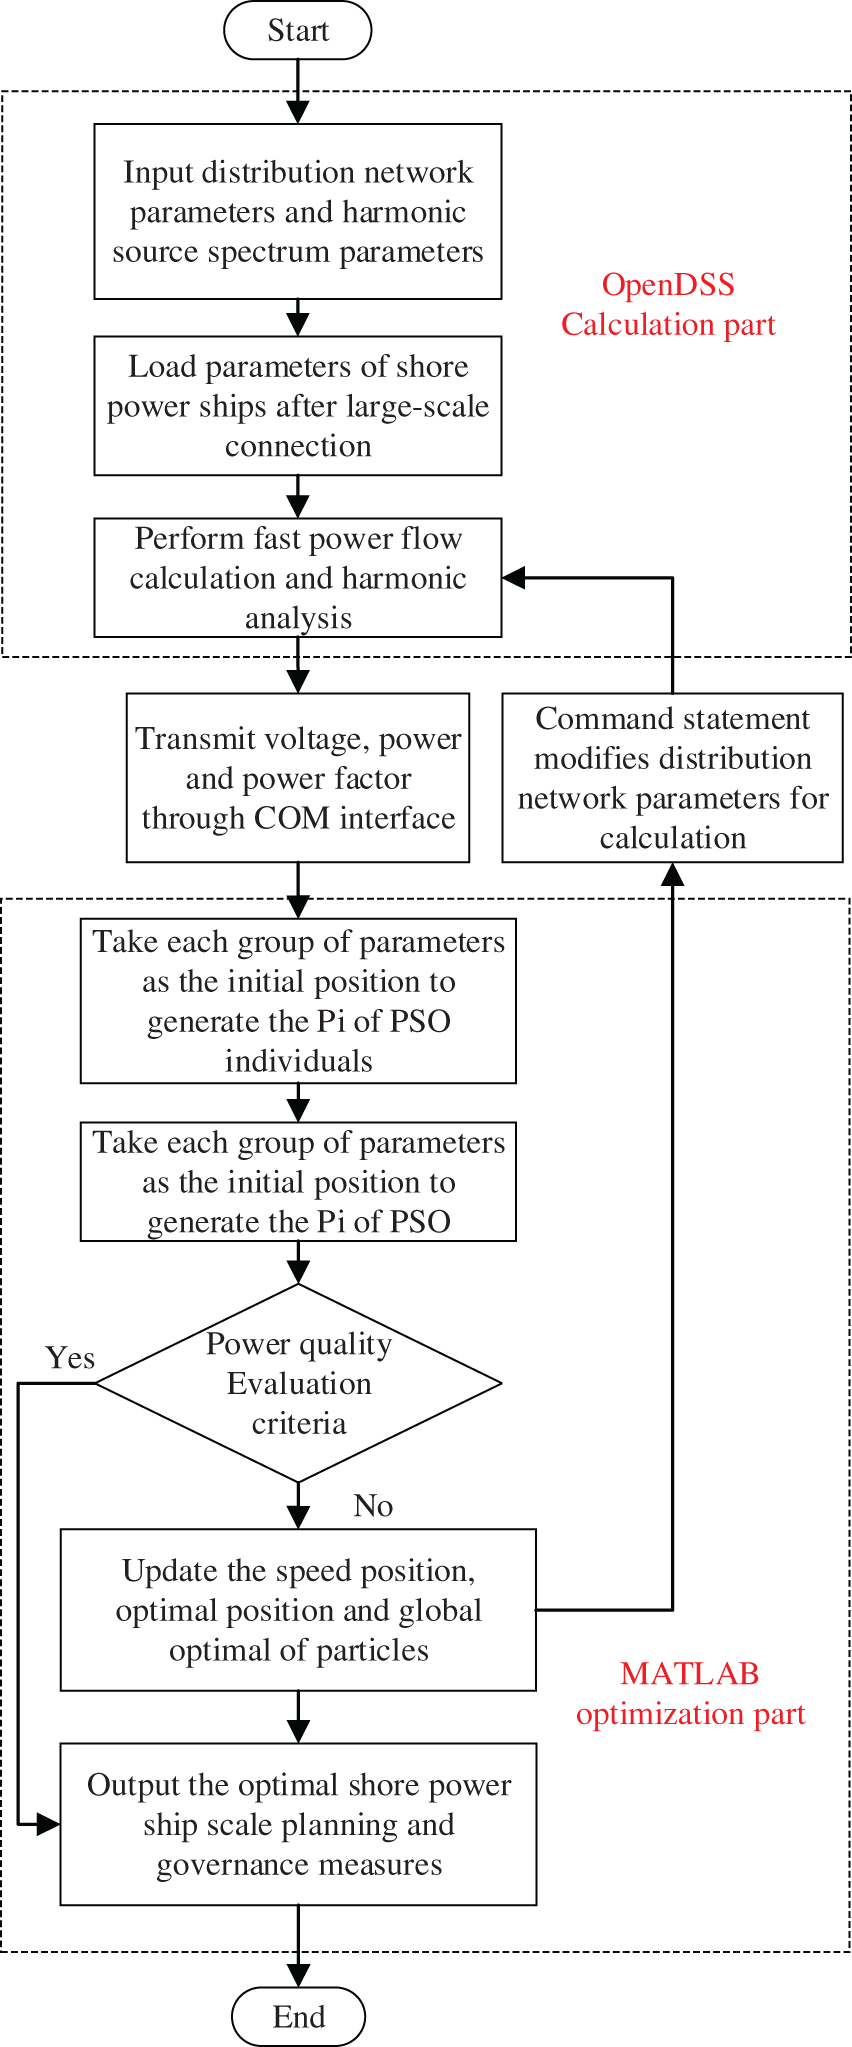
Figure 5: Comprehensive resource optimization process for large-scale application of shore power distribution network
The multi-objective optimization algorithm combines the input distribution network parameters, harmonic source spectrum parameters and shore power load parameters to perform fast power flow calculation and harmonic analysis through OpenDSS. Then, based on the voltage, power and power factor transmitted by the COM interface, the multi-objective harmonic optimization management of power quality is carried out. If the standard is met, it will be output. If the standard is not met, the grid parameters will be modified and recalculated and analyzed until the standard is met.
The algorithm is implemented on the platform based on MATLAB and OpenDSS, in which OpenDSS is used to calculate the three-phase power flow and each harmonic of distribution network, and the comprehensive power quality management configuration is implemented on the MATLAB platform. Based on the component object (OpenDSS Engine.DLL), the data communication between OpenDSS calculation program and other calculation and analysis modules of MATLAB platform can be realized.
In order to verify the effect of the power quality governance optimization model of shore power large-scale access distribution network established in this paper on the power quality governance of port distribution network, this paper selects a port distribution network as an example for simulation and verification analysis.
There are two 50 MVA main transformers in the general step-down station of the port distribution network, which operate separately. After reducing the 110 kV voltage of the public grid to 10 kV, they supply power to two central substations (3# and 4#), of which 1# main transformer mainly supplies power to the 10 KVI bus of 3# and 4# Central substations. The 3# Central substation mainly supplies power to the 3# wharf area, and the 4# Central substation mainly supplies power to the 4# wharf area. The main power loads of the 1# main transformer of the port distribution network are bridge crane, shore power and auxiliary power, including 14 bridges, 4 shore power and some auxiliary loads. The node diagram of main transformer is shown in Fig. 6.
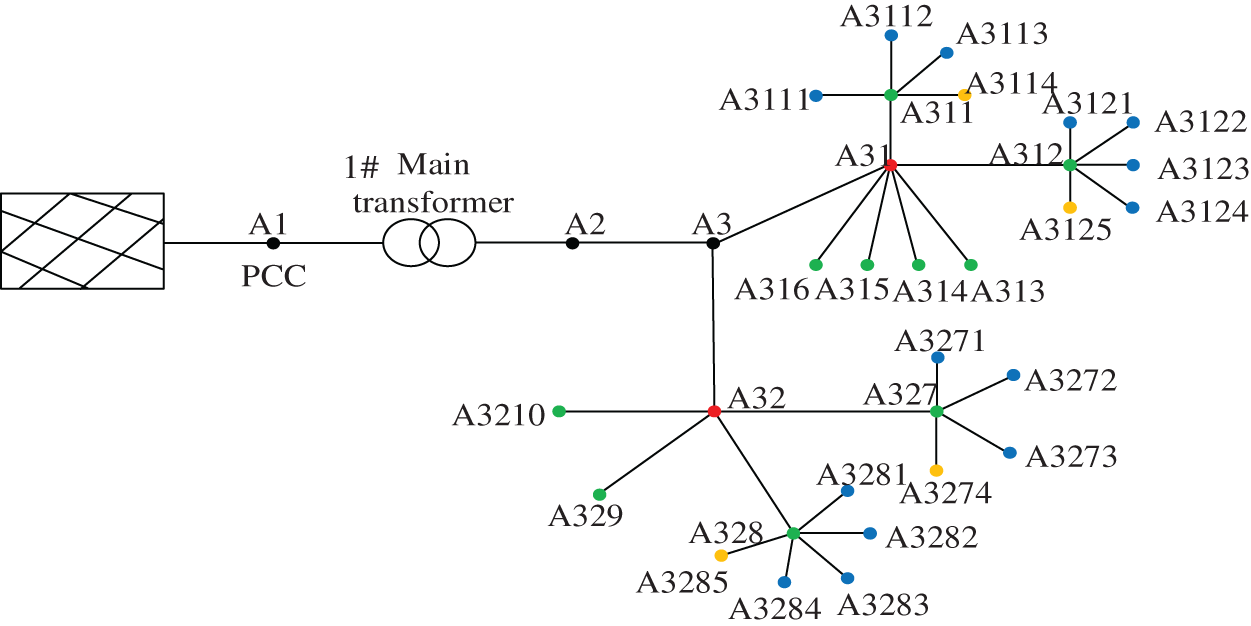
Figure 6: Port distribution network 1# main transformer distribution network node diagram
Considering that other 1#, 2#, 7# and 8# Sub substations contain bridge cranes and shore power equipment, the basic load of 10 KVI section bus of 3#, 4#, 5#, 6#, 9# and 10# Sub substations is 1 MVA, and the fundamental wave power factor is 0.85. See Table 1 for the power setting of each auxiliary power substation.

4.1 Capacity Configuration and Parameter Optimization of Harmonic Filter Device
The capacity and parameter configuration results of harmonic filter devices in 3# Central substation and 4# Central substation based on particle swarm optimization are shown in Tables 2 and 3, respectively.


According to the particle swarm optimization results, after comprehensively considering the investment cost and harmonic suppression effect, the capacity of the second-order high pass filter is maximized in order to ensure the harmonic suppression effect and the optimal investment cost of the treatment device. On the one hand, it ensures a strong ability to suppress high-order harmonics, on the other hand, it minimizes the installed capacity of the capacitor under the same compensation ability, and realizes the optimal comprehensive goal of harmonic control effect and investment cost.
4.2 Simulation Results after Optimization of Treatment Device Parameters
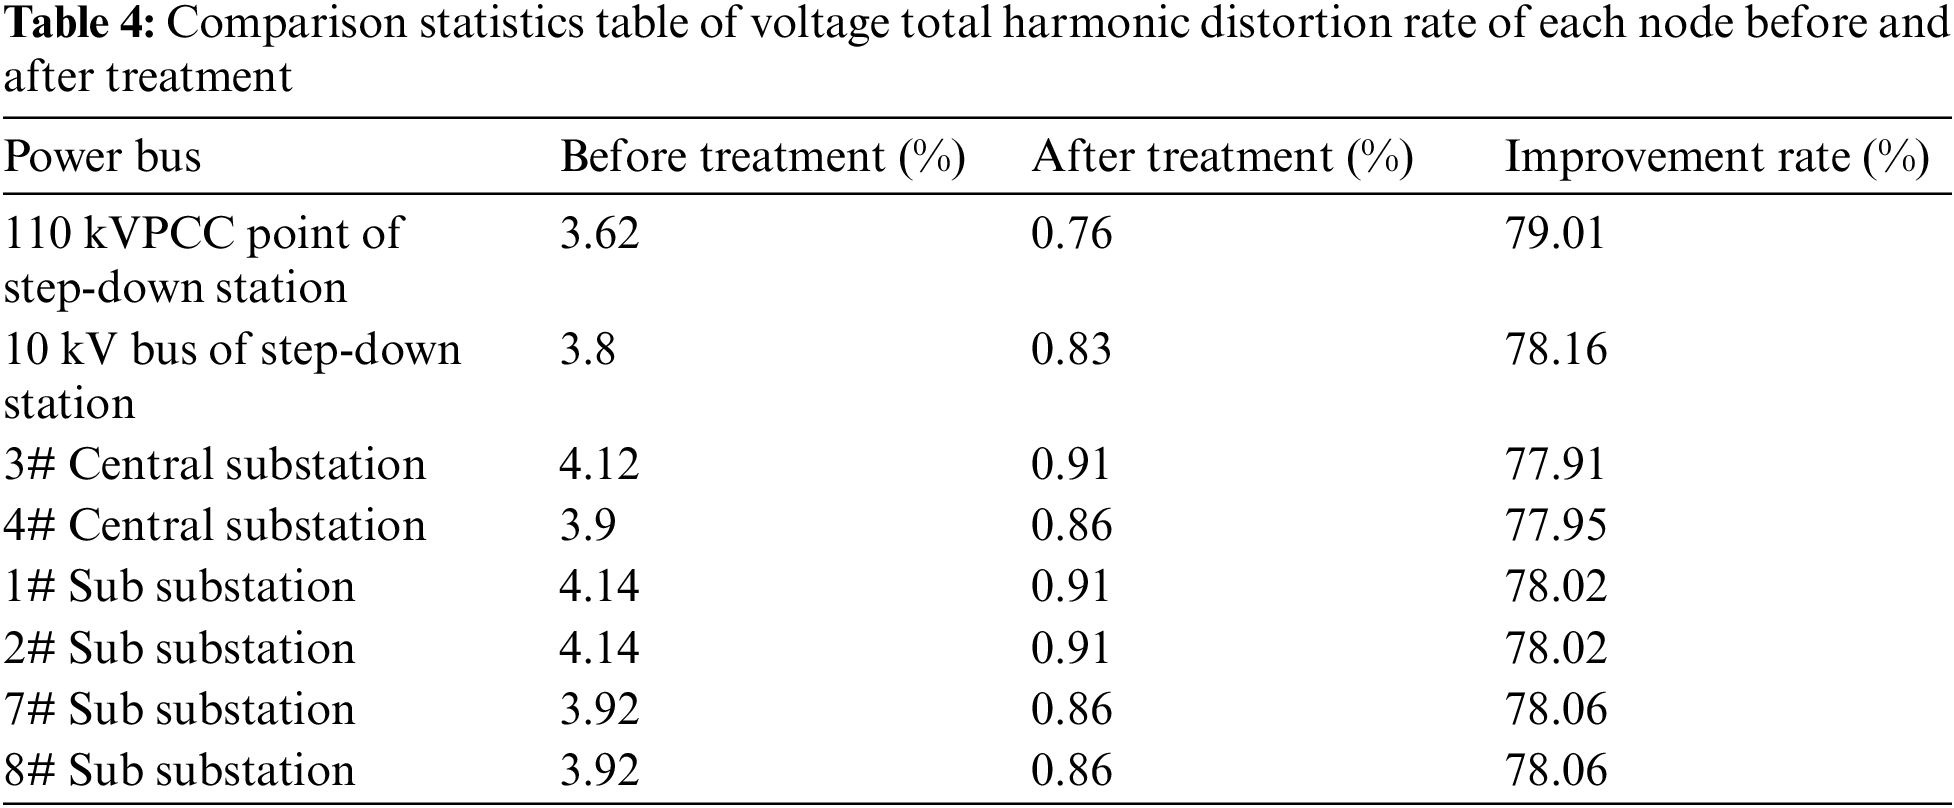
According to the optimization results of the capacity and parameters of the harmonic treatment device by particle swarm optimization, the parameters of the above treatment device are input into the simulation model of the port distribution network, and the comparison of the voltage total harmonic distortion rate of each node before and after treatment is obtained (see Table 4). After treatment, the voltage total harmonic distortion rate of each node decreased by about three percentage points, the improvement rate of voltage total harmonic distortion rate of each substation node fluctuated around 78%, and the improvement rate of 110 KVPCC point of step-down station reached 79%.
When the simultaneous coefficient of bridge crane operation in the power supply area of 1# main transformer is 0.5, the harmonic spectrum distribution and total harmonic distortion rate of voltage at each node are shown in Fig. 7 after 4 sets of shore power equipment are put into treatment under heavy load.
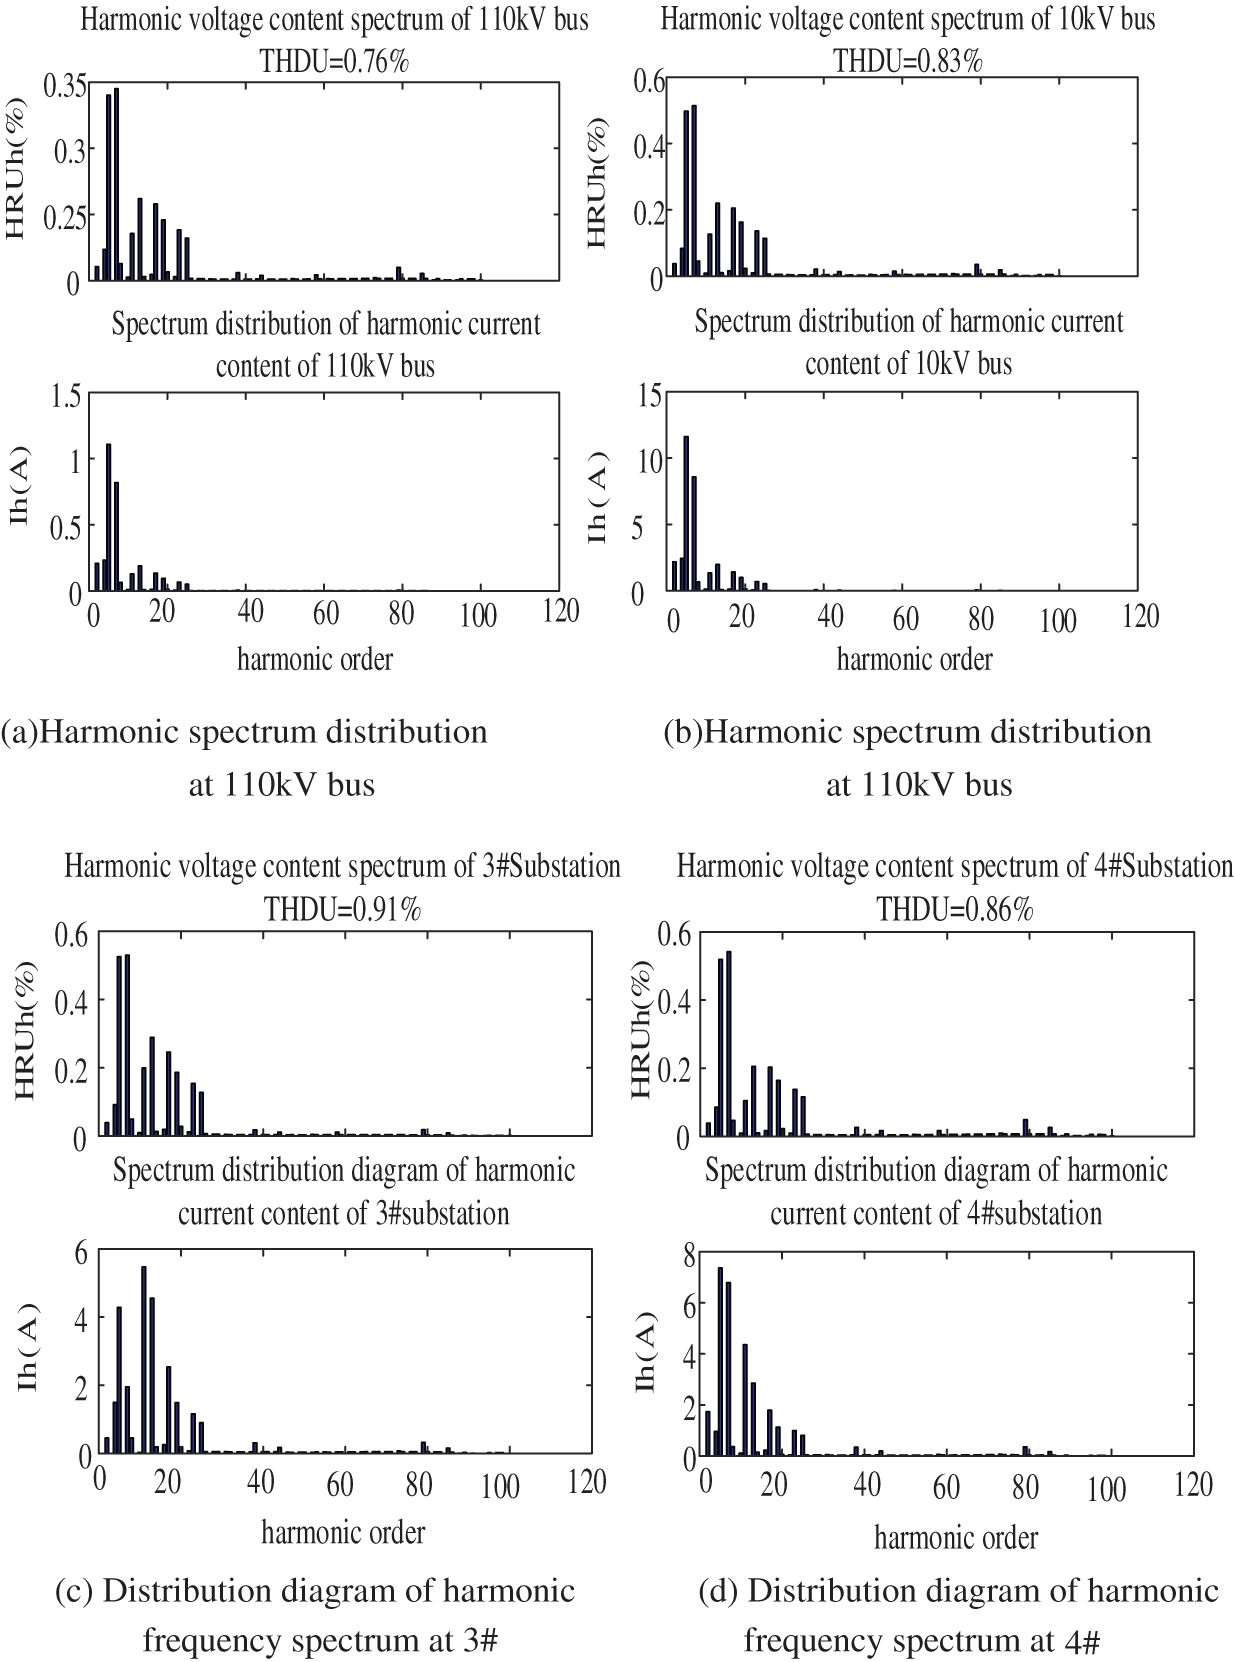
Figure 7: The harmonic spectrum distribution of each node after the harmonic control device based on particle swarm optimization is put into operation
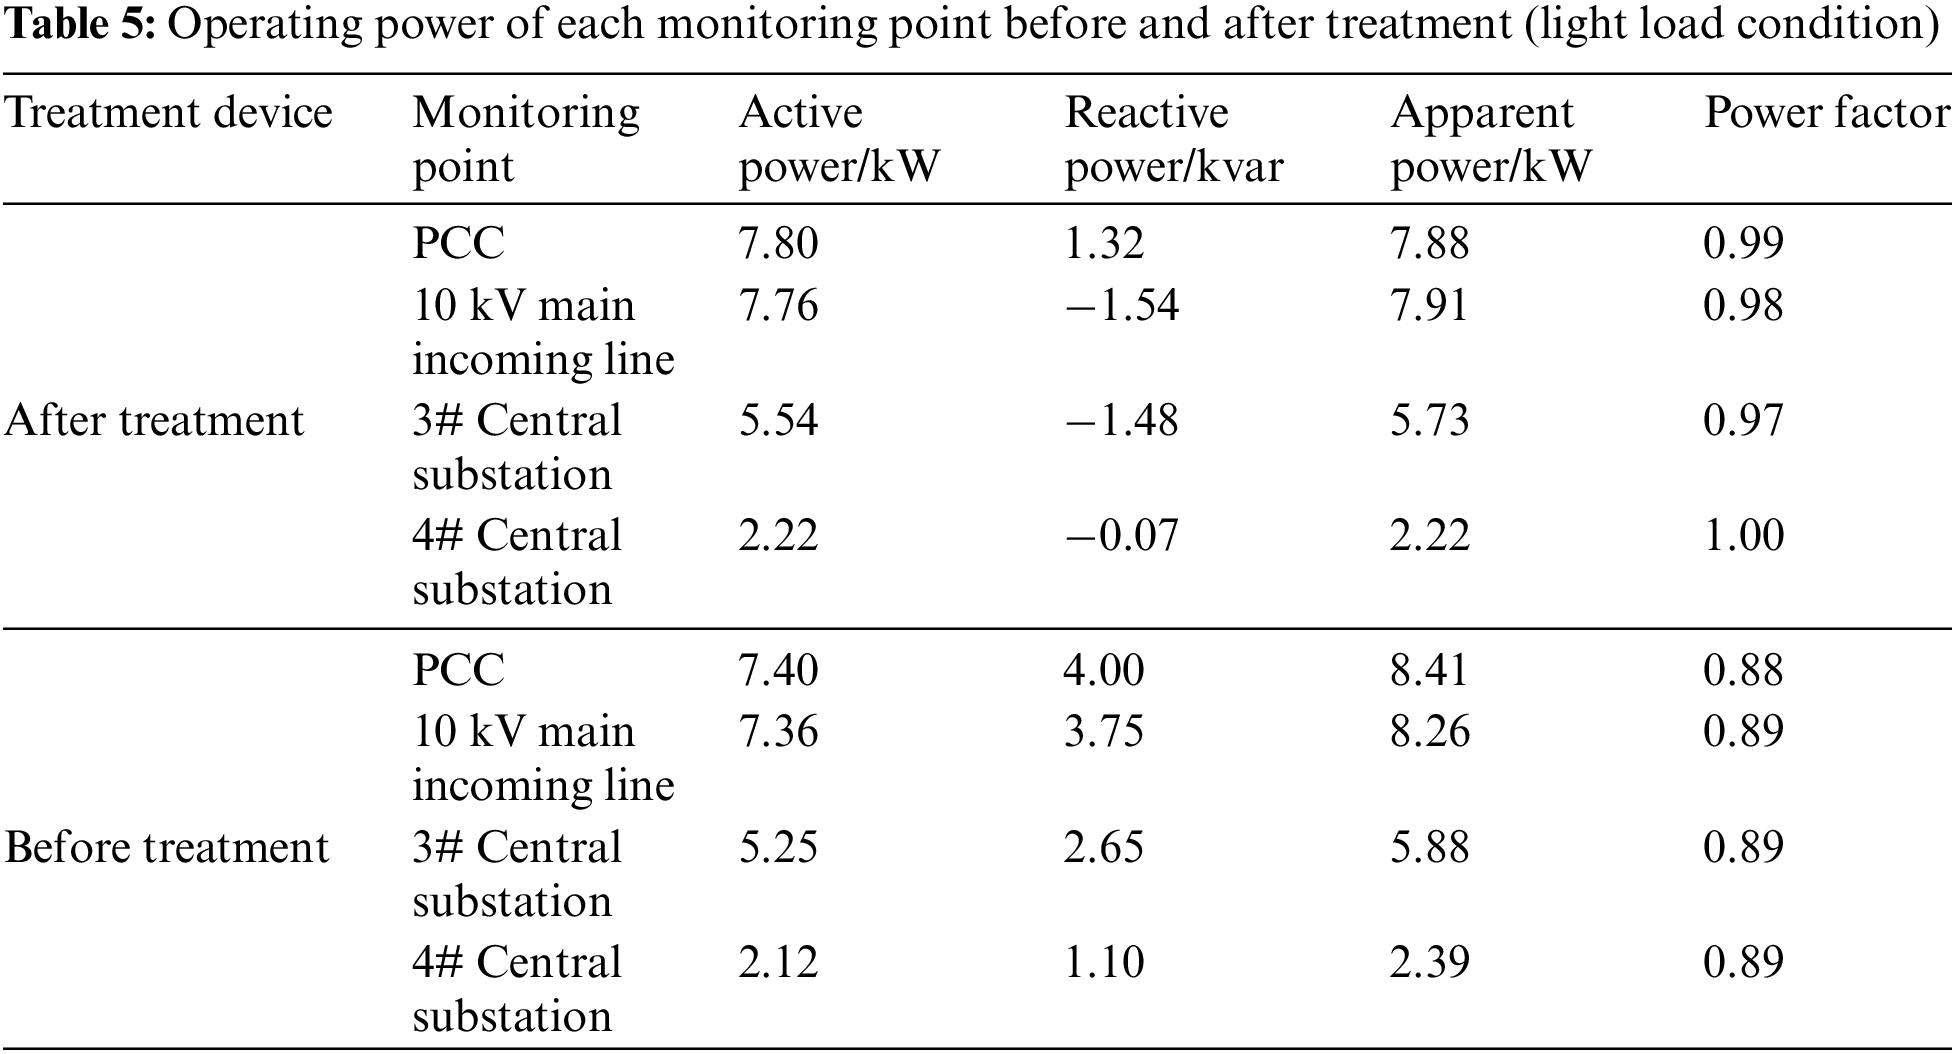
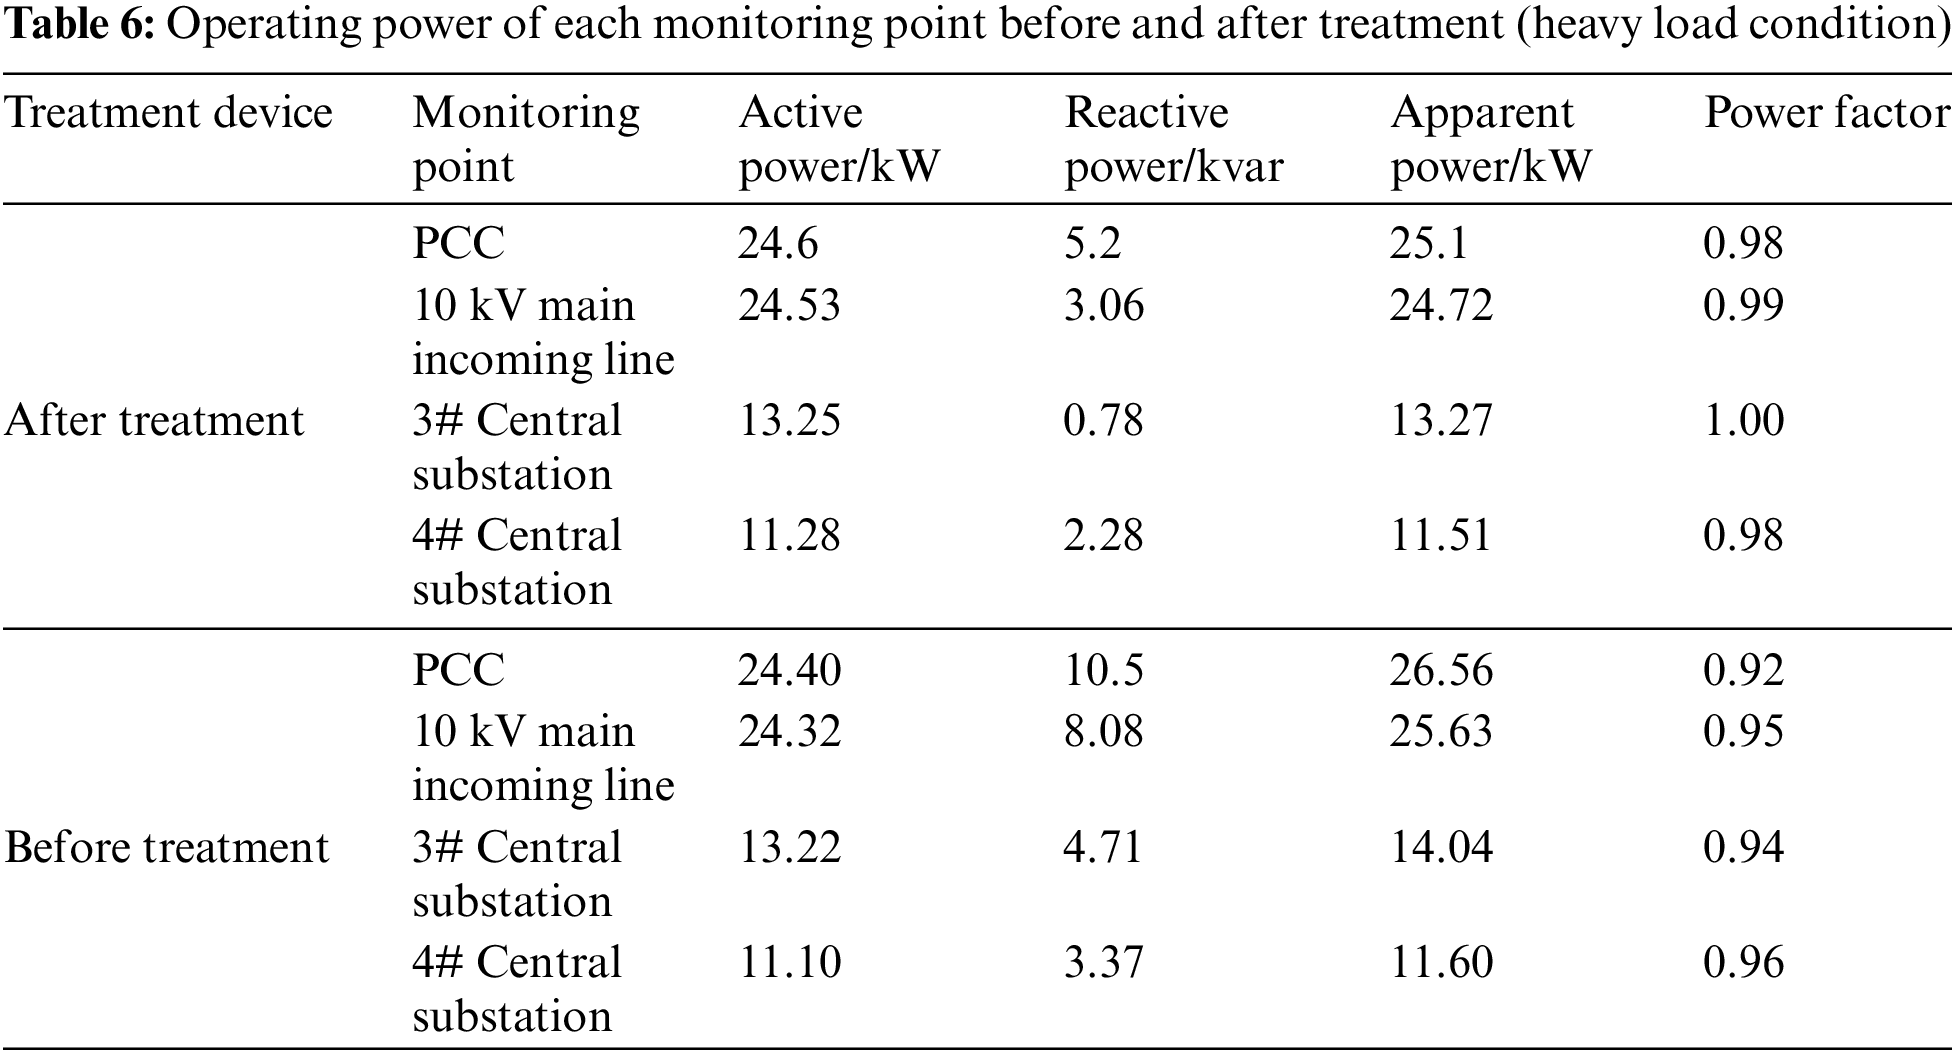
See Tables 5 and 6 for the statistical results of operating power and power factor of each monitoring point before and after treatment under light load condition and heavy load condition. It can be seen that after treatment, the power factor of each monitoring point has increased by approximately 0.1 under light load conditions, and 0.05 under heavy load conditions. Whether under heavy load conditions or light load conditions, on the premise that the active power is almost unchanged, the reactive power has decreased significantly, and the fundamental power factor of PCC point can reach more than 0.96.
Before and after treatment, the voltage distribution of each node under different working conditions is shown in Figs. 8 and 9. It can be seen from the figure that after the treatment, the unit value of the voltage of each node has been significantly increased, whether under light load or heavy load.
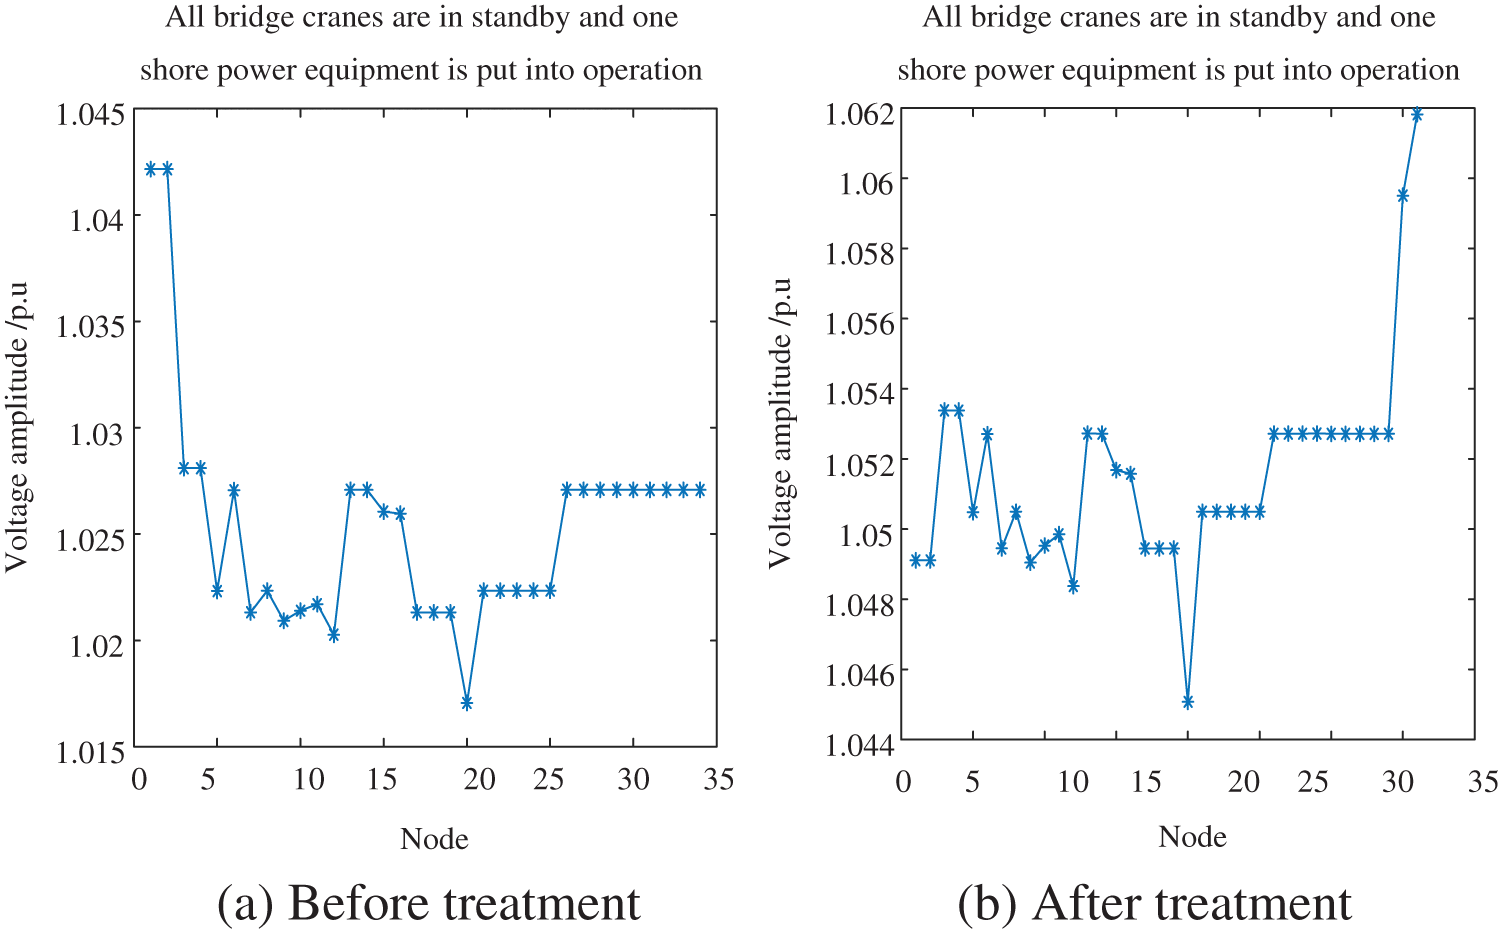
Figure 8: Voltage distribution of each node before and after treatment (light load condition)
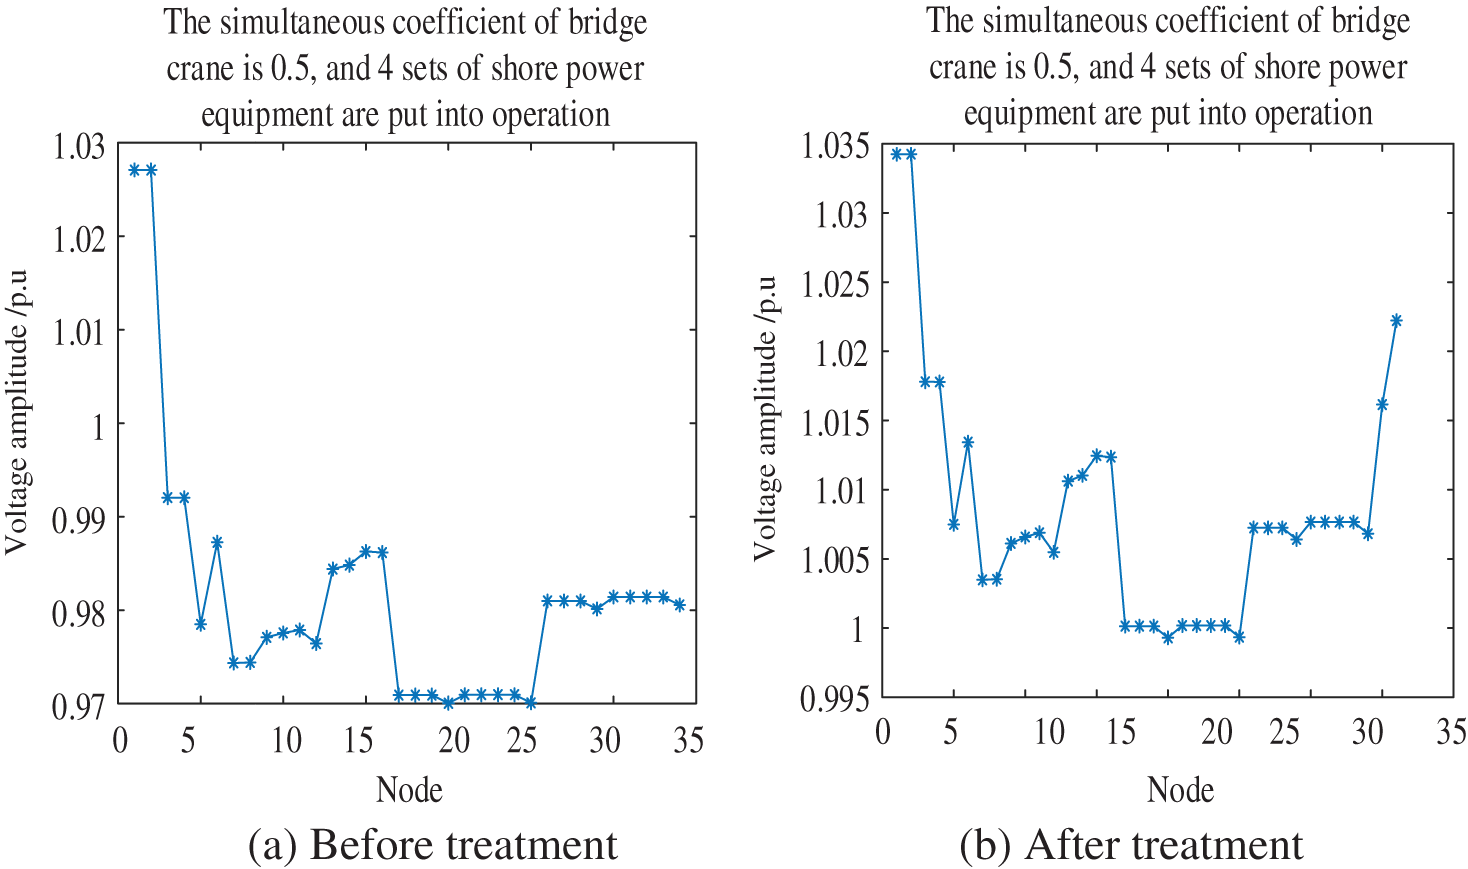
Figure 9: Voltage distribution of each node before and after treatment (heavy load condition)
According to the results, from the perspective of investment benefit and harmonic suppression of the treatment device, the installation capacity of the second-order high pass filter should be increased. On the one hand, it ensures the suppression of high-order harmonics, on the other hand, it also minimizes the installation capacity of the capacitor under the same compensation capacity and realizes the comprehensive optimization of the treatment effect and investment cost.
Since the bridge crane of the port distribution network, shore power and other high-power power electronic devices adopt fully controlled power electronic devices, their reactive power demand during operation is relatively small. After the harmonic filter is installed in the central substation, it should be able to ensure that there is no reactive power reverse transmission under the light load condition of each central substation. According to the reactive power compensation capacity (3.5Mvar) of the harmonic filter set in the two central substations, about 7% of the rated capacity of the transformer can meet the reactive power compensation requirements from light load conditions to heavy load conditions. At the same time, according to the fundamental power factor of the common connection point, the dynamic reactive power compensation device can also be considered to be installed in the general step-down station.
4.3 Comparison of Different Algorithms
In order to compare the superiority of the multi-objective optimization algorithm used in this paper, this paper uses two other basic data processing methods on the basis of using the OpenDSS platform combined with the particle swarm algorithm for data processing, that is, using the matlab platform alone for particle swarm optimization. Optimize, use the OpenDSS platform combined with Genetic Algorithm (GA), and run the three methods separately to carry out algorithm comparison analysis.
Using different algorithms for data processing, the required number of iterations, solution time, and harmonic improvement rate finally obtained are shown in Table 7. The results show that, in terms of comprehensive cost, compared with the genetic algorithm, the optimal solution obtained by using the particle swarm algorithm has a similar overall total cost and significantly improves the improvement rate of the total harmonic distortion rate. Improve the global optimization ability to find the optimal solution.
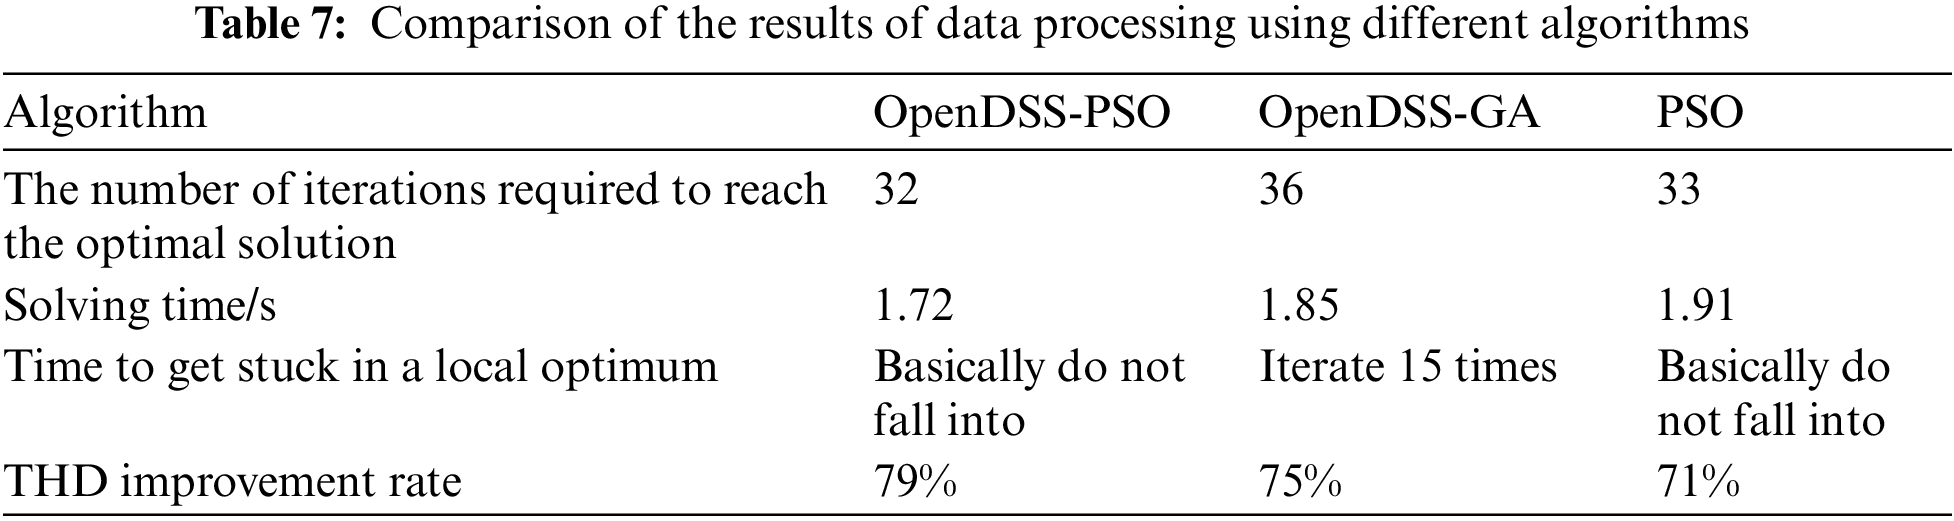
In addition, after adding the OpenDSS platform for data processing, the required solution time is reduced by 11.05%, the number of iterations required for the operation is less, and the operation efficiency is greatly improved compared with the previous one.
Aiming at the power quality problem of port distribution network after the large-scale application of large-capacity shore power load, this paper establishes a comprehensive power quality management model for the large-scale connection of shore power load to the distribution network. The model takes the best harmonic suppression effect and the minimum investment cost of power quality control devices as the objective function to optimize the capacity configuration and parameter selection of harmonic control devices in port distribution network. The following conclusions are obtained through the analysis of numerical examples:
(1) When the large capacity shore power load is connected to the port distribution network through the shore power supply, it leads to multiple harmonics in the distribution network, voltage drop of the distribution line and other serious problems. In this paper, the mixed treatment scheme of FC + SVG can effectively alleviate the problems of distribution network.
(2) Aiming at minimizing the total investment cost and optimizing the power quality level of FC and SVG, respectively, this paper establishes a multi-objective collaborative optimal configuration model of FC and SVG, taking into account the harmonic and voltage sag problems of the port distribution network, and fully mining the cost and functional advantages of the treatment equipment. The simulation analysis of an example shows that the model can effectively improve the power factor and node voltage of each node. On the one hand, it realizes the suppression of high-order harmonics, on the other hand, it also achieves the goal of minimizing the installed capacity of capacitors under the same compensation capacity, realizes the comprehensive optimization of governance effect and investment cost, and completes the application scheme design of large-capacity shore power devices for large coastal ports.
Funding Statement: The authors received no specific funding for this study.
Conflicts of Interest: The authors declare that they have no conflicts of interest to report regarding the present study.
References
1. Wu, J. (2020). Research on the game model of port emission reduction under the condition of ship using shore power (Master Thesis). Dalian Maritime University, China. [Google Scholar]
2. Jiao, S., Song, W., Feng, X. (2016). Filter parameter optimization design of single-phase LCL-type three-level rectifier equipped in train for high-speed-railway harmonic resonance suppression. 2016 IEEE 8th International Power Electronics and Motion Control Conference (IPEMC-ECCE Asia), Hefei, China. [Google Scholar]
3. Rahmani, S., Hamadi, A., Al-Haddad, K., Dessaint, L. A. (2014). A combination of shunt hybrid power filter and thyristor-controlled reactor for power quality. IEEE Transactions on Industrial Electronics, 61, 2152–2164. [Google Scholar]
4. Srinivas, S., Ramachandra Sekhar, K. (2013). Theoretical and experimental analysis for current in a dual-inverter-fedopen-end winding induction motor drive with reduced switching PWM. IEEE Transactions on Industrial Electronics, 60, 4318–4328. [Google Scholar]
5. Li, G., Yu, Z., Jin, G., An, J. (2019). Study on conduction mechanism and superposition characteristics of AC harmonics via MMC. Power System Protection and Control, 47, 33–41. [Google Scholar]
6. Wang, B., Meng, Y., Luo, W. (2017). Modeling and harmonic current research of electric arc furnace electrical system. Modern Electronic Technology, 40, 159–162. [Google Scholar]
7. Fu, L. (2015). Analysis of harmonic characteristics of medical building distribution system and research on suppression method (Master Thesis). Chongqing University, China. [Google Scholar]
8. Schwanz, D., Moller, F., Ronnberg, S. K., Meyer, J., Bollen, M. H. J. (2017). Stochastic assessment of voltage unbalance due to single-phase-connected solar power. 2017 IEEE Manchester PowerTech, Manchester, UK. [Google Scholar]
9. Sun, M., Demirtas, S., Sahinoglu, Z. (2013). Joint voltage and phase unbalance detector for three phase power systems. IEEE Signal Processing Letters, 20, 11–14. [Google Scholar]
10. Liu, Y., Li, J., Wu, L. (2019). Coordinated optimal network reconfiguration and voltage regulator DER control forunbalanced distribution systems. IEEE Transactions on Smart, 10, 2912–2922. [Google Scholar]
11. Ladoux, P., Raimondo, G., Caron, H. (2013). Chopper-controlled Steinmetz circuit for voltage balancing in railway substaions. IEEE Transactions on Power Electronics, 28, 5813–5822. [Google Scholar]
12. Lin, H. (2011). Series of lectures on national standards for power quality: Lecture 5 three-phase voltage unbalance standard. Electrical Building, 30, 25–29. [Google Scholar]
13. Efkarpidis, N., de Rybel, T., Driesen, J. (2016). Optimal placement and sizing of active in-line voltage regulators in flemish LV distribution grids. 2015 International Conference on Renewable Energy Research and Applications (ICRERA), pp. 408–413. Palermo, Italy. [Google Scholar]
14. Lin, H. (2011). Series of lectures on national standards for power quality: Lecture 1 supply voltage deviation standard. Electrical Building, 30, 3–9. [Google Scholar]
15. Lv, Y., Cao, X., Zhou, Q., Zhao, W., Ding, K. (2020). Safety and security study for shore power system: State-of-the-art. 2020 IEEE International Conference on Industrial Engineering and Engineering Management (IEEM), pp. 1306–1310. [Google Scholar]
16. Ji, Z., Zhao, Z., Wang, J., Lv, Z. (2018). A flexible control strategy for shore-to-ship power system in terms of grid-connected and off-grid switch. Polish Maritime, 25, 139–148. [Google Scholar]
17. Hou, J. (2017). Operation strategy of shore to ship power based on improved droop control. 2017 IEEE Transportation Electrification Conference and Expo, Asia-Pacific (ITEC Asia-Pacific), pp. 262–267. Harbin, China. [Google Scholar]
18. Guo, Y., Wei, Y., Li, C., Yuan, Q. (2020). Research on the impact and optimization strategy of large-capacity shore power system connected to the power grid. Power System Protection and Control, 48, 155–162. [Google Scholar]
19. Wang, F. (2013). Power quality assessment of port power grid and analysis of its load operation characteristics (Master Thesis). Anhui University, China. [Google Scholar]
20. Zhao, J., Mi, H., Cheng, H., Chen, S. (2021). Planning model and method of integrated energy system in port area considering shore power load elasticity. Journal of Shanghai Jiao Tong University, 55, 1577–1585. [Google Scholar]
Cite This Article
 Copyright © 2023 The Author(s). Published by Tech Science Press.
This work is licensed under a Creative Commons Attribution 4.0 International License , which permits unrestricted use, distribution, and reproduction in any medium, provided the original work is properly cited.
 Downloads
 Citation Tools