
 Submit a Paper
 Propose a Special lssue
 Open Access
ARTICLE

Regional Renewable Energy Optimization Based on Economic Benefits and Carbon Emissions
1 School of Architecture, Harbin Institute of Technology, Key Laboratory of Cold Region Urban and Rural Human Settlement Environment Science and Technology, Ministry of Industry and Information Technology, Harbin, China
2 Heilongjiang Institute of Construction Technology, Harbin, China
3 Qingdao Sino-German Ecopark Real Estate Co., Ltd., Qingdao, China
* Corresponding Authors: Yunpeng Zhao. Email: ; Zhigang Zhou. Email:
Energy Engineering 2023, 120(6), 1465-1484. https://doi.org/10.32604/ee.2023.026337
Received 30 August 2022; Accepted 09 November 2022; Issue published 03 April 2023
 View Full Text
 Download PDF
Abstract
With increasing renewable energy utilization, the industry needs an accurate tool to select and size renewable energy equipment and evaluate the corresponding renewable energy plans. This study aims to bring new insights into sustainable and energy-efficient urban planning by developing a practical method for optimizing the production of renewable energy and carbon emission in urban areas. First, we provide a detailed formulation to calculate the renewable energy demand based on total energy demand. Second, we construct a dual-objective optimization model that represents the life cycle cost and carbon emission of renewable energy systems, after which we apply the differential evolution algorithm to solve the optimization result. Finally, we conduct a case study in Qingdao, China, to demonstrate the effectiveness of this optimization model. Compared to the baseline design, the proposed model reduced annual costs and annual carbon emissions by 14.39% and 72.65%, respectively. These results revealed that dual-objective optimization is an effective method to optimize economic benefits and reduce carbon emissions. Overall, this study will assist energy planners in evaluating the impacts of urban renewable energy projects on the economy and carbon emissions during the planning stage.Keywords
Cities are responsible for 67% of the global primary energy consumption and generate roughly 80% of the worldwide greenhouse gas emissions [1,2]. However, cities only cover 4% of the global land surface, and over 50% of the world population resides in urban areas; this percentage is projected to reach 60% by 2030. The development of cities, especially in some developing countries undergoing rapid urbanization, brings numerous risks such as social instability, inadequate infrastructure, increasing energy consumption, and environmental degradation. Implementing sustainable urban planning and development in compliance with eco-city requirements is a trusted method to alleviate the above-mentioned risks and improve the living conditions of millions worldwide.
As a decisive factor for developing eco-cities, renewable energy is becoming increasingly important in urban construction. Unlike fossil fuels, renewable energy is sourced from natural sources or processes that are continuously replenished, such as biomass, geothermal heat, hydropower, solar energy, tidal energy, and wind energy. Based on the data from [3], the share of electricity produced from renewable sources has continuously increased in recent decades; in 2020, around 29% of the global electricity was generated from renewable sources. On a global scale, hydropower is by far the most prominent renewable source, while wind and solar power have been proliferating in recent years.
There are various methods to calculate the share of primary energy generated from renewable sources in eco-cities or sustainable cities. The main objective of this study is to introduce the general calculation methods for total urban energy consumption and renewable energy utilization, while providing a detailed breakdown of the capital, operational, and maintenance costs in the eco-cities or sustainable cities of China. The calculations and analysis were carried out at Qingdao Sino-German Eco-park (QSGE), Shandong Province, China. Subsequently, the differential evolution method was used to optimize the allocation of renewable energy.
The research presented in this paper also aims to provide new insights into sustainable and energy-efficient urban planning by developing a practical method for optimizing renewable energy and carbon emission in urban areas during the planning stage. The significances of this study are as follows: First, it reveals the complex impact of multiple variables in a district energy system. Second, it develops a model for evaluating the costs and carbon emissions of the energy system. Finally, the real-world simulation results help in formulating future development policies and strategies.
The rest of this paper is organized as follows. Section 2 reviews and summarizes the literature related to energy-system carbon emissions. Section 3 introduces the schematic of renewable energy optimization and the formulation of renewable energy utilization. Section 4 shows how the renewable energy optimization (REO) models were constructed. Section 5 presents the results of the case study that employs a realistic REO model at QSGE. Section 6 concludes the paper and presents the renewable energy implications.
An increasing number of studies have elucidated energy consumption, energy policies, and environment pollution while considering carbon emission and economic growth. For example, Usman et al. have determined the role of nuclear and renewable energy in reducing carbon footprint [4]; revealed the influence of industrialization, total reserves, and the expansion of financial, renewable, and natural resources on the ecological footprint data from 1990 to 2019 in newly industrialized countries [5]; and ascertained the impact of economic uncertainty, economic growth, and energy consumption on environmental degradation in Middle Eastern and North African countries [6]. Guo et al. [7] systematically evaluated the effects of smart city construction on energy saving and CO2 emission reduction by using a progressive difference-in-differences method, and demonstrated the impact of economic growth and energy consumption on environmental degradation using dynamic ARDL (DYNARDL) simulations [8]. In addition, previous studies [9,10] have elucidated the environmental migration effects of air pollution at a micro-level, and determined the influence of water quality and land use based on greenhouse gas dynamics in an urbanized river system.
Renewable energy systems have garnered considerable attention recently since they can realize environmental protection while generating low carbon emissions. Sun et al. [11] constructed a capacity planning and optimization model to minimize the cost per unit power generated by utilizing wind and photovoltaic power generation while taking into account environmental externalities. Hafez et al. [12] focused on the optimal planning, design, sizing, and operation of a hybrid renewable energy-based microgrid to minimize the lifecycle costs and environmental emissions. Nam et al. [13] developed a deep learning-based forecasting model for renewable energy scenarios by using the Korean energy policy as a case study to guide sustainable energy policy. Zheng et al. [14] quantified the influence of renewable energy generation on carbon emissions through a quantile regression model and path analysis of inter-provincial panel data from 2008 to 2017 in China.
Since many of the optimization techniques used in district energy systems are in the operation phase [15–17], the energy consumption, cost, environmental impacts, and optimization framework have only been determined for the operation stage. However, the entire life cycle is rarely considered.
Multi-energy systems have the potential to reduce energy consumption, economic costs, and carbon emissions. However, the environmental and economic advantages of these energy systems are heavily dependent on their design, government policy, and operational strategy. Consequently, methods and guidelines are needed for the optimal design and operation of such systems to fully exploit their potential, while taking into account their life cycles [18].
This study focuses on the effectiveness of district renewable energy systems based on the economic benefits and carbon emissions in the entire life cycle, analyzes the correlation characteristics between energy consumption and carbon emissions, and provides a decision-making basis for China to formulate urban low-carbon development policies.
3.1 Schematic of Renewable Energy Optimization
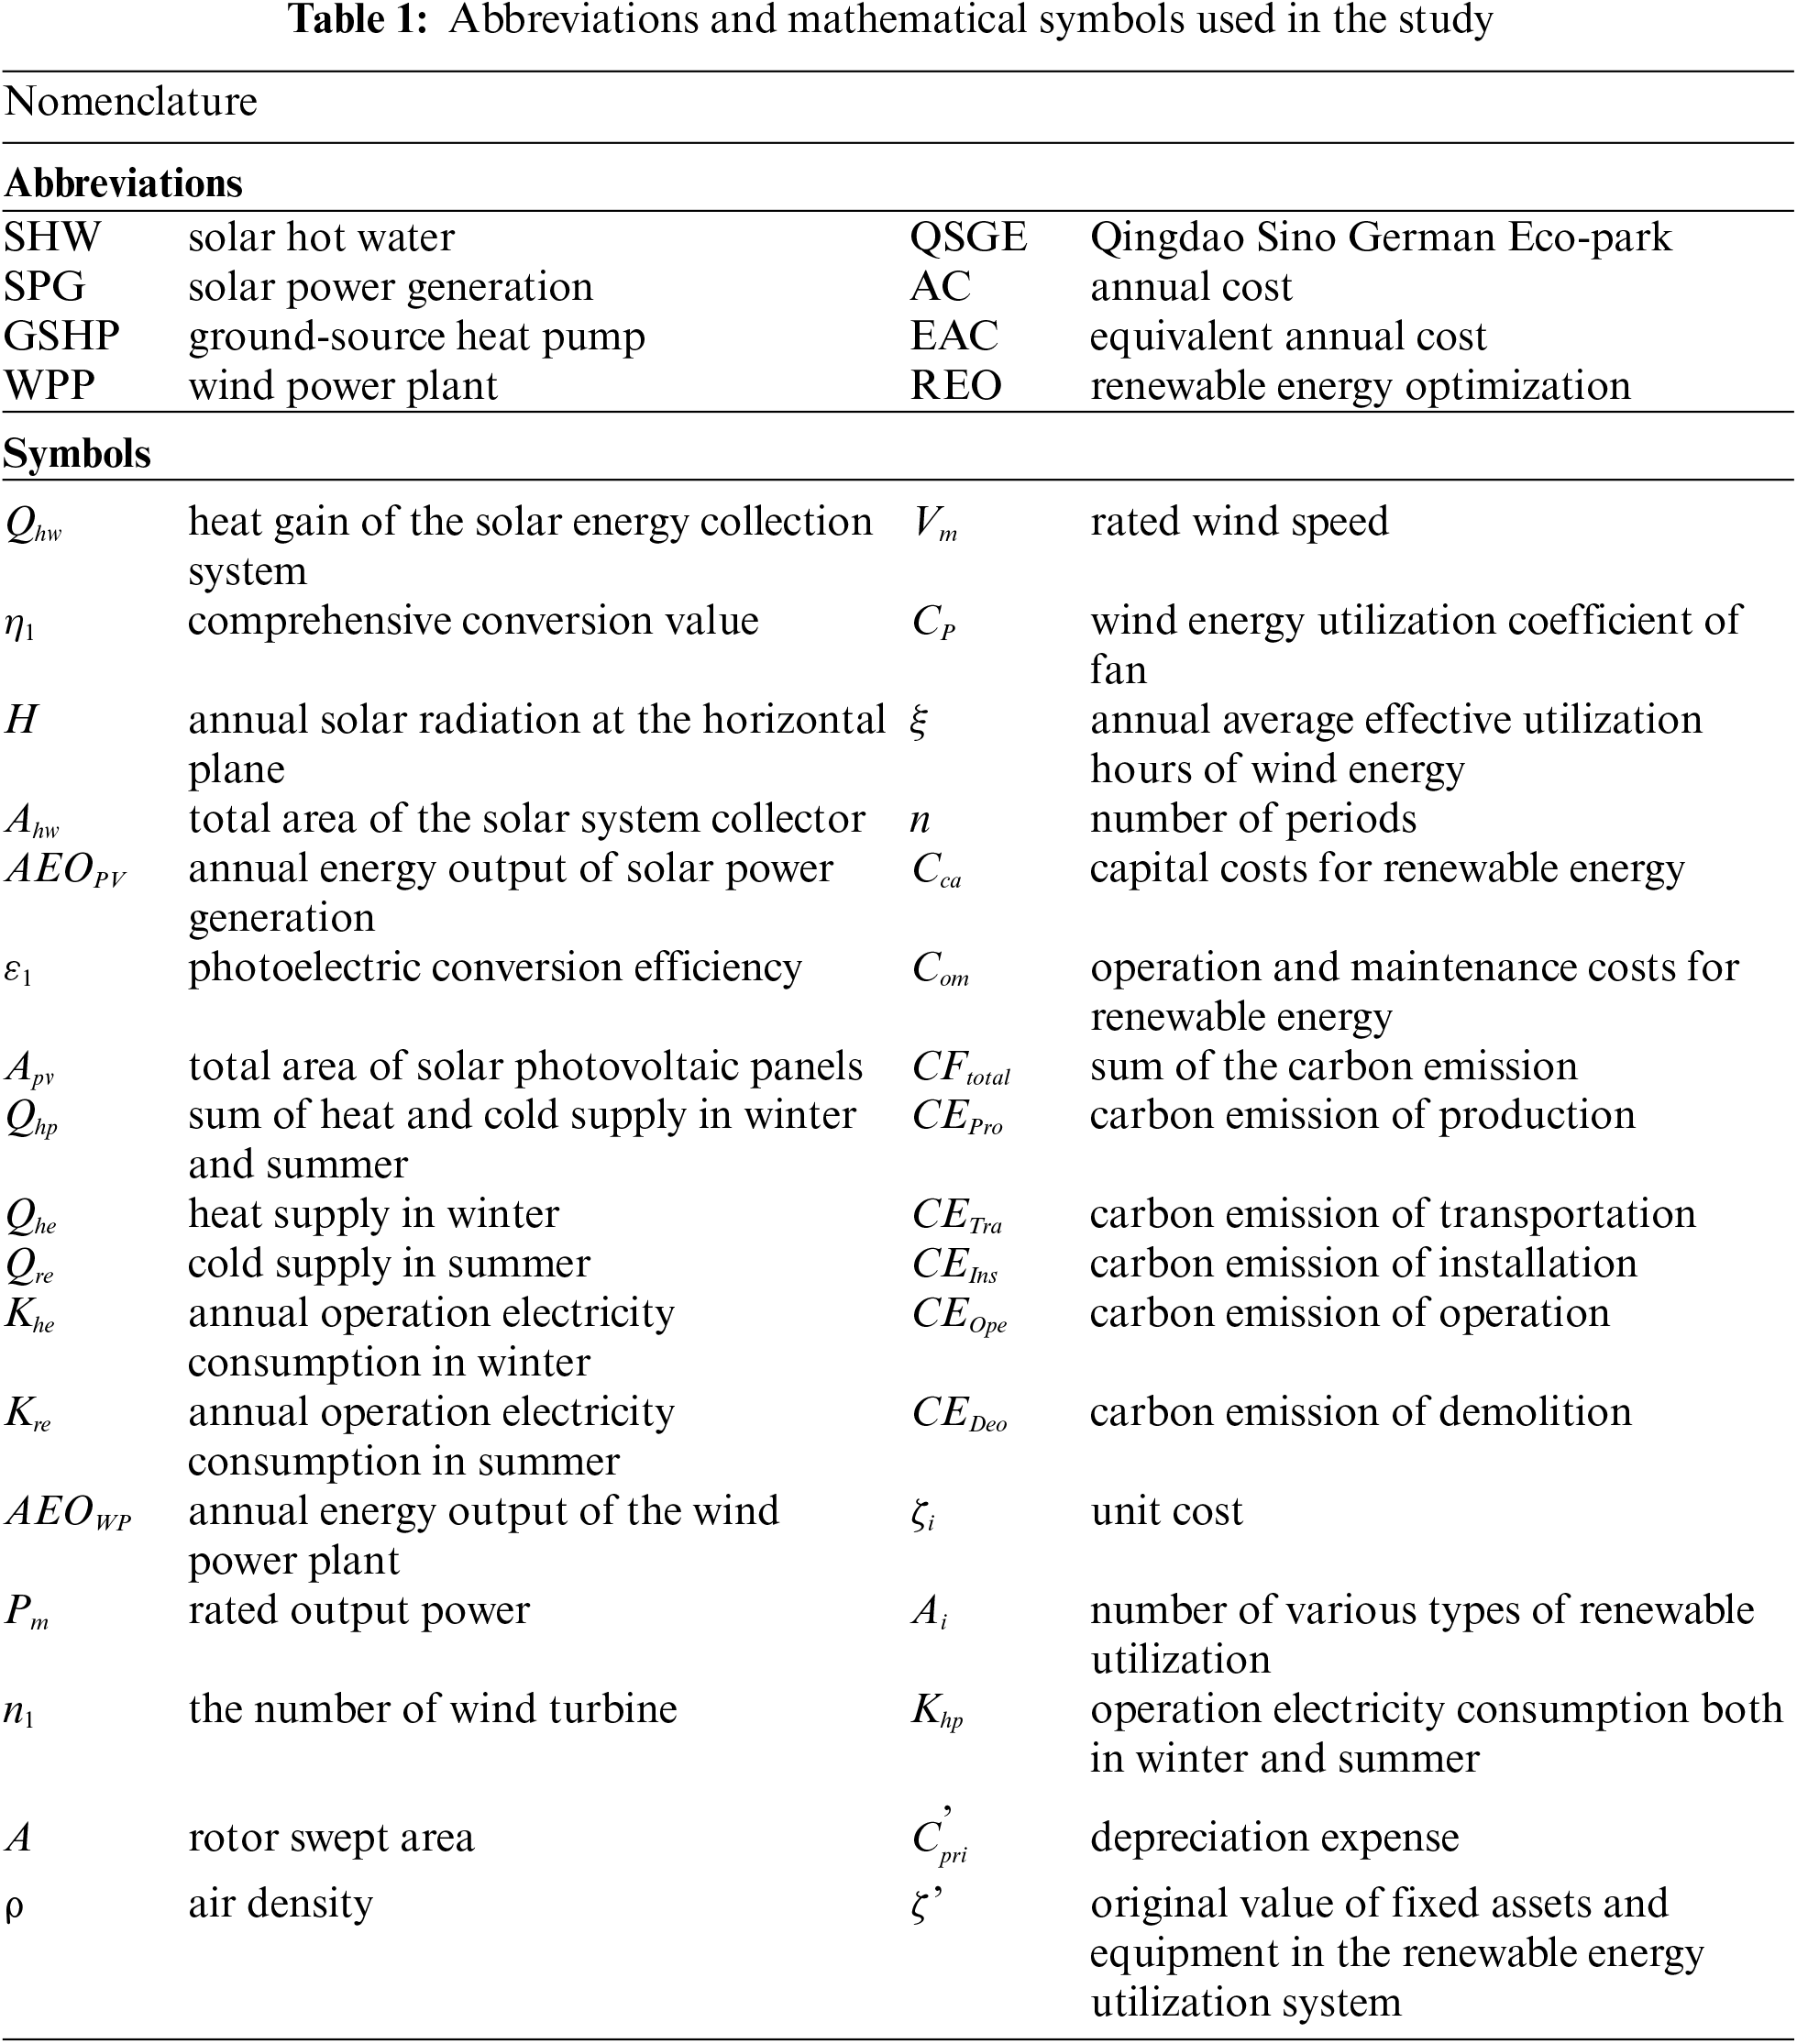
The percentage of renewable energy was determined based on a series of standards and codes, such as CASBEE for Urban Development (Institute for Building Environment and Energy Conservation (IBEC), 2014) [19], BREEAM Communities (BREEAM, 2012) [20], and Assessment Standard for Green Eco-District (MHURD, 2017) [21]. However, there is no single strategy for achieving the targets associated with renewable energy systems at the urban level. In this study, an approach based on annual cost (AC) and carbon emission was used to optimize the allocation of different renewable energy systems at the planning stage; AC is the sum of the equivalent annual cost (EAC), operation cost, and maintenance cost. Meanwhile, carbon emission refers to the number of greenhouse gases, specifically carbon dioxide, emitted by a system during its entire life cycle, which includes the production, transportation, installation, operation, and demolition of components. Fig. 1 illustrates a simplified schematic of the renewable energy optimization configuration. Abbreviations and mathematical symbols used in this paper as shown in Table 1.
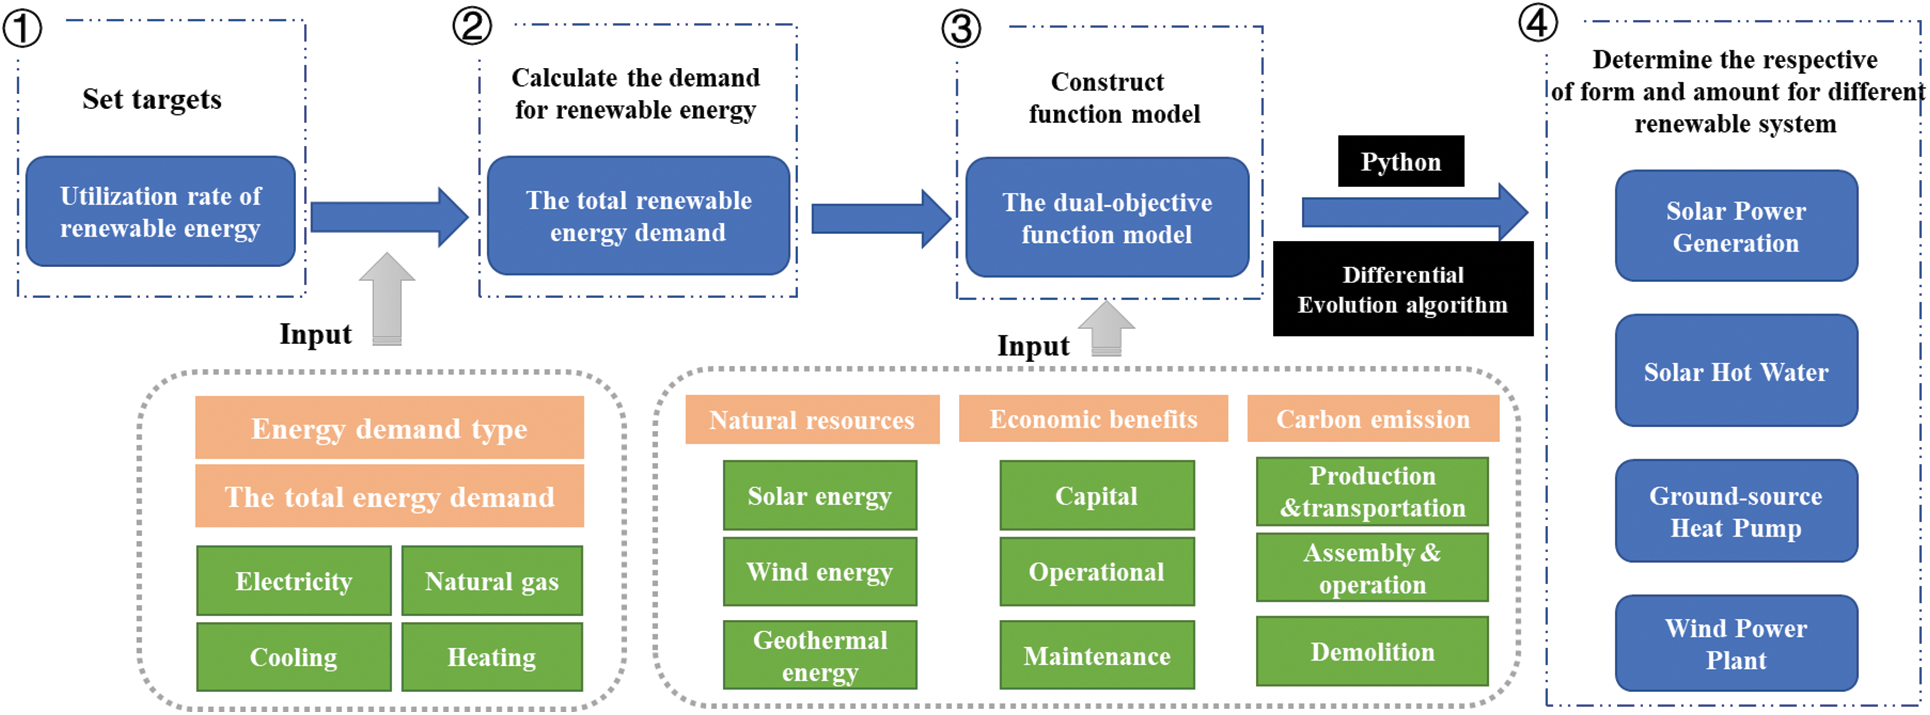
Figure 1: Simplified schematic of the renewable energy optimization configuration, which involved four steps
• Step 1: Determine the renewable energy utilization rate based on local requirements. For example, the California Renewables Portfolio Standard Program (Senate Bill 100) set a target to achieve a renewable energy utilization rate of 50% and 60% by December 31, 2026, and December 31, 2030, respectively [22].
• Step 2: Calculate the renewable energy demand based on total energy demand. All types of energy sources, such as electricity, natural gas, HVAC, and domestic hot water, must be included.
• Step 3: Construct a dual-objective function model that represents the life cycle cost and carbon emission of renewable energy systems, and use the differential evolution algorithm to solve the optimization result.
• Step 4: According to the above-mentioned results, use the optimized proportions of different renewable systems to calculate the minimum cost and carbon emission.
3.2 Determining the Renewable Energy Utilization
The renewable energy sources discussed in this study include solar hot water (SHW), solar power generation (SPG), ground-source heat pump (GSHP), and wind power plant (WPP). The primary focus of the renewable energy utilization model is to determine the share of different renewable energy since it governs the minimum cost and carbon emission.
SHW is a widely applied example of solar thermal utilization, and SHW systems are categorized by their collector type, such as flat plate, vacuum tube, and heat pipe vacuum collectors. The heat gain of the SHW system is calculated as follows:
where
SPG, which is one of the fastest-growing approaches to generating power, involves the conversion of solar power into electricity through photovoltaics [23]. Although solar power has several applications, it has been used to generate electricity through photovoltaic cells in this study. The power generated from the photovoltaic cells is calculated as follows:
where
GSHP systems, which use rock and soil, groundwater, or surface water as low-temperature heat sources, are reliable, cost-effective, safe, and environmental-friendly air-conditioning systems composed of heat pump units, geothermal energy exchange systems, and building systems. The coefficient of performance (COP) is a measurement of the efficiency of the ground-source heat system [24]. For example, a heat pump with a COP of 3.0 can transfer three times the heat or cold energy into the building when compared to its operational electricity consumption.
Meanwhile,
The supplied energy includes the heat supply
With an increase in the number of WPPs, the variability in the net power generated by all the systems increases [25]. Most US manufacturers rate their turbines using the amount of power a turbine can safely produce at a particular wind speed. This speed typically ranges between 10.5 and 16 m/s. An estimate of the annual energy output from a wind turbine (kWh/year) is the best way to determine whether a particular wind turbine and tower will produce enough electricity for a particular application. To obtain a preliminary estimation of the annual energy output from a particular wind turbine, the following formulas were used:
where
4.1 Model of Economic Benefits
Some energy decision tools fail to consider the interaction between multiple technologies even though they can behave synergistically, and such interactions can be particularly complex and not easy to understand [26–28]. A straightforward technique that can accurately model integrated technologies is particularly relevant when evaluating renewable energy technologies. Therefore, this study proposes the functions of an optimization model that can minimize the life cycle cost and carbon emissions at a particular renewable energy utilization rate.
The objective function that minimizes the life cycle cost of renewable energy equals the sum of capital costs as well as the operation and maintenance costs. The smaller the value of AC, the better the cost-effectiveness of the renewable energy system. EAC and AC are calculated as follows:
where
Based on the theory of life cycle assessment, Xiang analyzed the factors influencing carbon emissions from residential buildings [29]. According to Ren et al., China’s carbon emissions in cities exert significant spatial spillover effects and agglomerate areas with high emissions [30]. Researchers have proposed several different relationships between urbanization, energy consumption, and carbon emissions. A previous simulation study implied that the impact of additional emergency costs on the profit difference between the mixed energy strategy and traditional energy strategy is mediated by carbon emissions [31].
In this study, carbon emission only refers to the carbon emissions released by renewable energy facilities in their entire life cycle. The total carbon emission from renewable energy facilities for their entire life cycle is calculated as follows:
where
4.3 Dual-Objective Optimization Functions
Several countries have explored new energy policies to reduce their carbon emissions, such as carbon tax, carbon trading, and renewable energy utilization. Pei et al. used Chinese provincial data from 2005 to 2015 to explore the impacts of corruption and energy efficiency on industrial carbon emissions [32]. Yu and Tan were inspired by the definition of potential energy and formulated a new concept named potential carbon. They concluded that potential carbon analysis could assist the decision-making process related to energy source planning and meet energy demands within carbon emission constraints [33]. Renugadevi et al. built an objective function to maximize green energy usage while reducing operating costs and carbon emissions [34]. Kneifel studied the life cycle carbon emission characteristics and the cost analysis of energy efficiency measures in new commercial buildings, which not only saved money and energy but also reduced buildings’ carbon footprint by 16% on average [35].
With rational energy planning and scientific guidance, it is possible to effectively reduce carbon emissions and energy costs associated with renewable energy utilization. However, in the present study, it is insufficient to use a method that allocates different renewable energy resources while considering life cycle carbon emissions and cost. Hence, a dual-objective optimization function that minimizes both AC and
5 Case Study: Qingdao Sino German Eco-park
5.1 Description of the Project
To verify the above-mentioned model, QSGE was selected as the study area for testing the consistency of renewable energy utilization and dual-objective optimization function. Subsequently, some critical aspects were investigated as well.
The eco-park has an area of 11.6 km2 that faces South Korea, Japan, and North Korea across the sea, with a planned floor area of 7.5 million m2. The land has been divided to serve different purposes, including residential, commercial, industrial, and municipal applications; Fig. 2 shows the zoning plan. Furthermore, QSGE won the Global Model of Green Building Industrial Park award in 2018 and met most requirements for renewable energy applications. Fig. 3 shows the number and proportion of different land use types in QSGE.
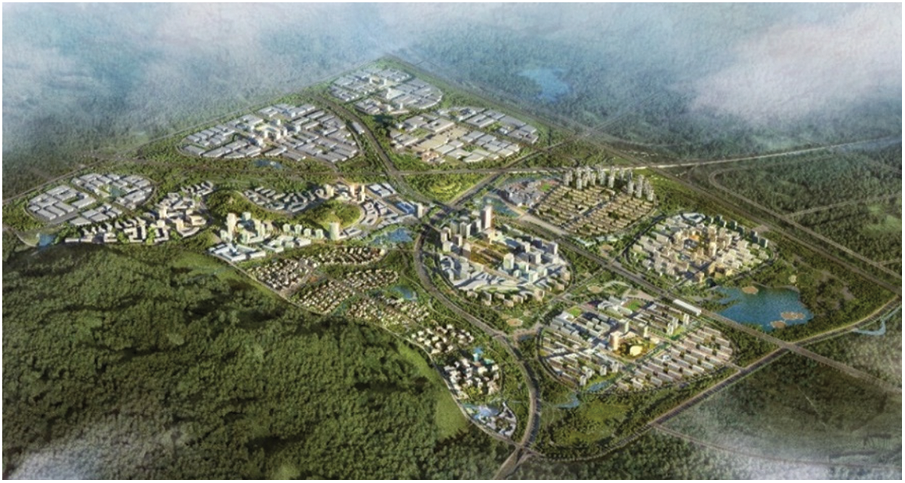
Figure 2: Zoning plan of Qingdao Sino-German Eco-park
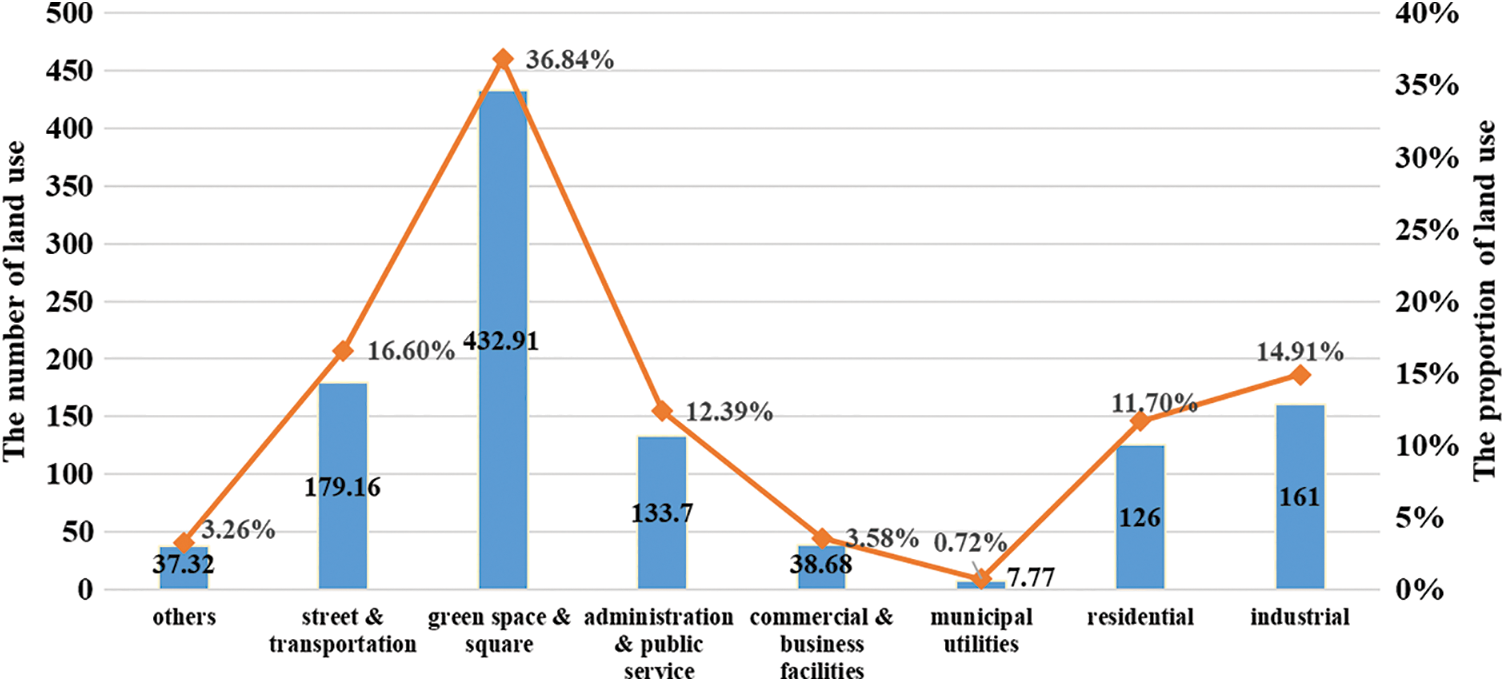
Figure 3: Number and proportion of land use types
5.2 Load and Energy Consumption
To generate renewable and clean energy in the QSGE, a widespread energy net has been designed that comprises a centralized system connected with different independent systems. This design optimizes the system for production, storage, and transport of energy, while allowing the application, regeneration, and allocation of various energy resources.
Fig. 4 shows the proposed energy flow diagram of QSGE [36]. The energy supply-side of QSGE includes natural gas, state grid power, and renewable energy, and equals 326,072.78 MWh according to the conservation principle of mass and heat. The energy use-side includes all the building types shown in Fig. 4. Meanwhile, loads associated with heating, cooling, domestic hot water, electricity, and natural gas have also been considered.
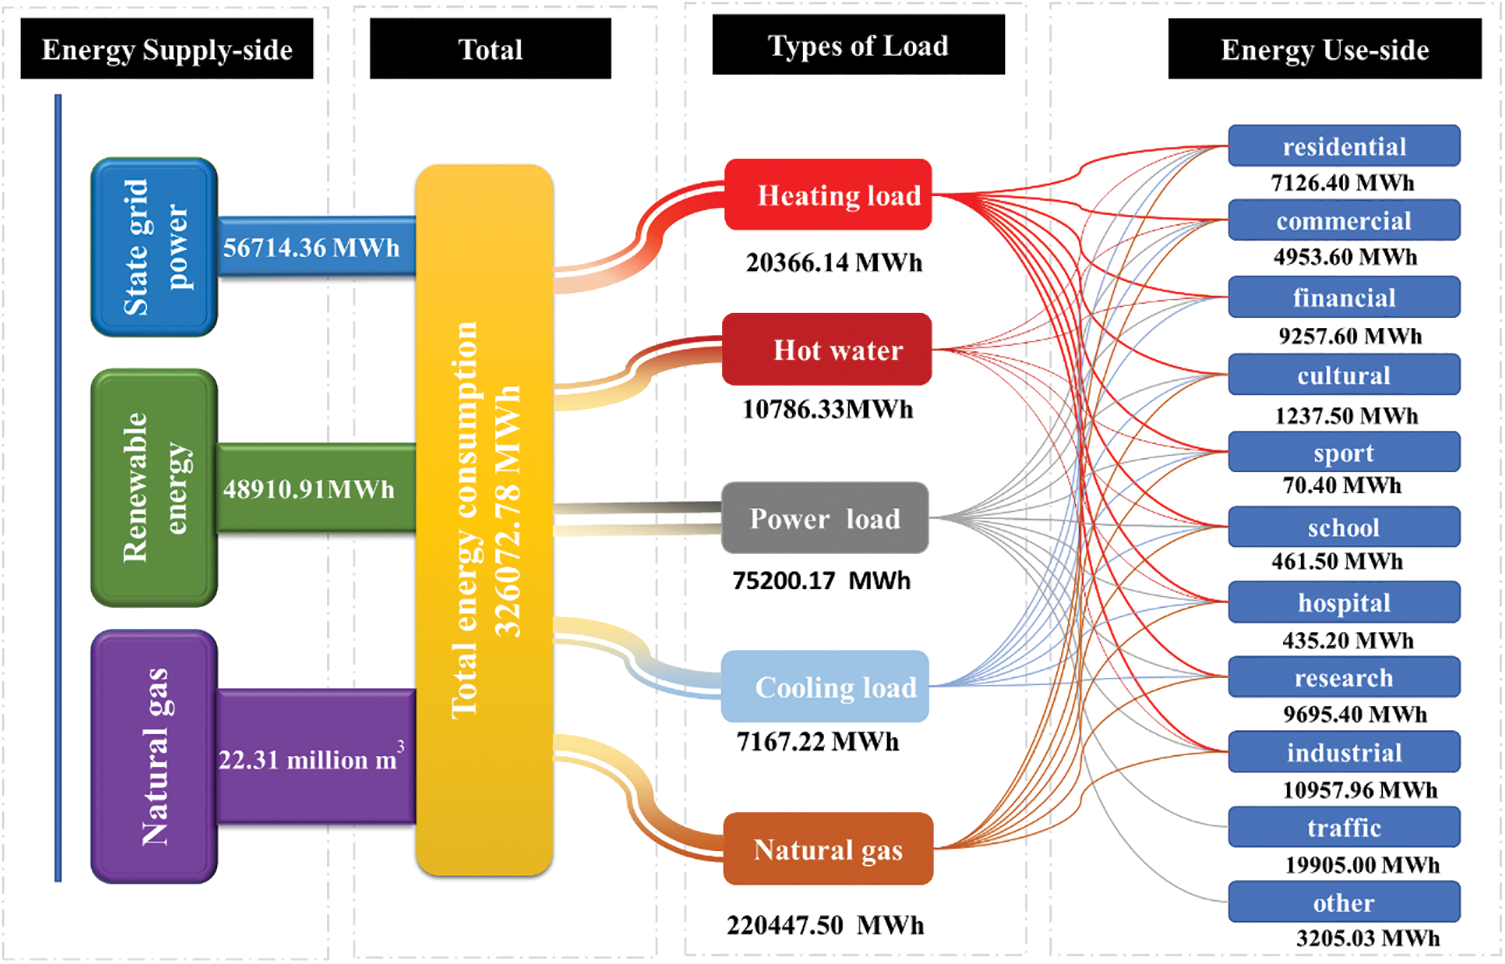
Figure 4: Energy flow diagram of QSGE
5.3 Natural Resources and Calculation of Renewable Energy
The data on local natural resources have been sourced from a software called WheatA wherein the closest available test point is the Qingdao meteorological station (coordinates: 36°04′12.5″N 120°19′16″E). This station exhibits annual solar radiation of 4636.69 MJ/m2 and an annual average wind speed of 3.55 m/s. Figs. 5 and 6 show the average monthly solar radiation and average monthly wind speed from 2011–2020, respectively. For a geothermal heat pump, sand and stone must be a part of the geology. At this site, weathered granite is found at 0–30 meters, sand and stone with a thermal conductivity coefficient of 1.464 W/m are found at 30–120 m, and the average specific heat capacity is 1.847 × 10³ KJ/m3. Therefore, QSGP is ideal for renewable energy utilization.
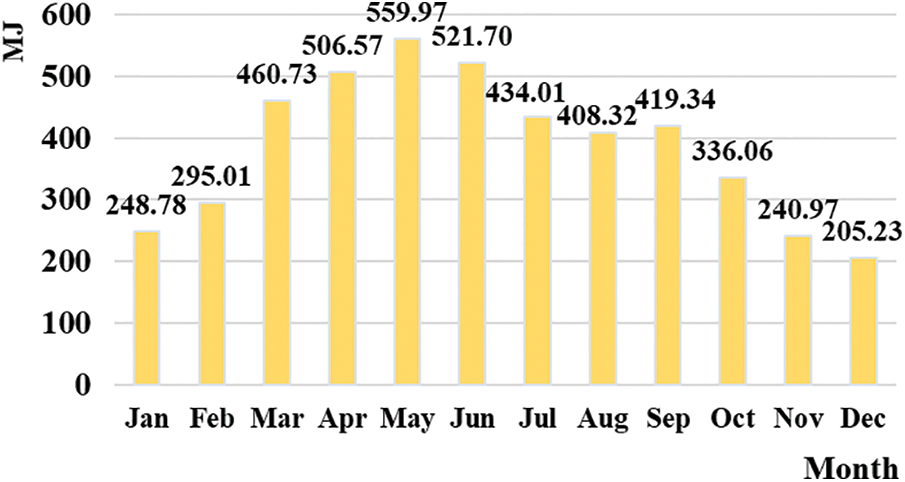
Figure 5: Average monthly solar radiation from 2011–2020
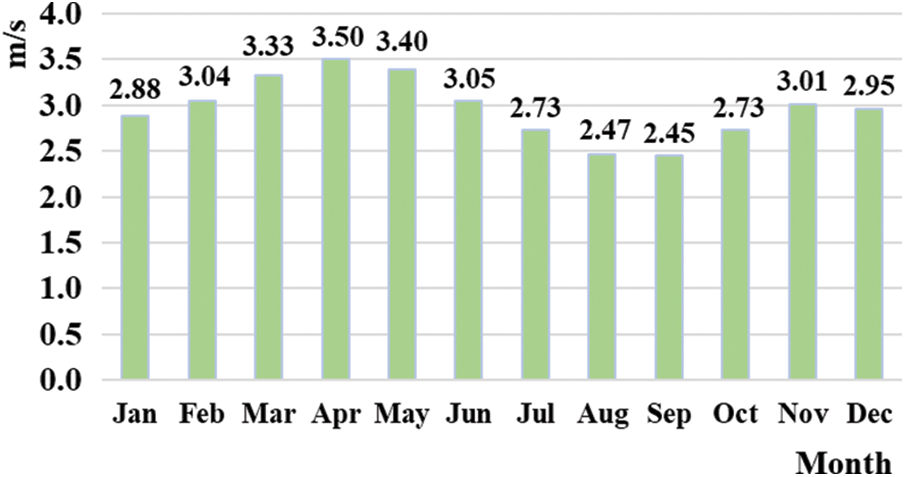
Figure 6: Average monthly wind speed from 2011–2020
5.3.2 Calculation of Renewable Energy
Renewable energy is designed to account for 15% of the total energy consumption in the QSGE. Fig. 4 shows that the total energy consumption of the project is 326,072.78 MWh, and the utilization of renewable energy is 48,910.92 MWh (176 million MJ). Renewable energy is mainly sourced from solar energy utilization, wind power generation, and the GSHP system.
Solar energy utilization includes SHW and SPG. According to Section 4.3.1, total solar radiation H = 4636.69 MJ/m2·a. Since the solar energy collected throughout the year cannot be used up completely, the effective utilization coefficient is set at
According to Chinese conventions, this region is a ‘cold area’. The heating load in winter is181.48 MJ/m2, and the cooling load in summer is 136.55 MJ/m2. The GSHP provides cooling or heating to the floor area (
Based on Eq. (5), the annual energy output of WPPs is
5.4 Economic Benefits and Carbon Emissions
The optimization model provides an optimal solution that offers economic benefits and reduces carbon emissions. To validate the applicability of the model, it is applied to QSGE and the results obtained are satisfactory.
5.4.1 Calculation of Economic Benefits
Economic benefits analysis methods have been used to evaluate the AC and EAC of this project. The EAC includes capital costs as well as annual operation and maintenance costs for various types of renewable energy. The capital costs are estimated using the unit area cost as follows:
where
According to the cost analysis of the renewable energy system construction in China, the capital required for constructing the unit area of SHW, SPG, GSHP, and WPPs is
Operation and maintenance costs are necessary and incurred by the recipient for maintaining and operating a system; these include electricity expenses, maintenance costs, and depreciation expenses for different renewable energy systems. For SHW, SPG, and WPPs, operation electricity costs are excluded, and the annual maintenance cost is calculated as 1% of the initial investment. For GSHP, the annual maintenance cost is calculated as 2.5% of the initial investment, and the operation electricity cost
where
Depreciation expense refers to the cost of purchasing a fixed asset that has undergone depreciation over time. This cost is added in the overall expense and calculated as follows:
where
The operation and maintenance costs are shown in Table 2.
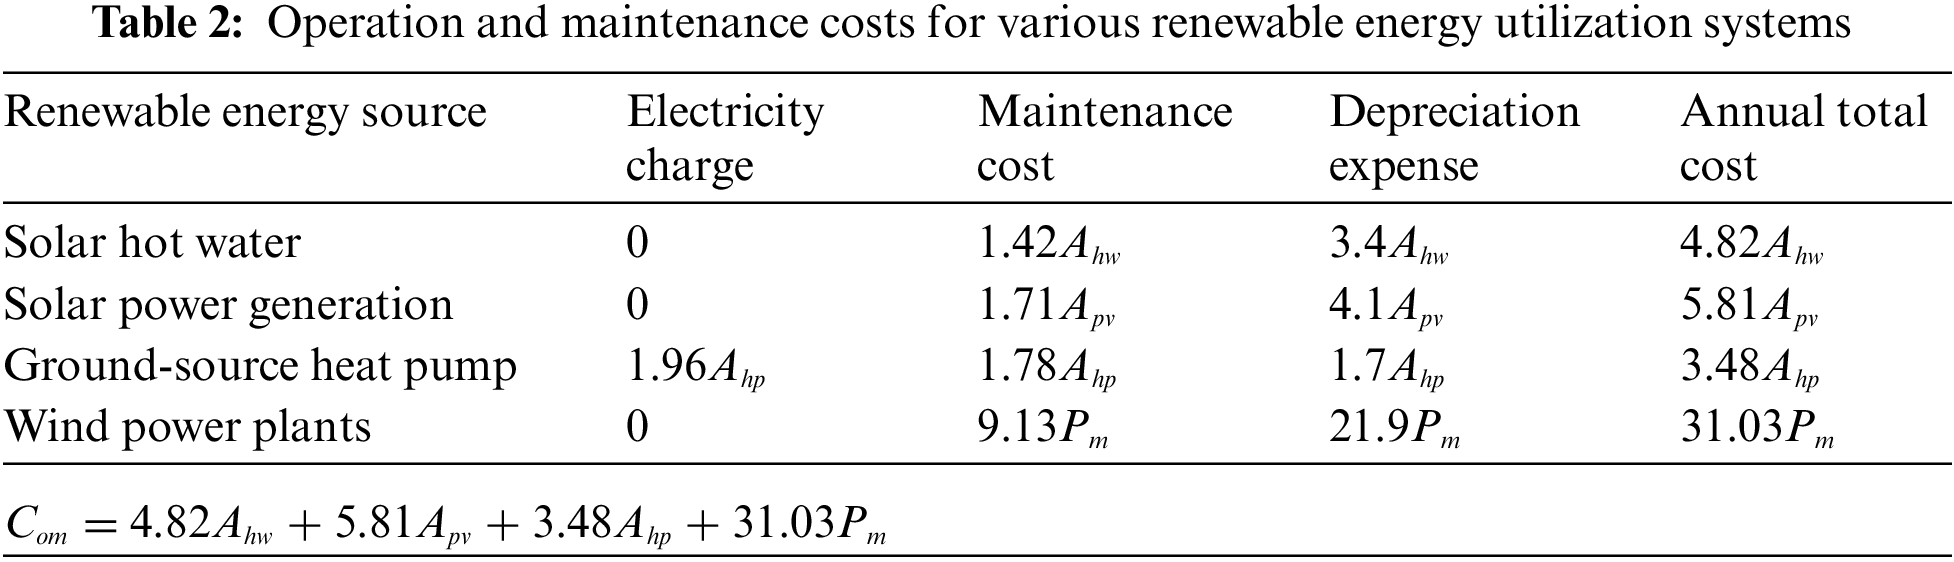
According to Eqs. (6), (7), and (12), the discount rate i is 10% and n is 20. Consequently, the following formulae are obtained:
5.4.2 Calculation of Carbon Emission
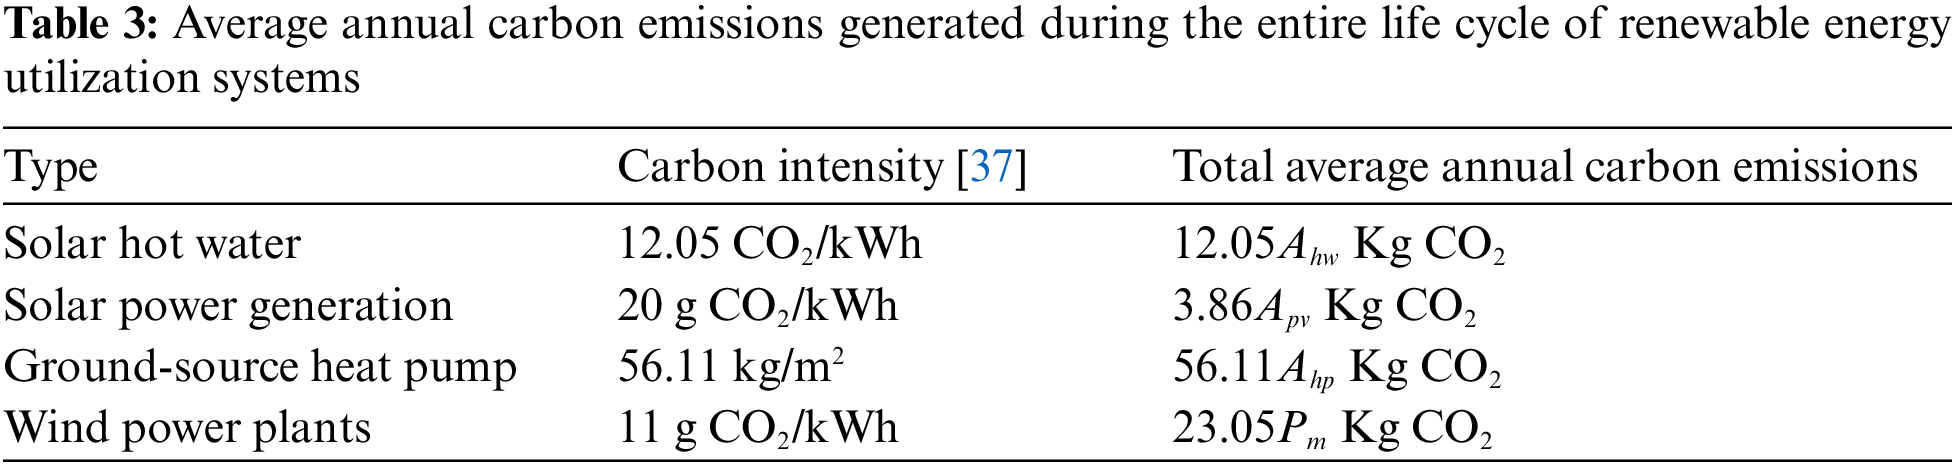
The carbon emissions generated during the entire life cycle of renewable energy systems refer to emissions produced during the production, transportation, installation, operation, and demolition of components. The proposed model was designed keeping in mind the overall carbon emission. Carbon intensities and total average annual carbon emissions for SHW, SPG, GSHP, and WPPs are shown in Table 3.
From Eq. (8),
5.4.3 Optimization and Constraints
The objective functions of the optimization model are used to minimize both AC and
Energy conservation is calculated to be 176 million MJ by using the following formula:
The following boundary constraints were applied to the QSGE:
5.5 Solution Method of Dual-Objective Function and Optimization
5.5.1 Solution Method of Dual-Objective Function
The differential evolution algorithm [38,39] has been used previously to solve the dual-objective functions Min f1(x) and Min f2(x). In general, this algorithm is mainly used to solve global optimization problems with continuous variables.
Fig. 7 shows the flow chart of the differential evolution algorithm. First, a population is randomly generated, and a difference vector of two individuals is randomly selected from the population as the random change source of the third individual. Second, the difference vector of the third individual is weighed and added according to certain rules to generate a mutation individual; this entire process is called mutation.
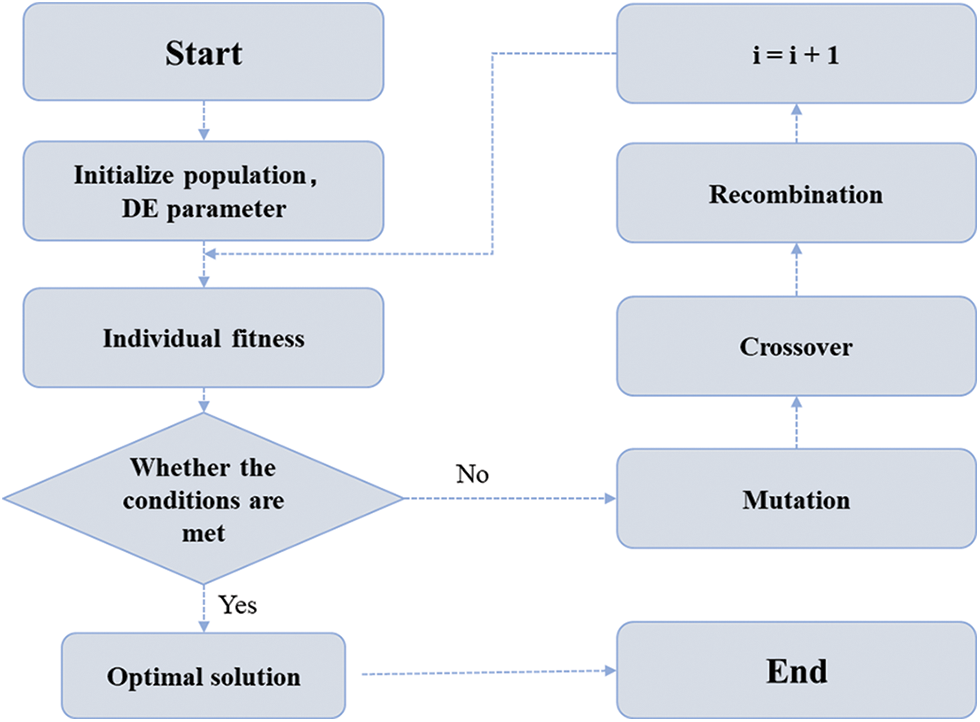
Figure 7: Flow chart depicting the differential evolution algorithm
Third, the mutation individuals and a predetermined target individual are mixed to generate test individuals; this process is called crossover. Finally, if the fitness value of the test individual is better than that of the target individual, the test individual will replace the target individual in the next generation; otherwise, the target individual will be preserved. This process is called selection.
In the evolution process of each generation, each vector is regarded as the target individual once. Through continuous iterative calculations, the algorithm keeps the good individuals, eliminates the bad ones, and guides the search process to obtain a globally optimal solution.
By using the Geatpy package in Python, differential evolution is used to solve this problem, and the main results are as follows:
(1) The independent variables converge to the same value when objective functions f1 (x) andf2 (x) reach their minimum values; that is,
(2) The minimum value of f1 (x) and f2 (x) is $2,834,117 and 556,299 kg CO2, respectively, as shown in Figs. 8 and 9.
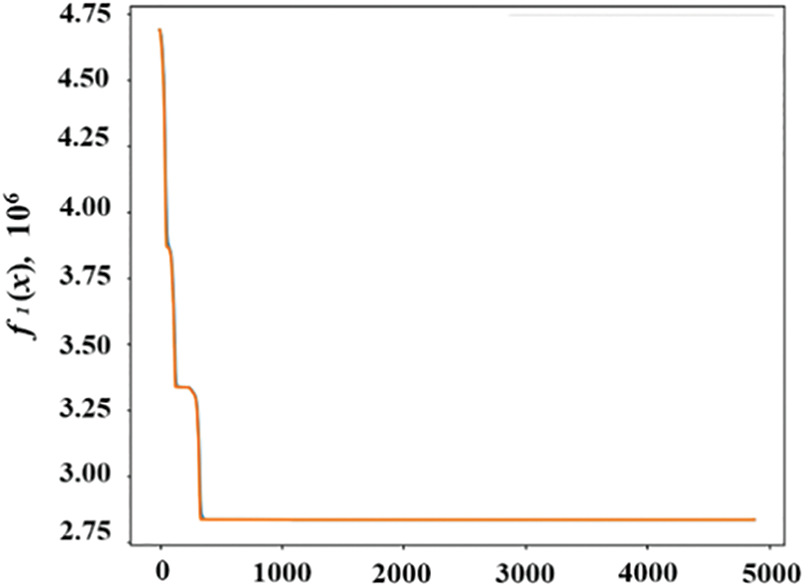
Figure 8: Solution graph of f1 (x) obtained using the differential evolution algorithm
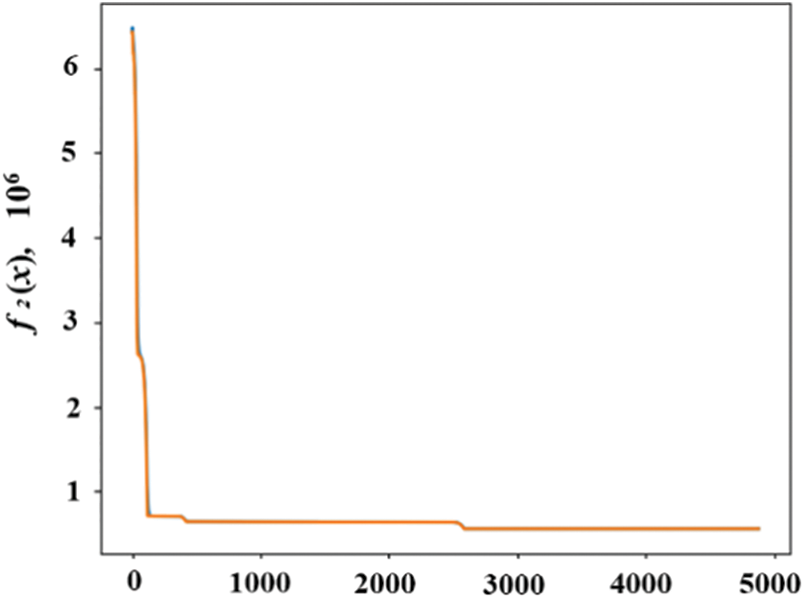
Figure 9: Solution graph of f2 (x) obtained using the differential evolution algorithm
5.5.2 Comparative Analysis of Optimization
The energy consumption and renewable energy demand for the urbanization of the study area are presented in Section 4.2. The baseline model used in this case was prepared by the urban planner during the design stage. The baseline model contains the types and percentages of each renewable energy source. The comparison and analysis results of the baseline and optimized models are shown in Table 4.
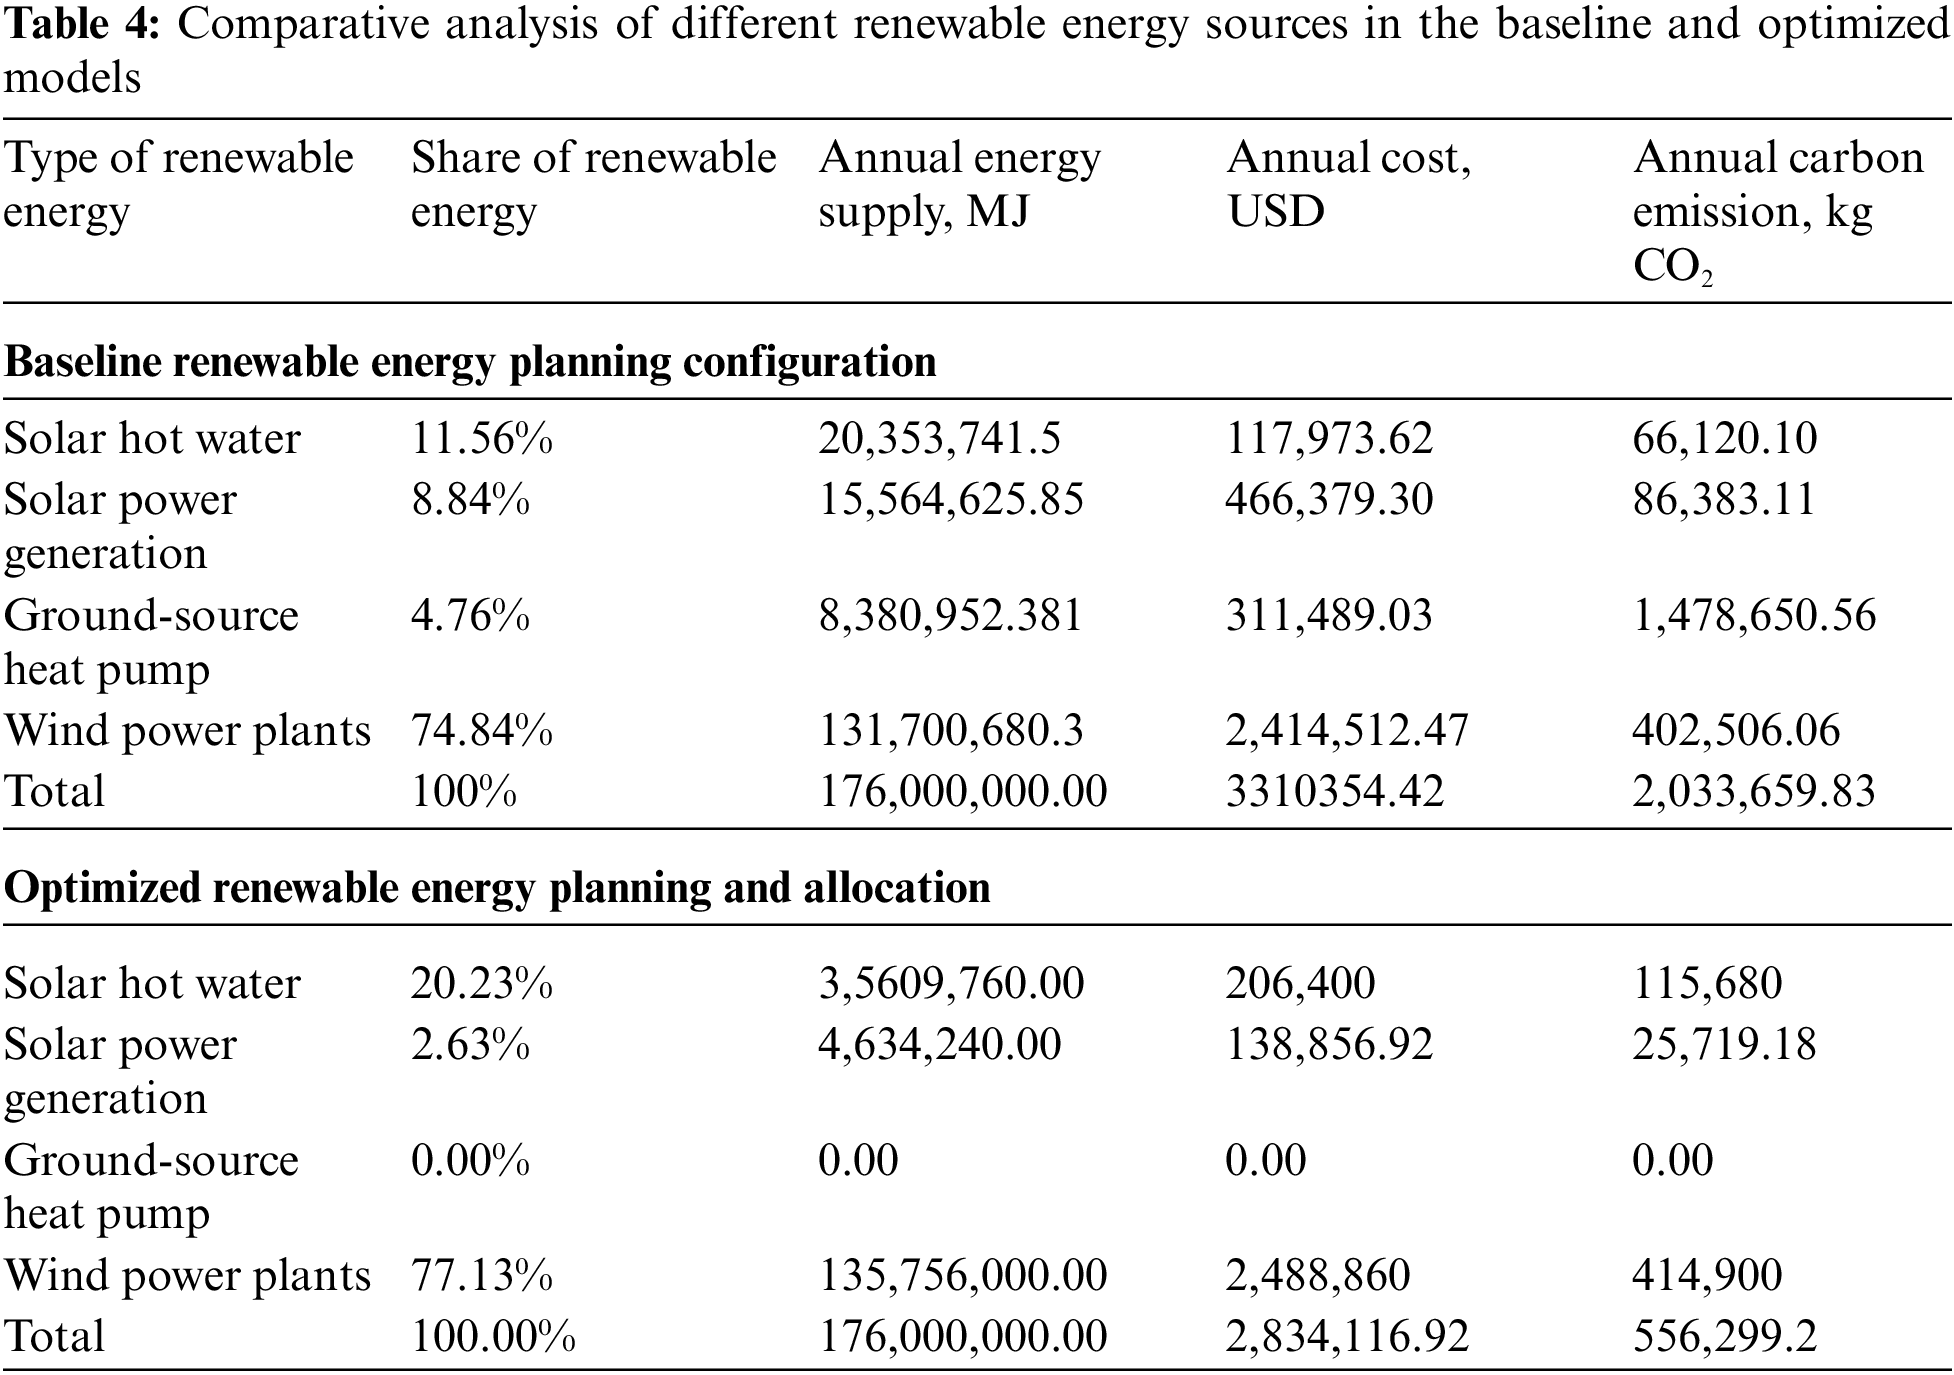
Fig. 10 shows the share of renewable energy in the baseline and optimized models. For both models, the largest share of renewable energy is produced by WPPs (74.83% and 77.13% for the baseline and optimized models, respectively). The proportion of SHW increased significantly after optimization (from 11.56% to 20.23%). Meanwhile, the proportions of SPG and GSHP systems were reduced (from 8.84% to 2.63% and from 4.76% to 0%, respectively).
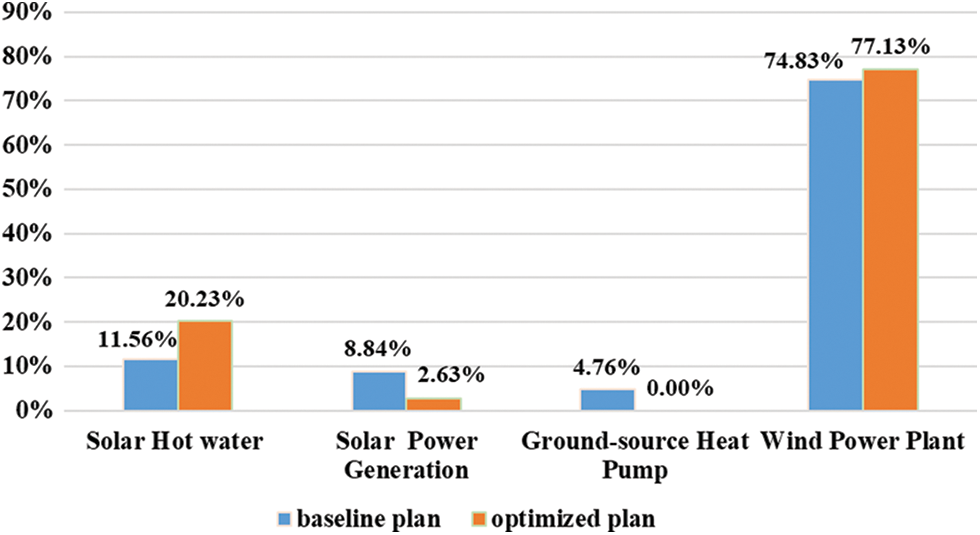
Figure 10: Proportions of different renewable energy sources in the baseline and optimized models
Fig. 11 shows the amount of energy generated by each renewable energy source. Fig. 12 compares the results of different renewable energy variables. The total area of the SHW collector
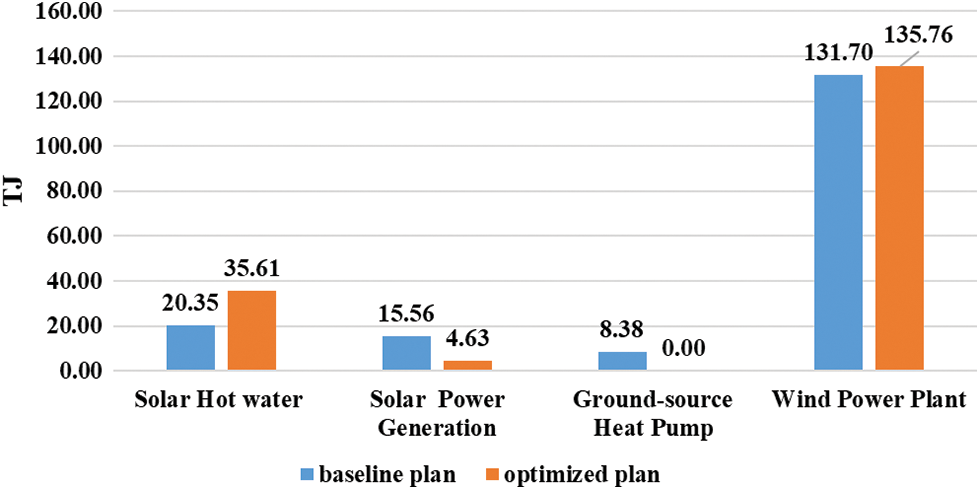
Figure 11: Amount of energy supplied by different renewable energy sources
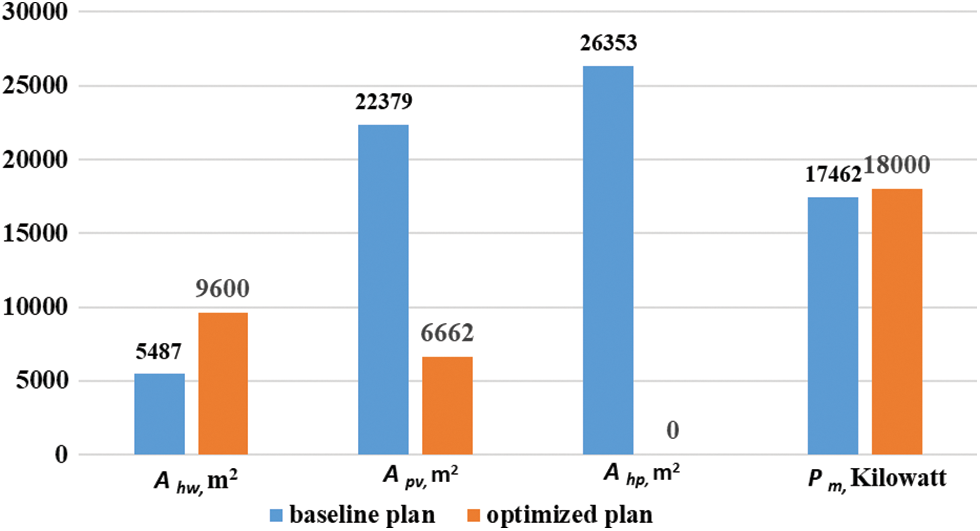
Figure 12: Comparison of different renewable energy variables
Figs. 13 and 14 compare the ACs and annual carbon emissions before and after optimization. After optimization, AC was reduced by 14.39% (from $3310,354.42 to $2834,116.92) and the annual carbon emission was reduced by 72.65% (from 2,033,659.83 to 556,299.18 kg).
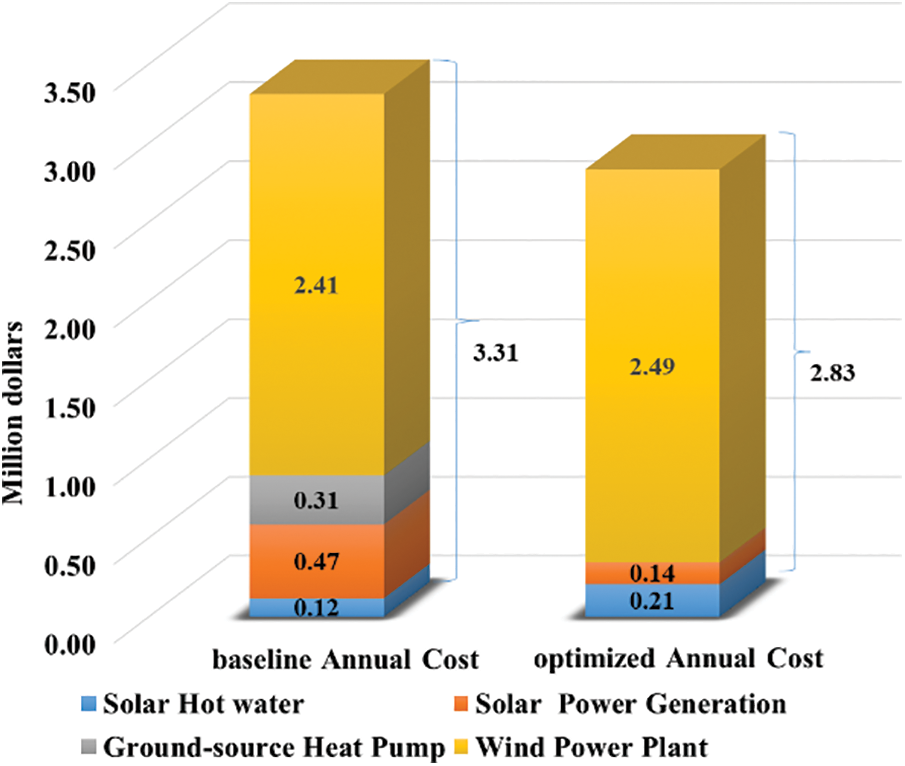
Figure 13: Comparison of annual costs associated with the baseline and optimized models
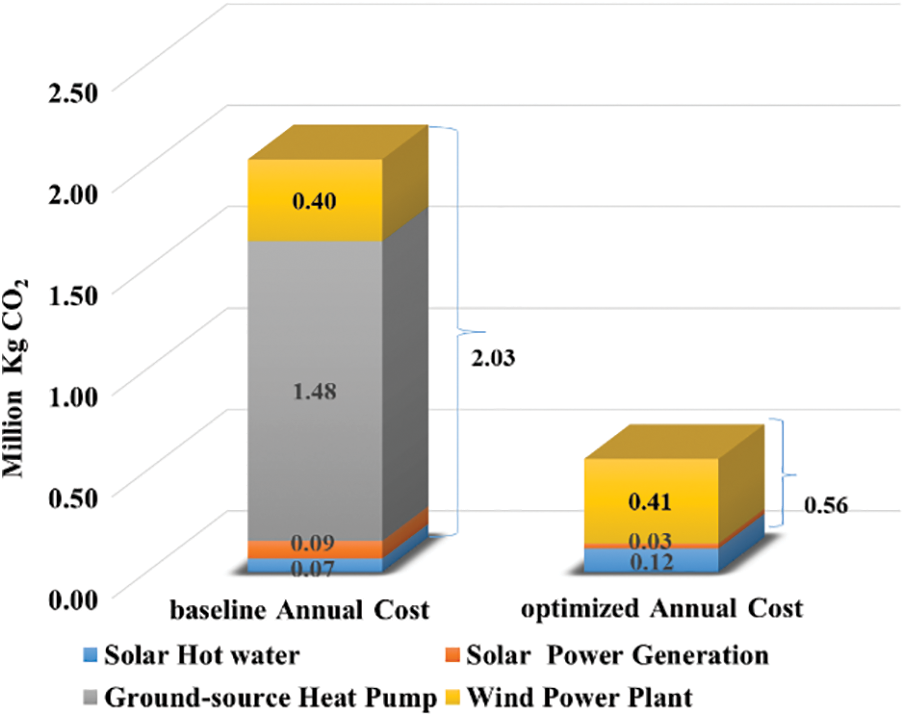
Figure 14: Comparison of annual carbon emissions associated with the baseline and optimized models
In the context of climate change and increasingly severe ecological problems, district energy systems with high carbon emissions are unsustainable. This study proposes a novel method that considers costs and carbon emissions to optimize the energy system, select and size renewable energy equipment, and evaluate corresponding renewable energy plans with high flexibility. This proposed model is predicted to play an important role in promoting low-carbon sustainable development in China and other countries in the world. Accordingly, the following conclusions have been established:
• This study elucidates the method used to optimize a design and dispatch model, which minimizes the life cycle costs and carbon emissions of renewable energy systems at a given renewable energy utilization rate. The study findings can be used to reduce the carbon emissions in urban areas and facilitate China's low-carbon policy.
• This study also reveals the effect of SPG, SHW, GSHP, and WPPs on the carbon emissions of district energy systems, which are mainly influenced by indicators such as energy consumption, building area, energy costs, and emission factors.
• A case study was conducted in Qingdao, China, to demonstrate the impact of the proposed optimization model. Compared to the baseline model, AC was reduced by 14.39%, and annual carbon emission was reduced by 72.65%. These results prove that dual-objective optimization is an effective method to optimize economic benefits and reduce carbon emissions. This study will assist policy makers in Qingdao to introduce renewable energy-related policies, including those that increase photovoltaic power generation and promote solar hot water applications.
However, this study has some limitations, which we hope to address in the future. For example, the impact of optimizing carbon emissions generated by renewable energy systems on other pollutants such as SO2, NOx, and PM2.5 has not been discussed, and the effect of demolishing and restoring existing traditional district energy systems on costs and carbon emissions is not conveyed.
Funding Statement: This work is supported financially by the National Natural Science Foundation of China (No. 62276080) and National Key R&D Program of China (No. 2018YFD1100703-06).
Conflicts of Interest: The authors declare that they have no known competing financial interests or personal relationships that could have appeared to influence the work reported in this paper.
References
1. Gustavsson, E., Elander, I., Lundmark, M. (2009). Multilevel governance, networking cities, and the geography of climate-change mitigation: Two Swedish examples. Environment and Planning C: Government and Policy, 27(1), 59–74. https://doi.org/10.1068/c07109j [Google Scholar] [CrossRef]
2. Munoz, I., Hernandez, P., Perez-Iribarren, E., Pedrero, J., Arrizabalaga, E. et al. (2020). Methodology for integrated modelling and impact assessment of city energy system scenarios. Energy Strategy Reviews, 32, 100553. https://doi.org/10.1016/j.esr.2020.100553 [Google Scholar] [CrossRef]
3. Hannah, M. R., Pablo, R. (2022). Our world in data (Renewable energy). https://ourworldindata.org/renewable-energy [Google Scholar]
4. Usman, M., Radulescu, M. (2022). Examining the role of nuclear and renewable energy in reducing carbon footprint: Does the role of technological innovation really create some difference? Science of the Total Environment, 841(5), 156662. https://doi.org/10.1016/j.scitotenv.2022.156662 [Google Scholar] [PubMed] [CrossRef]
5. Usman, M., Balsalobre-Lorente, D. (2022). Environmental concern in the era of industrialization: Can financial development, renewable energy and natural resources alleviate some load? Energy Policy, 162(1), 112780. https://doi.org/10.1016/j.enpol.2022.112780 [Google Scholar] [CrossRef]
6. Ayad, H., Sari-Hassoun, S. E., Usman, M., Ahmad, P. (2022). The impact of economic uncertainty, economic growth and energy consumption on environmental degradation in MENA countries: Fresh insights from multiple thresholds NARDL approach. Environmental Science and Pollution Research, 28(1), 1–19. https://doi.org/10.1007/s11356-022-22256-w [Google Scholar] [PubMed] [CrossRef]
7. Guo, Q. B., Wang, Y., Dong, X. B. (2022). Effects of smart city construction on energy saving and CO2 emission reduction: Evidence from China. Applied Energy, 313, 118879. [Google Scholar]
8. Nurgazina, Z., Guo, Q. B., Ali, U., Kartal, M. T., Ullah, A. et al. (2022). Retesting the influences on CO2 emissions in China: Evidence from dynamic ARDL approach. Frontiers in Environmental Science, 10, 868740. [Google Scholar]
9. Guo, Q. B., Wang, Y., Zhang, Y., Yi, M., Zhang, T. (2022). Environmental migration effects of air pollution: Micro-level evidence from China. Environmental Pollution, 292, 118263. [Google Scholar] [PubMed]
10. Ho, L., Jerves-Cobo, R., Barthel, M., Six, J., Bode, S. et al. (2022). Greenhouse gas dynamics in an urbanized river system: Influence of water quality and land use. Environmental Science and Pollution Research, 29(25), 37277–37290. [Google Scholar] [PubMed]
11. Sun, J. Q., Ruze, N., Zhang, J. J., Shi, J., Shen, B. Y. (2021). Capacity planning and optimization for integrated energy system in industrial park considering environmental externalities. Renewable Energy, 167, 56–65. [Google Scholar]
12. Hafez, O., Bhattacharya, K. (2012). Optimal planning and design of a renewable energy based supply system for microgrids. Renewable Energy, 45(12), 7–15. https://doi.org/10.1016/j.renene.2012.01.087 [Google Scholar] [CrossRef]
13. Nam, K., Hwangbo, S., Yoo, C. (2020). A deep learning-based forecasting model for renewable energy scenarios to guide sustainable energy policy: A case study of Korea. Renewable and Sustainable Energy Reviews, 122, 109725. https://doi.org/10.1016/j.rser.2020.109725 [Google Scholar] [CrossRef]
14. Zheng, H. Y., Song, M. L., Shen, Z. Y. (2021). The evolution of renewable energy and its impact on carbon reduction in China. Energy, 237(1), 121639. https://doi.org/10.1016/j.energy.2021.121639 [Google Scholar] [CrossRef]
15. Gao, K. Y., Wang, T. S., Han, C. J., Xie, J. H., Ma, Y. et al. (2021). A review of optimization of microgrid operation. Energies, 14(10), 2842. [Google Scholar]
16. Li, P., Zhang, F., Ma, X. Y., Yao, S. J., Zhong, Z. L. et al. (2021). Multi-time scale economic optimization dispatch of the park integrated energy system. Frontiers in Energy Research, 9, 533. https://doi.org/10.3389/fenrg.2021.743619 [Google Scholar] [CrossRef]
17. Mao, Y. S., Wu, J. K., Wang, R. D., Cai, Z. H., Zhang, R. et al. (2021). A collaborative demand-controlled operation strategy for a multi-energy system. IEEE Access, 9, 80571–80581. https://doi.org/10.1109/ACCESS.2021.3083922 [Google Scholar] [CrossRef]
18. Bahlawan, H., Morini, M., Pinelli, M., Spina, P. R., Venturini, M. (2021). Simultaneous optimization of the design and operation of multi-generation energy systems based on life cycle energy and economic assessment. Energy Conversion and Management, 249(9), 114883. https://doi.org/10.1016/j.enconman.2021.114883 [Google Scholar] [CrossRef]
19. Murakami, S., Yamaguchi, N., Asami, Y., Ikaga, T., Kaburagi, S. et al. (2007). Outline of casbee for urban development (CASBEE-UD)CASBEE; Comprehensive assessment system for building environmental efficiency part 5. AIJ Journal of Technology and Design, 13(25), 191–196. https://doi.org/10.3130/aijt.13.191 [Google Scholar] [CrossRef]
20. Group B. BREEAM Communities (2012). https://bregroup.com/products/breeam/breeamtechnicalstandards/breeam-communties/ [Google Scholar]
21. Pan, A., Wang, Q., Yang, Q. (2020). Assessment on the coordinated development oriented to Green City in China. Ecological Indicators, 116(3), 106486. https://doi.org/10.1016/j.ecolind.2020.106486 [Google Scholar] [CrossRef]
22. Senate Bill No. 100 DL: California renewables portfolio standard program: Emissions of greenhouse gases (2018). https://leginfo.legislature.ca.gov/faces/billNavClient.xhtml?bill_id=201720180SB100 [Google Scholar]
23. Herche, W. (2017). Solar energy strategies in the U.S. utility market. Renewable and Sustainable Energy Reviews, 77, 590–595. https://doi.org/10.1016/j.rser.2017.04.028 [Google Scholar] [CrossRef]
24. Widiatmojo, A., Chokchai, S., Takashima, I., Uchida, Y., Yasukawa, K. et al. (2019). Ground-source heat pumps with horizontal heat exchangers for space cooling in the hot tropical climate of Thailand. Energies, 12(7), 1274. https://doi.org/10.3390/en12071274 [Google Scholar] [CrossRef]
25. Ekstrom, J., Koivisto, M., Mellin, I., Millar, R. J., Lehtonen, M. (2018). A statistical modeling methodology for long-term wind generation and power ramp simulations in new generation locations. Energies, 11(9), 2442. https://doi.org/10.3390/en11092442 [Google Scholar] [CrossRef]
26. Yan, Y. M., Yan, J., Song, M. J., Zhou, X. Y., Zhang, H. R. et al. (2020). Design and optimal siting of regional heat-gas-renewable energy system based on building clusters. Energy Conversion and Management, 217, 112963. https://doi.org/10.1016/j.enconman.2020.112963 [Google Scholar] [CrossRef]
27. Ogunmodede, O., Anderson, K., Cutler, D., Newman, A. (2021). Optimizing design and dispatch of a renewable energy system. Applied Energy, 287(1), 116527. https://doi.org/10.1016/j.apenergy.2021.116527 [Google Scholar] [CrossRef]
28. Wang, M., Yao, M. T., Wang, S. S., Qian, H. Q., Zhang, P. F. et al. (2021). Study of the emissions and spatial distributions of various power-generation technologies in China. Journal of Environmental Management, 278(318), 111401. https://doi.org/10.1016/j.jenvman.2020.111401 [Google Scholar] [PubMed] [CrossRef]
29. Yu, X., Gao, P., Liu, Y., Lei, M., Zhang, P. (2015). Research on whole life cycle carbon emission model of typical buildings. Chinese Journal of Population Resources and Environment, 13(4), 320–323. https://doi.org/10.1080/10042857.2015.1056286 [Google Scholar] [CrossRef]
30. Ren, Y. Y., Ren, X., Hu, J. B. (2019). Driving factors of China's city-level carbon emissions from the perspective of spatial spillover effect. Carbon Management, 10(6), 551–566. https://doi.org/10.1080/17583004.2019.1676096 [Google Scholar] [CrossRef]
31. Yuan, Y., Cai, F., Yang, L. L. (2020). Renewable energy investment under carbon emission regulations. Sustainability, 12(17), 6879. https://doi.org/10.3390/su12176879 [Google Scholar] [CrossRef]
32. Pei, Y., Zhu, Y. M., Wang, N. A. (2021). How do corruption and energy efficiency affect the carbon emission performance of China's industrial sectors? Environmental Science and Pollution Research, 28(24), 31403–31420. https://doi.org/10.1007/s11356-021-13032-3 [Google Scholar] [PubMed] [CrossRef]
33. Yu, D. W., Tan, H. W. (2016). Application of ‘potential carbon’ in energy planning with carbon emission constraints. Applied Energy, 169(1), 363–369. https://doi.org/10.1016/j.apenergy.2016.01.127 [Google Scholar] [CrossRef]
34. Renugadevi, T., Geetha, K., Muthukumar, K., Geem, Z. W. (2020). Optimized energy cost and carbon emission-aware virtual machine allocation in sustainable data centers. Sustainability, 12(16), 6383. https://doi.org/10.3390/su12166383 [Google Scholar] [CrossRef]
35. Kneifel, J. (2010). Life-cycle carbon and cost analysis of energy efficiency measures in new commercial buildings. Energy and Buildings, 42(3), 333–340. https://doi.org/10.1016/j.enbuild.2009.09.011 [Google Scholar] [CrossRef]
36. ECO-PARK S-G (2014). The energy planning of Qingdao Sino German Eco-Park. https://max.book118.com/html/2017/0924/134914961.shtm [Google Scholar]
37. Louwen, A., van Sark, W. G. J. H. M., Faaij, A. P. C., Schropp, R. E. I. (2016). Re-assessment of net energy production and greenhouse gas emissions avoidance after 40 years of photovoltaics development. Nature Communications, 7(1), 1–9. https://doi.org/10.1038/ncomms13728 [Google Scholar] [PubMed] [CrossRef]
38. Skanderova, L., Fabian, T. (2017). Differential evolution dynamics analysis by complex networks. Soft Computing, 21(7), 1817–1831. https://doi.org/10.1007/s00500-015-1883-2 [Google Scholar] [CrossRef]
39. Tvrdik, J. (2009). Adaptation in differential evolution: A numerical comparison. Applied Soft Computing, 9(3), 1149–1155. https://doi.org/10.1016/j.asoc.2009.02.010 [Google Scholar] [CrossRef]
Cite This Article
 Copyright © 2023 The Author(s). Published by Tech Science Press.
This work is licensed under a Creative Commons Attribution 4.0 International License , which permits unrestricted use, distribution, and reproduction in any medium, provided the original work is properly cited.
 Downloads
 Citation Tools