
 Submit a Paper
 Propose a Special lssue
 Open Access
ARTICLE

Correlation Analysis of Wind Turbine Temperature Rise and Exergy Efficiency Based on Field-Path Coupling
1 School of Energy and Power Engineering, Inner Mongolia University of Technology, Hohhot, 010051, China
2 Key Laboratory of Wind Energy and Solar Energy Utilization Technology, Ministry of Education, Inner Mongolia University of Technology, Hohhot, 010051, China
3 School of Civil Engineering, Inner Mongolia University of Technology, Hohhot, 010051, China
* Corresponding Author: Qiang Wang. Email:
Energy Engineering 2023, 120(7), 1603-1619. https://doi.org/10.32604/ee.2023.027074
Received 12 October 2022; Accepted 16 January 2023; Issue published 04 May 2023
 View Full Text
 Download PDF
Abstract
To solve the problems of large losses and low productivity of permanent magnet synchronous generators used in wind power systems, the field-circuit coupling method is used to accurately solve the electromagnetic field and temperature field of the generator. The loss distribution of the motor is accurately obtained by considering the influence of external circuit characteristics on its internal physical field. By mapping the losses to the corresponding part of the three-dimensional finite element model of the motor, the temperature field is solved, and the global temperature distribution of the generator, considering the influence of end windings, is obtained. By changing the air gap length, permanent magnet thickness, and winding conductivity, the relationship between the loss, temperature rise, and exergy efficiency can be obtained. By optimizing the air gap length, permanent magnet thickness, and winding conductivity, the best configuration and material properties can improve the efficiency of the motor by up to 4%.Keywords
Nomenclature
| The net exergy of the wind energy in the input system, J | |
| The exergy of the energy exergy output by unit, J | |
| The exergy losses of the generator, J | |
| Air density, kg/m3 | |
| The area swept by wind turbine rotor, m | |
| The cut in wind speed, m/s | |
| The cut out wind speed, m/s | |
| The duration of the wind (The system running time), s | |
| The DC voltage of the system, V | |
| The DC current of the system, A | |
| The ambient temperature, °C | |
| The losses of the PMSG, J | |
| The instantaneous motor temperature, °C | |
| The total generator loss, W | |
| The iron loss, W | |
| The copper loss, W | |
| The eddy current loss, W | |
| The generator output power, W | |
| The wind turbine output mechanical power, W | |
| Generator output power, W |
As wind power is dominating the development of renewable energy and deriving the national “double carbon” target of the 14th Five-Year Plan, there is an urgent need to optimize system characteristics, particularly for efficiency improvements, and to explore feasible measures [1–3]. Permanent magnet generators, a major component of wind turbines, have high losses and low efficiency owing to copper, iron, and eddy current losses. In reference [4], finite element analysis was utilized to perform no-load and load electromagnetic calculations for various generators, and the effect of temperature rise on motor efficiency was validated using the magnetic and temperature field coupling law. Reference [5] attempted to reduce the temperature rise in the motor by calculating the losses and temperature field of a brushless motor with a high-power density and by optimizing the stator slot settings to increase the system’s exergy efficiency. In reference [6], the motor losses were comparable to the heat source of the motor temperature field via the magneto-thermal coupling of the permanent magnet motor used in automobiles, and the fluid-solid coupling simulated the distribution of the motor temperature field under rated conditions. In references [7,8], field-circuit coupling and equivalent network methods were applied to calculate the temperature rise in each part of the permanent magnet generator, respectively, and the accuracy of the calculation results was analyzed by measuring the temperature of the prototype. Mehdi et al. analyzed the energy efficiency and exergy efficiency of a regional wind farm [9]. In reference [10], a geothermal power plant was investigated based on energy and energy analyses to determine the optimal temperature of the separator to achieve the maximum power of the plant.
Based on the current research situation and focusing on measures to improve exergy efficiency, this study considers the influence of external circuit variation characteristics on each field in the motor and attempts to explore the correlation between the wind power system temperature rise and exergy efficiency to obtain feasible measures to improve exergy efficiency.
2 Exergy Equilibrium Model of a Wind Power System
The structure of the wind power system is shown in Fig. 1. It includes a wind turbine, permanent magnet synchronous generator (PMSG), load, and converter. The wind turbine converts the net wind exergy absorbed by the PMSG into electrical energy exergy for the load [10].
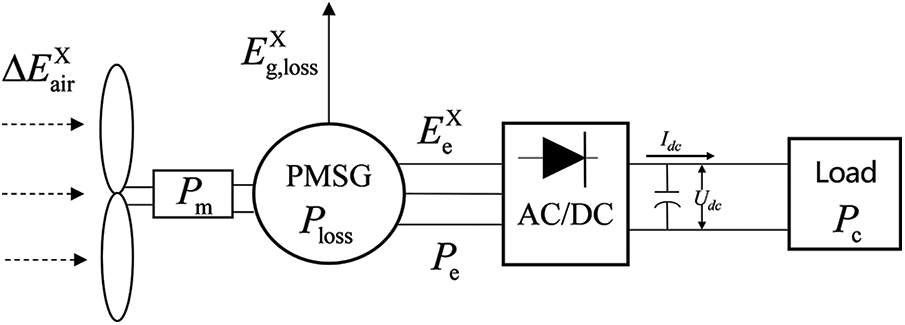
Figure 1: Exergy flow distribution of a wind power system
Copper, iron, and eddy current losses in the energy conversion process occur in the form of heat, resulting in significant irreversible losses. Therefore, in this study, exergy analysis is used to consider the “quantity” and “quality” of energy [11]. The exergy efficiency is calculated after the exergy losses are analyzed in the energy conversion process of the generator [12]. Moreover, based on the second law of thermodynamics, the equilibrium equation of cosmic exergy was established [13], as shown in the following equation:
where
In Eqs. (2) and (3),
where
where
To distinguish exergy efficiency from exergy efficiency, the energy conservation law can be used to deduce the generator energy efficiency, as shown in the following equation:
where
Exergy efficiency is a scale that reflects the actual thermal-work transformation of the system deviating from the ideal state. It can be calculated using the exergy balance conservation equation as follows:
By combining Eqs. (3), (6) and (7), the simplified exergy efficiency of the generator is given as follows:
where
3 Airfield-Circuit Coupling Simulation of Permanent Magnet Synchronous Power Generation
Currently, the main methods for calculating the temperature rise of a motor are numerical analysis and the finite element method [14,15]. The finite element method is divided into single-field and coupled calculations. In single-field calculations, the motor electromagnetic field and temperature field are calculated separately. First, the motor losses are calculated using the magnetic field. Next, based on the calculation results of the loss value, it was proportionally assigned to each part of the motor to obtain the loss density. Finally, the resulting loss density is loaded into the corresponding component of the temperature field as a heat source. However, the finite element method ignores the effect of the external circuit on the electromagnetic field. The coupling calculation method is used to transfer the correlation information between the electromagnetic field and the external circuit to each other, considering the motor operating process and the influence of load changes on each field and the losses of the generator. To obtain the losses in the electromagnetic field calculation as the temperature field heat source, its coupling accuracy is higher.
3.1 Field-Path Coupling Simulation Process and Model
This study utilizes the field-circuit coupling method to calculate and analyze the dynamic temperature rise in the PMSG. Fig. 2 shows the flow of the field-circuit coupling calculation, which determines the motor temperature rise by feeding back information from the external circuit and magnetic field.
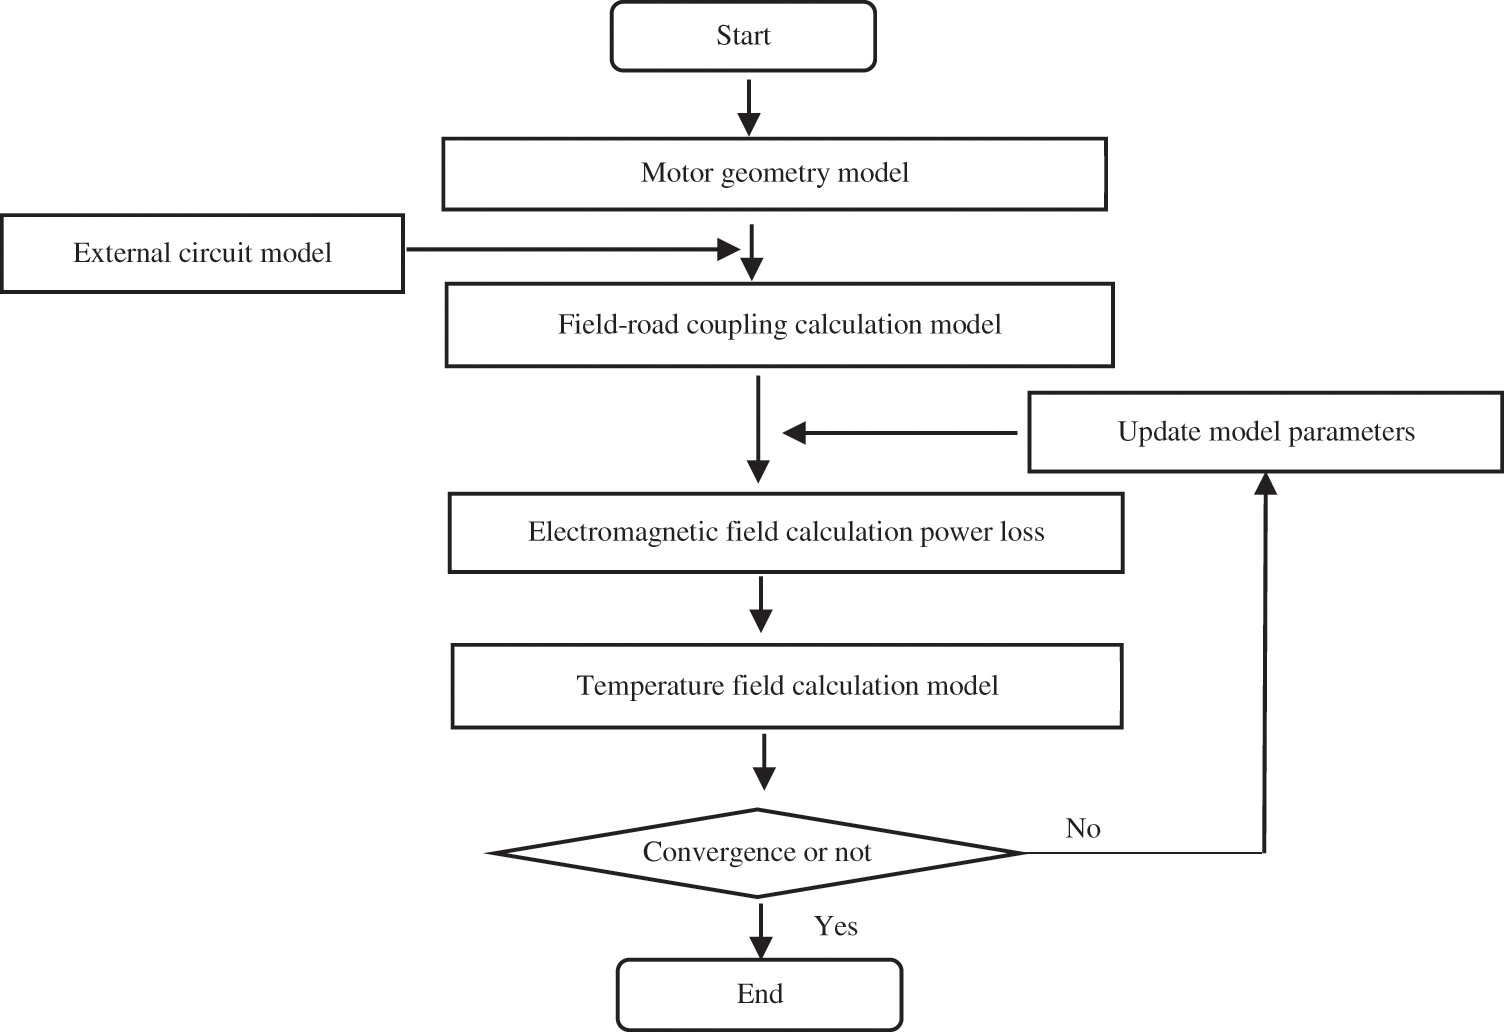
Figure 2: Calculation flow of field-path coupling
The field-circuit coupling calculation is performed using the following five steps:
(1) Set up the simulation model using Maxwell software. Based on the known parameters, complete the boundary condition setting, add excitation, divide the mesh, set up the solver, and so on.
(2) Set the excitation source of the Maxwell 2D model to external circuit excitation, and import the motor model into the Simplorer software to establish the field-circuit coupling model.
(3) Solve for the energy losses of the generator using coupled circuit-electromagnetic field analysis.
(4) Load the energy losses as a heat source into the temperature field model, and solve for the steady-state and transient temperature rise characteristics of the motor.
(5) Determine whether convergence is achieved by comparing the temperature difference before and after iterations.
In the field-circuit coupling model, the drive of the motor is provided by an external circuit; therefore, it is necessary to establish a connection between the motor’s electromagnetic field and the main circuit. Maxwell software has an interface setup for joint simulation with Simplorer. After completing the PM motor modeling process, the motor model is set to a state in which it can be connected to an external circuit. Additionally, the external circuit model is set up in the Simplorer software to build the PM motor field-circuit coupling model, as shown in Fig. 3.
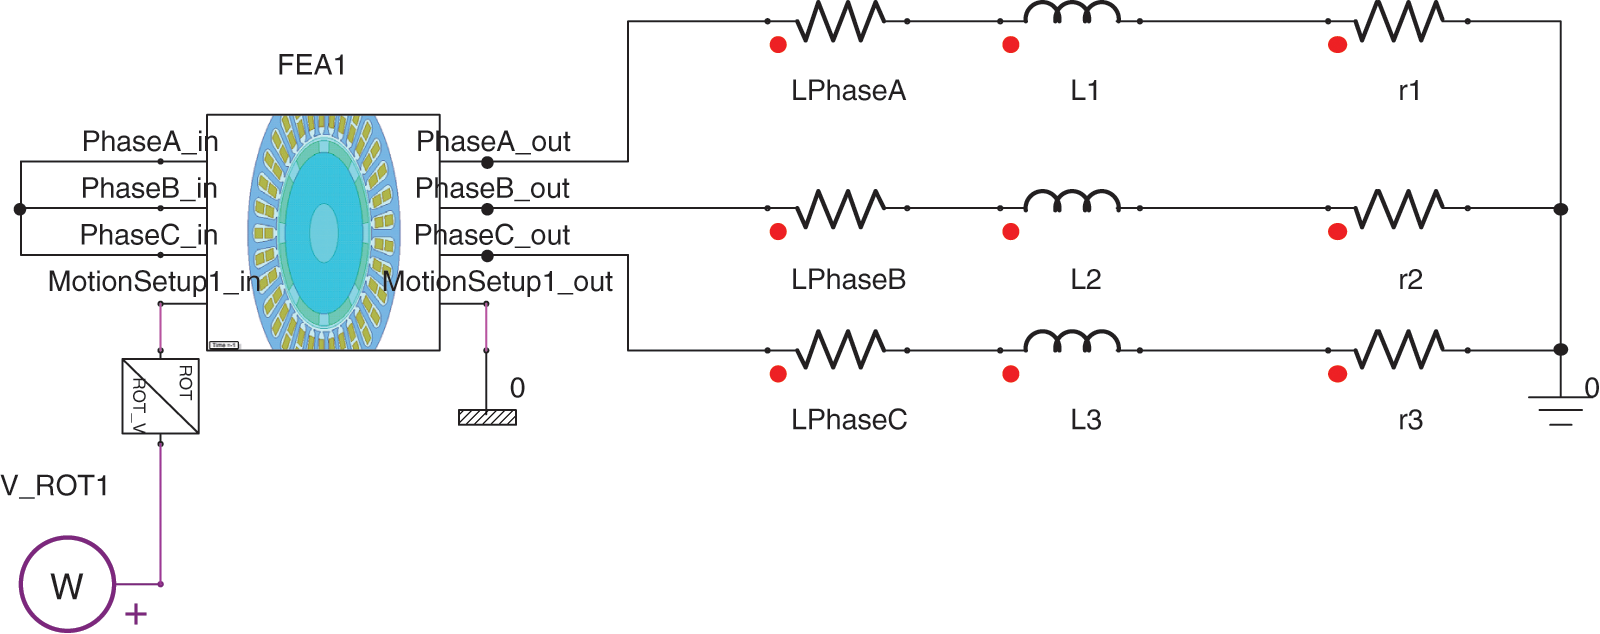
Figure 3: Simulation model of field-path coupling
In this study, a two-dimensional electromagnetic field model is used, and the motor end windings are not modeled. Therefore, resistance and inductance equivalent motor stator end effects are used. In Fig. 3, L1, L2, and L3 are the three-phase winding end leakage inductances; LPhaseA, LPhaseB, and LPhaseC are the phase winding coil equivalent resistances; and r1, r2, and r3 are the three-phase loads. The model is more accurate when building an external circuit by considering the motor end effects in terms of equivalent resistance and inductance.
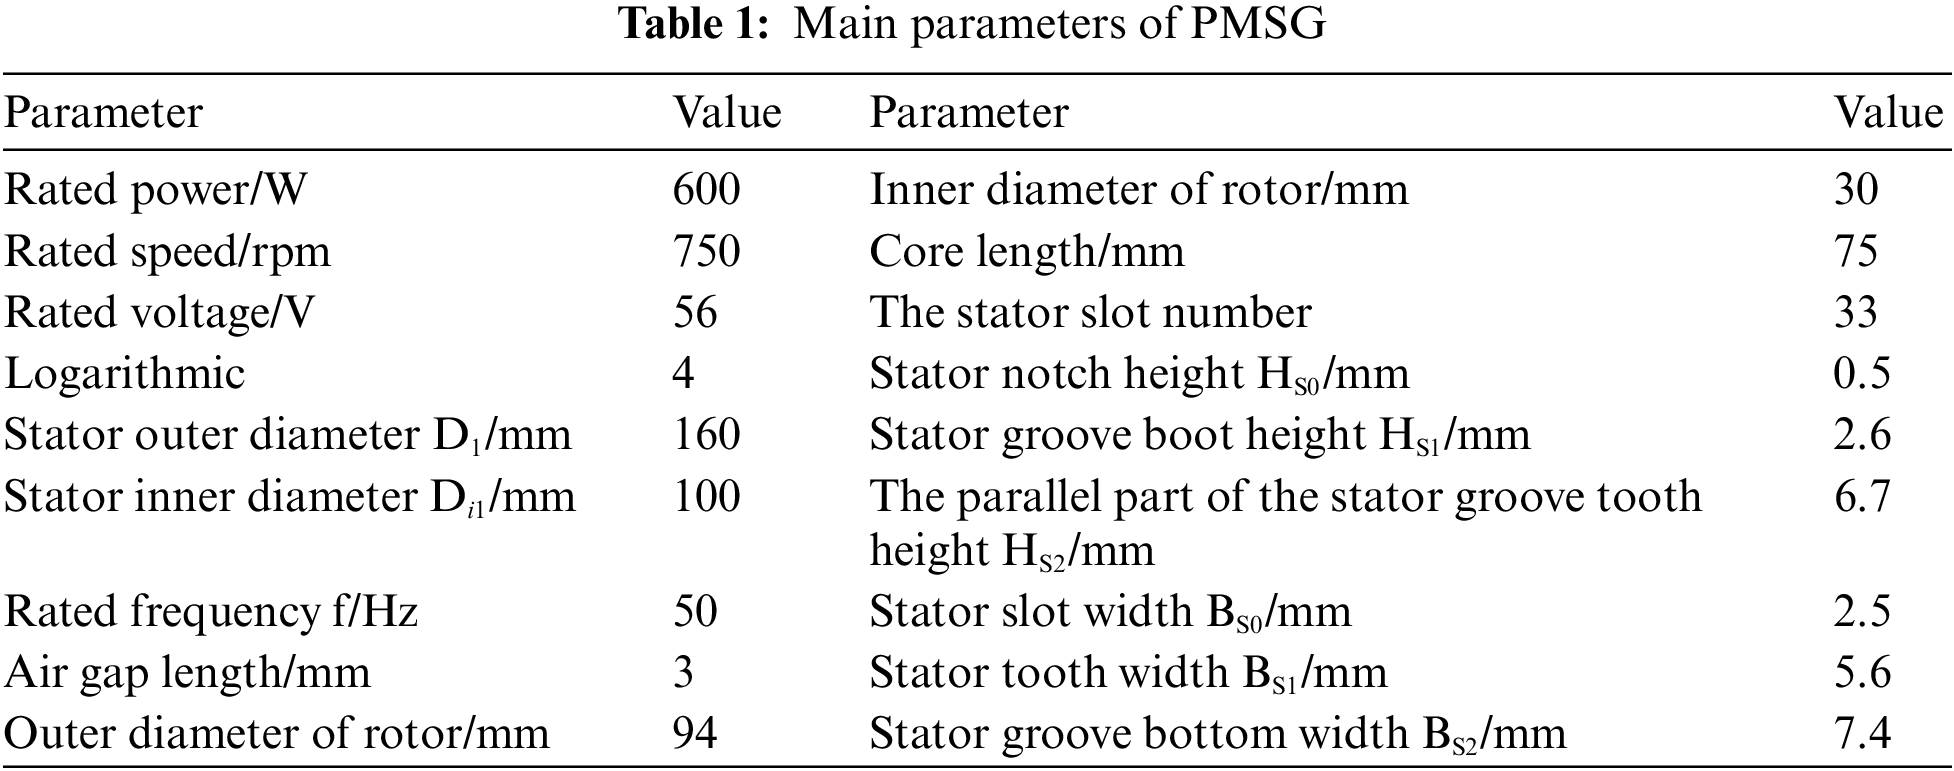
In this study, a PMSG with rated power and speed of 600 W and 750 rpm, respectively, is used as the object of study. A three-dimensional finite element model of the motor and a slot wedge model are established using Maxwell software. The mesh for the finite element solution of the motor is set up to ensure the accuracy of the simulation and the accuracy of the calculation results, and the stator teeth and air gap mesh are encrypted and dissected. The main parameters of the PMSG are shown in Table 1.
4 Analysis of the Simulation Results
4.1 Analysis of Electromagnetic Field Simulation Results
The magnetic field of the motor is simulated by applying the field-circuit coupling method, and the two-dimensional magnetic density cloud of the motor is obtained, as illustrated in Fig. 4. Compared with the uncoupled magnetic density distribution of the motor shown in Fig. 5, the maximum magnetic density of the motor teeth before coupling is 1.7 T, and the maximum value of the yoke is 1.7 T. The magnetic density is approximately 1.5 T, the maximum magnetic density of the motor teeth after coupling is approximately 1.63 T, and the maximum magnetic density of the yoke is approximately 1.3 T.
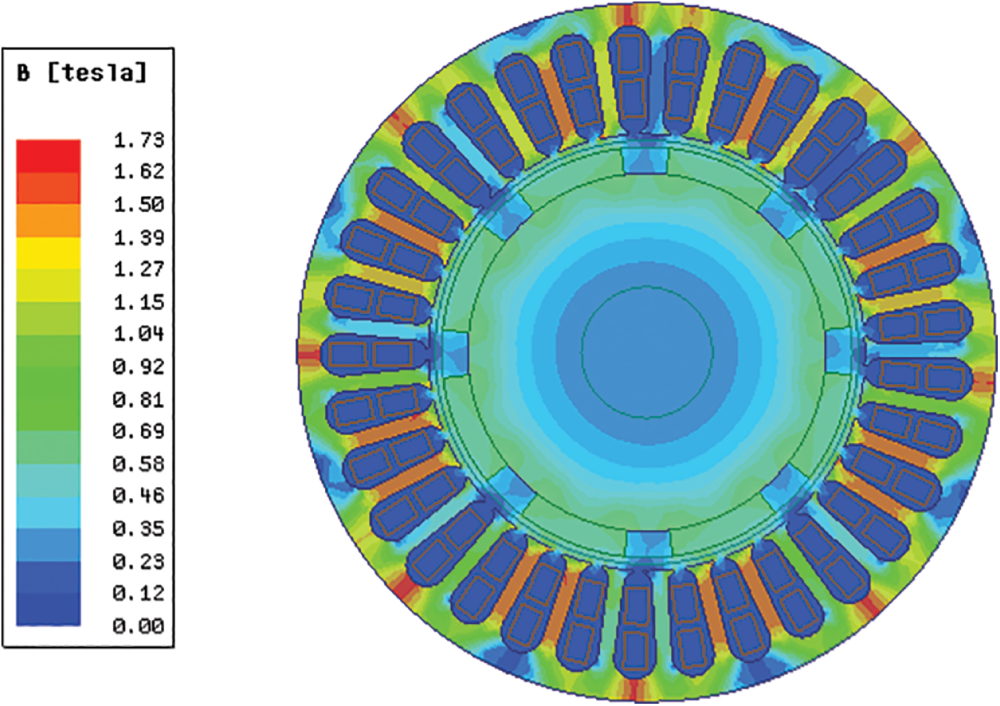
Figure 4: Magnetic dense cloud diagram before coupling
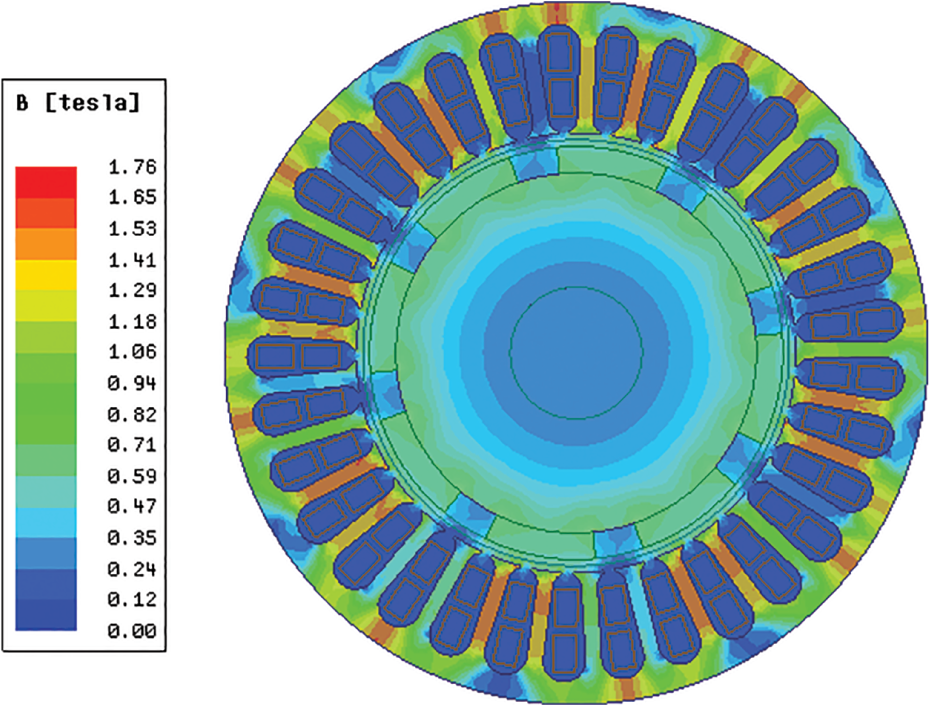
Figure 5: Magnetic dense cloud diagram after coupling
Figs. 6 and 7 show the radial magnetic density distribution along the circumferential direction at various positions of the air gap before and after coupling, respectively, where r denotes the distance between the center of the rotor shaft and different positions in the radial direction of the motor. Additionally, r = 47 mm is the distance between the surface of the permanent magnet and the center of the rotating shaft, and r = 50 mm is the distance between the stator tooth and the center of the rotor shaft.
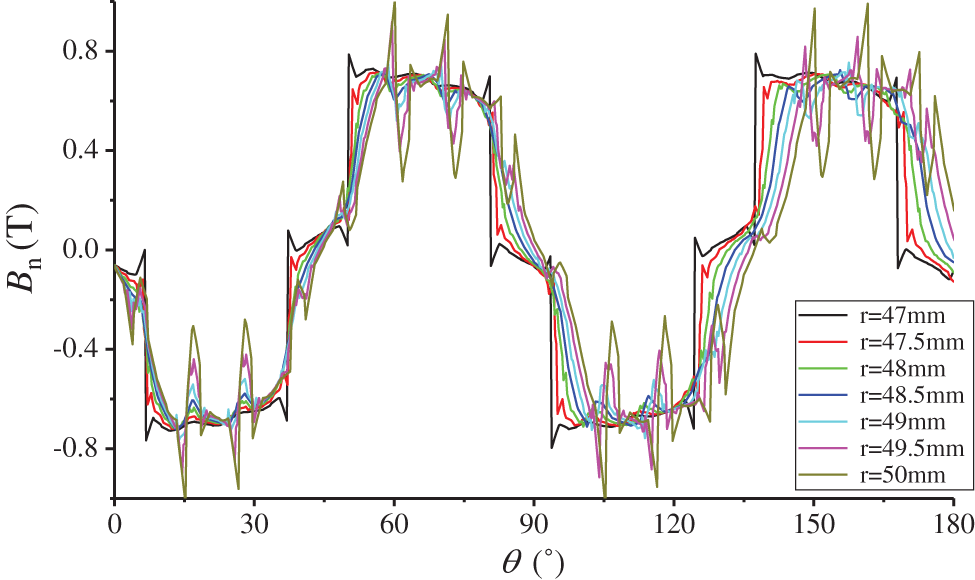
Figure 6: Radial flux at different positions of air gap before coupling
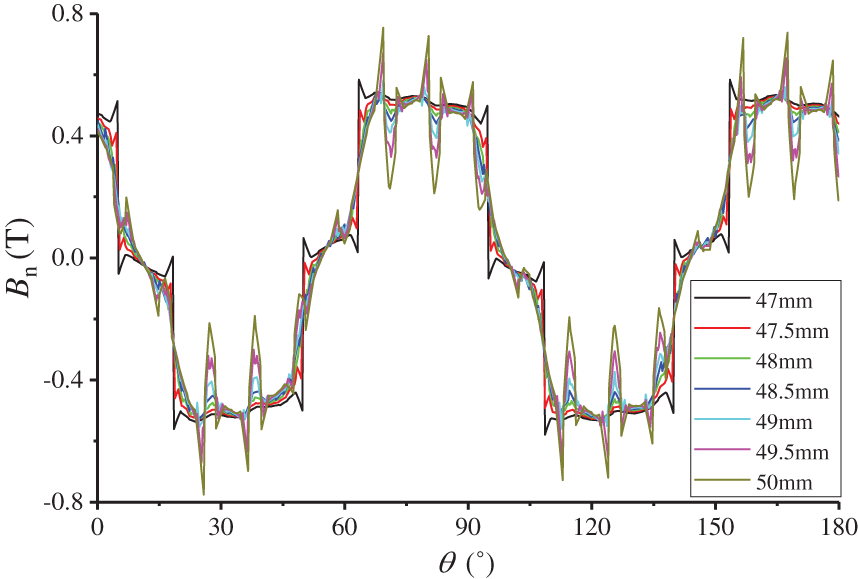
Figure 7: Radial flux at different positions of the coupled air gap
Comparing the magnetic density waveforms at different positions of the air gap before and after coupling, as depicted in Figs. 6 and 7, it can be observed that the magnetic density waveforms before and after coupling are close to the sinusoidal variation trend, and the waveform distortion is more significant at r = 47 mm and r = 50 mm. This is because the magnetic permeability of the ferromagnetic material is greater than that of the air, and the slotted stator slot makes the magnetic resistance distribution near the stator slot and the surface of the permanent magnet uneven, which in turn causes the surface radial magnetic density to fluctuate violently.
In addition, the phase angle of the output flux density waveform of the coupling model is shifted by approximately 11.5°; the maximum radial flux density Bn after coupling becomes approximately 0.78 T, which is approximately 0.22 T lower than before coupling. This is because the field-circuit coupling, cogging effect, and demagnetization of the permanent magnet are intensified, resulting in significant distortion of the air-gap magnetic field, which in turn affects the air-gap magnetic density distribution. However, the magnetic field at the air gap is generated by the combined action of the main magnetic field and the armature composite magnetic field. Because of the dynamic characteristics of the external circuit, the armature reaction is intensified, causing the armature composite magnetic field to have a more significant effect and a larger offset angle.
The air gap is where the motor energy is converted, and the harmonic content of the air gap magnetic density directly affects its output. Fourier decomposition of the magnetic densities at different positions in the air gap before and after coupling is performed, as shown in Fig. 8.
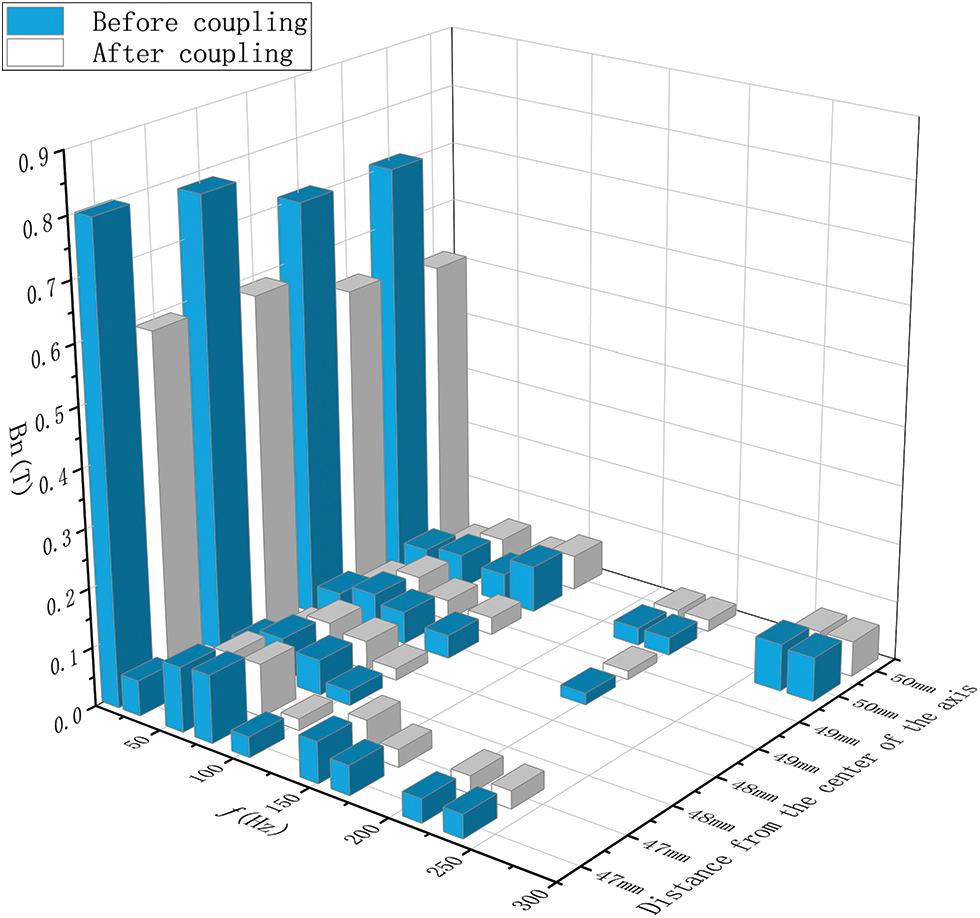
Figure 8: Frequency distribution at different positions before and after coupling
It can be observed from the Fourier analysis results that as the distance from the center of the rotating shaft increases, the spatial high-order harmonic content first decreases and then increases, and the Bn fundamental frequency component gradually decreases. As shown in Fig. 8, the Bn fundamental frequency component on the surface of the permanent magnet is the largest, 0.8 before coupling and 0.59 after coupling, decreasing by approximately 26.3% after coupling. The Bn fundamental frequency component on the top of the stator teeth is the smallest, 0.71 before coupling and 0.51 after coupling, decreasing by approximately 28.2% after coupling. This is because of the rotation of the magnetic field and the field-circuit coupling effect, which are some of the magnetic field lines that flow to the air gap, and the magnetic flux leakage occurs. In addition, owing to the feedback effect of the dynamic characteristics of the external circuit, the magnetic flux leakage phenomenon is aggravated, thereby increasing the amplitude of its spatial high-order harmonics, which agrees with previous analysis results.
Maxwell professional motor design software is used to calculate copper, iron, and eddy current losses, import the calculation results into the Ansys thermal analysis module in a mapping manner, and obtain the loss density cloud diagram of each component of the motor, as shown in Figs. 9–11.
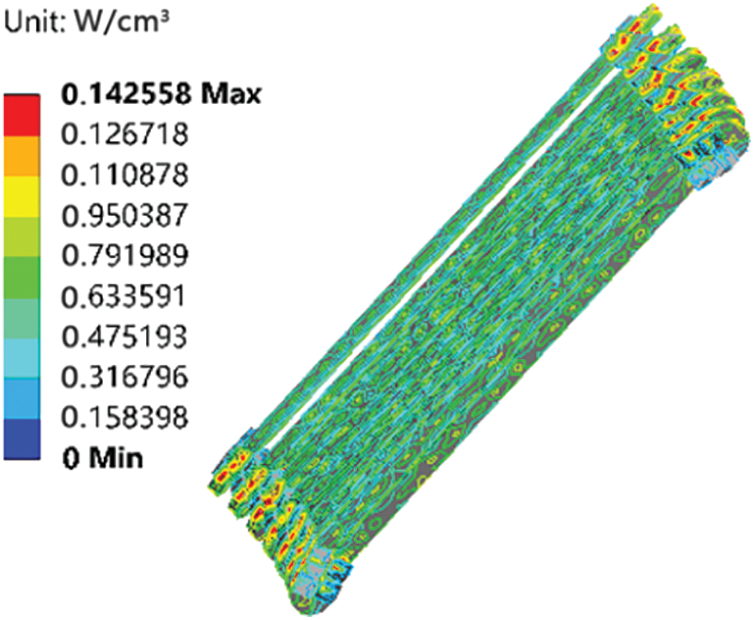
Figure 9: Cloud diagram of copper losses density of winding
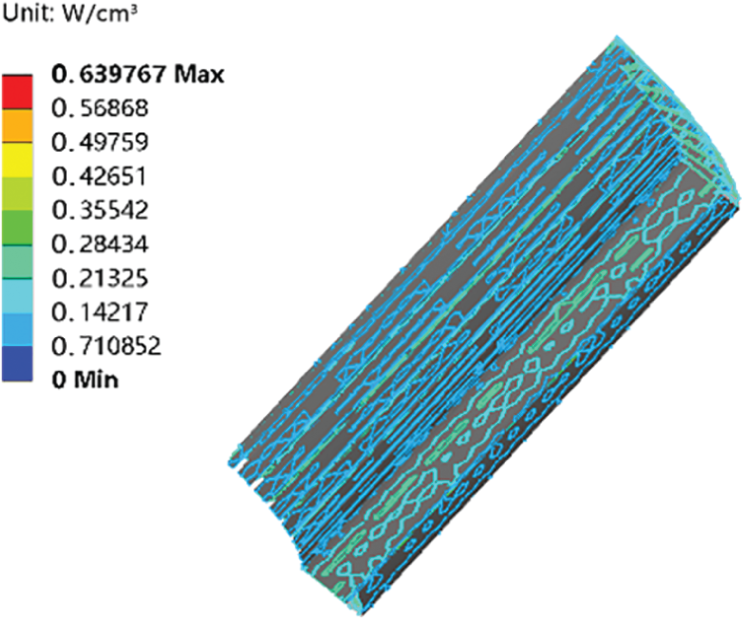
Figure 10: Cloud diagram of stator iron consumption density
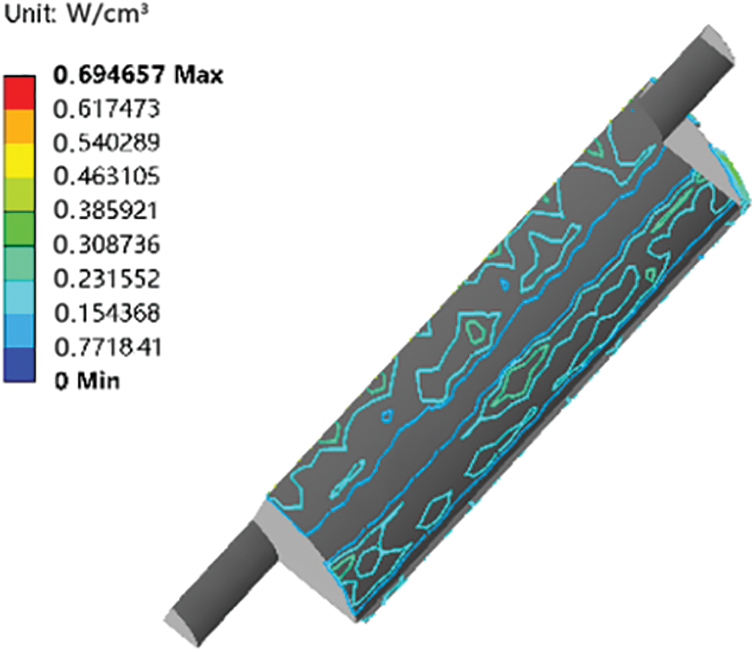
Figure 11: Cloud diagram of the eddy current loss density of a permanent magnet
As illustrated in Fig. 9, the maximum value of the copper loss density of the winding is at the end of the winding, that is, approximately 0.118635 W/cm3. However, the minimum value of 0.0998526 W/cm3 is obtained at the middle winding position. Fig. 10 depicts that the maximum iron loss density of 0.042652 W/cm3 is located in the stator teeth, while the minimum iron loss density of 0.007106 W/cm3 is located in the stator yoke. As shown in Fig. 11, the surface eddy current loss density of the permanent magnet is affected by the stator slot, which shows an alternating size distribution. The maximum eddy current loss density of 0.038592 W/cm3 is located in the stator slot, while the minimum eddy current loss density of 0.0154 W/cm3 is located in the stator tooth [16,17].
The above analysis demonstrates that the three-dimensional finite element method can analyze the axial losses of each component and solve the radial distribution of the losses of each component when calculating the losses of the permanent magnet motor, which is close to reality.
5 Correlation Analysis between Dynamic Temperature Rise and Exergy Efficiency
5.1 Generator Temperature Rise Analysis Based on the Field-Circuit Coupling Method
Generator losses are inseparable from heat, and almost all of them are dissipated as heat. To analyze the changing law of motor exergy characteristics with a temperature rise [18,19], it is necessary to first solve the dynamic temperature field of the physical model of the motor and obtain a steady-state temperature distribution cloud map for each component of the motor, as shown in Figs. 12–15.
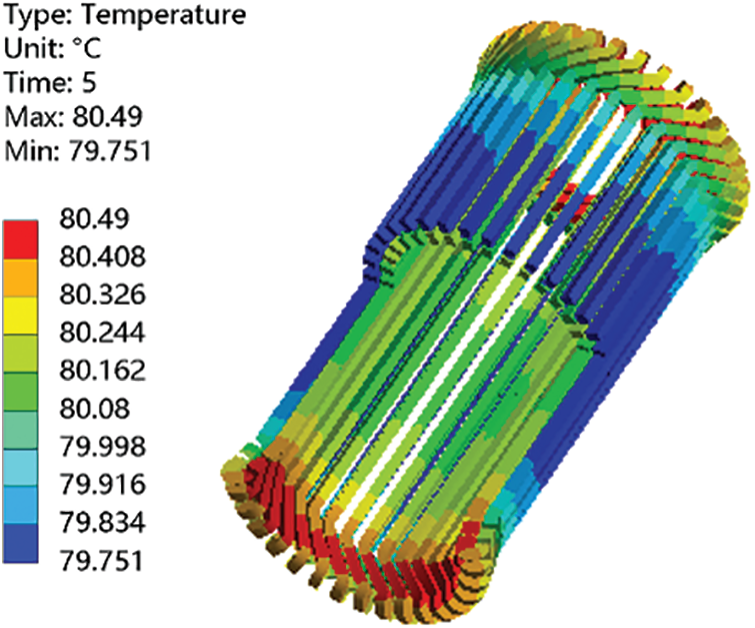
Figure 12: Cloud diagram of winding temperature distribution
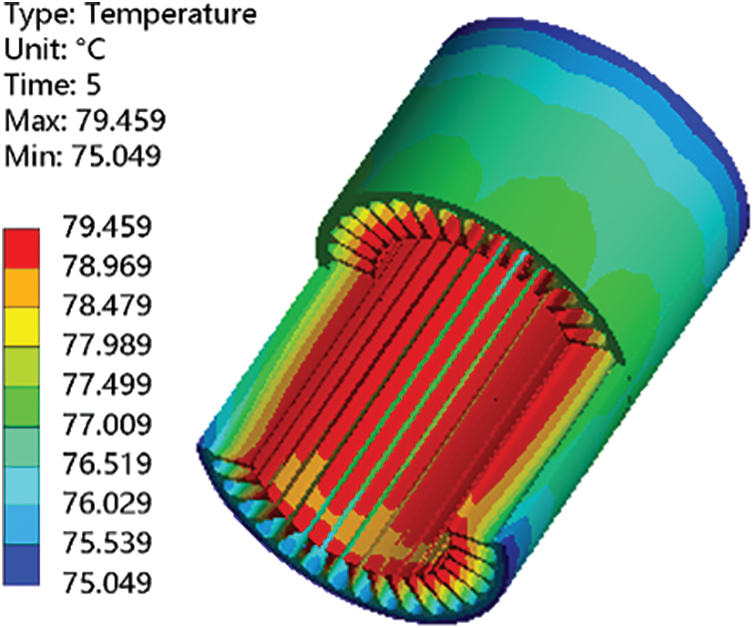
Figure 13: Cloud diagram of stator temperature distribution
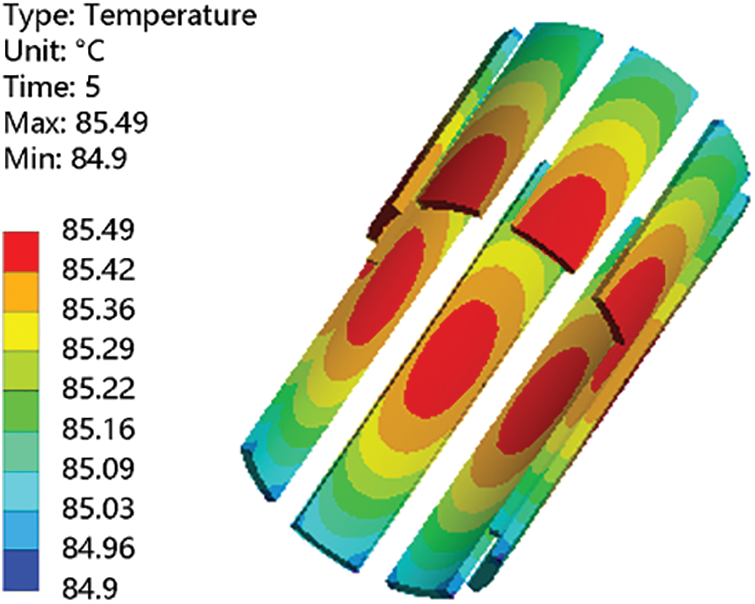
Figure 14: Cloud diagram of the temperature distribution of the permanent magnet
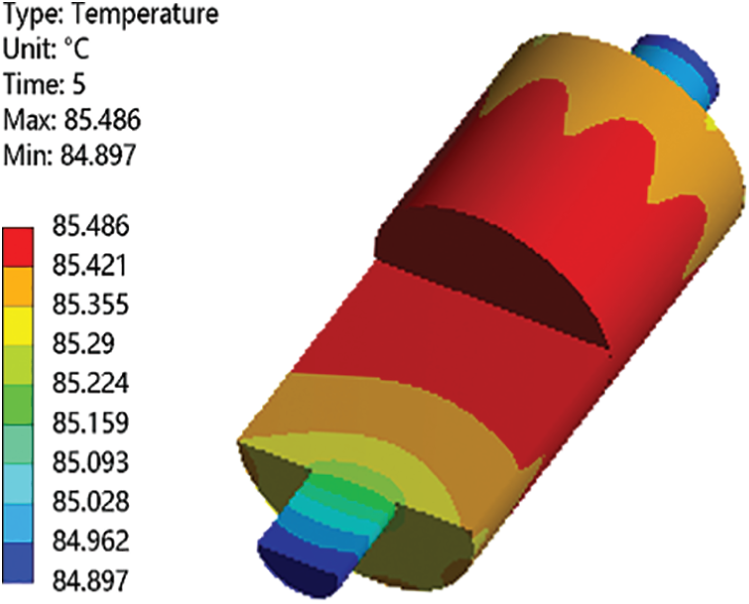
Figure 15: Cloud diagram of rotor temperature distribution
As shown in Fig. 12, the simulation results illustrate that the highest temperature rise of 80.49°C of the motor is at the end of the winding, while the lowest temperature is 79.75°C. The inner winding temperature is greater than the outer winding temperature with a maximum temperature difference of 0.74°C. This is because the outer circuit is closed and the stator winding has a large copper loss when the current passes through it, which is a major heat source in the motor. Because the thermal conductivity of the air gap is lower than that of the silicon steel sheet, the outer insulating layer of the inner winding is connected to the air gap. Moreover, the outer winding insulation layer is in direct contact with the stator core; therefore, compared with the outer winding, the inner winding has poorer heat dissipation conditions, resulting in a higher temperature. The end of the winding is in contact with the air and transfers heat through the air. However, the thermal conductivity of the air is relatively low, and the heat-transfer effect is poor. Therefore, the temperature rise of the winding is low in the middle and high at both ends.
As shown in Fig. 13, the temperature change range of the stator core is 75.05°C–79.4°C, and the maximum temperature difference is 4.35°C. The core sloth teeth exhibit the highest temperature, whereas the outer surface of the stator exhibits the lowest temperature. The winding generates more heat than the stator. Heat transfer from the winding to the stator increases the temperature of the teeth. The outer surface of the stator is closer to the motor casing, and the heat dissipates through the heat sink rib and ventilation hole table, resulting in a lower temperature.
As shown in Fig. 14, the highest temperature of the permanent magnet (85.49°C) is in the middle of the axial direction, and the lowest temperature (84.9°C) is at both ends, with a temperature difference of 0.59°C. The heat generated by the eddy current losses of the permanent magnets is mainly dissipated through the rotor and stator cores, which have poor heat dissipation effects.
As illustrated in Fig. 15, the rotor temperature distribution shows symmetry along the radial direction, with high temperatures in the middle (85.49°C) and low temperatures at both ends (84.9°C). The permanent magnets are close to the rotor, and the eddy current losses generated by the permanent magnets become a major source of heat, resulting in approximately the same temperature distribution between the rotor and permanent magnets.
Table 2 shows the temperature range of each part of the motor corresponding to basic working conditions. Fig. 16 shows that the overall temperature rise of the motor is in the range of 0°C–60°C, which meets the requirements of the highest temperature (90°C) allowed by the minimum insulation level of the motor in the national standard.
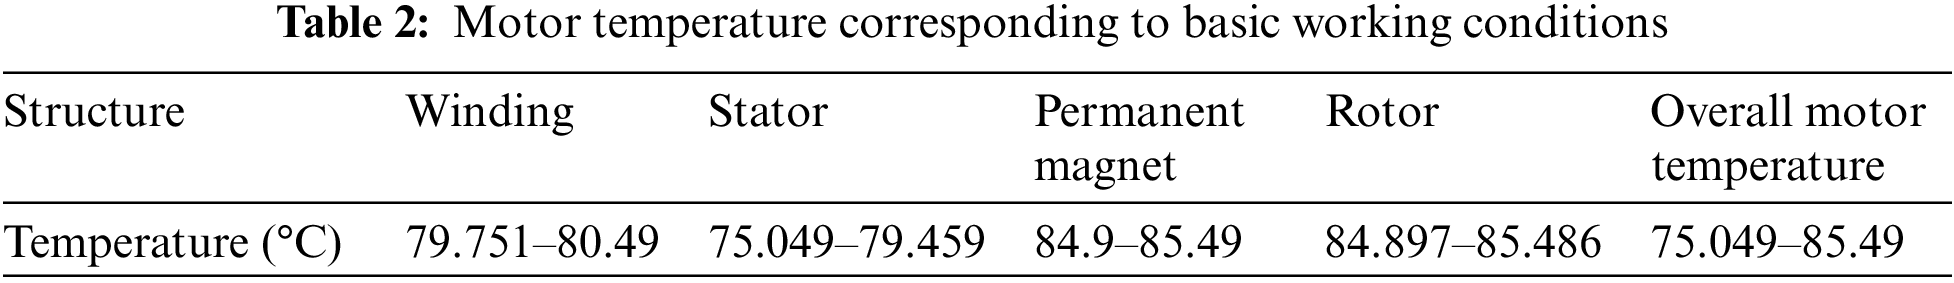
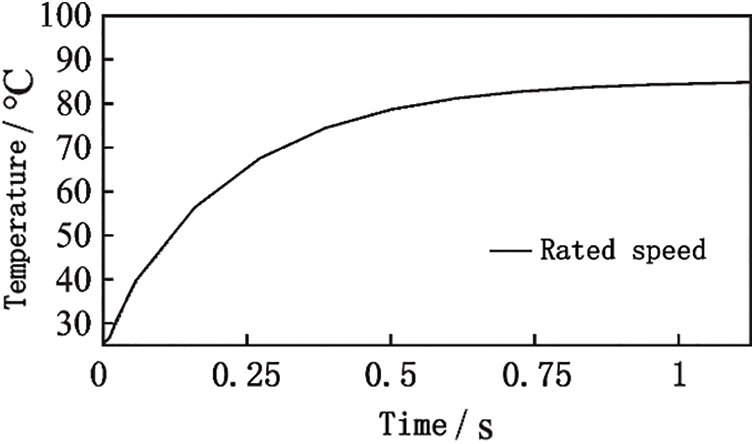
Figure 16: Motor temperature change curve corresponding to basic working conditions
5.2 Analysis of Exergy Efficiency of Generator Based on Loss Characteristics
Owing to the sensitivity of the permanent magnets and windings of the motor to temperature, the motor can work only within a certain temperature range, so the temperature rise should be fully considered in the design and use of the motor to avoid damage to the motor caused by excessive temperature. The resistivity of copper is small. When the current passes through the winding copper wire, Joule heat is generated and affected by the dynamic characteristics of the external circuit. The material properties of the motor change with temperature. As the temperature increases, the conductivity of the silicon steel sheet decreases, and the thermal resistance increases, thereby increasing its exergy losses. In addition, the thermal stability of the permanent magnet is poor, and the temperature coefficient of the permanent magnet of the NdFeB type is high. As the temperature increases, the thermal stability of the permanent magnet decreases. When it increases to a certain value, the permanent magnet is irreversibly demagnetized owing to the excessive temperature, which causes irreversible exergy losses and reduces the exergy efficiency of the motor.
As shown in Fig. 17a, as the thickness of the permanent magnet increases, the motor losses and temperature rise first decrease and then increase, whereas the opposite trend is observed for exergy efficiency. This is because when the thickness of the permanent magnet is increased, the attenuation of the alternating magnetic field inside the permanent magnet is accelerated, thereby increasing the motor losses, which ultimately decreases the exergy efficiency of the motor. Simultaneously, an increase in the thickness of the permanent magnet increases the weight of the motor rotor, leading to increased losses that are not conducive to the smooth operation of the motor [20].
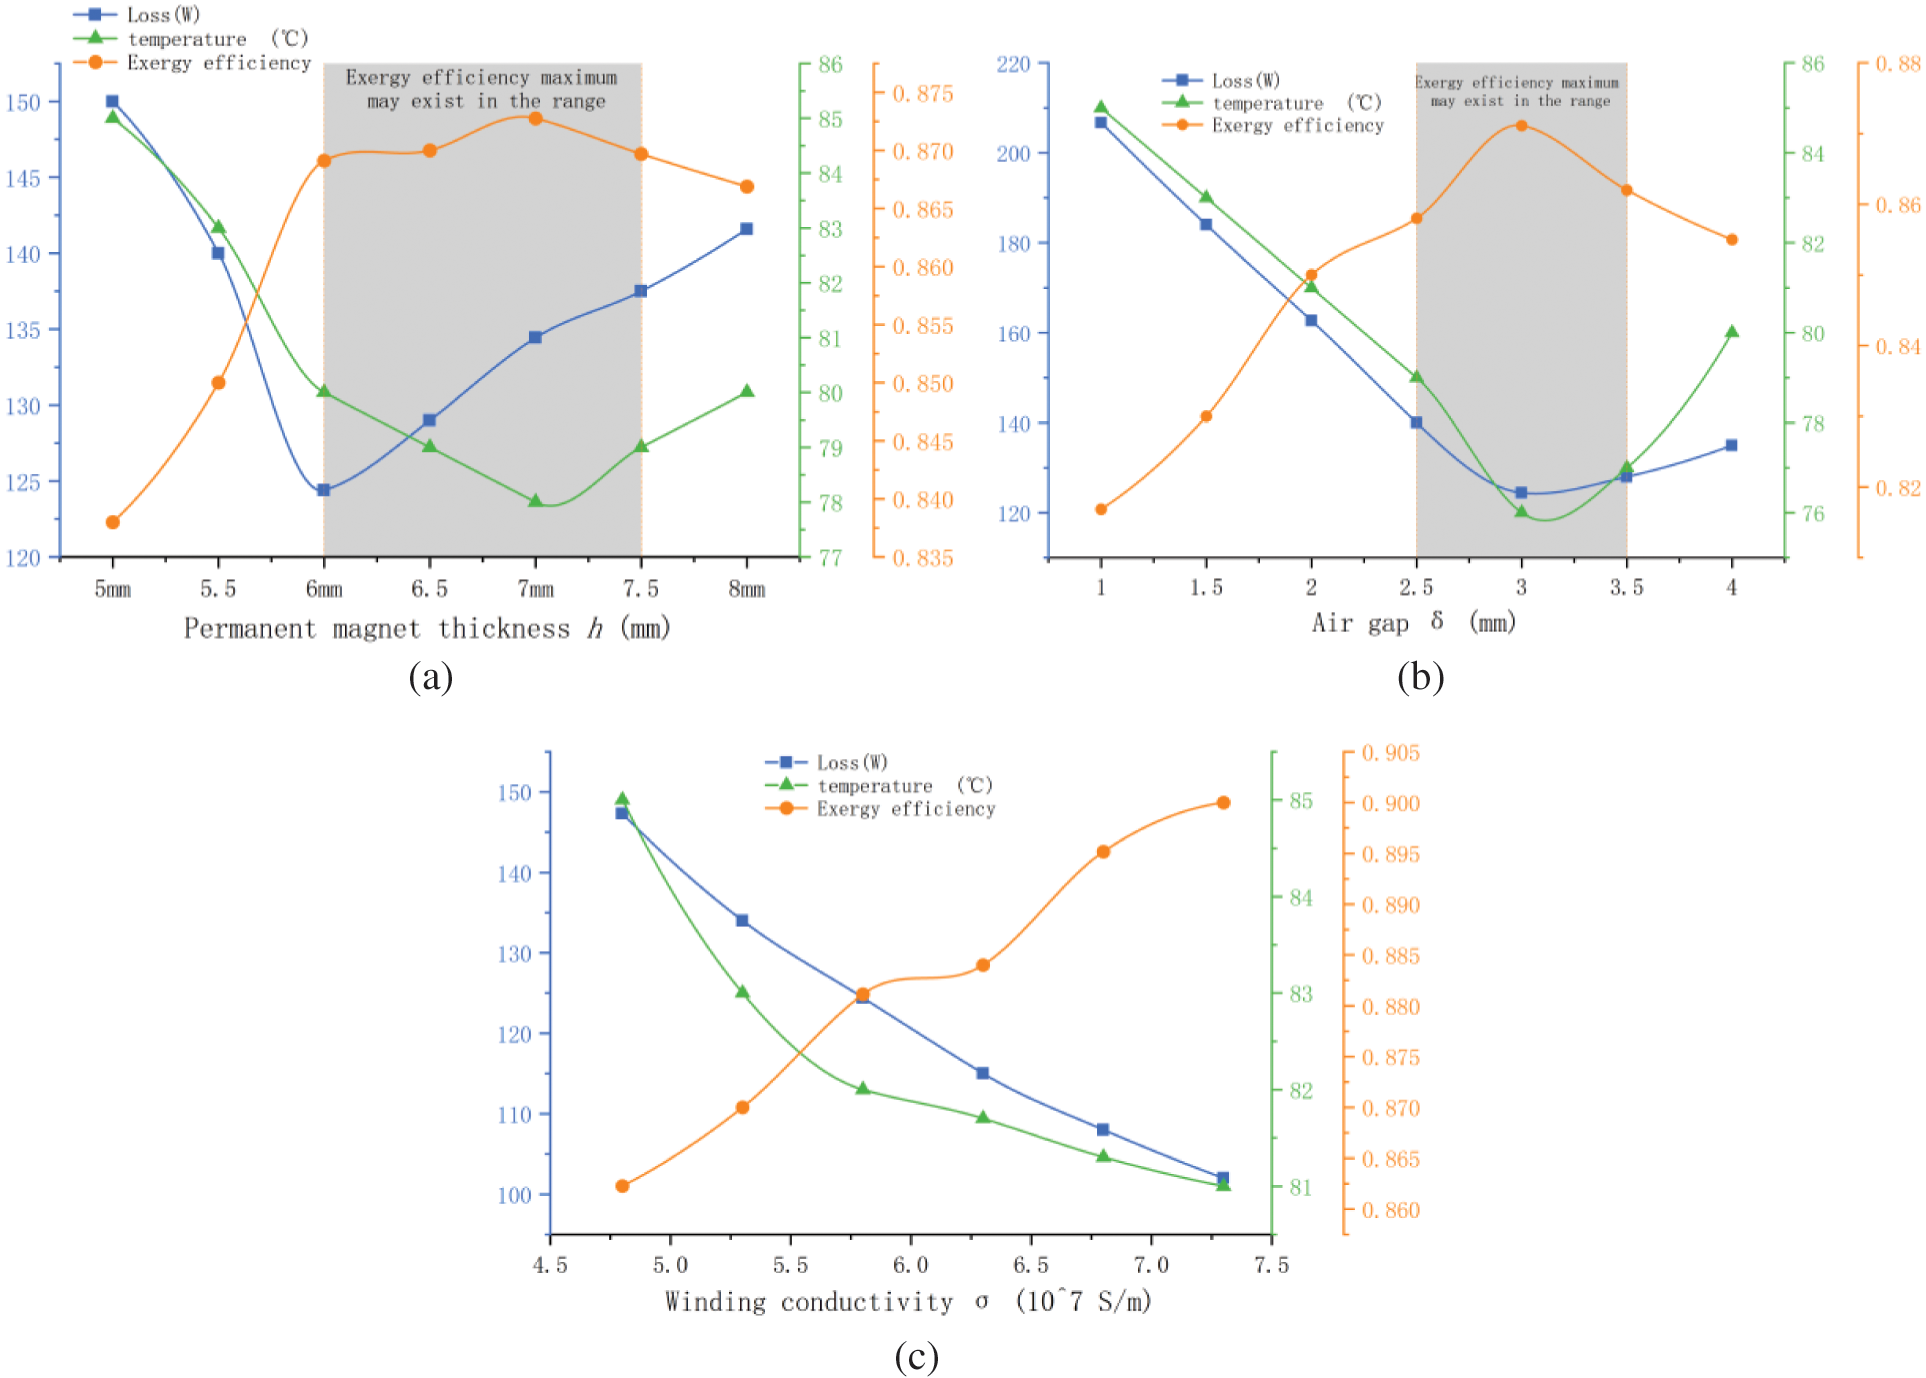
Figure 17: Relationship between permanent magnet thickness, air gap length, winding conductivity and losses, motor temperature, and exergy efficiency
As depicted in Fig. 17b, as the air gap length changes, the motor losses and temperature first decrease and then increase, and the exergy efficiency first increases and then decreases with an increase in air gap length. Increased motor losses lead to a higher temperature, which in turn leads to lower exergy efficiency. In this study, the length of the air gap is adjusted by varying the outer diameter of the rotor. Increasing the air gap length leads to decrease in the air gap magnetic density, and decrease in losses and temperature rise. According to the exergy efficiency equation, the temperature rise is inversely proportional to the exergy efficiency, thus increasing the exergy efficiency. When the air gap length increases to certain level, the motor structure is severely altered, leading to increase in losses and temperature rise, thus reducing exergy efficiency. It can be observed that a change in motor structure significantly affects exergy efficiency [21].
As illustrated in Fig. 17c, the increase in conductivity reduces the winding losses, whereas the decrease in winding losses significantly reduces the temperature rise of the motor. Based on the calculation of Eq. (8), the motor efficiency increases accordingly. However, conductivity is one of the inherent characteristics of wire materials that is difficult to change. Therefore, it is particularly important to choose winding materials in the process of motor design, and materials with high conductivity are preferred for motor windings [22].
6 Exergy Efficiency Optimization
Central composite design (CCD) is a commonly used experimental design method for response surface optimization [23]. CCD has the advantages of uniform distribution of sample points and a small sample size, and it can effectively establish the mathematical connection between design variables and evaluation indexes. To improve the efficiency of the system, it is necessary to optimize its operating conditions. Therefore, based on the CCD design method, this study determines three design variables: air gap length
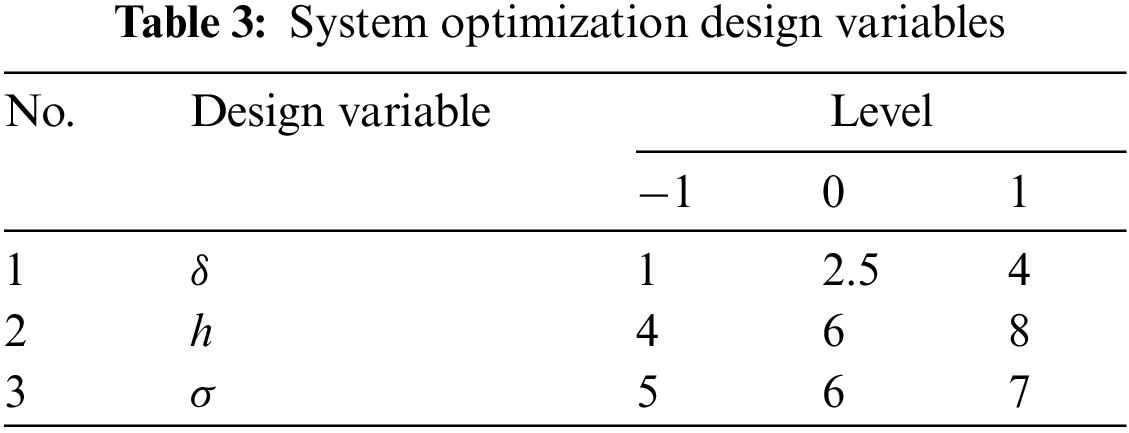
As shown in Table 3, the three levels of design variables, −1, 0, and 1, represent the low, medium, and high levels of variables, respectively. The purpose of optimization is to make the exergy efficiency
Using the response surface method, the influence of air gap length
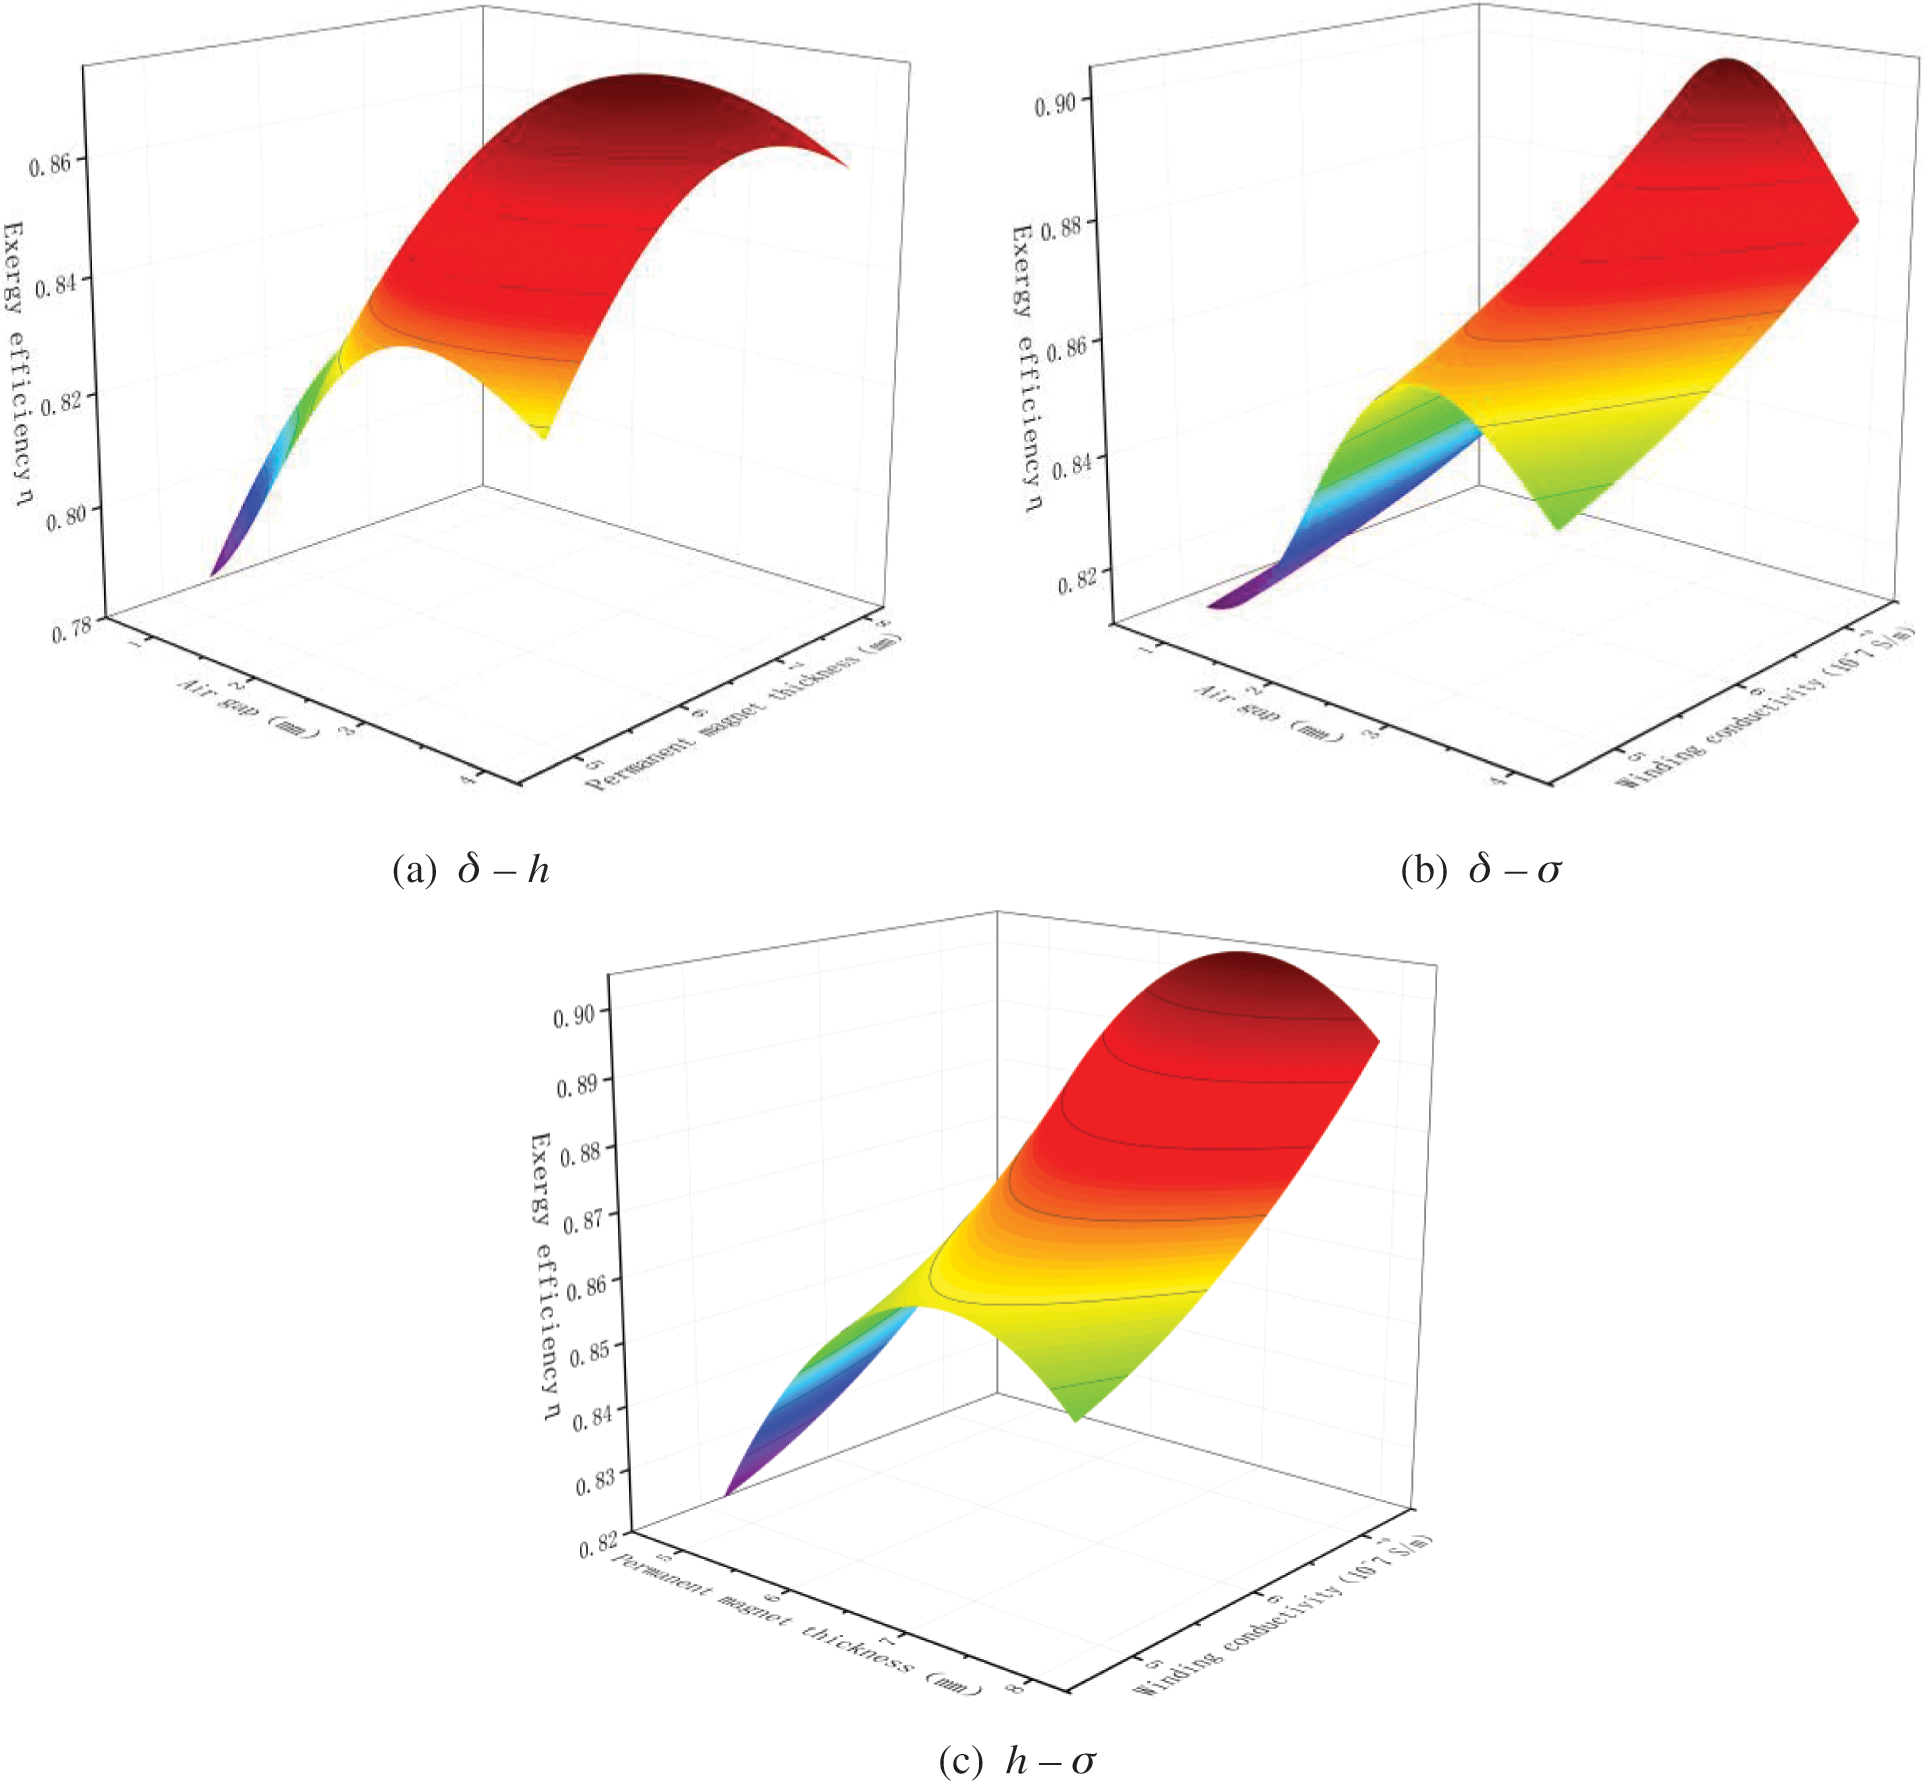
Figure 18: Exergy efficiency response surface
As depicted in Fig. 18, based on the influence of each variable on the efficiency of the motor, it is sorted as air gap length
The thickness of the permanent magnet affects the air gap flux density and then determines the copper loss and motor efficiency. As shown in Figs. 18a and 18c, the influence of the permanent magnets on the exergy efficiency first increases and then decreases. The thicker the permanent magnet, the stronger the magnetic field, and the greater the exergy efficiency. However, as the permanent magnet thickness increases, the internal magnetoresistance also increases. When the permanent magnet thickness exceeds the limit, most of the magnetic potential is consumed in the magnetoresistance and magnetic flux leakage, and the corresponding temperature rise increases, whereas the exergy efficiency decreases.
As illustrated in Figs. 18b and 18c, the increase in winding conductivity implies a decrease in resistivity, which effectively reduces the heating of winding and further reduces the exergy losses under the condition of the constant output power of the motor. However, conductivity is one of the basic characteristics of conductors, and an improvement in conductivity decreases the economy. Therefore, materials with high conductivity can be selected within the appropriate range of the economy.
Based on the response surface model, the structural parameters of the generator with maximum efficiency can be obtained. The air gap length is 3.4 mm, the permanent magnet thickness is 7.1 mm, the winding conductivity is 7.3 × 10 ^ 7 S/m, the optimized exergy efficiency reaches 0.90, and the improvement ratio reaches 4%, demonstrating that the optimization is relatively successful, limited to the contradiction between economy and high efficiency of winding materials at present, and further studies on the selection of winding materials are still needed.
In summary, when the motor operates, it produces many losses and serves as a heat source, which increases the temperature of the motor. Consequently, this study provides two solutions for improving the motor efficiency:
Scheme 1: Improving the type of motor can result in a good heat dissipation environment and avoid the high–temperature demagnetization of the permanent magnet.
Scheme 2: Design a high-performance motor, that is, select high-performance materials, including winding permanent magnet materials and silicon steel sheets.
Based on the finite element method, a dynamic field-circuit coupling model of the generator is established, and the influence of the coupling effect on the generator efficiency is analyzed. The specific conclusions are as follows:
1. The magnetic field of the motor is affected by the field-circuit coupling effect, and the air gap magnetic field is distorted. Specifically, before coupling, the maximum magnetic density of the motor teeth is 1.7 T, and the maximum magnetic density of the yoke is approximately 1.5 T. After coupling, the maximum magnetic density of the motor teeth is approximately 1.63 T, and the maximum magnetic density of the yoke is approximately 1.3 T.
2. Because of the effect of magnetic field rotation and field-circuit coupling, some of the magnetic field lines flow to the air gap, resulting in magnetic flux leakage. As the distance from the center of the rotating shaft increases, the spatial high-order harmonic content first decreases and then increases, while the fundamental frequency component of Bn gradually decreases. The fundamental frequency component of Bn on the surface of the permanent magnet is the largest, 0.8 before coupling and 0.59 after coupling, and its decrease is approximately 26.3% before and after coupling. The fundamental frequency component of Bn at the top of the stator teeth is the smallest, 0.71 before coupling and 0.51 after coupling, with a decrease of approximately 28.2%.
3. The maximum copper consumption density is observed at the end of the winding, and the minimum is observed in the middle of the winding. The maximum iron loss density is located at the stator tooth, and the minimum iron loss density is located at the stator yoke. The eddy current loss density on the surface of the permanent magnet is alternately distributed by the stator slot. The eddy current loss density on the surface of the permanent magnet opposite the stator slot is higher, whereas the eddy current loss on the surface of the permanent magnet opposite the stator tooth is smaller. The temperature rise distribution of each structure is the same as the loss density distribution.
4. When the motor runs, it produces many losses and acts as a heat source, which causes the motor temperature rise. By optimizing the air gap length, permanent magnet thickness, and winding conductivity, it is beneficial to solve the problems of heat generation and heat dissipation of the motor, and the exergy efficiency improvement ratio after optimization reaches 4%.
5. Exergy efficiency is affected by many factors; therefore, it should be evaluated from many angles and analyzed based on many factors in the process of exergy efficiency optimization.
Funding Statement: This work was supported by the National Natural Science Foundation of China (Nos. 51966013, 52066013) and the Special Fund of Inner Mongolia Education Department (No. STZC202230).
Conflicts of Interest: The authors declare that they have no conflicts of interest to report regarding the present study.
References
1. Tang, W., Xu, Z., Shan, B., Zhang, Y., Wu, P. et al. (2021). Electric energy substitution planning for the “14th five-year plan” period based on characteristics of energy consumption structure of subdivided industries. Electric Power, 54(7), 36–45. [Google Scholar]
2. Wang, W. H. (2021). Analysis of economic and environmental benefits of wind power projects. Science and Technology and Economics Guide, 29(24), 161–162. [Google Scholar]
3. Dai, J. C., Yang, X., Wen, L. (2018). Development of wind power industry in China: A comprehensive assessment. Renewable & Sustainable Energy Reviews, 97, 156–164. https://doi.org/10.1016/j.rser.2018.08.044 [Google Scholar] [CrossRef]
4. Zhai, L. X., Sun, J. J., Ma, X., Han, W. T., Luo, X. S. (2019). Thermal-structure coupling analysis and multi-objective optimization of motor rotor in MSPMSM. Chinese Journal of Aeronautics, 32(7), 1733–1747. https://doi.org/10.1016/j.cja.2018.09.008 [Google Scholar] [CrossRef]
5. Xie, Y., Li, Z., Guo, J. (2020). Design and research on high power density induction motor in electric vehicle. Electric Machines and Control, 24(2), 46–54. [Google Scholar]
6. Shen, Q., Chen, X., Wang, D., Han, L., Long, Y. (2021). Design and analysis of wide-area and high-efficiency axial flux permanent magnet synchronous machine for EVs. Electric Machines and Control, 25(3), 56–66. [Google Scholar]
7. Fang, H. Y., Li, D. W., Qu, R. H., Li, J., Wang, C. et al. (2019). Rotor design and eddy-current loss suppression for high-speed machines with a solid-PM rotor. IEEE Transactions on Industry Applications, 55(1), 448–457. https://doi.org/10.1109/TIA.2018.2871095 [Google Scholar] [CrossRef]
8. Song, S., Hu, M., Du, Y., Zuo, H., Zhang, F. (2020). Temperature field investigation of remanufacturing motor with mixed stator core. Electric Machines and Control, 24(6), 33–42. [Google Scholar]
9. Ehyaei, M. A., Assad, M. E. H. (2021). Energy and exergy analyses of wind turbines. In: Design and performance optimization of renewable energy systems, pp. 195–203. Netherlands: Elsevier. [Google Scholar]
10. Assad, M. E. H., Aryanfar, Y., Radman, S., Yousef, B., Pakatchian, M. (2021). Energy and exergy analyses of single flash geothermal power plant at optimum separator temperature. International Journal of Low-Carbon Technologies, 16(3), 873–881. https://doi.org/10.1093/ijlct/ctab014 [Google Scholar] [CrossRef]
11. Ahmadi, A., Das, B., Ehyaei, M. A., Esmaeilion, F., Assad, M. E. H. et al. (2021). Energy, exergy, and techno-economic performance analyses of solar dryers for agro products: A comprehensive review. Solar Energy, 228(1), 349–373. https://doi.org/10.1016/j.solener.2021.09.060 [Google Scholar] [CrossRef]
12. Tahir, M. F., Haoyong, C., Guangze, H., Mehmood, K. (2022). Energy and exergy analysis of wind power plant: A case study of Gharo. Pakistan Frontiers in Energy Research, 10, 12. https://doi.org/10.3389/fenrg.2022.1008989 [Google Scholar] [CrossRef]
13. Assad, M. E. H., Aryanfar, Y., Javaherian, A., Khosravi, A., Aghaei, K. (2021). Energy, exergy, economic and exergoenvironmental analyses of transcritical CO2 cycle powered by single flash geothermal power plant. International Journal of Low-Carbon Technologies, 16(4), 1504–1518. https://doi.org/10.1093/ijlct/ctab076 [Google Scholar] [CrossRef]
14. Naskar, A. K., Sarkar, D. (2014). Numerical analysis of three dimensional steady state heat conduction in the rotor of an induction motor by finite element method. 2014 International Conference on Control, Instrumentation, Energy & Communication, pp. 686–690. India, Kolkata. [Google Scholar]
15. Wang, X., Jia, Z., Gao, P. (2014). Coupled electromagnetic-thermal field analysis of out-rotor in-wheel motor. Journal of Tianjin University, 47(10), 898–902. [Google Scholar]
16. Tao, D., Zhou, K., Lv, F., Dou, Q., Wu, J. et al. (2020). Magnetic field characteristics and stator core losses of high-speed permanent magnet synchronous motors. Energies, 13(3), 15. https://doi.org/10.3390/en13030535 [Google Scholar] [CrossRef]
17. Lee, J. H., Sung, S., Cho, H. W., Choi, J. Y., Shin, K. H. (2022). Investigation of electromagnetic losses considering current harmonics in high-speed permanent magnet synchronous motor. Energies, 15(23), 15. https://doi.org/10.3390/en15239213 [Google Scholar] [CrossRef]
18. Zhang, Q., Li, Z., Dong, X., Sun, Z., Feng, L. (2018). Study of the loss loading method and coupling analysis of temperature distribution of the underwater motor. Transactions of China Electrotechnical Society, 33(5), 1007–1014. [Google Scholar]
19. Dilshad, M. R., Ashok, S., Vijayan, V., Pathiyil, P. (2016). An energy loss model based temperature estimation for Permanent Magnet Synchronous Motor (PMSM). Proceedings of the 2016 IEEE 2nd International Conference on Advances in Electrical & Electronics, Information, Communication & Bio Informatics (IEEE AEEICB-2016), pp. 172–176. India, Chennai. [Google Scholar]
20. Qiu, H., Zhao, X., Wei, Y., Yang, C. (2019). Study on permanent magnet thickness of high-speed permanent magnet generator. Electrical Engineering, 101(2), 499–506. https://doi.org/10.1007/s00202-019-00799-5 [Google Scholar] [CrossRef]
21. Ayachit, A., Kazimierczuk, M. K. (2016). Steinmetz equation for gapped magnetic cores. IEEE Magnetics Letters, 7, 1–4. https://doi.org/10.1109/LMAG.2016.2540609 [Google Scholar] [CrossRef]
22. Amin, M., Aziz, G. A. A. (2019). Hybrid adopted materials in permanent magnet-assisted synchronous reluctance motor with rotating losses computation. IEEE Transactions on Magnetics, 55(6), 1–5. https://doi.org/10.1109/TMAG.2019.2904989 [Google Scholar] [CrossRef]
23. Bezerra, M. A., Santelli, R. E., Oliveira, E. P., Villar, L. S., Escaleira, L. A. (2008). Response surface methodology (RSM) as a tool for optimization in analytical chemistry. Talanta, 76(5), 965–977. https://doi.org/10.1016/j.talanta.2008.05.019 [Google Scholar] [PubMed] [CrossRef]
Cite This Article
 Copyright © 2023 The Author(s). Published by Tech Science Press.
This work is licensed under a Creative Commons Attribution 4.0 International License , which permits unrestricted use, distribution, and reproduction in any medium, provided the original work is properly cited.
 Downloads
 Citation Tools