
 Submit a Paper
 Propose a Special lssue
 Open Access
ARTICLE

Thermo-Economic Performance of Geothermal Driven High-Temperature Flash Tank Vapor Injection Heat Pump System: A Comparison Study
1 Guangzhou Institute of Energy Conversion, Chinese Academy of Sciences, Guangzhou, 510640, China
2 University of Chinese Academy of Sciences, Beijing, 100049, China
* Corresponding Author: Jiongcong Chen. Email:
Energy Engineering 2023, 120(8), 1817-1835. https://doi.org/10.32604/ee.2023.027668
Received 08 November 2022; Accepted 16 January 2023; Issue published 05 June 2023
 View Full Text
 Download PDF
Abstract
Process heating constitutes a significant share of final energy consumption in the industrial sector around the world. In this paper, a high-temperature heat pump (HTHP) using flash tank vapor injection technology (FTVI) is proposed to develop low-temperature geothermal source for industrial process heating with temperature above 100°C. With heat sink output temperatures between 120°C and 150°C, the thermo-economic performance of the FTVI HTHP system using R1234ze(Z) as refrigerant is analyzed and also compared to the single-stage vapor compression (SSVC) system by employing the developed mathematical model. The coefficient of performance (COP), exergy efficiency (ηexe), net present value (NPV) and payback period (PBP) are used as performance indicators. The results show that under the typical working conditions, the COP and ηexe of FTVI HTHP system are 3.00 and 59.66%, respectively, and the corresponding NPV and PBP reach 8.13 × 10⁶ CNY and 4.13 years, respectively. Under the high-temperature heating conditions, the thermo-economic performance of the FTVI HTHP system is significantly better than that of the SSVC system, and the larger the temperature lift, the greater the thermo-economic advantage of the FTVI HTHP system. Additionally, the FTVI HTHP system is more capable than the SSVC system in absorbing the financial risks associated with changes of electricity price and natural gas price.Keywords
Nomenclature
| A | Heat transfer area, m2 |
| Bd | Bond number |
| Bo | Boiling number |
| C | Cost, CNY |
| c | Price, CNY/kWh or CNY/Nm3 |
| cp | Specific heat capacity, kJ/(kg·°C) |
| COP | Coefficient of performance |
| CRF | Capital recovery factor |
| Dh | Hydraulic diameter, m |
| E | Exergy, kW |
| f | Exchange rate |
| G | Mass flux, kg/(m2·s) |
| g | Acceleration due to the gravity, m2/s |
| FTVI | Flash tank vapor injection |
| h | Specific enthalpy, kJ/kg |
| HTHP | High-temperature heat pump |
| i | Interest rate, % |
| k | Fluid thermal conductivity, W/(m·°C) |
| L | Plate length, m |
| m | Mass flow rate, kg/s |
| n | Lifetime, years |
| NPV | Net present value, CNY |
| PBP | Payback period, years |
| Psav | Benefit of energy saving, CNY |
| Pr | Prandtl number |
| p | Pressure, kPa |
| Q | Heat flow rate, kW |
| q | Lower heating value, kJ/Nm3 |
| q′ | Heat flux, W/m2 |
| Re | Reynolds number |
| s | Specific entropy, kJ/(kg·°C) |
| SSVC | Single-stage vapor compression |
| T | Temperature, °C or K |
| TCI | Total capital investment, CNY |
| U | Overall heat transfer coefficient, W/(m2·°C) |
| Vsuc | Suction volume of compressor, m3/h |
| W | Electric power, kW |
| x | Vapor quality |
| ΔT | Temperature difference, °C |
Greek Letters
| α | Heat transfer coefficient, W/(m2·°C) |
| β | Chevron angle, ° |
| γ | Latent heat of vaporization/condensation, J/kg |
| δ | Plate thickness, m |
| η | Efficiency, % |
| λ | Plate thermal conductivity, W/(m·°C) |
| μ | Viscosity, Pa·s |
| ξ | Friction factor |
| ρ | Density, kg/m3 |
| σ | Surface tension, N/m |
| τ | Annual operation hours, h/year |
| Φ | Enlargement factor |
| φ | Maintenance cost factor |
Subscripts
| 0 | Reference point |
| 1–9,1′,4′,5′ | State point |
| ann | Annual |
| boi | Boiler |
| con | Condenser |
| com | Compressor |
| dh | Desupheating |
| E2C | Euro to Chinese Yuan |
| EV1 | First-stage expansion valve |
| EV2 | Second-stage expansion valve |
| ele | Electricity |
| eq | Equivalent |
| eva | Evaporator |
| FT | Flash tank |
| geo | Geothermal water |
| in | Inlet |
| inj | Injection |
| int | Intermediate |
| is | Isentropic |
| l | Liquid phase |
| m | Homogeneous |
| mot | Motor |
| NG | Natural gas |
| out | Outlet |
| OM | Operation and maintenance |
| r | Refrigerant |
| sat | Saturation condition |
| sc | Subcooling |
| sh | Supheating |
| sin | Sink water |
| tp | Two-phase |
| U2C | US dollar to Chinese Yuan |
| v | Vapor phase |
| vol | Volumetric |
| w | Water |
| wall | Wall temperature condition |
In recent years, the issue of energy consumption as well as the greenhouse gases emission involved has gained prominence worldwide. To tackle this problem, transitioning the industrial sector has great importance owing to that it is the largest energy consumption sector [1]. It is reported that the industrial sector globally accounts for over one third of total energy consumption and about a quarter of global CO2 emissions [2]. More importantly, the International Energy Agency projects a 50% increase in the industrial energy demand by 2050 at the global level [3]. Among the energy consumption in industrial sector, more than 70% of the total is used to meet the heating process demand [1]. This highlights the significance of clean technology transition in industrial process heating.
The development of renewable energy to replace fossil fuels is a promising approach to address the environmental problems resulted from growing energy consumption [4]. Geothermal energy, which is considered as low-emissions renewable resource independent from weather conditions [5], can play a significant role in clean technology transition [6]. According to reservoir temperatures, geothermal resources can be divided into three categories, i.e., low-, medium- and high-temperature resources, which correspond to temperature ranges of <90°C, 90°C–150°C and >150°C, respectively [7]. In comparison, the low-temperature geothermal source is widely available all over the world, but it is limited to direct utilization such as heating, greenhouses, snow melting and so on, and has insufficient quality to meet most of the demand coming from industrial process heating at temperatures above 100°C [8]. Therefore, it is necessary to develop technologies for expanding the application scope of low-temperature geothermal sources to increase the contribution of geothermal energy. In this respect, the method of combining the low-temperature geothermal sources with high-temperature heat pump (HTHP) is appealing [9]. Besides, this is also beneficial to recover the tail water exhausted from geothermal power plant, which is usually about 70°C [10].
It has been proved that the HTHP systems have wide application potential in food, printing and dyeing, papermaking, chemical industry, drying and rectification [11]. The most widely used HTHPs usually fall into two types, i.e., vapor compression and absorption cycles, see for example [12,13]. Compared to the absorption cycle, the vapor compression heat pumps offer the advantages of less expensive, simpler and easier in installation and control. However, to achieve a high output temperature, the single-stage vapor compression (SSVC) heat pump must contain high condensation temperature, which leads to large compression ratio and lowers the compression efficiency, and therefore the system heating capacity and coefficient of performance (COP) [14]. Consequently, a multi-stage configuration becomes more convenient, especially the two-stage vapor compression heat pumps. For example, an optimized two-stage heat pump cascaded with internal heat exchangers is recommended for temperature lifts from 60°C to 70°C or even higher [15]. Moreover, to further enhance the performance of two-stage HTHP systems, the vapor injection technique has become popular [16], which is commonly fulfilled by using either a flash tank or a sub-cooler. Compared to the sub-cooler vapor injection technology, the flash tank vapor injection (FTVI) has superior performance in the heat pump systems [17].
Nowadays, the FTVI used in HTHP systems usually involves two compressors, for instance, as seen in [14]. However, in practical, due to the high cost and huge size of these compressors, the application of two-stage cycle is limited to certain advanced systems [18]. As an alternative, the HTHP system with two-stage cycle using one injection type compressor is preferred, also known as quasi-two-stage systems, which in consequence becomes the focus of this study. It should be noted that although the FTVI technique is mainly devoted to improve the air-source heat pump systems under cold environments in recent years, it is also proved to be beneficial to the heating performance of HTHP systems. For instance, Zhang et al. [19] compared the FTVI and SSVC HTHP systems for steam production and indicated that with the condensation temperature at 120°C, the COP and thermal perfection of the FTVI HTHP system reach 3.4 and 0.502, respectively, which are 15.64% and 13.99% higher than that of the SSVC system. On the other hand, the selection of refrigerant is also an important direction of the HTHP technology [20]. Li et al. [21] analyzed the application potential of four Hydrofluoroolefin refrigerants in the FTVI HTHP under condensation temperature above 100°C and suggested that R1234ze(Z) has the largest volumetric heating capacity and its COP is comparable to that of R245fa, making it particularly suitable for high-capacity and high-temperature lift heating systems. This finding is in accord with Fukuda et al. [22] and Zhang et al. [23]. Overall, the advantages of FTVI technology in the HTHP systems have been proved, but its economic performance is not yet clear due to some additional devices included in the FTVI HTHP system compared to the single-stage systems. Furthermore, to date, few works consider the impact of actual boundary conditions on the economic performance of the FTVI HTHP system.
The present study aims to provide directions for expanding application scope of low-temperature geothermal sources using the FTVI HTHP systems, and to this end, a mathematical model of geothermal driven FTVI HTHP system is developed considering both thermodynamic and economic performance. Following the author’s previous work [21], R1234ze(Z) which has good flow and heat transfer performance [24], is chosen as working fluid. The effects of geothermal water temperature on the thermo-economic performance of FTVI HTHP system are analyzed with the specified heat sink outlet temperatures between 120°C and 150°C and also compared with the SSVC system under same working conditions. Here, the COP and exergy efficiency are used as thermodynamic performance indicators while the net present value and payback period are introduced as performance indicators in the economic evaluation. In addition, the impacts of electricity and natural gas price on the economic performance of the FTVI HTHP system are also discussed.
The schematic diagram of the FTVI HTHP system is shown in Fig. 1, which is constituted by an injection type compressor, condenser, evaporator, flash tank and two expansion valves. The refrigerant flows out of the condenser where it releases heat to lift the heat sink water temperature from Tsin,in to Tsin,out and then expands to a certain intermediate pressure through the first-stage expansion valve before entering the flash tank, in which it splits into liquid and vapor phases. The liquid phase refrigerant flows out of the flash tank from its bottom and enters the evaporator after expanding to evaporation pressure through the second-stage expansion valve, where it absorbs heat and becomes low-pressure vapor making geothermal water temperature drop from Tgeo,in to Tgeo,out. Subsequently, the low-pressure vapor phase refrigerant is sucked into the compressor in which it is compressed to the intermediate pressure and mixed with the injected vapor phase refrigerant, and finally it is further compressed to the condensation pressure to complete the cycle. The corresponding p-h (pressure-specific enthalpy) diagram of the FTVI HTHP is shown in Fig. 2. In a word, compared to the SSVC system, the feature of the FTVI HTHP system is that a flash tank is equipped between the two expansion valves that separates the vapor and liquid refrigerant after partial expansion and injects the flashed vapor into the compressor at intermediate pressure [17].
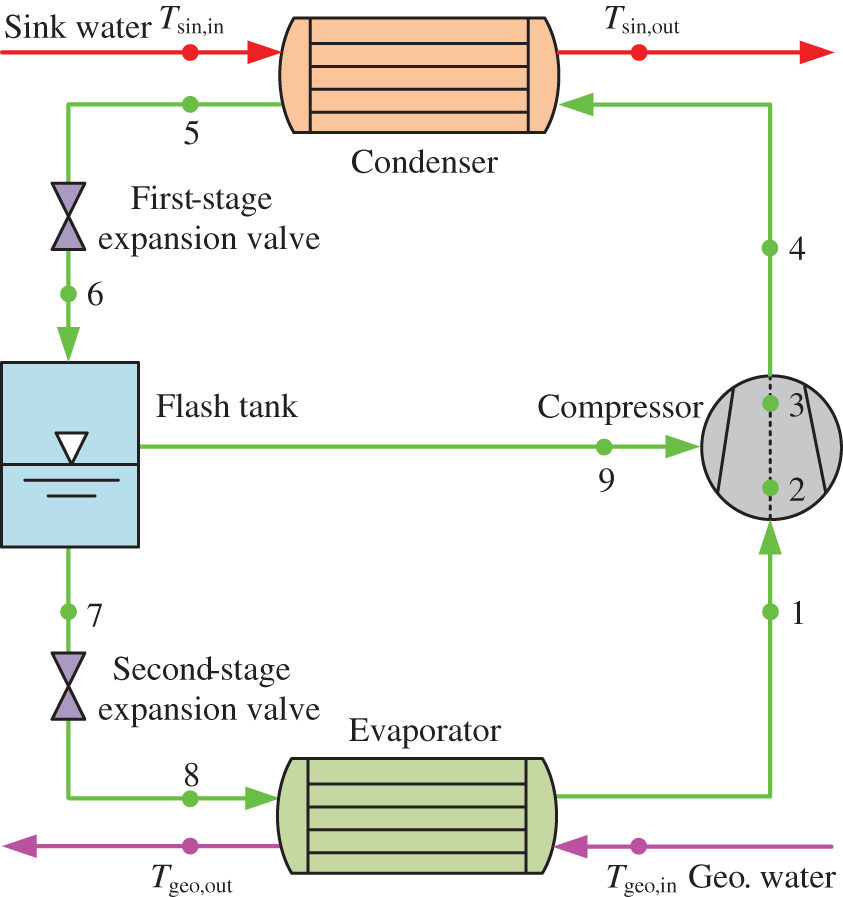
Figure 1: Schematic diagram of flash tank vapor injection heat pump system
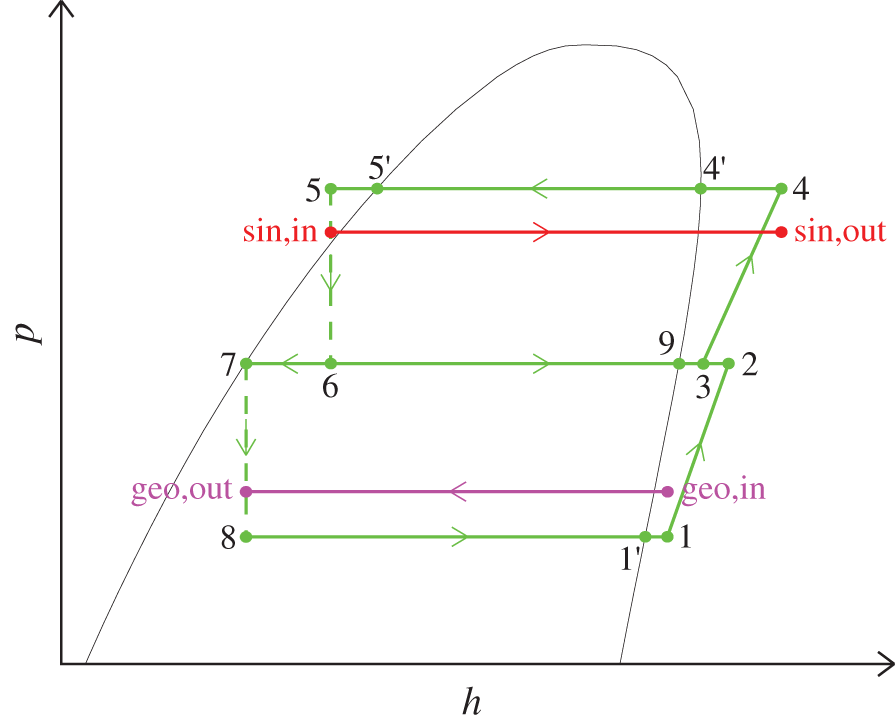
Figure 2: P-h diagram of flash tank vapor injection heat pump system
To simplify the analysis, the following assumptions are considered for the FTVI HTHP system [25–28]: the system operates under steady-state conditions; geothermal fluid is assumed as pure water; sink water is pressurized for hot water supply; only counter flow heat exchangers are considered; pressure drop and heat losses in all components and connections are neglected; throttling process is isenthalpic; pinch point temperature difference of 3°C is imposed on all heat exchangers; isentropic, volumetric and motor efficiencies of compressor are fixed at 0.75, 0.90 and 0.95, respectively; temperature glides of the geothermal and sink water are both 20°C, i.e., Tgeo,out = Tgeo,in − 20 and Tsin,out = Tsin,in + 20; sub-cooling degree of 10°C is assumed at the condenser outlet, i.e., T5 = T5′ − 10; sup-heating degree of 5°C is supposed at the evaporator outlet, i.e., T1 = T1′ + 5.
It is well known that the intermediate pressure is the key parameter for the design of FTVI HTHP [29], which is usually defined as the geometric mean of evaporation and condensation pressure [30]:
In view of the energy conservation law, the geothermal heat supplied (Qgeo) to the evaporator of the HTHP system can be calculated by:
Considering that the heat transfer process in the evaporator is characterized by division into two zones, i.e., two-phase evaporating and superheating, as shown in Fig. 2, Qgeo also can be expressed as follows:
with
The compressor power inputs during stage I (Wcom,I, the refrigerant vapor at the evaporation pressure is compressed to the intermediate pressure) and stage II (Wcom,II, the mixed refrigerant vapor at the intermediate pressure is further compressed to the condensation pressure) can be obtained as follows:
where
In the vapor injection compressor, the specific enthalpy of the mixed refrigerant vapor at the high-pressure stage inlet can be defined by:
Thus, the total power input of the vapor injection compressor is calculated by:
It is well known that the heating capacity of heat pump system is the sum of heat input and compressor power input, and thus the heating capacity (Qsin) of the HTHP system can be calculated by:
Besides, similar to the evaporator, with the heat transfer process being divided into three zones, i.e., desuperheating, two-phase condensing and subcooling, as shown in Fig. 2, Qsin also can be expressed as follows:
where
The COP is a common indicator for evaluating the thermodynamic performance of heat pumps [31]. As a ratio between the heating capacity and total electric power consumption, the COP is defined as Eq. (16):
As another common indicator for evaluating thermodynamic systems, the exergy efficiency (ηexe) based on the second law of thermodynamics can quantify the potential for improvement [32–34]. As for the HTHP system, the ηexe can be calculated as follows:
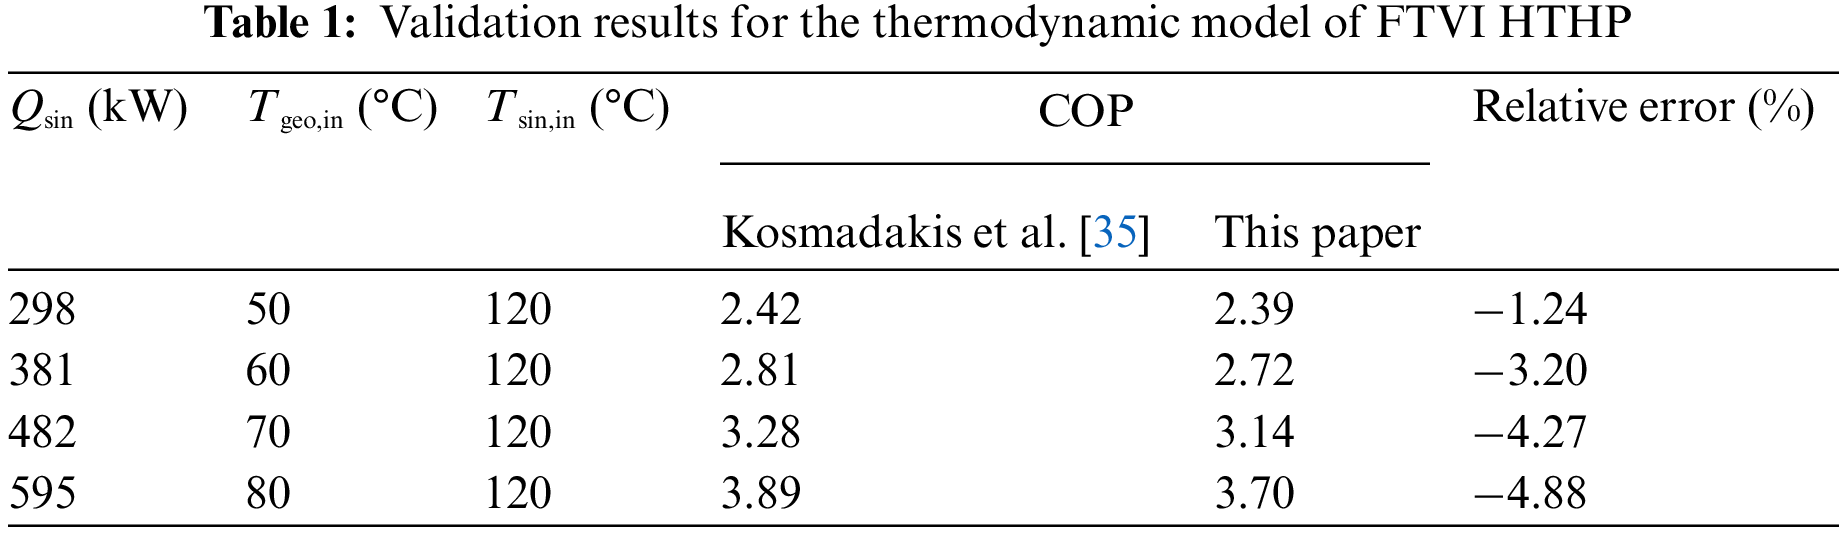
For the aim of validating the thermodynamic model of the FTVI HTHP, the calculated results are compared against Kosmadakis et al. [35] under the same assumptions and working conditions. As shown in Table 1, the values of COP calculated from the present model agree well with that of Kosmadakis et al. [35]. Therefore, the validity of the thermodynamic model is confirmed.
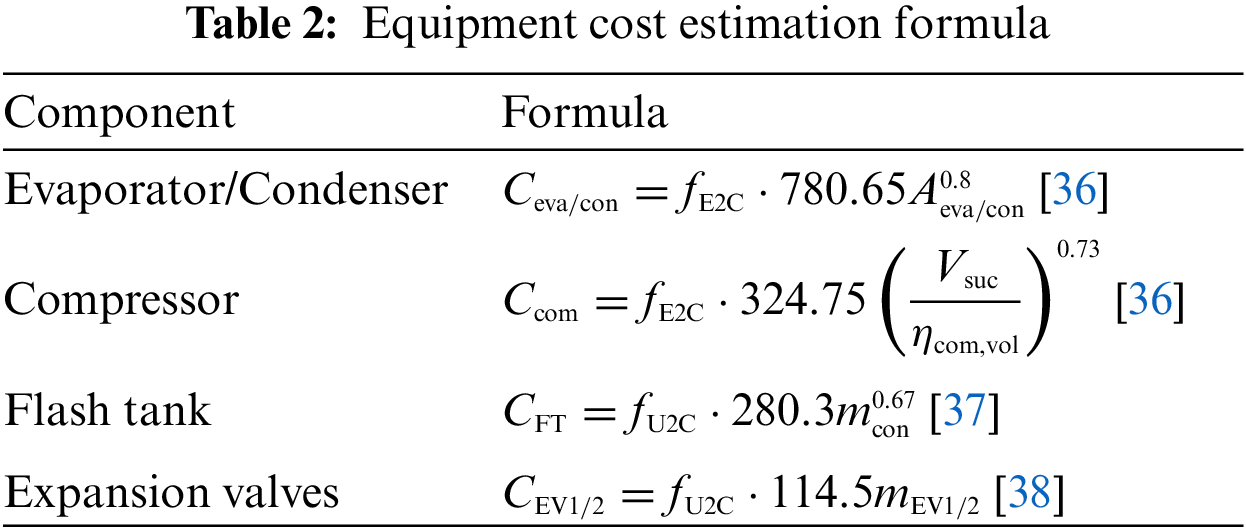
The total capital investment (TCI) of the FTVI HTHP system can be simplifiedly determined as a fixed multiple fTCI of the purchased equipment cost of the main components [28] including the compressor, evaporator, condenser, flash tank and expansion valves:
Note that fTCI is usually an experience-based value that accounts for the remaining expenses [28]. Considering the exchange rate of US dollar and Euro to Chinese Yuan (CNY), namely fU2C and fE2C, respectively, the cost estimation formula for the specific equipment of the FTVI HTHP system is shown in Table 2.
The plate heat exchanger is adopted for the evaporator and condenser owing to compact configuration and good heat transfer performance. Based on logarithmic mean temperature difference method, the heat transfer areas of evaporator and condenser in the FTVI HTHP can be calculated by Eqs. (21) and (22), respectively:
The overall heat transfer coefficient U is calculated in general as follows:
Here, the single-phase heat transfer coefficient (αsp) for both water and working fluid sides is calculated by Martin correlation [39] as follows:
where
In the evaporator, the boiling heat transfer coefficient (αeva,tp) is calculated using Amalfi et al. correlation [40] as follows:
where
In the condenser, the condensation heat transfer coefficient (αcon,tp) can be calculated using Longo et al. correlation [41] as follows:
where
To assess the economic performance of the HTHP system, net present value (NPV) and payback period (PBP) are used as indicators. The NPV denotes the accumulated net revenue of the system through whole life time and the investment is accepted with NPV value larger than zero, and the larger the better. the PBP is the time needed to recover the initial investment cost, and the shorter the better. According to [42], using a natural gas boiler as benchmark system, the NPV and PBP can be calculated as follows [43]:
with
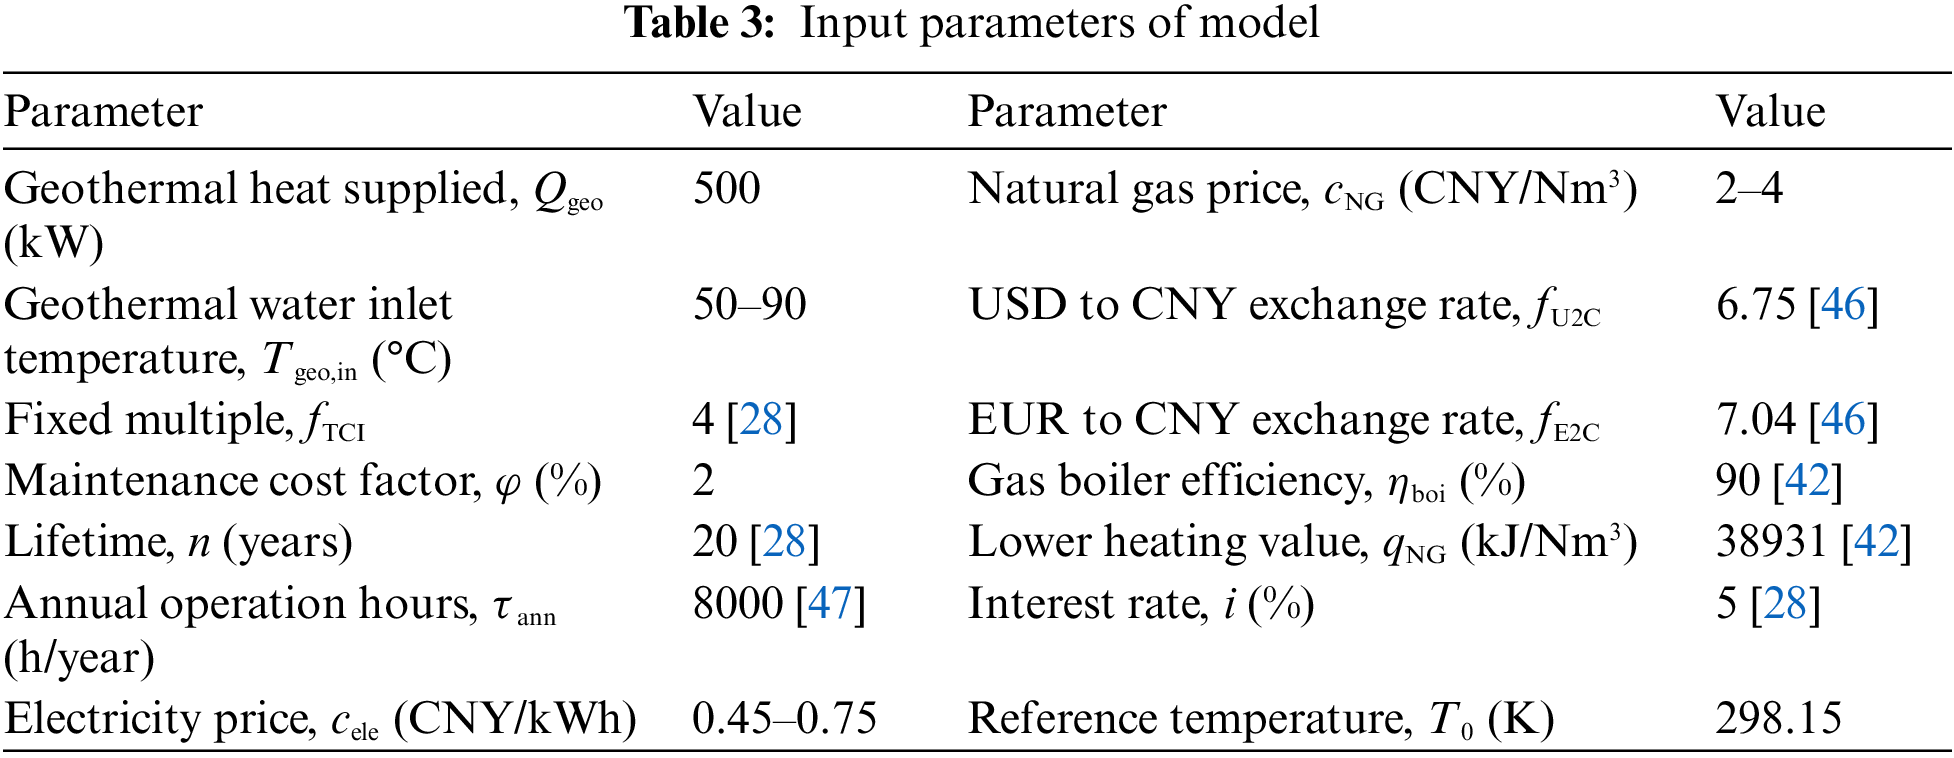
Based on the model developed above, the thermo-economic performance of the FTVI HTHP system with R1234ze(Z) as refrigerant driven by low-temperature geothermal water is analyzed and compared to the SSVC system with the heat sink outlet temperature specified at 120°C, 130°C, 140°C and 150°C. The input parameters used are listed in Table 3. In the analysis, Tgeo,in = 70°C, Tsin,out = 130°C, cele = 0.6 CNY/kWh and cNG = 3.5 CNY/Nm3 are set as typical working conditions and assumed constant except the parameter whose effect is discussed varies. Noteworthy the thermophysical properties of R1234ze(Z) are calculated through a link with CoolProp [44], and the characteristic geometry parameters of the evaporator and condenser are taken from Mancini et al. [45].
Figs. 3 and 4 show the variation of COP and ηexe for the FTVI and SSVC HTHP systems with the geothermal water temperature. The figures show that as expected, with the increased geothermal water temperature, the COP and ηexe of the HTHPs gradually increase, and with same geothermal water temperature, the lower the heat sink outlet temperature, the better the thermodynamic performance. The main reason for this fact is that a low temperature lift is beneficial to improve the thermodynamic performance of HTHP systems [48]. Under the given working conditions, the COP and ηexe of the FTVI system range from 2.00 to 4.70 and from 52.99% to 65.78%, respectively, which is generally better than that of the SSVC system. Besides, the thermodynamic advantage of the FTVI over SSVC HTHP system at same heat sink outlet temperature increases with the decreased geothermal water temperature. For example, as for the typical case, the COP and ηexe of the FTVI system reach about 3.00 and 59.66%, respectively, and the corresponding improvements over the SSVC system are about 18.18% and 13.48%, respectively; however, when the geothermal water temperature drops to 60°C, the improvements of COP and ηexe increase to 20.51% and 16.79%, respectively. Furthermore, with same geothermal water temperature, the economic advantage of the FTVI over SSVC HTHP system becomes more prominent.
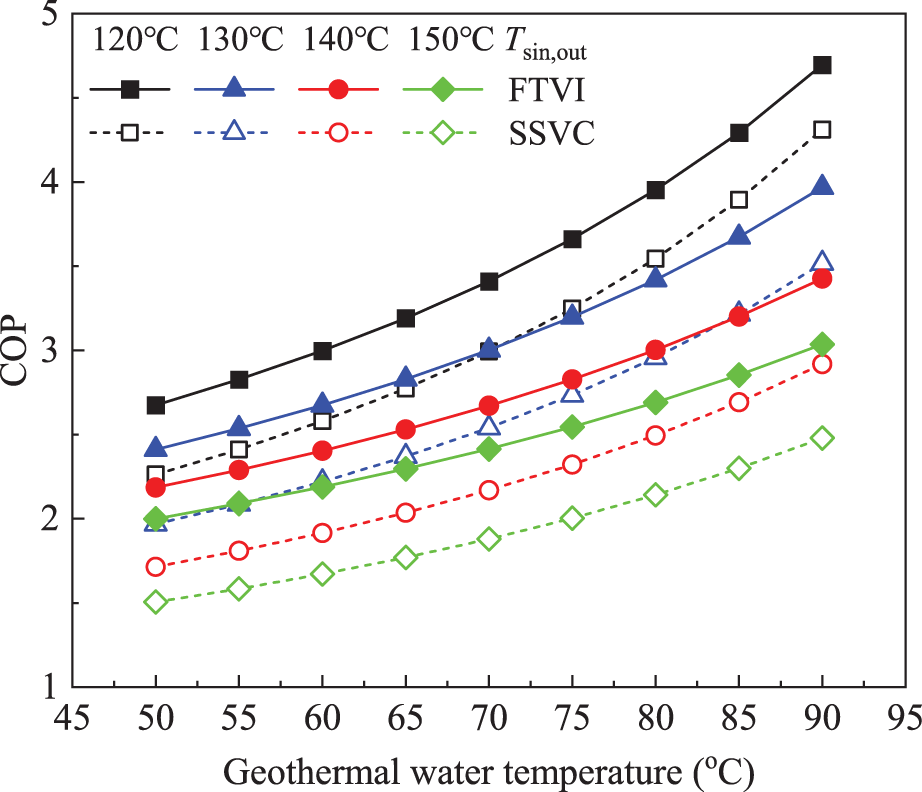
Figure 3: Coefficient of performance vs. geothermal water temperature
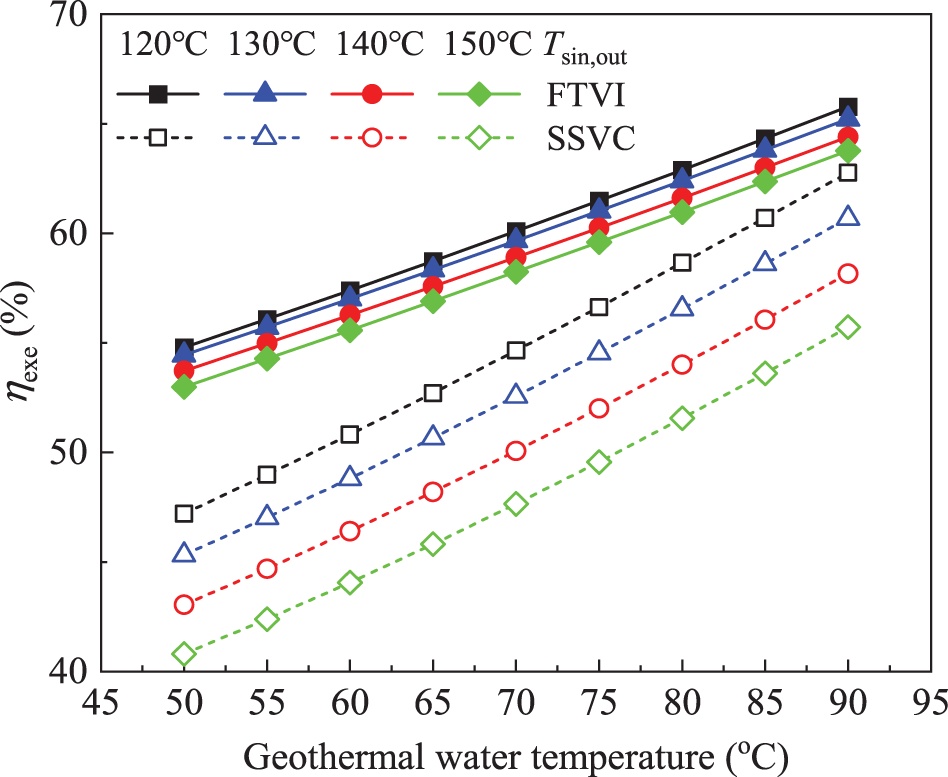
Figure 4: Exergy efficiency vs. geothermal water temperature
Figs. 5 and 6 show the variation of NPV and PBP for the FTVI and SSVC HTHP systems with the geothermal water temperature. As the geothermal water temperature increases, the NPV of HTHP systems tends to increase while the PBP gradually decreases. With the same geothermal water temperature, the lower the heat sink outlet temperature, the better the economic performance. That can be explained by the improvement in thermodynamic performance of the HTHP systems resulted from the decreased heat sink outlet temperature, which reduces the system costs. Under the given working conditions, the FTVI system is techno-economically feasible in terms of NPV ranging from 0.45 × 10⁶ to 11.91 × 10⁶ CNY, but this finding is not fully supported by the PBP due to that its value is longer than the expected lifetime under some working conditions. Nevertheless, the FTVI system performs generally more economically than the SSVC system considering the fact that the techno-economic temperature lift of the FTVI system can be up to 90°C, which is higher than that of the SSVC by about 20°C. Besides, the economic advantage of the FTVI over SSVC HTHP system at same heat sink outlet temperature increases with the decreased geothermal water temperature. Taking the typical case as an example, the NPV and PBP of the FTVI system reach about 8.13 × 10⁶ CNY and 4.31 years, respectively, and the corresponding improvements over the SSVC system are about 28.31% and 21.41%, respectively, but when the geothermal water temperature is as low as 60°C, the improvements of NPV and PBP increase to 81.63% and 47.16%, respectively. Also, the higher the heat sink outlet temperature, the more the economic advantage of FTVI over SSVC HTHP system at the same geothermal water temperature.
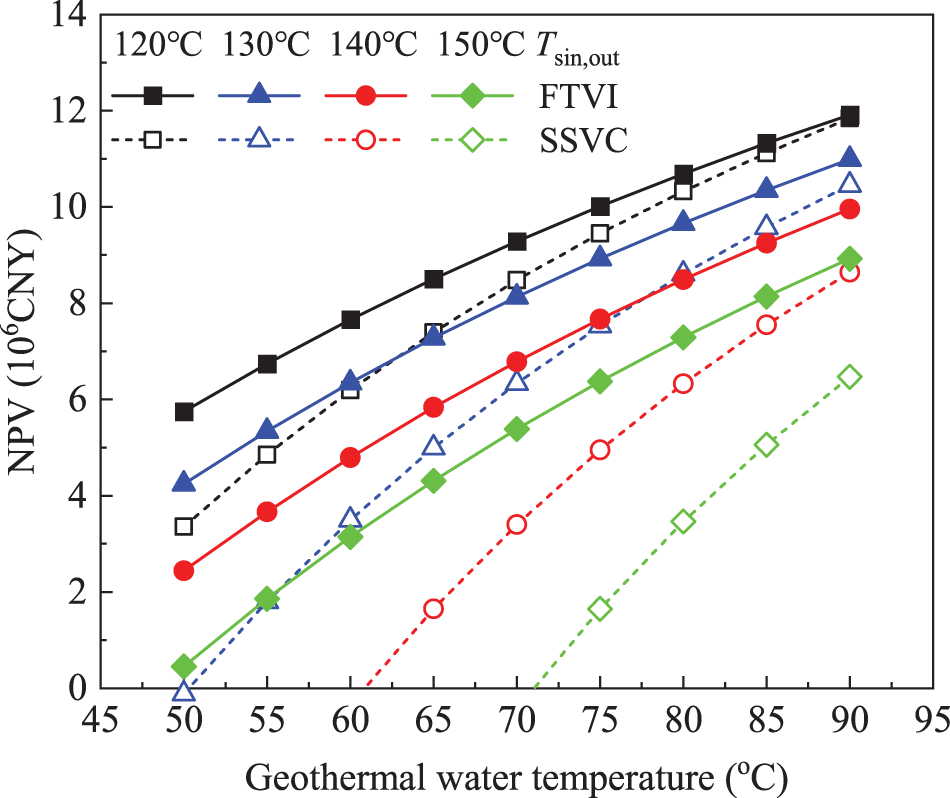
Figure 5: Net present value vs. geothermal water temperature
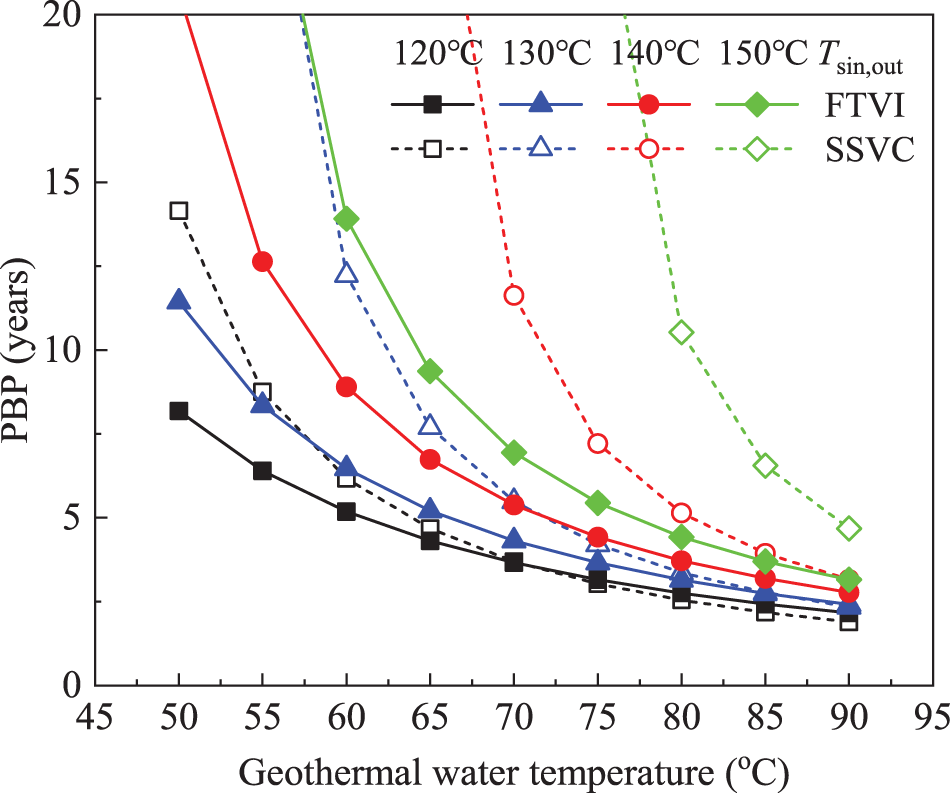
Figure 6: Payback period vs. geothermal water temperature
Figs. 7 and 8 show the NPV and PBP of FTVI and SSVC HTHP systems as a function of the electricity price. For the HTHP systems, the increased electricity price leads to a decline in the NPV and a rise in the PBP. With the same electricity price, as the heat sink outlet temperature drops, the economic performance of the HTHP systems tends to be significantly improved. Noteworthy that a high heat sink outlet temperature may cause an unfavorable economic performance of the HTHP systems with the low NPV tending to zero and the long PBP exceeding the system lifetime mainly due to the fact that the thermodynamic performance deteriorates as the heat sink outlet temperature rises and the system costs therefore increase. For the given working conditions, the NPV and PBP of the FTVI system in the techno-economically feasible range are about 1.98 × 10⁶–12.32 × 10⁶ CNY and 2.75–18.86 years, respectively, which are superior to that of SSVC system. Also, with the higher electricity price, the economic advantage of the FTVI over SSVC HTHP system is more obvious at the same heat sink outlet temperature. For example, when the electricity price increases to 0.65 kWh/CNY, with the typical case as basis, the improvement of the NPV and PBP of the FTVI over SSVC HTHP system increases from 28.31% to 45.01% and from 21.41% to 30.46%, respectively. Furthermore, with the constant electricity price, the higher heat sink outlet temperature leads to the larger economic difference between the FTVI and SSVC systems, especially in terms of the PBP.
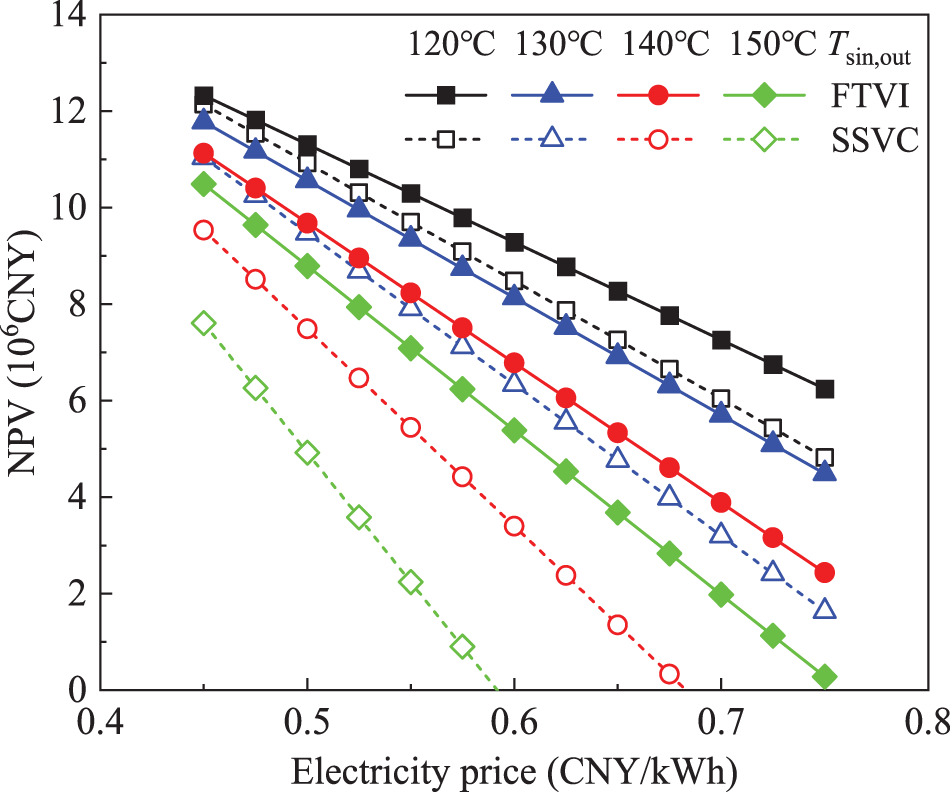
Figure 7: Net present value vs. electricity price
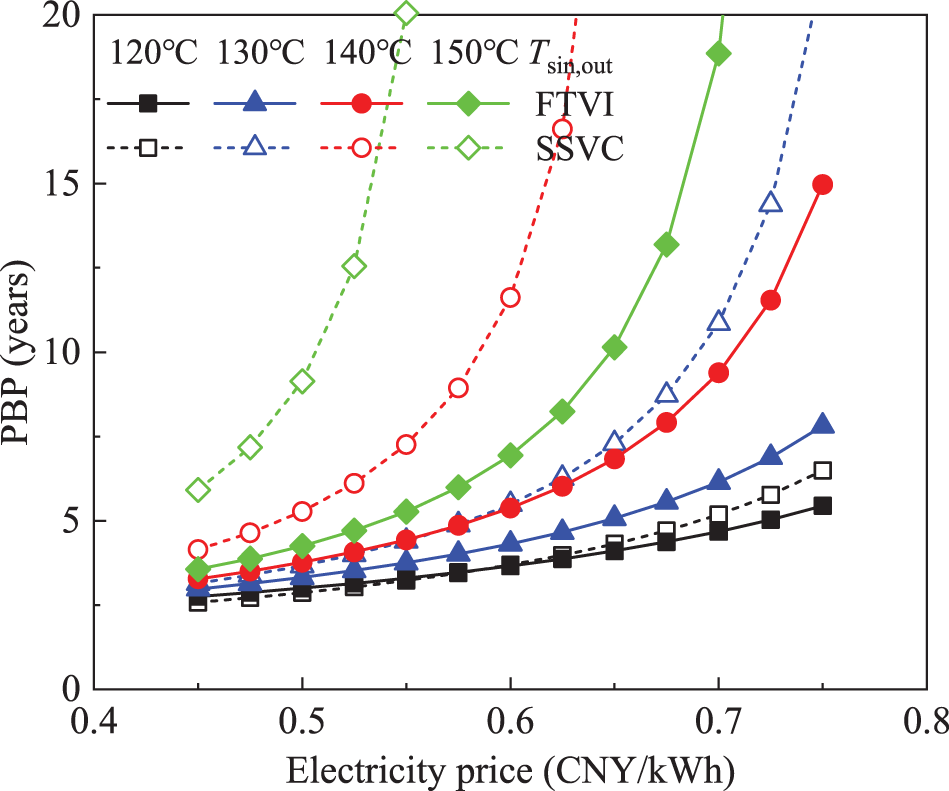
Figure 8: Payback period vs. electricity price
Figs. 9 and 10 show the NPV and PBP of FTVI and SSVC HTHP systems as a function of the natural gas price. It is clear that as the natural gas price increasing, the NPV of the HTHP systems increases linearly while the PBP exponentially decreases. Noteworthy that at a relatively lower natural gas price, the NPV of the HTHP systems is unusually small, even tending to a negative value, and the corresponding PBP is extremely long, going to exceed the system lifetime, which can be attributed that the benefit of energy saving with fixed geothermal heat supplied grows proportionally as the natural gas price increasing. For the FTVI system under given working conditions, the NPV ranges from 1.89 × 10⁶ to 12.83 × 10⁶ CNY and the PBP ranges from 2.65 to 18.57 years. Additionally, the economic advantage of the FTVI over SSVC HTHP system is more significant as the natural gas price decreasing. For example, with the natural gas price dropping to 3.00 CNY/Nm3, taking the typical case as reference, the improvement of the NPV and PBP of the FTVI over SSVC HTHP system increases from 28.31% to 95.18% and from 21.41% to 48.34%, respectively. These figures also indicate that at the same natural gas price, a greater economic advantage of the FTVI over the SSVC HTHP system may be anticipated as the heat sink outlet temperature increases in general.
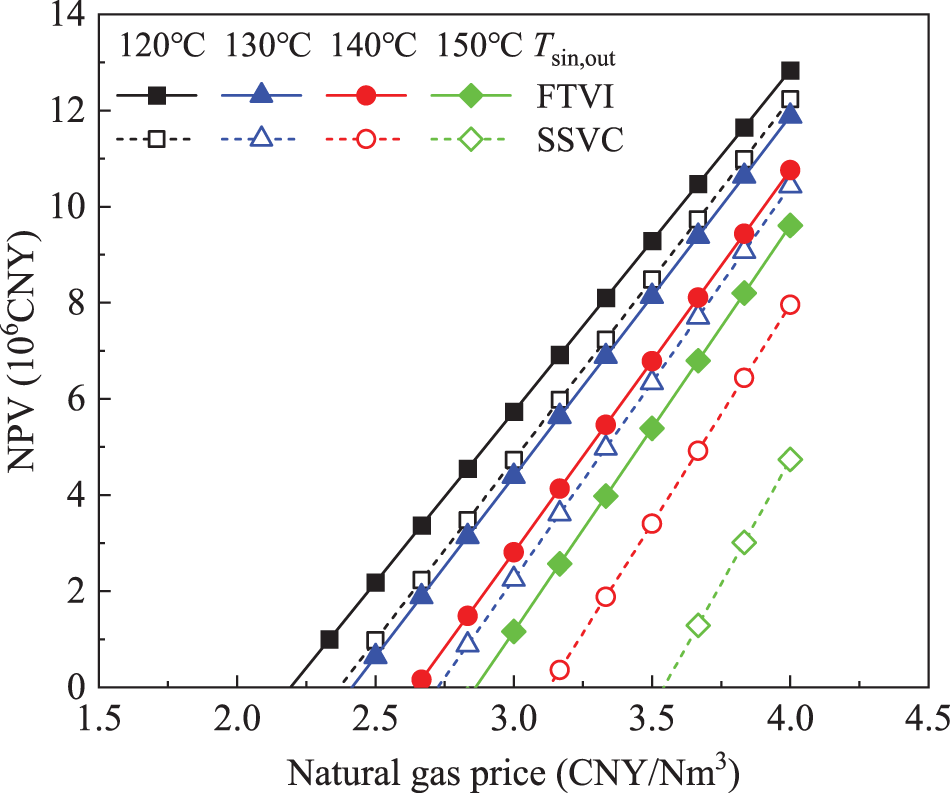
Figure 9: Net present value vs. natural gas price
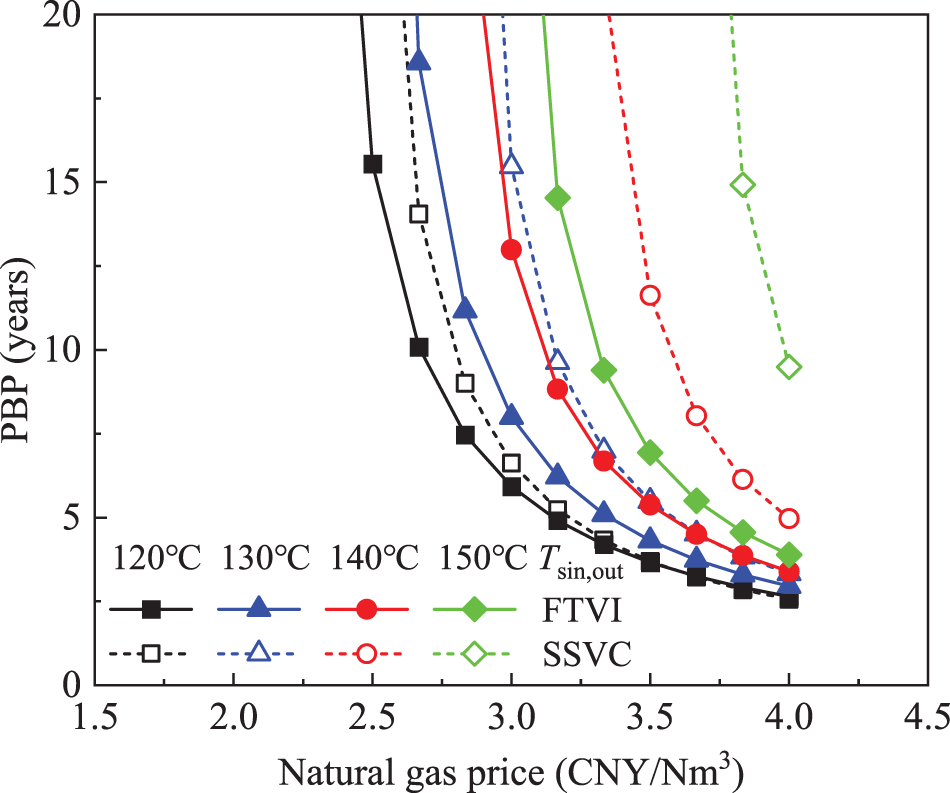
Figure 10: Payback period vs. natural gas price
Low-temperature geothermal source has promising prospect in industrial process heating. In this paper, a mathematical model for the FTVI HTHP system has been established and the effects of geothermal water temperature, electricity price and natural gas price on the thermo-economic performance of FTVI HTHP system with output temperatures between 120°C and 150°C are analyzed. Also, the comparison against the SSVC system is conducted.
Under typical working conditions, the COP and ηexe of FTVI HTHP system reach 3.00 and 59.66%, respectively, and the corresponding NPV and PBP are about 8.13 × 10⁶ CNY and 4.31 years, respectively. Compared to the SSVC system, the FTVI HTHP system has better thermodynamic and economic performance in general. The COP and ηexe improvements of the FTVI over SSVC HTHP system reach 18.18% and 13.48%, respectively, and the corresponding NPV and PBP improvements are about 28.31% and 21.41%, respectively, under typical working conditions. Besides, the lower the geothermal water temperature, the more the thermo-economic advantage of the FTVI HTHP system. Further, in comparison to the SSVC system, the FTVI HTHP system is better equipped to handle the financial risk associated with higher electricity price and this advantage increases as the electricity price rises. This is also true when the natural gas price decreases.
Moreover, note that the limitation of the present study is that the mathematical model developed for numerical analysis is not verified against experimental data. So, future works should be devoted to experimental verification of the performance of FTVI HTHP system. Additionally, it is common knowledge that the environmental impact associated with energy systems is currently one of the most important concerns, and thus further research also should include the life cycle environmental assessment of the geothermal driven FTVI HTHP system.
Funding Statement: This work was supported by the Carbon Peak and Carbon Neutralization Science and Technology Innovation Special Fund of Jiangsu Province, China (No. BE2022859) and Natural Science Foundation of Guangdong Province, China (No. 2021A1515011763).
Conflicts of Interest: The authors declare that they have no conflicts of interest to report regarding the present study.
References
1. Kumar, L., Hasanuzzaman, M., Rahim, N. A. (2019). Global advancement of solar thermal energy technologies for industrial process heat and its future prospects: A review. Energy Conversion and Management, 195(1), 885–908. https://doi.org/10.1016/j.enconman.2019.05.081 [Google Scholar] [CrossRef]
2. Schoeneberger, C. A., McMillan, C. A., Kurup, P., Akar, S., Margolis, R. et al. (2020). Solar for industrial process heat: A review of technologies, analysis approaches, and potential applications in the United States. Energy, 206(C5), 118083. https://doi.org/10.1016/j.energy.2020.118083 [Google Scholar] [CrossRef]
3. International Energy Agency (2017). Energy technology perspectives 2017: Catalysing energy technology transformations. Paris, France: OECD. [Google Scholar]
4. Chen, L., Wang, Y., Xie, M., Ye, K., Mohtaram, S. (2021). Energy and exergy analysis of two modified adiabatic compressed air energy storage (A-CAES) system for cogeneration of power and cooling on the base of volatile fluid. Journal of Energy Storage, 42(8), 103009. https://doi.org/10.1016/j.est.2021.103009 [Google Scholar] [CrossRef]
5. Vargas, C. A., Caracciolo, L., Ball, P. J. (2022). Geothermal energy as a means to decarbonize the energy mix of megacities. Communications Earth & Environment, 3(1), 1–11. https://doi.org/10.1038/s43247-022-00386-w [Google Scholar] [CrossRef]
6. Yudha, S. W., Tjahjono, B., Longhurst, P. (2022). Sustainable transition from fossil fuel to geothermal energy: A multi-level perspective approach. Energies, 15(19), 7435. https://doi.org/10.3390/en15197435 [Google Scholar] [CrossRef]
7. Demirbas, A., Alidrisi, H., Ahmad, W., Sheikh, M. H. (2016). Potential of geothermal energy in the Kingdom of Saudi Arabia. Energy Sources, Part A: Recovery, Utilization, and Environmental Effects, 38(15), 2238–2243. https://doi.org/10.1080/15567036.2015.1045999 [Google Scholar] [CrossRef]
8. Mateu-Royo, C., Navarro-Esbrí, J., Mota-Babiloni, A., Amat-Albuixech, M., Molés, F. (2019). Thermodynamic analysis of low GWP alternatives to HFC-245fa in high-temperature heat pumps: HCFO-1224yd(ZHCFO-1233zd(E) and HFO-1336mzz(Z). Applied Thermal Engineering, 152, 762–777. https://doi.org/10.1016/j.applthermaleng.2019.02.047 [Google Scholar] [CrossRef]
9. Kim, M., Baik, Y. J., Park, S. R., Chang, K. C., Ra, H. S. (2010). Design of a high temperature production heat pump system using geothermal water at moderate temperature. Current Applied Physics, 10(2), S117–S122. https://doi.org/10.1016/j.cap.2009.11.015 [Google Scholar] [CrossRef]
10. Wang, G. L., Wang, W. L., Zhang, W., Ma, F., Liu, F. (2020). The status quo and prospect of geothermal resources exploration and development in Beijing-Tianjin-Hebei region in China. China Geology, 3(1), 173–181. https://doi.org/10.31035/cg2020013 [Google Scholar] [CrossRef]
11. Wu, D., Yan, H., Hu, B., Wang, R. Z. (2019). Modeling and simulation on a water vapor high temperature heat pump system. Energy, 168(2), 1063–1072. https://doi.org/10.1016/j.energy.2018.11.113 [Google Scholar] [CrossRef]
12. Arpagaus, C., Bless, F., Uhlmann, M., Schiffmann, J., Bertsch, S. S. (2018). High temperature heat pumps: Market overview, state of the art, research status, refrigerants, and application potentials. Energy, 152(1), 985–1010. https://doi.org/10.1016/j.energy.2018.03.166 [Google Scholar] [CrossRef]
13. Cudok, F., Giannetti, N., Ciganda, J. L. C., Aoyama, J., Babu, P. et al. (2021). Absorption heat transformer-state-of-the-art of industrial applications. Renewable and Sustainable Energy Reviews, 141(3), 110757. https://doi.org/10.1016/j.rser.2021.110757 [Google Scholar] [CrossRef]
14. Cao, X. Q., Yang, W. W., Zhou, F., He, Y. L. (2014). Performance analysis of different high-temperature heat pump systems for low-grade waste heat recovery. Applied Thermal Engineering, 71(1), 291–300. https://doi.org/10.1016/j.applthermaleng.2014.06.049 [Google Scholar] [CrossRef]
15. Mota-Babiloni, A., Mateu-Royo, C., Navarro-Esbrí, J., Molés, F., Amat-Albuixech, M. et al. (2018). Optimisation of high-temperature heat pump cascades with internal heat exchangers using refrigerants with low global warming potential. Energy, 165, 1248–1258. https://doi.org/10.1016/j.energy.2018.09.188 [Google Scholar] [CrossRef]
16. He, Y. N., Cao, F., Jin, L., Wang, X. L., Xing, Z. W. (2015). Experimental study on the performance of a vapor injection high temperature heat pump. International Journal of Refrigeration, 60(3), 1–8. https://doi.org/10.1016/j.ijrefrig.2015.08.012 [Google Scholar] [CrossRef]
17. Lv, X. L., Yu, M. Q., Yu, J. L. (2021). Performance analysis of an ejector-boosted solar-assisted flash tank vapor injection cycle for ASHP applications. Solar Energy, 224(7), 607–616. https://doi.org/10.1016/j.solener.2021.05.048 [Google Scholar] [CrossRef]
18. Heo, J., Jeong, M. W., Kim, Y. (2010). Effects of flash tank vapor injection on the heating performance of an inverter-driven heat pump for cold regions. International Journal of Refrigeration, 33(4), 848–855. https://doi.org/10.1016/j.ijrefrig.2009.12.021 [Google Scholar] [CrossRef]
19. Zhang, Y. T., Zhang, H., Wang, L., Xu, J. Y., Huang, L. M. et al. (2022). Application and analysis of multi-stage flash vaporization process in steam production in high-temperature heat pump system with large temperature difference. International Journal of Refrigeration, 133(4), 123–132. https://doi.org/10.1016/j.ijrefrig.2021.09.035 [Google Scholar] [CrossRef]
20. Bamigbetan, O., Eikevik, T. M., Nekså, P., Bantle, M. (2017). Review of vapour compression heat pumps for high temperature heating using natural working fluids. International Journal of Refrigeration, 80(11), 197–211. https://doi.org/10.1016/j.ijrefrig.2017.04.021 [Google Scholar] [CrossRef]
21. Li, H. S., Huang, S. H., Wang, X. L., Qu, Y., Gong, Y. L. (2020). Performance comparison of low GWP refrigerant in flash tank vapor injection high-temperature heat pump. Advances in New and Renewable Energy, 8(5), 396–401 (in Chinese). [Google Scholar]
22. Fukuda, S., Kondou, C., Takata, N., Koyama, S. (2014). Low GWP refrigerants R1234ze(E) and R1234ze(Z) for high temperature heat pumps. International Journal of Refrigeration, 40, 161–173. [Google Scholar]
23. Zhang, X. D., Xu, H. M. (2021). Experimental performance of moderately high temperature heat pump with working fluid R1234ze(Z). Journal of Thermal Analysis and Calorimetry, 144(4), 1535–1545. [Google Scholar]
24. Longo, G. A., Mancin, S., Righetti, G., Brown, J. S. (2019). Assessment of the low-GWP refrigerants R600a, R1234ze(Z) and R1233zd(E) for heat pump and organic Rankine cycle applications. Applied Thermal Engineering, 167, 114804. [Google Scholar]
25. Li, H. S., Cao, F., Bu, X. B., Wang, L. B., Wang, X. L. (2014). Performance characteristics of R1234yf ejector-expansion refrigeration cycle. Applied Energy, 121, 96–103. [Google Scholar]
26. Bellos, E., Tzivanidis, C. (2019). A comparative study of CO2 refrigeration systems. Energy Conversion and Management: X, 1, 100002. [Google Scholar]
27. Meng, N., Li, T. L., Gao, X., Liu, Q. H., Li, X. L. et al. (2022). Thermodynamic and techno-economic performance comparison of two-stage series organic Rankine cycle and organic Rankine flash cycle for geothermal power generation from hot dry rock. Applied Thermal Engineering, 200(15), 117715. https://doi.org/10.1016/j.applthermaleng.2021.117715 [Google Scholar] [CrossRef]
28. Zühlsdorf, B., Jensen, J. K., Elmegaard, B. (2019). Heat pump working fluid selection—economic and thermodynamic comparison of criteria and boundary conditions. International Journal of Refrigeration, 98, 500–513. https://doi.org/10.1016/j.ijrefrig.2018.11.034 [Google Scholar] [CrossRef]
29. Wang, W. Y., Li, Y. Y. (2019). Intermediate pressure optimization for two-stage air-source heat pump with flash tank cycle vapor injection via extremum seeking. Applied Energy, 238, 612–626. https://doi.org/10.1016/j.apenergy.2019.01.083 [Google Scholar] [CrossRef]
30. Mateu-Royo, C., Navarro-Esbrí, J., Mota-Babiloni, A., Amat-Albuixech, M., Molés, F. (2018). Theoretical evaluation of different high-temperature heat pump configurations for low-grade waste heat recovery. International Journal of Refrigeration, 90, 229–237. https://doi.org/10.1016/j.ijrefrig.2018.04.017 [Google Scholar] [CrossRef]
31. Kondou, C., Koyama, S. (2015). Thermodynamic assessment of high-temperature heat pumps using Low-GWP HFO refrigerants for heat recovery. International Journal of Refrigeration, 53(1), 126–141. https://doi.org/10.1016/j.ijrefrig.2014.09.018 [Google Scholar] [CrossRef]
32. Rosen, M. A. (2002). Clarifying thermodynamic efficiencies and losses via exergy. Exergy, An International Journal, 2(1), 3–5. https://doi.org/10.1016/S1164-0235(01)00054-1 [Google Scholar] [CrossRef]
33. Mohtaram, S., Omidi, M., Lin, J., Sun, H. G., Chen, W. (2019). Exergy analysis of a multi mixture working fluid absorption refrigeration cycle. Case Studies in Thermal Engineering, 15(4), 100540. https://doi.org/10.1016/j.csite.2019.100540 [Google Scholar] [CrossRef]
34. Mohtaram, S., Chen, W., Zargar, T., Lin, J. (2017). Energy-exergy analysis of compressor pressure ratio effects on thermodynamic performance of ammonia water combined cycle. Energy Conversion and Management, 134(36), 77–87. https://doi.org/10.1016/j.enconman.2016.12.024 [Google Scholar] [CrossRef]
35. Kosmadakis, G., Arpagaus, C., Neofytou, P., Bertsch, S. (2020). Techno-economic analysis of high-temperature heat pumps with low-global warming potential refrigerants for upgrading waste heat up to 150°C. Energy Conversion and Management, 226(6), 113488. https://doi.org/10.1016/j.enconman.2020.113488 [Google Scholar] [CrossRef]
36. Ommen, T., Jensen, J. K., Markussen, W. B., Reinholdt, L., Elmegaard, B. (2015). Technical and economic working domains of industrial heat pumps: Part 1—Single stage vapour compression heat pumps. International Journal of Refrigeration, 55(1), 168–182. https://doi.org/10.1016/j.ijrefrig.2015.02.012 [Google Scholar] [CrossRef]
37. Mosaffa, A. H., Farshi, L. G., Ferreira, C. A. I., Rosen, M. A. (2016). Exergoeconomic and environmental analyses of CO2/NH3 cascade refrigeration systems equipped with different types of flash tank intercoolers. Energy Conversion & Management, 117, 442–453. [Google Scholar]
38. Wu, Z. X., Li, S., Yang, X. C., Zhang, Y. F. (2020). Performance evaluation and working fluid selection of combined heat pump and power generation system (HP-PGs) using multi-objective optimization. Energy Conversion and Management, 221, 113164. [Google Scholar]
39. Martin, H. (1996). A theoretical approach to predict the performance of chevron-type plate heat exchangers. Chemical Engineering and Processing, 35(4), 301–310. [Google Scholar]
40. Amalfi, R. L., Farzad, V. F., John, R. T. (2016). Flow boiling and frictional pressure gradients in plate heat exchangers. Part 2: Comparison of literature methods to database and new prediction methods. International Journal of Refrigeration, 61, 185–203. [Google Scholar]
41. Longo, G. A., Righetti, G., Zilio, C. (2015). A new computational procedure for refrigerant condensation inside herringbone-type Brazed Plate Heat Exchangers. International Journal of Heat and Mass Transfer, 82, 530–536. [Google Scholar]
42. Wu, W., Wang, B., Shi, W., Li, X. (2014). Techno-economic analysis of air source absorption heat pump: Improving economy from a design perspective. Energy and Buildings, 81, 200–210. [Google Scholar]
43. Tan, H., Cao, R., Wang, S., Wang, Y., Deng, S. et al. (2021). Proposal and techno-economic analysis of a novel system for waste heat recovery and water saving in coal-fired power plants: A case study. Journal of Cleaner Production, 281, 124372. [Google Scholar]
44. Bell, I. H., Wronski, J., Quoilin, S., Lemort, V. (2014). Pure and pseudo-pure fluid thermophysical property evaluation and the open-source thermophysical property library CoolProp. Industrial & Engineering Chemistry Research, 53(6), 2498–2508. [Google Scholar]
45. Mancini, R., Zühlsdorf, B., Aute, V., Markussen, W. B., Elmegaard, B. (2019). Performance of heat pumps using pure and mixed refrigerants with maldistribution effects in plate heat exchanger evaporators. International Journal of Refrigeration, 104, 390–403. [Google Scholar]
46. People’s Bank of China. Announcement of CNY central parity rates on June 15, 2022 (in Chinese). http://www.pbc.gov.cn/zhengcehuobisi/125207/125217/125925/4577783/index.html [Google Scholar]
47. Sahana, C., De, S., Mondal, S. (2021). Integration of CO2 power and refrigeration cycles with a desalination unit to recover geothermal heat in an oilfield. Applied Thermal Engineering, 189, 116744. [Google Scholar]
48. Mikielewicz, D., Wajs, J. (2019). Performance of the very high-temperature heat pump with low GWP working fluids. Energy, 182, 460–470. https://doi.org/10.1016/j.energy.2019.05.203 [Google Scholar] [CrossRef]
Cite This Article
 Copyright © 2023 The Author(s). Published by Tech Science Press.
This work is licensed under a Creative Commons Attribution 4.0 International License , which permits unrestricted use, distribution, and reproduction in any medium, provided the original work is properly cited.
 Downloads
 Citation Tools