
 Submit a Paper
 Propose a Special lssue
 Open Access
ARTICLE

Experimental Study on the Influence of Fracturing Fluid Retention on Shale Gas Diffusion Law
1
Cooperative Innovation Center of Unconventional Oil and Gas (Ministry of Education & Hubei Province), Yangtze University,
Wuhan, China
2
Petroleum Engineering College, Yangtze University, Wuhan, China
3
Hubei Shale Gas Development Engineering Technology Research Center, Yangtze University, Wuhan, China
* Corresponding Author: Jing Sun. Email:
(This article belongs to the Special Issue: Simulation of Flow and Transport Problems in Petroleum Engineering)
Energy Engineering 2023, 120(8), 1853-1866. https://doi.org/10.32604/ee.2023.025846
Received 01 August 2022; Accepted 12 December 2022; Issue published 05 June 2023
 View Full Text
 Download PDF
Abstract
Shale gas reservoirs have poor physical properties and a large number of micro-nano pores have been developed. Shale gas wells have no natural productivity and need fracturing reconstruction measures to put into production. However, the fracturing fluid will enter the reservoir space of shale matrix after fracturing and affect the production of shale gas. At present, there is no consensus on the influence of fracturing fluid retention on gas well production. Based on this, the paper adopts gas molecular transport analyzer to carry out experimental research on the influence of fracturing fluid on shale gas diffusion law after entering matrix pores. The results show that: (1) Compared with the diffusion capacity of single-phase shale gas, the diffusion capacity of shale gas decreases significantly when fracturing fluid is present in the reservoir; (2) In the process of fracturing fluid flowback, when the water saturation in the reservoir decreases from 50% to 0, the gas well productivity increases by about 60%. (3) When fracturing fluid exists in the reservoir, the pore diameter has an exponential relationship with the shale gas diffusion coefficient, and the diffusion coefficient increases exponentially with the increase of pore diameter. The research of this paper provides theoretical basis for guiding the efficient development of shale gas wells.Keywords
As a new energy alternative to conventional oil and gas, shale gas has become the focus of global unconventional energy exploration and development. Compared with conventional gas reservoirs, shale gas reservoirs are characterized by low porosity and ultra-low permeability. Shale reservoir matrix is rich in nano-scale pores [1], resulting in multi-scale characteristics of shale gas migration in matrix. The migration process is accompanied by gas slippage flow, collision between gas molecules, and collision between gas molecules and nanopore walls [2], which cannot be described by the traditional Darcy formula [3]. The clear migration mechanism of shale gas in nanopores is of great significance for predicting the shale gas productivity, dynamic analysis and economic evaluation [4]. Some scholars [5–8] used numerical simulation method, theoretical calculation method and single-phase gas flow experiment to study the flow mechanism of shale gas in nano-scale pores of reservoir matrix, and proposed a large number of nano-scale gas flow models. It is considered that the migration of shale gas in nanopores is dominated by diffusion, and diffusion is the main way of shale gas migration in matrix, which plays an important role in natural gas accumulation and later development of gas reservoirs.
However, nanopores are widely developed in the shale matrix, and the shale reservoir must be hydraulically fractured to achieve shale gas recovery. Different from conventional reservoirs, the flowback rate of fracturing fluid in shale reservoirs is generally low after fracturing [9], and a large amount of fracturing fluid is absorbed or retained in the reservoir by the matrix [10]. The shale gas flow models established in the above studies still focus on single-phase flow, ignoring the effect of fracturing fluid retention on gas production patterns in gas wells, while studying the flow mechanism of shale gas under water-bearing conditions more accurately describes the actual flow of gas in shale reservoirs. Researchers have conducted many studies on the interaction of shale gas and fracturing fluids. Wu et al. [11] believed that the gas flow capacity of tight cores with different water saturation is different under both high and low pressure conditions. The lower the water saturation is, the better the gas flow capacity is. However, this experiment was carried out under normal temperature and pressure conditions, so that the test results cannot be applied to the analysis of the natural gas diffusion mechanism under gas reservoir conditions. Hu et al. [12] studied the gas flow capacity in tight cores under different water saturation based on experimental means. The results show that when the water saturation increases to a certain critical value (this is the critical water saturation), water occupies the main flow channel, and the flow capacity of shale gas decreases significantly. However, the influence of shale reservoir pore size on gas flow is not considered, and the experimental data of the control group is too little. Hu et al. [13] carried out experiments on gas-water two-phase flow at the nano-scale, and believed that the water in the nanochannel has a great hindrance to the gas flow. But the experimental results can not well reveal the gas molecular motion characteristics. At the same time, there are other ways to study the the influence of fracturing fluid retention on shale gas reservoirs. Li et al. [14] established gas-water two-phase seepage model of horizontal well in shale reservoir, and believed that due to the influence of fracturing fluid flowback, and the daily gas production shows an increase and then decrease. Guo et al. [15] established a gas-water two-phase productivity model for shale gas, and believed that the smaller the initial water saturation of the reservoir, the greater the influence of fracturing fluid flowback rate on the production. However, in the model, the influence of diffusion on production when shale gas migrates in the matrix has not been further explained. Penny et al. [16] believed that the retention and absorption of fracturing fluid resulted in high water saturation inside the reservoir, the flow ability of gas in the pores decreased, and even caused the phenomenon of water lock. Kang et al. [17] believed that a large amount of fracturing fluid retention in shale reservoir would cause serious damage to gas reservoir. The increase of water saturation near the fracture wall surface causes water phase trapping damage, which makes it difficult for matrix gas to be desorbed. Ghanbari et al. [18] believed that the counter-current imbibition of fracturing water during the shut-in period can result in a significant gas build-up in the fractures and increases early-time gas production rate. Shen et al. [19] believed that the retention of fracturing fluid does not cause serious damage to shale gas reservoir. The ultra-low water saturation, abundant nanopores and huge contact area of shale reservoirs are important factors for strong fluid absorption capacity of shale. The excellent water absorption capacity of shale matrix is a key factor in eliminating water block. Cai et al. [20] believed that for shale gas reservoirs, although there is a large amount of retained fracturing fluids, the amount of retained fluids does not seem to be significantly correlated with the damages of the reservoir. Some wells with low recovery rate even tend to have higher production. You et al. [21] believed that a high-yield well always has a relatively low recovery of fracturing fluids, which may indicate that proper fluids retention would play a very positive role in stimulating the reservoir. Hao et al. [22,23] believed that in the nano-confined environment, the water film will form a quasi-circular water channel in the square pores, which is conducive to the migration of methane gas. However, these studies are mainly based on molecular dynamic simulation method, numerical simulation methods and theoretical calculation methods. These calculation methods are based on certain assumptions, lacking the support of corresponding experimental data, and cannot fully descript the diffusion behaviour of shale gas in real reservoirs.
In view of the current situation that lack of corresponding experimental data to verify the effect of reservoir water saturation on the flow capacity of shale gas, selected the molecular membranes with different pore sizes as nanochannels, the experimental samples with different water saturation were prepared based on the water content of saturated molecular membranes, and then the self-developed gas molecular transport analyzer was used to carry out the methane gas diffusion experiment under different water saturation to clarify the methane gas diffusion characteristics under different pore sizes and water saturation. It is expected to provide theoretical guidance for the evaluation of shale gas in the actual production process.
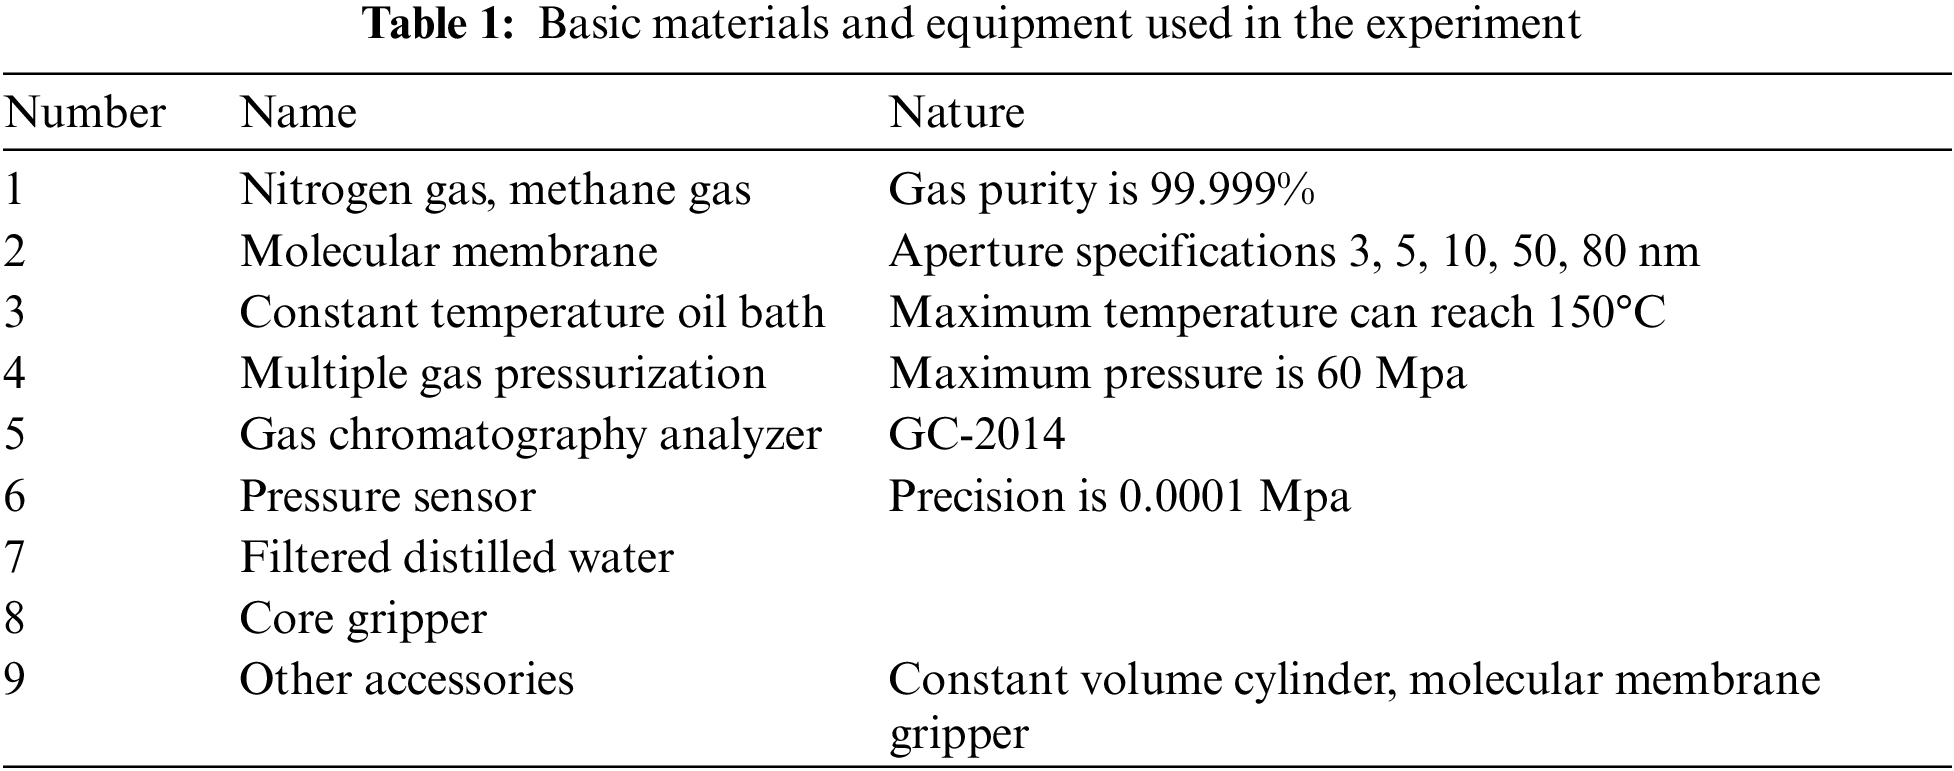
Materials and equipment used in the experiment are shown in Table 1 below. The main instruments are independently designed and developed gas molecular transport analyzer system, including constant temperature oil bath, gas chromatography analyzer, multiple gas pressurization device, core gripper and other accessories.
In order to carry out the experiments of methane diffusion in nanopores under different water saturation conditions, the preparation of nanochannels is essential. In this experiment, the molecular membrane synthesized from polyvinylidene fluoride (PVDF), a polymer material, was preferred as nanochannel. This kind of nano-membrane has a very large number of nanopore array microstructure, and the nanotubes are all of relatively uniform diameter. Therefore, the regular nanopores in the molecular membrane can be used as the experimental flow channels. In addition, When studying the flow law of methane gas under water-bearing conditions, the molecular membranes need to be uniformly saturated with filtered distilled water before they can be used. The water saturation is defined as 1 according to the result of single-phase water filling the pores of the molecular membrane, and the content of distilled water used to saturate the molecular membrane is varied to to obtain different water saturation.
2.2 Diffusion Capacity Experiment
The diffusion experiment process is shown in Fig. 1. According to the characteristics of molecular membrane, the self designed molecular membrane gripper is used to clamp and seal the molecular membrane. During the experiment, the pressure of diffusion chambers A and B is always consistent, the methane in chamber A at the left-end spontaneously diffuses through the nanochannels into chamber B at the right-end under the effect of concentration difference. The experimental steps are as follows:
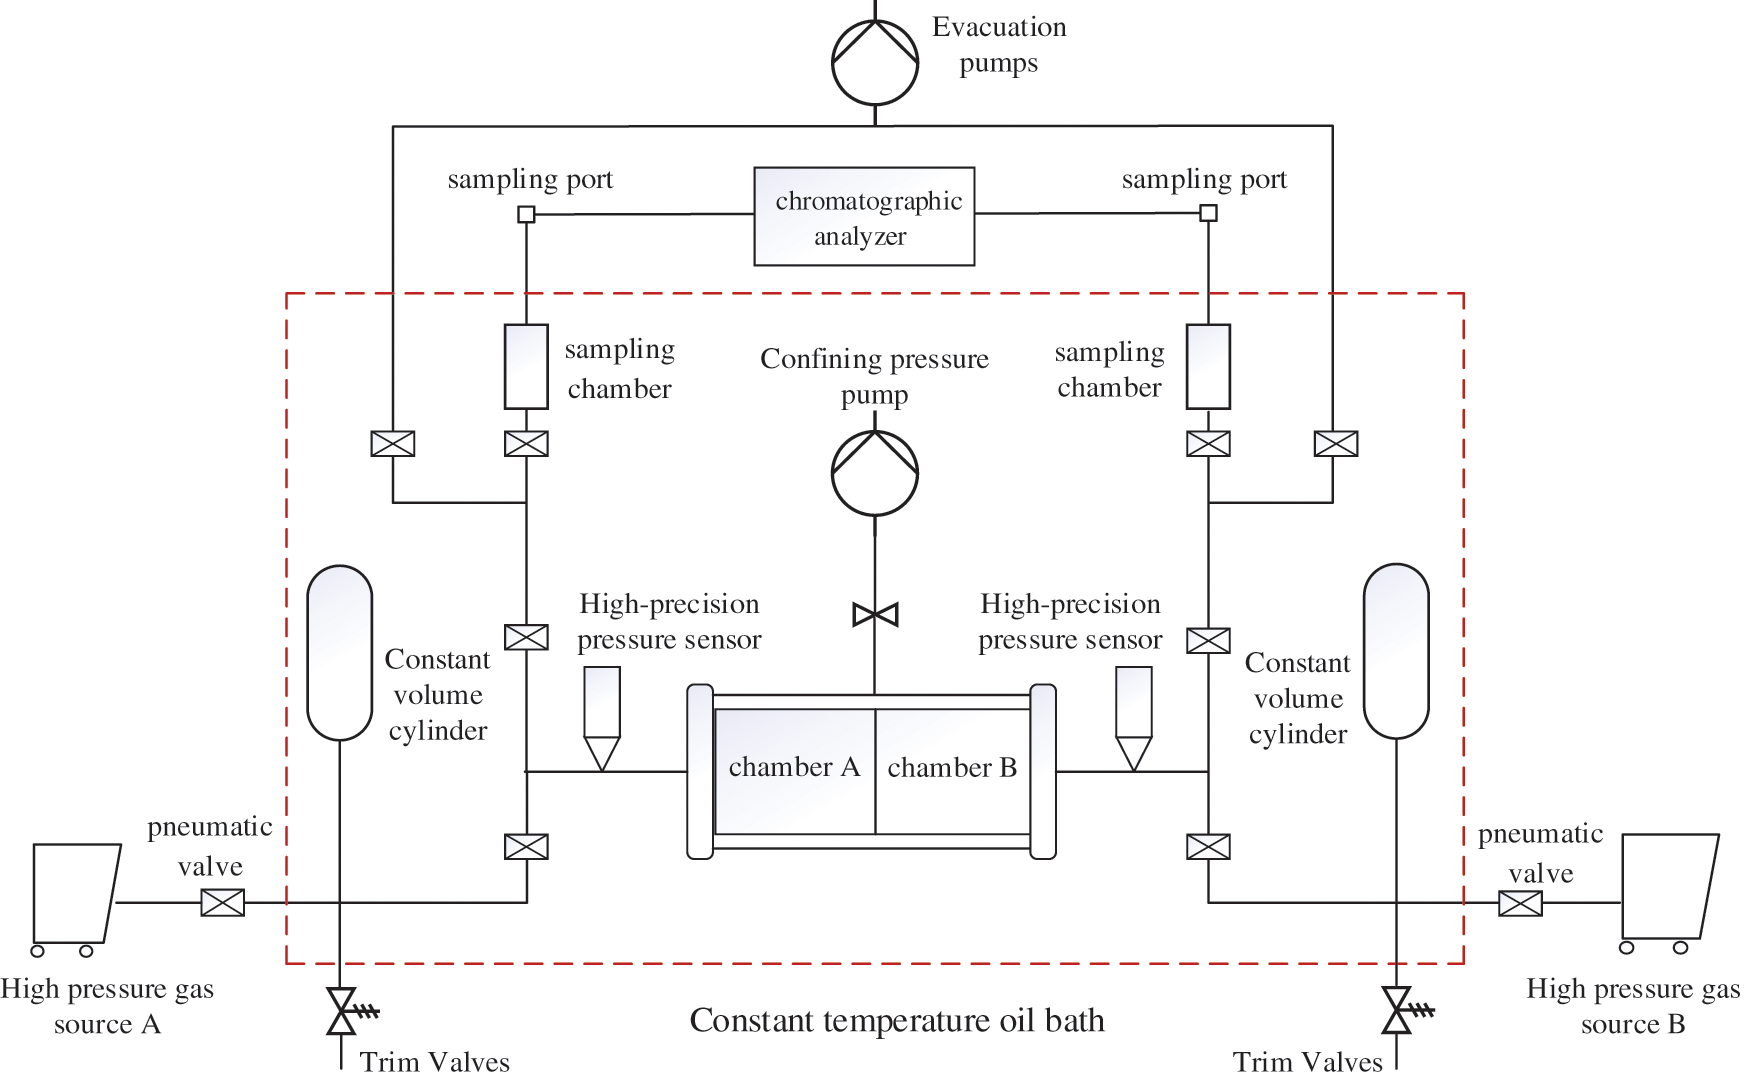
Figure 1: Simulation experimental process of methane flow in micro and nano pores
(1) Check the air tightness of the experimental device, and adjust the temperature of the constant temperature oil bath to 70°C.
(2) Take 0.1 ml of filtered distilled water, and spread the same amount of filtered distilled water evenly on the surface of molecular membranes with different aperture specifications.
(3) Pressurize high-purity methane gas and nitrogen gas to 15 Mpa, open the pneumatic valve, the high-pressure gas begin to diffuse at both ends of the gripper, respectively.
(4) Use a sampling needle to take out the gas respectively that has diffused in chambers A and B for a period of time from the sampling port, and analyze the composition and concentration of gas in sampling chamber by gas chromatographic analyzer. Continuous sampling and analysis for three times, the experimental data error within 1% is considered valid.
(5) Calculate the diffusion coefficient of methane.
(6) When conducting the diffusion experiment of methane gas under different water saturation, take 0.1, 0.3 and 0.5 ml filtered distilled water and spread it evenly on the surface of the molecular membrane with the Same aperture specification, and repeated the experimental Steps (3)~(5).
(7) After the end of the experiment, take out the molecular membrane carefully, check whether the molecular membrane is damaged, and if it is damaged, discard the group of experimental data and start the experiment again.
The diffusion coefficient is calculated by the natural gas industry standard SY/T6129-1995:
In Eq. (1): E is the intermediate variable,
Through sampling, analysis and calculation, plot the cumulative diffusion time “t” and the
3.1 Study on the Influence of the Pore Size on Diffusion
In order to analyze the characteristics of gas diffusion in the nano-scale pore system of shale matrix, according to the distribution range of shale nanopore size [24], molecular membranes with pore size specifications of 3, 5, 10, 50 and 80 nm were preferably used as nanochannels in this experiment. According to the above experimental methods and steps, gas diffusion experiment was carried out on nanochannels after saturation with water, and the gas chromatograph analyzer was used to record and process the data at different time points, the concentration difference ∆Ci of methane in two diffusion chambers A and B after the diffusion t time was obtained. In order to improve the accuracy of this experiment, the diffusion experiment under different pore size conditions is repeated according to the same experimental method. The experimental results of gas diffusion in all nanochannels are summarized in Fig. 2 below, it can be seen from the figure that the relationship curve between the gas cumulative diffusion time t and
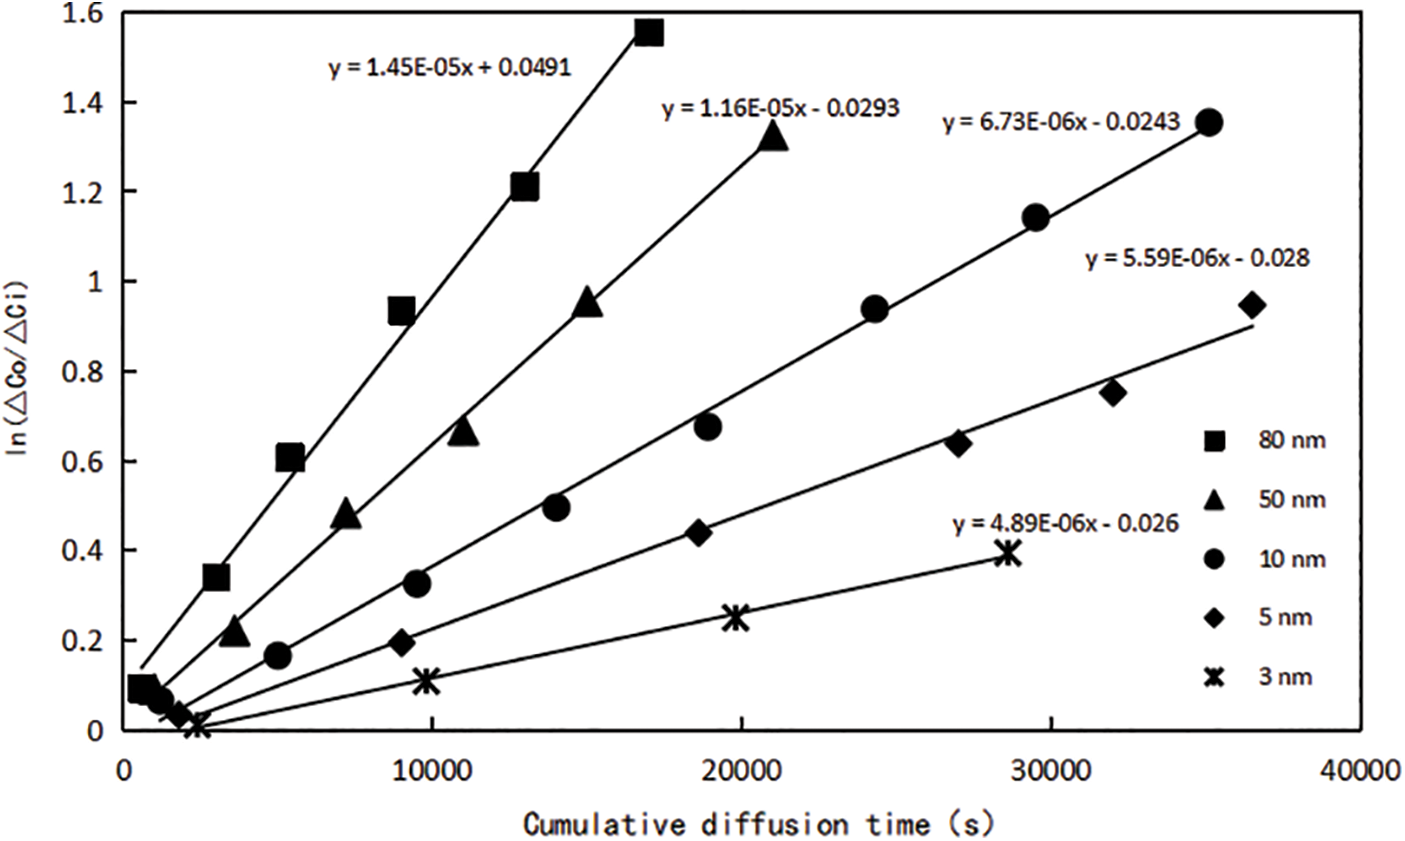
Figure 2: Relationship between cumulative diffusion time and ln (△C0/△Ci) of molecular membranes with different pore sizes
The DE values under each pore size condition can be obtained according to Fig. 2, the diffusion coefficient of methane gas under water condition can be further calculated. Data on single-phase gas diffusion coefficients at the nano-scale were obtained by researching the literature [25]. Comparing the diffusion coefficients of the two, the data are shown in Table 2. When the water saturation is 20%, taking a nanochannel with a pore size of 50 nm as an example, compared with no water, the diffusion coefficient of methane decreased from 1.08 × 10⁻⁵ cm2/s to 5.37 × 10⁻⁶ cm2/s, decreased by about 50%. It can be seen that water saturation has a great influence on gas flow capacity, which requires special attention.
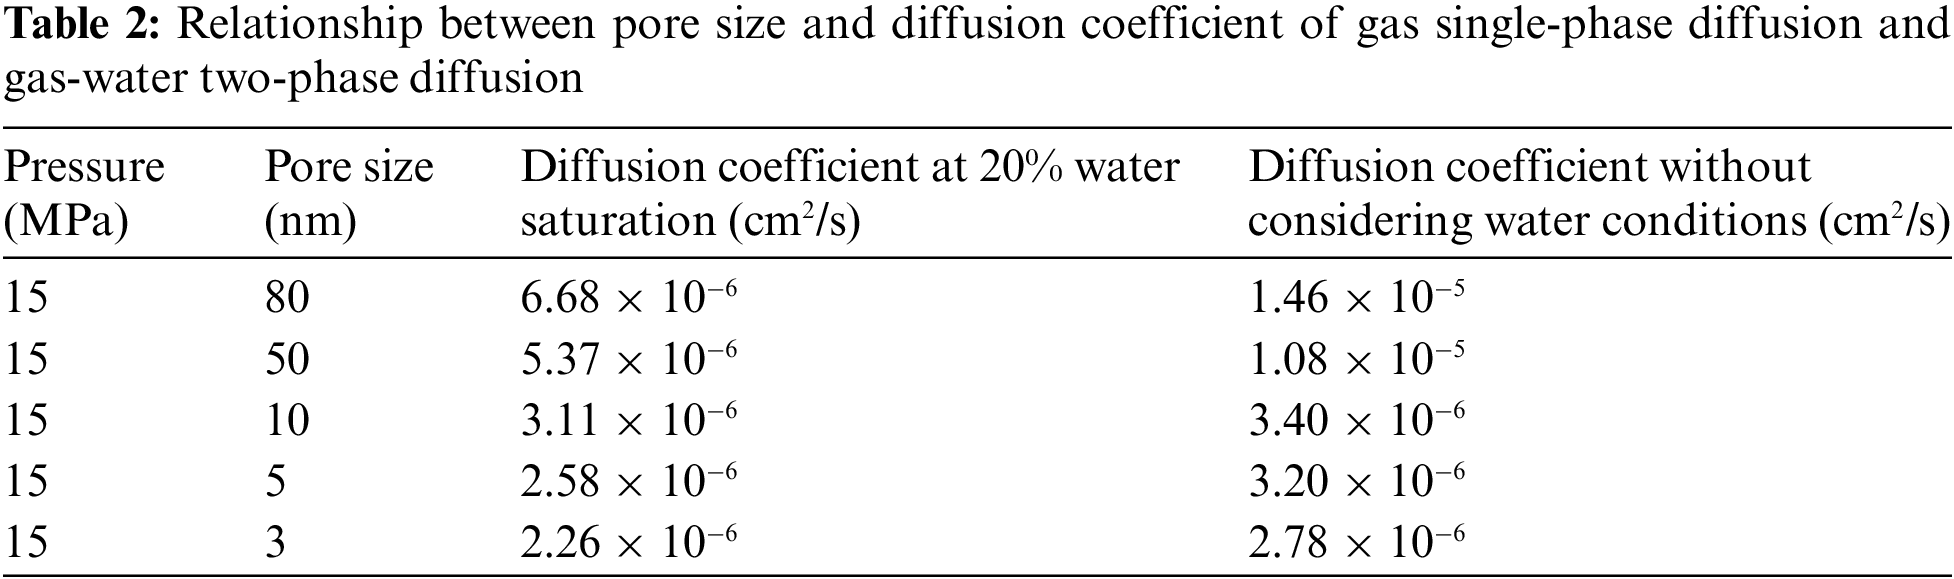
From Table 2, the diffusion coefficient curve corresponding to different pore sizes under water conditions are drawn, and compare the experimental results of single-phase gas diffusion experiment, as shown in Fig. 3. When methane diffuses in the nanochannel saturated with water, the pore size has a great influence on the diffusion ability of methane gas. As the pore size increases, the diffusion coefficient increases exponentially, which is basically consistent with the diffusion law of single-phase gas. But comparing the changing course of diffusion coefficients with pore size for the two, when the pore size is less than 10 nm, compared with the single-phase gas flow, the downward trend of the gas diffusion coefficient under water condition is relatively gentle, from 3.40 × 10⁻⁶ cm2/s to 3.11 × 10⁻⁶ cm2/s, decreased by about 8.5%, indicating that when the pore size is less than 10 nm, the influence of water saturation on diffusion is small. When the pore size is larger than 10 nm, the downward trend of gas diffusion coefficient becomes steeper, from 1.46 × 10⁻⁵ cm2/s to 6.68 × 10⁻⁶ cm2/s, decreased by about 55%, indicating that when the pore size is larger than 10 nm, the effect of water saturation on diffusion is greater with the increase of pore diameter.
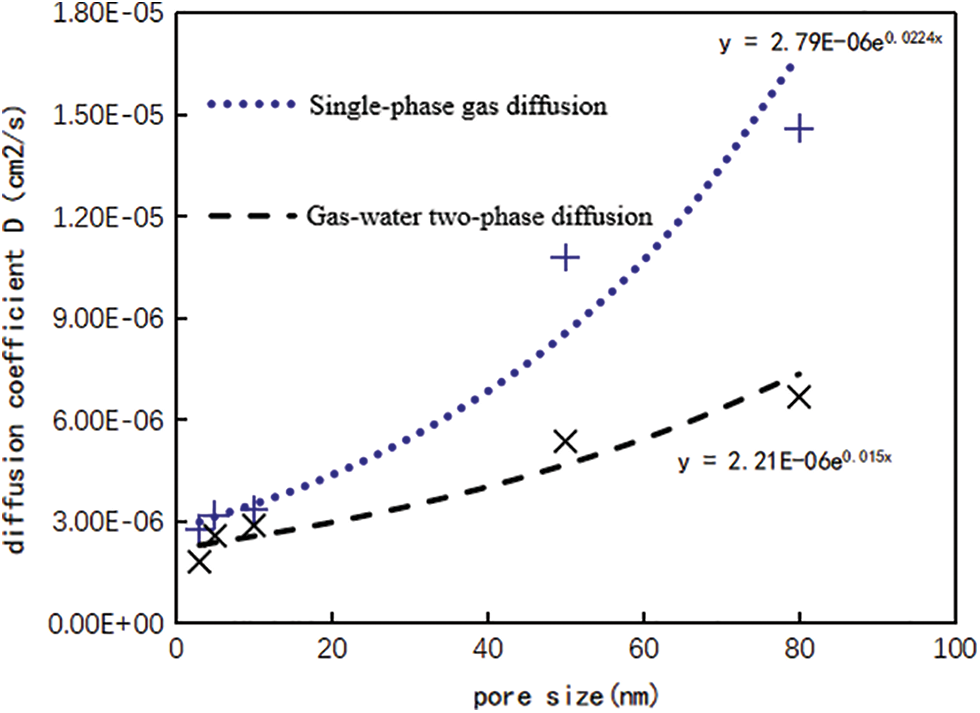
Figure 3: Diffusion coefficients corresponding to different pore size
3.2 Study on the Effect of Water Content on the Diffusion Coefficient
The main source of gas production in the production process of shale gas wells is the free gas in the reservoir matrix [26]. However, shale gas reservoirs usually have the phenomenon of ultra-low water saturation (original reservoir water saturation is lower than flow-bound water saturation) [27], in the process of fracturing, water in the fracturing fluid will imbibe into the matrix relatively easily, resulting in a rise in water saturation in the shale reservoir, which creates additional resistance to gas flow, reducing gas flow capacity and preventing free gas production in pores, the influence of water saturation on the shale gas flow capacity cannot be ignored. In order to accurately evaluate the influence of water saturation on methane gas flow, according to the peak value of pore diameter of the main shale layer in Fuling area, Sichuan Province is between 2 and 3 nm [28], molecular membrane with different water saturation (0%, 20%, 50%, 70%) and the same pore size (3 nm) were prepared to test the diffusion ability of methane gas in this experiment. Here, the diffusion coefficient of methane gas is used to measure the flow ability of methane molecules under different water saturation conditions in the experiment. According to the above experimental steps and data processing methods, the relationship curves between cumulative diffusion time t and
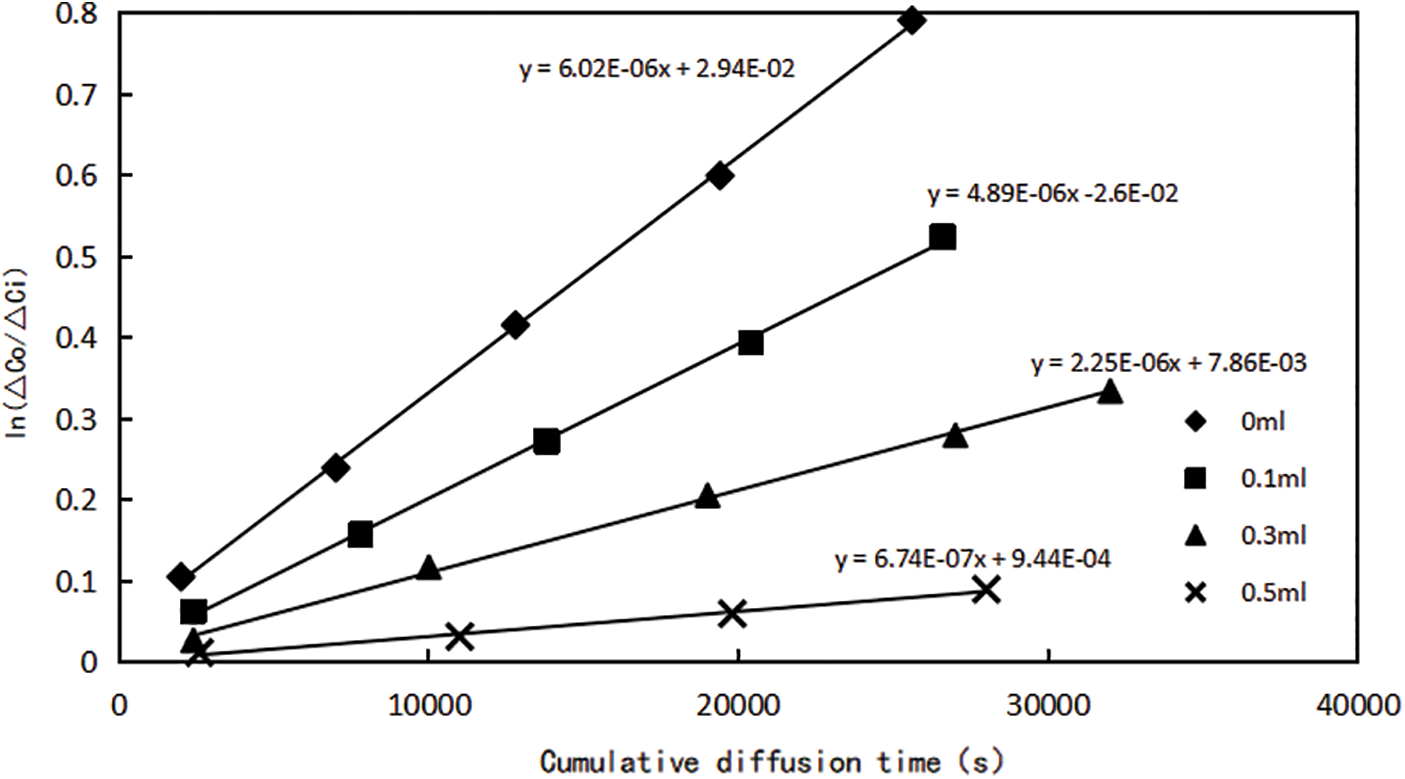
Figure 4: Relationship between cumulative diffusion time and ln (△C0/△Ci) of molecular membranes with different water saturation
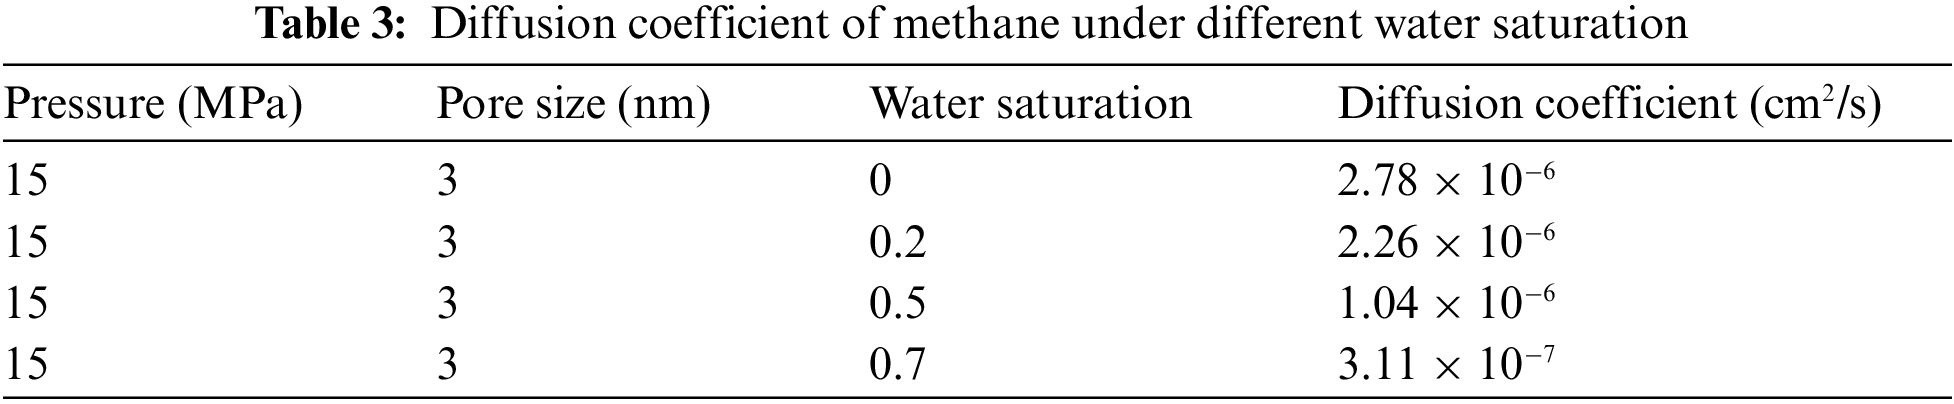
The DE values under each each water saturation can be obtained according to Fig. 4, and the diffusion coefficient of methane gas under different water saturation can be further calculated, as shown in Table 3. It can be found that with the increase of water saturation, the flow capacity of methane gas decreases significantly. The diffusion coefficient of methane gas is 3.11 × 10⁻⁷ cm2/s at water saturation 70%, and the diffusion coefficient is 2.78 × 10⁻⁶ cm2/s when reduced to water saturation 0, which increased by nearly an order of magnitude. When the nanopore contains water, whether exist on the pore surface in the form of bound water or free water in the pore will reduce gas flow capacity in the pore channel.
According to Table 3, the diffusion coefficient curves corresponding to different water saturation are drawn under the temperature and pressure system of 70°C and 15 MPa, as shown in Fig. 5. The diffusion coefficient of methane decreases with the increase of water saturation, and when the water saturation is greater than 20%, there is a significant decrease. According to Sun’s research results [29], methane and water have different density distribution curves under different water saturation. When water saturation is low, the density of water molecules in the center of the pore is close to 0, and all water molecules are adsorbed on the pore surface. When water saturation is high, water molecules gradually occupy the adsorption sites on the pore wall, and the density of water molecules in the pore gradually increases, methane molecules converge towards the center of the pore due to its hydrophobicity. Therefore, when the water saturation is lower than 20%, water in the nanochannel will exist on the surface of the pore wall in the state of bound water, which leads to the reduction of the radius of the gas flow channel and the decrease of the diffusion coefficient, but has little effect on the methane gas flow capacity. However, when the water saturation increases to 20% (the water saturation at this point is the critical water saturation), there is more and more free water, and part of the water gradually occupies the flow channel, the existence of water reduces the flow range of methane gas and greatly reduces the flow capacity. In addition, the relationship curve between the diffusion coefficient of methane gas and water saturation in Fig. 5 is fitted, and it is found that the the change trend of the relationship curve between the two is roughly linearly decreasing. Under the temperature and pressure system of 70°C and 15 MPa, the relational expression between different water saturation and the corresponding diffusion coefficient is:
In Eq. (2): D-The diffusion coefficient of CH4 in 3 nm pores when the temperature is 70°C and the pressure is 15 MPa, cm2/s; X-The water saturation.
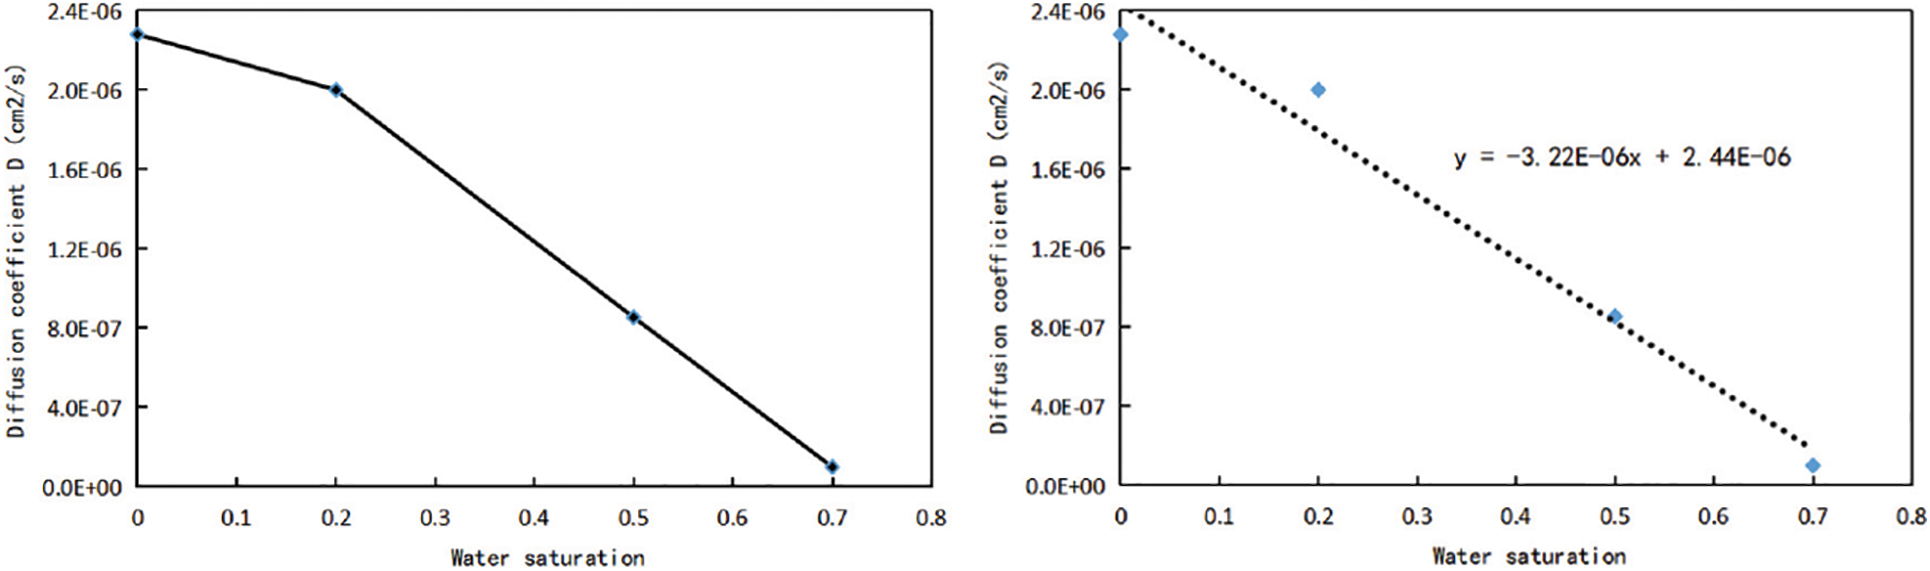
Figure 5: Relationship curve of diffusion coefficient corresponding to different water saturation
4.1 Calculation of Diffusion Flux
In the actual production process of shale gas wells, the flow of shale gas from the formation into the wellbore needs to go through the process from matrix to fracture and then from fracture to wellbore, as shown in the Fig. 6. This experiment mainly simulates the process of shale gas migration from matrix to fracture. Due to the abnormally low permeability of nanopores in the reservoir matrix, the propagation speed of pressure drop is very slow. Compared with the matrix, fractures have higher permeability, With the gradual development of shale gas wells, the pressure drop propagation velocity in the two seepage zones will be significantly different, and the pressure difference between the matrix and the fracture will continue to expand [30,31]. Based on the experimental results, the diffusion flux under different concentration gradient and different water saturation is further calculated.
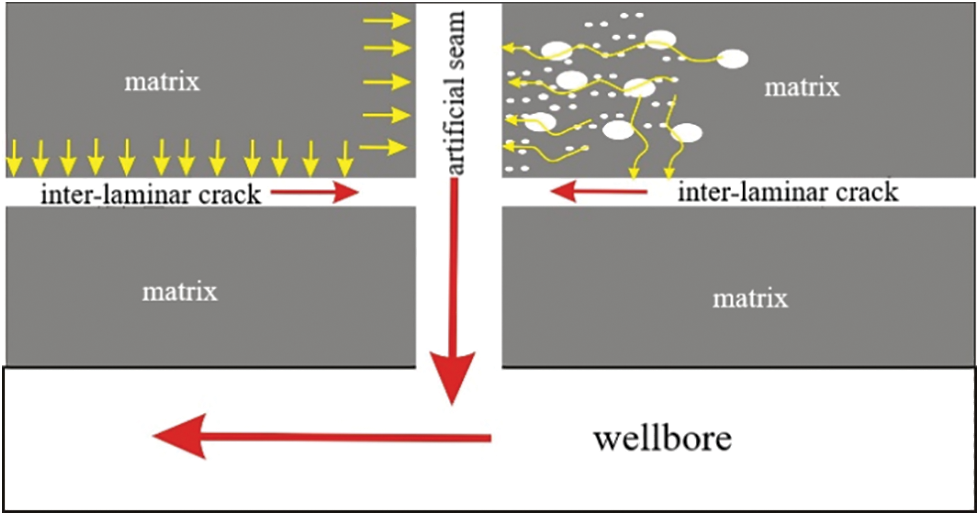
Figure 6: Schematic diagram of flow stage division of shale gas staged fracturing horizontal well
According to Fick’s first law, the relational expression between diffusion flux and diffusion coefficient, concentration gradient is:
In Eq. (3): DA-Methane diffusion coefficient, m2/s; JA-Methane diffusion flux, mol/m2⋅s; dCA/dx-Methane concentration gradient along the diffusion direction, mol/m3⋅m.
In the matrix system:
In the fracture system:
Volume concentration difference between matrix and fracture:
where Pmatrix-Pressure in matrix system, MPa; Pfracture-Pressure in fracture system, MPa; Vmatrix-Volume in matrix system, m3; Vfracture-Volume in fracture system, m3; nmatrix-Gas mass in matrix system, mol; nfracture-Gas mass in fracture system, mol; Z-Compression factor of methane gas, dimensionless; R-Universal gas constant, 8.314 × 10⁻⁶ MPa⋅m3/(mol⋅K); T-As reservoir temperature, K.
The concentration gradient of methane along the diffusion direction can be calculated by combining Eqs. (5)–(8).
where L-The distance in the direction of methane diffusion, m.
The calculated volume concentration difference between matrix and fracture and DA (obtained from the experimental test) are brought into Eq. (3) to obtain the methane diffusion flux JA.
When Eq. (3) and the diffusion coefficient DA (obtained from the experimental test) were used to calculated the diffusion flux, the following aspects should be paid attention to DA obtained by the experimental test mainly refers to the diffusion coefficient of bulk gas in the micro-nano pores. The diffusion flux calculated using Eq. (3) is the diffusion flux of the bulk gas. Majumder [32] maintained that the gas transport mechanism in shale reservoirs mainly includes bulk gas transport and adsorbed gas surface diffusion. Wu [33] proposed that in shale reservoirs with pores diameter less than 2 nm, surface diffusion contributes to gas transmission as much as 92.95%. While in shale reservoirs with pores diameter larger than 50 nm, the contribution of surface diffusion was lower than 4.39%, and surface diffusion could be ignored. Therefore, when the diffusion coefficient DA (obtained by the experiment) is used to calculate the diffusion flux of shale reservoir with pores diameter less than 50 nm, the mass flux obtained by Eq. (3) represents the bulk gas diffusion flux. If you want to calculate the total diffusion flux of shale gas you have to add the mass flux of surface diffusion.
4.2 Effect of Water Saturation on Gas Production of Gas Well in Actual Reservoir
The experimental results can be applied to gas well production, the productivity evaluation method is established according to the characteristics of diffusion seepage, and the productivity scale is calculated when the fracturing scale is determined. Taking formation pressure 15 MPa, average pore diameter 3 nm, formation temperature 70°C, fracture spacing 100 m, cluster spacing 8 m, half fracture length 200 m, fracture height 40 m, fracturing 15 sections.
Since the diffusion flux represents the amount of gas passing through a unit cross-sectional area in a unit time, the gas production Q of a shale gas well in the actual production process can be calculated.
In Eq. (10): Q is the gas production of shale gas well, m3/d; A is the contact area between matrix and fracture, m2; t is the production time of gas well, s; Vm is the gas molar volume of methane under standard conditions, 2.24 × 10⁻² m3/mol.
According to the above Eqs. (3), (9) and (10), the gas well production produced by FICK diffusion under different pressure difference can be calculated, and the relationship curves of diffusion flux, gas production and pressure difference under different water content saturation can be obtained, which are shown in Figs. 7 and 8.
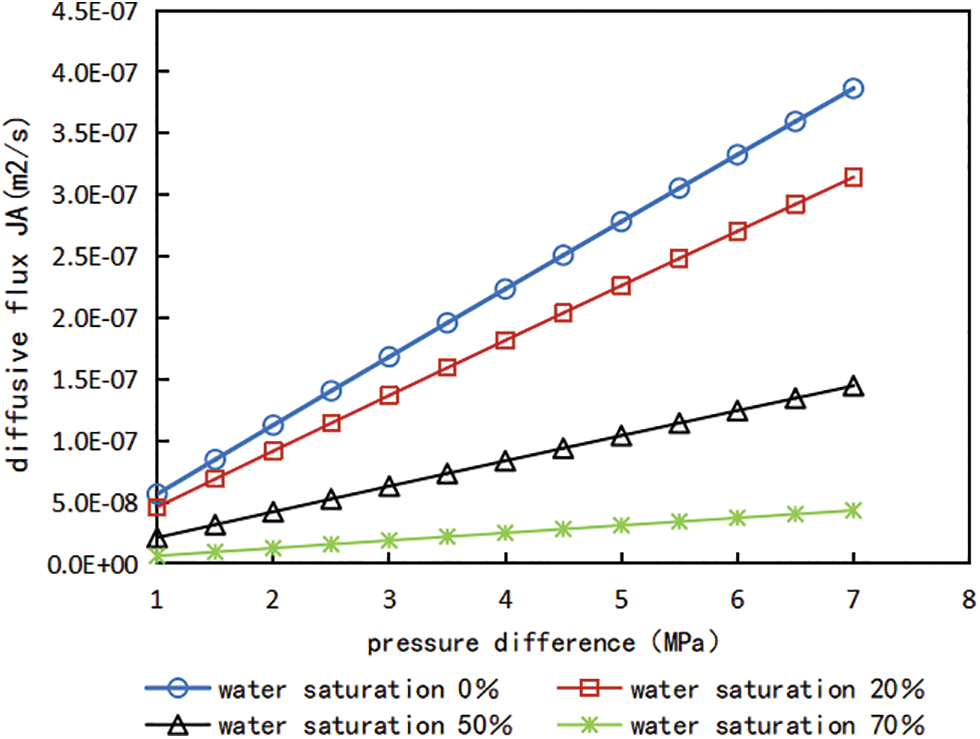
Figure 7: Relationship curve between pressure difference and diffusion flux under different water saturation conditions
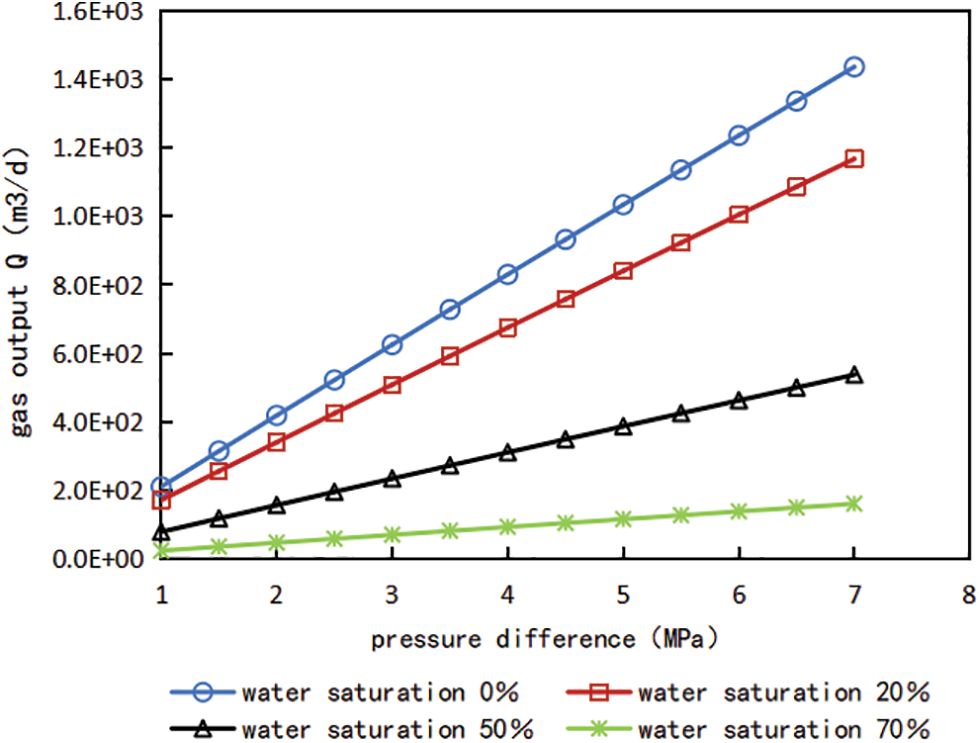
Figure 8: Relationship curve between pressure difference and gas production under different water saturation conditions
It can be seen from Figs. 7 and 8 that water saturation has a significant impact on shale gas flow capacity and gas production of gas Wells. The gas production of gas wells under different water saturation is simulated and calculated, compared with no water, the gas production decreased by 18.7% when the water saturation was 20%; gas production decreased by 60.8% when the water saturation was 50%. For developed shale gas reservoirs, the original water saturation is usually lower than the bound water saturation, but after fracturing the shale reservoir, the large retention of fracturing fluid leads to the increase of water saturation of shale reservoir, and the rising water saturation generally exceeds the critical water saturation. Therefore, the influence of water saturation must be considered when calculating shale gas production, and in the actual production, it is crucial for shale gas production to flowback as soon as possible, improve gas flow channels and reduce the influence of water saturation on gas production. In addition, refer to the change trend of the relationship curves between pressure difference and gas production, it is found that the with the pressure difference between the matrix and the fracture increases gradually, gas production also increase linearly accordingly.
(1) Compared to the flow of a single-phase gas at the nanometer scale, when methane diffuses in the nano-channel after saturated water, the gas flow capacity decreases and the diffusion coefficient decreases.
(2) The pore size of the flow channel has a great influence on the diffusion ability of methane, and as the pore size increases, the diffusion coefficient increases exponentially. When the pore size is greater than 10 nm, with an increase in pore diameter, water saturation has a greater influence on gas diffusion.
(3) After fracturing, it is relatively easy for the fracturing fluid to enter the reservoir space of the shale matrix, resulting in an increase in water saturation in the reservoir, which has a significant impact on the gas diffusion coefficient, diffusion flux and gas production of gas wells. In the fracturing fluid flowback stage, when the water saturation decreases from 50% to 0, the gas well productivity increases by approximately 60%.
Funding Statement: This publication is based on work supported by the Science and Technology Innovation Foundation of CNPC “Multiscale Flow Law and Flow Field Coupling Study of Tight Sandstone Gas Reservoir” (2016D-5007-0208), and 13th Five-Year National Major Project “Multistage Fracturing Effect and Production of Fuling Shale Gas Horizontal Well Law Analysis Research” (2016ZX05060-009).
Conflicts of Interest: The authors declare that they have no conflicts of interest to report regarding the present study.
References
1. Liu, D. H., Cheng, L., Sun, J., Sun, J., Zhang, B. Q. et al. (2021). Shale reservoir pan connectivity characteristics and gas occurrence mode. Acta Petrolei Sinica, 42(9), 1192–1201. [Google Scholar]
2. Wu, K., Li, X. F., Chen, Z. X. (2016). Microscale effect of shale gas organic matter nanopore gas transmission. Natural Gas Industry, 36(11), 51–64. [Google Scholar]
3. Du, D. F., Zhang, Y. Z., Zhang, L. N., Liu, X., Xu, M. R. (2021). Research progress and prospect of shale gas reservoir seepage mechanism. Unconventional Oil and Gas, 8(3), 1–9. [Google Scholar]
4. Fathi, E., Akkutlu, I. Y. (2013). Lattice Boltzmann method for simulation of shale gas transport in kerogen. SPE Journal, 18(1), 27–37. [Google Scholar]
5. Huang, W. J., Liu, D. H., Sun, J., Zhu, X., Yan, X. (2020). Flow and diffusion laws of shale gas in micro nano pores. Science, Technology and Engineering, 20(14), 5583–5588. [Google Scholar]
6. Chen, L., Hu, Z. M., Xiong, W., Duan, X. G., Chang, J. (2020). Shale gas diffusion experiment and mathematical model. Natural Gas Geoscience, 31(9), 1285–1293. [Google Scholar]
7. Huang, T., Tan, W., Zhuang, Q., Wang, G. S., Yin, T. T. (2019). New research on the coupling model of gas transport through nanopores in shale reservoirs. Journal of Southwest Petroleum University, 41(2), 118–126. [Google Scholar]
8. Wu, K., Li, X., Wang, C., Yu, W., Chen, Z. (2015). A model for surface diffusion of adsorbed gas in nanopores of shale gas reservoirs. Offshore Technology Conference, OnePetro. [Google Scholar]
9. Zhang, P. Q. (2019). Influence of fracturing fluid on oil and gas migration characteristics and simulation research (MA Thesis). Tianjin University of Science and Technology, China. [Google Scholar]
10. O’Malley, D., Karra, S., Currier, R. P., Makedonska, N., Hyman, J. D. et al. (2019). Where does water go during hydraulic fracturing? Groundwater, 54(4), 488–497. [Google Scholar]
11. Wu, K., Xiong, W., Hu, Z. M., Gao, S. S. (2018). Experimental study on the influence of different water saturation on shale seepage capacity. Research and Exploration in Laboratory, 37(7), 32–35. [Google Scholar]
12. Hu, Z. M., Duan, X. G., He, Y. B., Wu, J. F., Chang, J. et al. (2018). The impact of reservoir primary water on shale gas occurrence and flow capacity. Natural Gas Industry, 38(7), 44–51. [Google Scholar]
13. Hu, X. (2017). Study on flow characteristics of single phase and two phase fluids at micro nano scale (MA Thesis). Zhejiang Ocean University, China. [Google Scholar]
14. Li, Y. M., Chen, X., Jiang, Y. S., Wu, L., Zhou, W. W. et al. (2019). Gas water two-phase productivity analysis of shale reservoir fracturing horizontal wells. Petroleum Geology and Recovery Efficiency, 26(3), 117–122. [Google Scholar]
15. Guo, X. Z., Wang, J., Liu, X. F. (2016). Gas water two-phase flow model for fractured horizontal wells in shale gas reservoirs. Acta Petrolei Sinica, 37(9), 1165–1170. [Google Scholar]
16. Penny, G. S., Pursley, J. T., Clawson, T. D. (2006). Field study of completion fluids to enhance gas production in the Barnett Shale. SPE Gas Technology Symposium, OnePetro. [Google Scholar]
17. Kang, Y. L., Zhang, X. Y., You, L. J., Chen, Q., Zhang, S. J. et al. (2017). Experimental study on natural flowback of shale gas reservoirs to mitigate water phase trap damage. Natural Gas Geoscience, 28(6), 819–827. [Google Scholar]
18. Ghanbari, E., Dehghanpour, H. (2016). The fate of fracturing water: A field and simulation study. Fuel, 163, 282–294. [Google Scholar]
19. Shen, Y., Ge, H., Zhang, X., Chang, L., Liu, D. et al. (2018). Impact of fracturing liquid absorption on the production and water-block unlocking for shale gas reservoir. Advances in Geo-Energy Research, 2(2), 163–172. [Google Scholar]
20. Cai, J., You, L., Hu, X., Wang, J., Peng, R. (2012). Prediction of effective permeability in porous media based on spontaneous imbibition effect. International Journal of Modern Physics C, 23(7), 1250054. [Google Scholar]
21. You, L., Zhou, Y., Kang, Y., Yang, B., Cui, Z. et al. (2019). Fracturing fluid retention in shale gas reservoirs: Mechanisms and functions. Arabian Journal of Geosciences, 12, 1–17. [Google Scholar]
22. Hao, Y. Z., Lu, D. T., Jia, X. T., Li, P. C. (2018). Molecular dynamics simulation of gas water mixed flow in shale nano pores. Science China-Physics, Mechanics & Astronomy, 48(9), 267–276. [Google Scholar]
23. Hao, Y. Z. (2018). Molecular simulation of gas water adsorption and flow in shale nano pores (Ph.D. Dispersion). University of Science and Technology of China, China. [Google Scholar]
24. Clarkson, C. R., Solano, N., Bustin, R. M., Bustin, A. M. M., Chalmers, G. R. L. et al. (2013). Pore structure characterization of North American shale gas reservoirs using USANS/SANS, gas adsorption,and mercury intrusion. Fuel, 103, 606–616. [Google Scholar]
25. Sun, J., Liu, D., Zhu, X., Huang, W., Chen, L. (2021). Experimental investigation on shale gas transport characteristics in nanopores under high temperature and high pressure. International Journal of Oil, Gas and Coal Technology, 26(3), 302–325. [Google Scholar]
26. Fang, S., Sun, J., Liu, D., Yao, Z., Nie, B. (2021). Experimental study on spontaneous imbibition characteristics of fracturing fluid at cores from different layers in fuling shale gas reservoir. Geofluids, 2021, 1–12. [Google Scholar]
27. Li, J., Li, X. F., Chen, Z. X., Wang, X. Z., Wu, K. L. et al. (2018). Gas permeability model under the influence of irreducible water in shale reservoir. Petroleum Science Bulletin, 3(2), 167–182. [Google Scholar]
28. Yang, W. X., Li, J. Q., Zhao, J. Y., Huang, Z. H. (2018). Qualitative and quantitative study on the micro pore structure of Longmaxi Formation shale in Fuling area, Sichuan Basin. Petroleum Experimental Geology, 40(1), 97–102. [Google Scholar]
29. Sun, Z. G. (2019). Study on flow mechanism of shale gas in micro nano pores under multiphase coexistence (MA Thesis). China University of Petroleum, China. [Google Scholar]
30. Guo, X. Z., Li, J., Zhang, X. (2017). Establishment of material balance model for fracturing horizontal wells in shale gas reservoirs. Journal of Southwest Petroleum University, 39(2), 132–138. [Google Scholar]
31. Li, Y. M., Yao, F. S., Zhao, J. Z., Zhang, X. P. (2013). Research on micro percolation dynamics of nano pores in shale gas reservoirs. Science, Technology and Engineering, 13(10), 2657–2661. [Google Scholar]
32. Majumder, M., Chopra, N., Hinds, B. J. (2011). Mass transport through carbon nanotube membranes in three different regimes: Ionic diffusion and gas and liquid flow. ACS Nano, 5(5), 3867–3877. [Google Scholar] [PubMed]
33. Wu, K., Li, X., Guo, C., Wang, C., Chen, Z. (2016). A unified model for gas transfer in nanopores of shale-gas reservoirs: Coupling pore diffusion and surface diffusion. SPE Journal, 21(5), 1583–1611. [Google Scholar]
Cite This Article
 Copyright © 2023 The Author(s). Published by Tech Science Press.
This work is licensed under a Creative Commons Attribution 4.0 International License , which permits unrestricted use, distribution, and reproduction in any medium, provided the original work is properly cited.
 Downloads
 Citation Tools