
 Submit a Paper
 Propose a Special lssue
 Open Access
ARTICLE
Study on Intermittent Discharge Characteristics of Typical Solid Insulation Defects in Gas Insulated Switchgear
1 Nanrui Group (State Grid Electric Power Research Institute) Co., Ltd., Nanjing, 211006, China
2 Wuhan Nari Limited Liability Company of State Grid Electric Power Research Institute, Wuhan, 430074, China
* Corresponding Author: Guozhi Zhang. Email:
Energy Engineering 2023, 120(9), 2115-2132. https://doi.org/10.32604/ee.2023.027198
Received 18 October 2022; Accepted 27 December 2022; Issue published 03 August 2023
 View Full Text
 Download PDF
Abstract
In response to the problem of frequent leakage and false alarm of partial discharge insulation defects in GIS, this paper conducts experimental research on intermittent discharge characteristics of common solid insulation defects in GIS. Using true GIS to build a multi-source testing platform for intermittent discharge of solid insulation defects, and using pulse current method, ultra-high frequency method, ultrasonic method, and gas characteristic component detection method to study the variation law of intermittent discharge characteristics of solid insulation defects. The results show that: the intermittent discharge state of metal fouling defects on the solid insulation surface decreases with the extension of the discharge time, the discharge time interval as a whole shows an increasing trend, and the metal fouling defects on the solid insulation surface in the intermittent discharge state is difficult to develop into a breakdown discharge fault. The overall discharge amount of air gap defects inside solid insulation also shows the law of increasing first and then decreasing, and the discharge amount of air gap defects inside solid insulation stays at a large level for a long time during intermittent discharge, and there is a risk of breakdown, and the discharge will gradually evolve into continuous discharge; ultrasonic method and characteristic component detection method cannot realize the effective perception of intermittent discharge of metal fouling. The 50-period mapping information commonly used in the power field cannot reflect the intermittent discharge variation law of solid insulation, and the 200-period UHF mapping composed of four groups of 50-period UHF mapping data can initially derive the intermittent discharge distribution law of solid insulation defects. The research results of this paper are of great significance to expand the knowledge of intermittent discharge characteristics and the detection of GIS discharge defects in the field.Keywords
Gas Insulated Switchgear (GIS) has been widely used in power systems because of its small footprint, flexible and convenient installation, and good insulation performance [1–3]. Although GIS is generally considered to be less maintenance or even maintenance-free, according to decades of GIS operation experience, some partial discharge (PD) insulation defects can not be avoided in the process of manufacturing, transportation, installation, maintenance, and operation, and the presence of PD insulation defects may lead to the occurrence of insulation faults, which may cause power outage accidents [4,5].
Now the researchers have done a lot of theoretical and experimental research on PD insulation defect detection technology [6,7], and the new high-voltage GIS are installed with detection systems, but the operation is not effective: the GIS PD online monitoring system has more false alarms and leakage problems [8]. To address this problem, the State Grid Corporation organized relevant technical experts to disassemble and fault analyze GIS, and concluded that intermittent discharge is the cause of false alarms and missed alarms, which is because the time interval between each discharge of intermittent discharge is much larger than the time interval of stable discharge, leading the traditional PD detection system to judge the intermittent discharge pulse signal as interference signal and ignore it [9].
At present, there is no clear definition of intermittent discharge, and no uniform standard for its discharge interval. Wang et al. [10] designed a defect model with metal foreign matter attached to the surface of GIS, the Ultra High Frequency (UHF) signal pattern characteristics and the variation of discharge interval under the long intermittent discharge were studied by applying a test voltage, which was slightly lower than the PD inception voltage Ui to the defect model. It was found that the discharge channels on the insulator surface showed significant growth, and the intermittency of the discharge was further enhanced; Zhang et al. [11] investigated the sparse characteristics of the discharge characteristics of metallic foreign bodies on the insulator surface, he found that the discharge intervals were widely dispersed and spanned from several seconds to several hours; Liu et al. [12] used the UHF method to monitor GIS for a long time, and finally found a typical intermittent PD signal for a solid insulation defect in GIS, meanwhile the defects are located based on the signal amplitude comparison method and the time difference positioning method, then, the type of discharge fault is judged according to the signal PRPD spectrum and positioning results. In contrast, the typical solid insulation defects common inside GIS lack the discharge law under intermittent discharge voltage, and the related research on the change law of multi-source characteristic signal generated by the discharge.
Based on this, this paper conducts a study on the change law of intermittent discharge signal of typical internal inter-gap and external metal fouling for the common solid insulation defects in GIS. And build a multi-source detection test platform for intermittent discharge of solid insulation defects using real 220 kV GIS, conducts long time intermittent discharge experiments. Using pulse current method, UHF method, ultrasonic method and characteristic component detection method to study the time and frequency domain characteristics of intermittent discharge signal, mapping characteristics, discharge time interval and discharge volume characteristics. In addition, the characteristic change law of gas characteristic components is also studied.
2 220 kV GIS Solid Insulation Defects Intermittent Discharge Multi-Source Detection System
In this paper, pulse current method, UHF method, ultrasonic method and chemical detection method are used to detect PD, and the multi-source detection test circuit of 220 kV true type GIS solid insulation defect intermittent discharge is built as shown in Fig. 1. Among them, T1 is the voltage regulator; T2 is the frequency test transformer without PD; Rr is the 4 kΩ protection resistor; C1 is the coupling capacitor, Z is the detection impedance, and the PD detection circuit with the coupling capacitor C1 and the detection impedance Z in series is established according to IEC60270 standard, and the PD pulse signal is collected through the detection impedance Z; C2/C3 is the voltage divider capacitor, and the frequency cycle signal is transmitted from the end of capacitor C3 through the coaxial cable line to the Tektronix high-performance digital oscilloscope (Tektronix*MS044, bandwidth 1.5 GHz, sampling frequency 6.25 GS/s); 220 kV GIS experimental chamber sealing flange is made of plexiglass, UHF sensor is placed in front of the outer surface of the plexiglass flange; ultrasonic sensor is attached to the GIS test chamber by ultrasonic coupling agent; the metal outer wall of the GIS test chamber is sealed by the ultrasonic conductive paste; In the experiment chamber, the experimental defective high voltage electrode and the pot insulator high voltage end inside the chamber are connected by a smooth and angular metal guide rod, ground electrode connected to external ground with metallic copper wire through a custom Plexiglas flange, the test chamber is filled with 0.5 MPa pure SF6 gas.

Figure 1: Schematic diagram of the test platform
Fig. 2 shows the physical diagram of metal fouling defects on the surface of solid insulation and air gap defects inside solid insulation. In Fig. 2a, multiple metal scraps are fixed to the insulator surface using epoxy resin adhesive, which is used as the metal fouling defect on the solid insulation surface, as a way to simulate the actual operation of the GIS process, disconnect switches or circuit breakers when the contact collision produces metal debris attached to the insulator surface due to the action of the electric field [13], and the metal fouling consists of 1, 1, and 0.5 mm size metal fouling in the length, width, and height. The solid insulation internal air gap defect model in Fig. 2b is placed between the high-voltage electrode and the ground electrode by pressing three layers of epoxy resin plates, which are glued together with epoxy resin adhesive [14], and a circular through-hole with a diameter of 3 mm is opened in the center of the middle layer of the epoxy plate, the total height of the epoxy plate model is 3 mm and the diameter is 90 mm, the electrodes and the epoxy plate are closely bonded together.

Figure 2: Physical map of metal contamination on the surface of insulators
2.2 Multi-Source Detection Sensor Characteristics and Detection Methods
The UHF sensor is used to detect the high-frequency electromagnetic wave signal radiated by PD [15–18], the UHF sensor used in this paper is a flexible elliptical monopole antenna developed by our team [19], and the operating band of the sensor is 300 MHz~3 GHz, VSWR (Voltage Standing Wave Ratio) <5 in the 300 MHz–3 GHz band, VSWR <2 in the 340 MHz–3 GHz band, the structure diagram and physical diagram of the sensor are shown in Fig. 3, and its VSWR curves for different bending degrees are shown in Fig. 4.
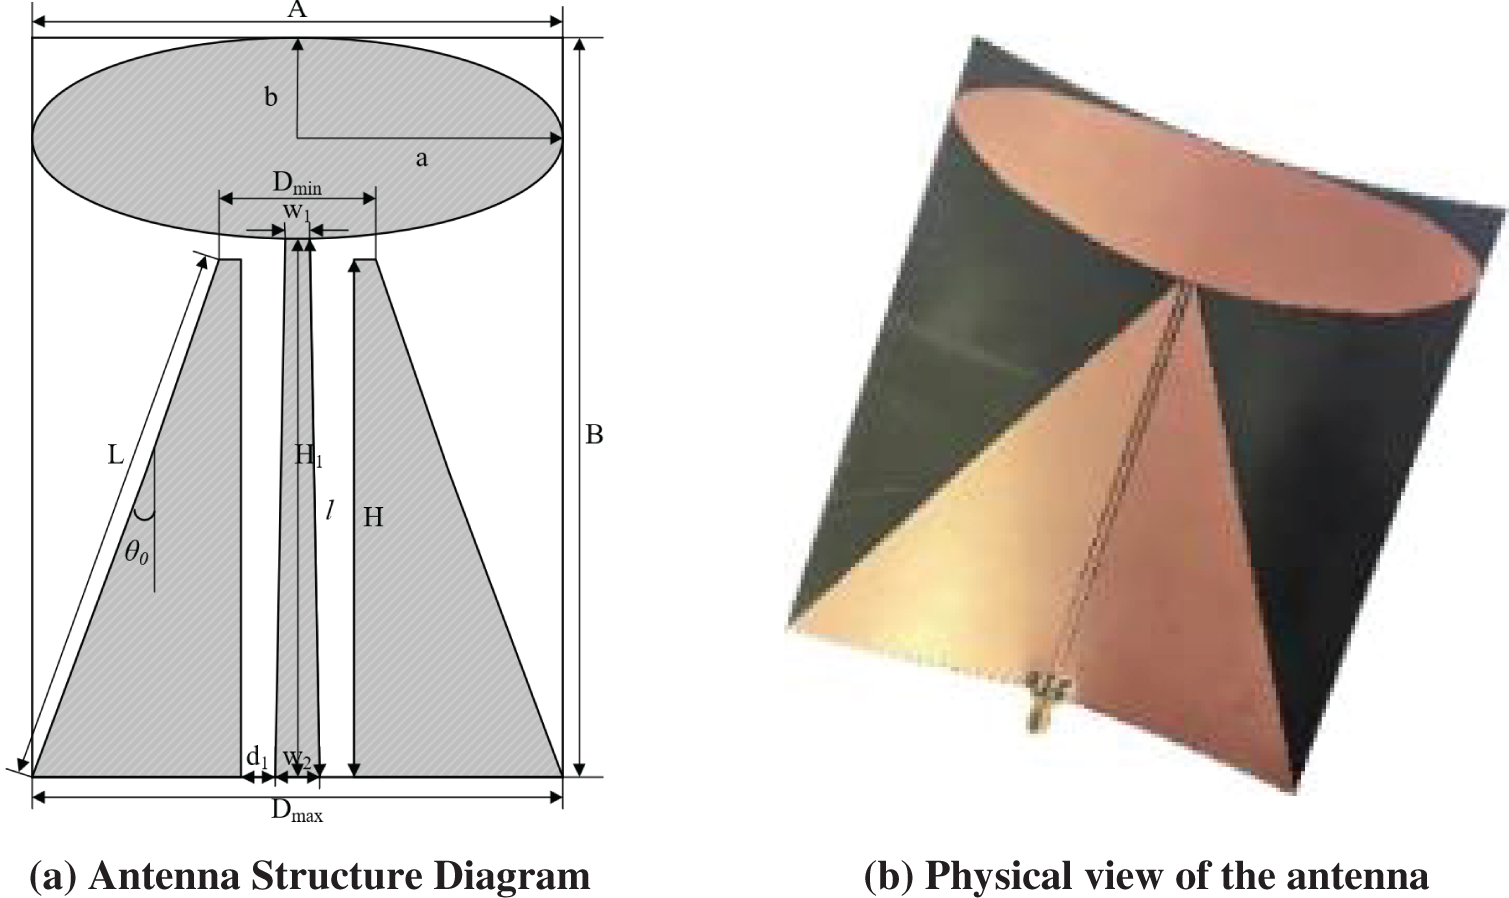
Figure 3: UWB elliptical monopole antenna

Figure 4: The VSWR of the UHF antenna
The ultrasonic method is a PD detection using ultrasonic sensors close to the shell of electrical equipment, and the ultrasonic detection is a non-electrical detection [20–22]. The ultrasonic sensor bandwidth used for this test is 25–530 kHz, with a resonant frequency of 140 ± 20% kHz, and the ultrasonic differential amplification module has three amplification multiples (20, 40, and 60 dB) to choose. The physical ultrasonic sensor is shown in Fig. 5.

Figure 5: Ultrasonic sensor
2.2.3 Chemical Gas Detection Method
The chemical detection method also belongs to a kind of non-electrical measurement method, which is not subject to electromagnetic interference [23–25]. For 220 kV GIS without a special gas extraction port, this paper improves the filling/discharging port, and designs a gas extraction device that can support the filling/discharging port of the test chamber with a valve and good sealing performance, as shown in Fig. 6 below. Control the gas collection port valve can collect the gas after the discharge test to the matching gas collection bag in small doses, and use GCMS (gas chromatography-mass spectrometry) to qualitative and quantitative analysis of the characteristic gas after SF6 decomposition.

Figure 6: Genuine GIS intake device
Firstly, the test platform was built according to the circuit shown in Fig. 1, and PD inception voltage Ui of the defect model was reached by the successive boosting method; then the test voltage was slowly reduced until the continuous discharge disappeared, keeping the test voltage constant, and the test was continued for 48 h. During the test, the pulse current signal (corresponding to the discharge maganitude information), UHF signal, ultrasonic signal and phase signal are counted every 8 h and analyzed by graphs. After the test, the gas was collected by the gas extraction port above the GIS, and the components of SF6 decomposition gas and its concentration are measured by GCMS to obtain the internal intermittent discharge of the GIS. The test flowchart is shown in Fig. 7.

Figure 7: Test flowchart
3 Analysis of Experiment Results
3.1 Intermittent Discharge of Solid Insulation Defects
The circuit was calibrated with a 50 pC standard pulse generator before the experiment, and the 50 Ω port impedance calibration result on the oscilloscope corresponded to a pulse current detection signal amplitude of 18 mV.
(1) Intermittent discharge of insulator surface fouling insulation defects
First of all, the intermittent discharge test is performed on the metal fouling defects on the solid insulation surface by using the step-up method. The test voltage is 22.8 kV, and the voltage is considered to be the PD inception voltage of the defect when a stable continuous discharge signal is detected by the pulse current method. The average amplitude of the pulse current signal is 8.77 mV, corresponding to the average discharge volume of 24.3 pC, and 50 frequency cycles of pulse current signal under the voltage level were collected for discharge mapping analysis, the results are shown in Fig. 8. It can be seen that the number of discharge pulses is high and the phase distribution of discharge pulses has the typical characteristics of metal fouling on the insulator surface [26], which shows that the discharge in this state is stable.

Figure 8: 50-cycle pulsed spectrum of initial discharge of metal contamination on the surface of the insulator
Under the same test environment, the test voltage is reduced to 21.2 kV, the number of discharges per unit time is significantly reduced, and it is difficult to detect the discharge pulse current signal in one working frequency cycle, the average pulse current amplitude is 5.5 mV, corresponding to an average discharge volume of about 15.2 pC, the discharge pulse current signal of 50 working frequency cycles under the intermittent discharge of this state is collected and analyzed in the plot, and the corresponding plot is shown in Fig. 9 below, it is obvious that the number of discharge pulses under this state is small and the discharge is sparse, the discharge characteristics in this case can easily be considered as interference signals.
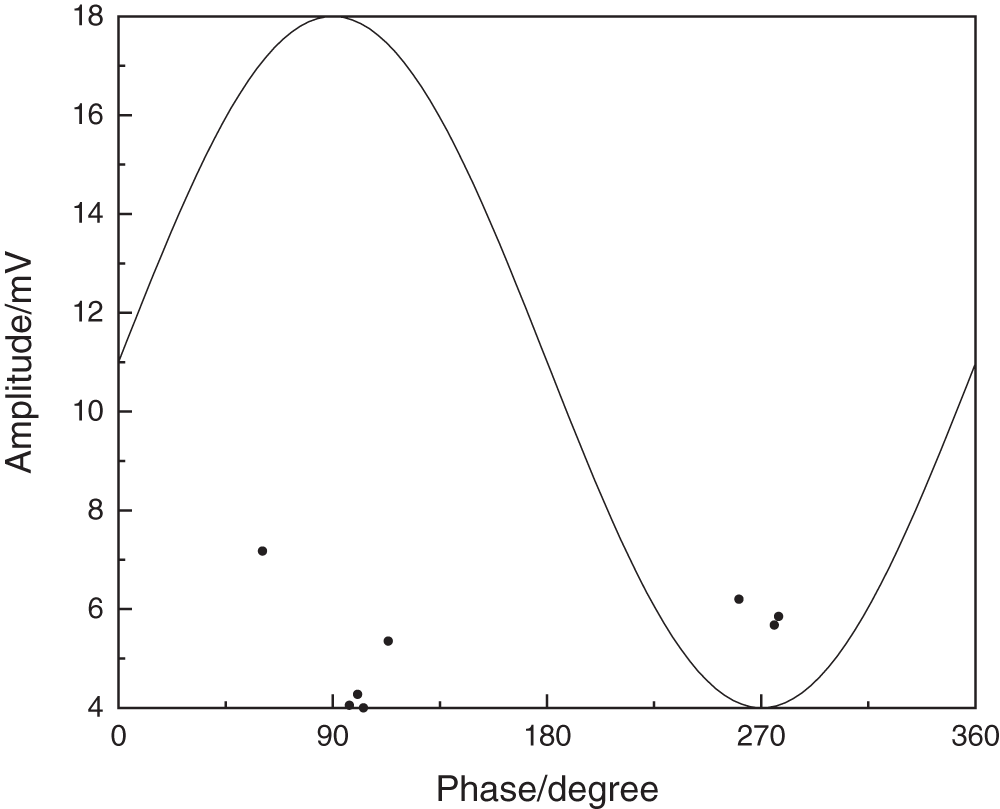
Figure 9: 50-cycle pulsed spectrum of intermittent discharge of metal contamination on the surface of the insulator
(2) Intermittent discharge of air gap defects within solid insulation
The intermittent discharge test was performed on the internal air gap defects of solid insulation, and the test procedure is the same as the above-mentioned intermittent discharge test procedure for surface fouling defects of insulators. When the test voltage rose to 5.5 kV, a stable continuous discharge signal was detected by the pulse current method, and the air gap defects inside the solid insulation were in a continuous discharge state. The average amplitude of the corresponding pulse current signal was about 19.8 mV, and the average discharge was 54.8 pC. 50 cycles of pulse current signals at this voltage level were collected for pulse discharge mapping analysis. The results were shown in Fig. 10. It can be seen that the discharge of air gap defects inside the solid insulation at the test voltage of 5.5 kV was a continuous discharge state.

Figure 10: 50-cycle pulsed spectrum of initial discharge of air gap defect
The average pulse current amplitude was 15.7 mV, corresponding to an average discharge volume of about 43.5 pC. The discharge pulse current signal of 50 cycles of intermittent discharge in this state was collected and plotted. The corresponding spectrum is shown in Fig. 11 below. Compared with the continuous discharge state of air gap defects inside the solid insulation, the intermittent discharge phase distribution is more dispersed, the discharge is more sparse, and the discharge pulse amplitude is also larger.
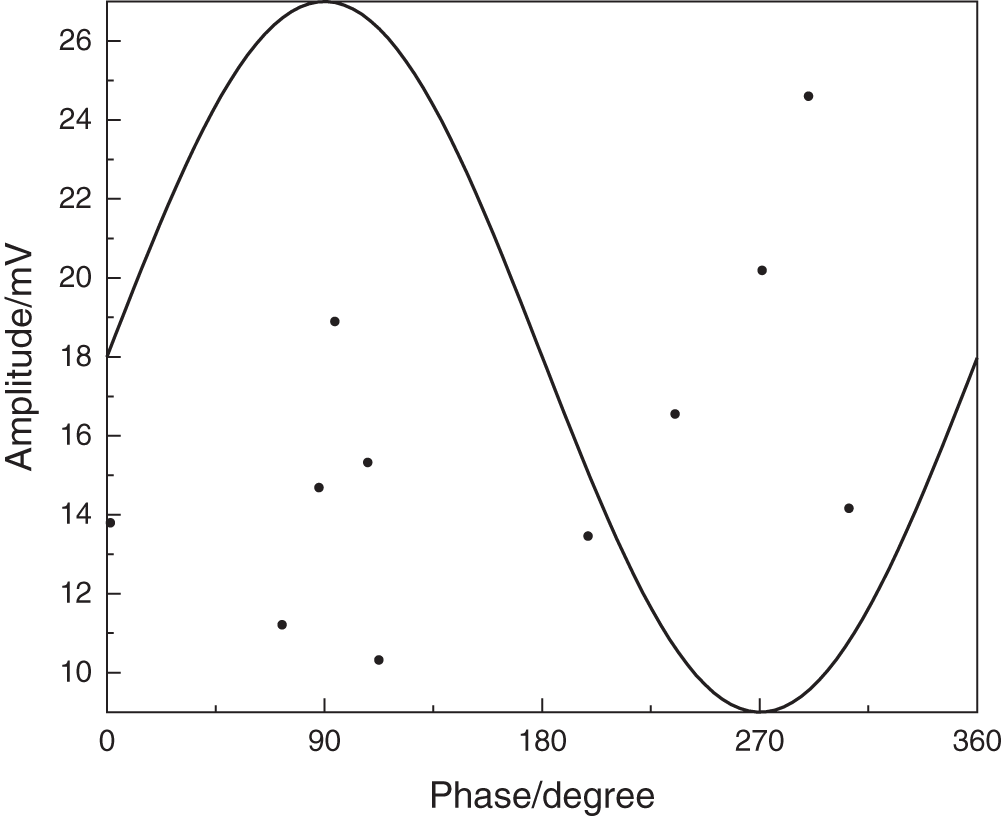
Figure 11: 50-cycle pulsed spectrum of intermittent discharge of initial discharge of air gap defect
3.2 Analysis of Intermittent Discharge UHF and Ultrasonic Signals of Solid Insulation Defects
Under the intermittent discharge test conditions determined in Subsection 2.1, the intermittent discharge test of metal fouling defects on the surface of solid insulation and air gap defects inside solid insulation were carried out, and the intermittent discharge UHF signals and ultrasonic signals obtained during the tests are shown in Figs. 12 and 13.

Figure 12: UHF time-domain diagram of intermittent discharge of defects

Figure 13: Ultrasonic time-domain diagram of intermittent discharge of defects
It can be seen from Fig. 12 that the UHF sensor can effectively detect the discharge signals of metal fouling defects on the surface of solid insulation and air gap defects inside solid insulation in the case of intermittent discharge, indicating that the UHF method can be used as an effective detection means to detect intermittent discharge of solid insulation defects.
From Fig. 13, it can be seen that the ultrasonic sensor has limited sensitivity to detect the ultrasonic signal generated by intermittent discharge of solid insulation defects, and cannot detect the ultrasonic signal generated by intermittent discharge of defects. This is because the ultrasonic signal attenuation in SF6 is large, the attenuation coefficient is 26 dB/m (nearly 20 times of the attenuation coefficient in air or oil), and the ultrasonic signal generated by intermittent discharge first passes through SF6 gas and then reaches the ultrasonic sensor through the metal shell [27]. In these tests, the ultrasonic sensor is attached to the outer wall of the test chamber, the distance from the PD source is about 200 mm, and the intermittent discharge energy is small and the radiated ultrasonic signal is weak, which makes it difficult to detect the ultrasonic signals generated by the intermittent discharge of solid insulation defects.
3.3 Statistical Analysis of UHF Signal Frequency Domain and Plot of Intermittent Discharge of Solid Insulation Defects
(1) Frequency domain analysis of UHF signals
The spectrum analysis of intermittent discharge UHF signal of solid insulation defects is shown in Fig. 14, where Fig. 14a shows the frequency domain characteristics of background noise, Fig. 14b shows the frequency domain characteristics of intermittent discharge UHF signal of metal fouling defects on the surface of solid insulation, and Fig. 14c shows the frequency domain characteristics of intermittent discharge UHF signal of air gap defects inside solid insulation.

Figure 14: Frequency domain diagram of the interference signal and UHF signal of solid insulation defect discharge
As can be seen from Fig. 14a, the main frequency points of the background noise signal are at 900 MHz and 1.8 GHz, which correspond to the signals of communication interference [28]. From Figs. 14b and 14c, it can be seen that the main frequency band of intermittent discharge UHF signal of insulator surface fouling insulation defects is concentrated above 900 MHz, and the solid insulation defects are concentrated in 300 MHz–900 MHz, compliant with the frequency range of UHF signals generated by PD (300 MHz–3 GHz), which indicates that the signals detected by the UHF sensor were generated by the intermittent discharge of insulation defects.
(2) Statistical analysis of UHF signal spectrum
The UHF spectrum of the solid insulation surface metal fouling defects and intermittent discharge was studied by the traditional 50 power frequency cycles, and the UHF spectrum of the intermittent discharge of the solid insulation surface metal fouling defects is shown in Fig. 15, the intermittent discharge of internal air gap defects of solid insulation is shown in Fig. 16, it can be seen that the UHF spectrum of the 50 power frequency cycles reflects that the discharge is very sparse and scattered, and the phase information of the discharge cannot be effectively derived.

Figure 15: UHF spectrum of metal contamination defect with intermittent discharge for 50 power frequency cycles

Figure 16: UHF spectrum of intermittent discharge of air gap defect for 50 power frequency cycles
To obtain the spectrum that can effectively reflect the intermittent discharge pattern of solid insulation defects, multiple sets of 50 power frequency cycles signals were continuously collected during the test, the mapping analyses were performed for 100, 150 and 200 cycles of UHF signals, and the analysis results are shown in Figs. 17 and 18.

Figure 17: UHF spectra of metal contamination defects in different periods of intermittent discharge

Figure 18: UHF spectra of different periods of intermittent discharge of air gap defect
As can be seen from Fig. 17, for the intermittent discharge defects of metal fouling on the insulator surface, the 100 power frequency cycles UHF pattern and 150 power frequency cycles UHF pattern are scattered and cannot reflect the discharge characteristics of metal fouling defects, for 200 power frequency cycles discharge mapping solid insulation surface metal fouling defects intermittent discharge signal, most concentrated in the positive half-cycle peak and negative half-cycle peak, with a more obvious distribution pattern, while the discharging UHF signal amplitude gap is large, reflecting that the discharge of metal fouling defects on the solid insulation surface is unstable in the intermittent discharge process.
As can be seen from Fig. 18, the intermittent discharge signal of air gap defects inside the solid insulation is more dispersed in phase distribution than the intermittent discharge signal of metal fouling defects on the surface of solid insulation, and the signals in the UHF spectrum of 200 power frequency cycles are mainly concentrated at the positive and negative half-period peaks, and there are also discharges at 0°, 180° and 360° phases, which can reflect the characteristics of air gap discharge defects of solid insulation, and the difference in the amplitude of the discharge UHF signal is also larger, which reflects the instability of the discharge of air gap defects inside the solid insulation in the intermittent discharge process.
4 Analysis of Intermittent Discharge Process of Solid Insulation Defects
The intermittent discharge test was carried out at 21.2 and 5.3 kV for solid insulation surface metal fouling defects and solid insulation internal air gap defects, respectively. During the test, the discharge information was collected every 8 h, for a total of 48 h. The average value of discharge is calculated by randomly taking 10 groups of discharge pulse signals for each collected discharge, which is used to analyze the variation law of intermittent discharge of solid insulation defects with time. The statistical calculation results are shown in Fig. 19.

Figure 19: Variation diagram of solid insulation defect discharge amount
Solid insulation surface metal fouling defects intermittent discharge state devolution of electricity with the extension of the discharge time shows a trend of change first up and then down, the overall discharge time interval shows an increasing trend of change, in the intermittent discharge state of solid insulation surface metal fouling defects is difficult to develop into a breakdown discharge fault; solid insulation internal air gap defects discharge overall also shows the law of first increase and then decrease, in the solid insulation internal air gap defects in the process of intermittent discharge for a long time to maintain a large level, there is a risk of breakdown, and the discharge will gradually evolve into continuous discharge.
As can be seen from Fig. 19, the intermittent discharge of metal fouling on the surface of solid insulation is weak at the beginning stage, and maintains a mild micro-rising state of discharge for a period of time, with the increase of pressurization time, the discharge intensity gradually strengthens, and the discharge volume will slowly increase during the test for a period of time at the stage of pressurization time about 16–32 h, and with the extension of discharge time, the discharge volume as a whole will gradually during 40–48 h, the discharge will be extinguished, and there is no tendency to re-discharge after a period of continuous observation. The insulator surface does not show traces of flashover along the surface, and there is no trace of ablation on the insulator surface after the actual experiment.
Solid insulation internal air gap defects in the intermittent discharge process, the overall discharge also shows a pattern of first increase and then decrease, during the 16–32 h discharge process, the discharge volume compared to the solid insulation surface metal fouling defects, and in a longer period of time the discharge volume remains at a larger level, solid insulation internal air gap defects have a risk of breakdown.
4.2 Intermittent Discharge Interval Statistics
Since PD events are not independent of each other, the residual space charge of each discharge after its completion will have an impact on the time of the next PD occurrence, and this impact can be characterized by the variation profile of the discharge time interval Δt of adjacent discharge pulses. Based on this, this paper further investigates the intermittent degree of discharge of metal fouling defects on the surface of solid insulation and air gap defects inside solid insulation as a function of time. The discharge time difference was collected every 8 h during the experiment, and 10 groups of discharge signals were randomly taken for the average time difference calculation, and the average discharge time difference of intermittent discharge of metal fouling defects on the surface of solid insulation and air gap defects inside solid insulation was analyzed. The variation law of intermittent discharge time difference Δt between two typical solid insulation defects within 48 h is shown in Fig. 20.

Figure 20: Plot of Δt mean over time
As can be seen from Fig. 20, the average discharge time interval Δt of intermittent discharge of metal fouling on the solid insulation surface shows an overall trend of gradually becoming larger with the increase of discharge time, indicating that the intermittency of discharge is slowly becoming larger. Initially, the average intermittent discharge time interval is short, and with the extension of the discharge time, the discharge time interval gradually becomes larger, two adjacent discharges do not necessarily occur in the same power frequency cycle, and the discharge becomes very sparse, and the metal fouling defects on the surface of solid insulation in the intermittent discharge state do not gradually evolve into intense discharge, which also shows again that the intermittent discharge of metal fouling does not evolve into breakdown discharge. For the intermittent discharge of air gap defects inside the solid insulation, the discharge time interval will increase and maintain a total of about 32 h of stable discharge time interval, and the discharge pulse signal was observed to evolve from intermittent discharge to continuous discharge when the discharge is 48 h, probably because the air gap defects inside the solid insulation are ablated and the insulation performance is reduced due to the prolonged discharge of its insulator.
4.3 Chemical Detection Analysis
Pure SF6 gas decomposes after a long-time discharge experiment with major decomposition products such as SO2F2, SOF2, SO2 and H2S [29]. After the intermittent discharge experiment of solid insulation defects was carried out in this paper, the gas was collected after the experiment by using gas collection bags, and the gas components were detected by GCMS, the results are shown in Fig. 21.

Figure 21: SF6 decomposition product concentration plot
It can be seen from Fig. 21 that the concentration of SO2F2, SOF2, SO2 and H2S characteristic gases in the detection results after 48 h of intermittent discharge of solid insulation defects is very low, which is difficult to detect the characteristic gases by using the existing monitoring technology and to detect the intermittent discharge defects by using the gas component detection method. At the same time, the gas component detection results also indicate that the defect is not discharged in a large amount in the intermittent test and the discharge is not violent.
For the site GIS PD insulation defects leakage, false alarm problem occurs frequently, this paper conducts experimental research on intermittent discharge characteristics of common solid insulation defects inside GIS, builds a multi-source detection experiment platform for intermittent discharge of solid insulation defects by using real type GIS, and studies intermittent discharge of solid insulation defects by using pulse current method, UHF method, ultrasonic method and gas characteristic component detection method, the following conclusions were obtained:
(1) UHF method can effectively detect the intermittent discharge of metal fouling and solid insulation internal air gap defects radiating high-frequency electromagnetic wave signals, and the ultrasonic sensor installed on the metal shell of GIS cannot effectively detect the discharge signals; the intermittent discharge of metal fouling defects on the surface of solid insulation and solid insulation internal air gap defects resulting in a low fractionation of SF6 into SO2F2, SOF2, SO2 and H2S, and it is difficult for the chemical detection method of characteristic gas components to effectively detect intermittent discharges. The traditional 50 power frequency cycle UHF mapping cannot effectively derive the variation law of intermittent discharge of solid insulation defects, while the 200 power frequency cycle UHF mapping composed of 4 sets of 50 power frequency cycle can initially derive the distribution law of intermittent discharge.
(2) The discharge amount of metal fouling defects on the surface of solid insulation shows a trend of rising and then falling with the extension of discharge time, and even the discharge disappears at the end; the discharge time interval shows an overall trend of gradual increase, which means that the metal fouling defects on the surface of solid insulation in the state of intermittent discharge with small discharge amount can hardly cause the occurrence of breakdown discharge. The discharge volume of intermittent discharge of solid insulation internal air gap defects also shows an overall increase and then decreasing pattern, and the intermittent discharge will gradually evolve into continuous discharge, and the discharge volume of solid insulation internal air gap defects is larger than that of solid insulation surface metal fouling defects, and the discharge volume remains at a larger level in a longer period of time in the test, and there is a risk of breakdown.
Acknowledgement: All the research work has been funded by the State Grid Electric Power Research Institute Co., Ltd. We sincerely express our thankfulness here.
Funding Statement: Project supported by Science and Technology Project of SGCC (Research on Key Technologies for Fault Diagnosis and Early Warning of Intermittent Discharge in UHV GIS: 524625200028).
Conflicts of Interest: The authors declare that they have no conflicts of interest to report regarding the present study.
References
1. Wang, Y., Chen, Z., Guo, W., Wang, Z., Huang, Y. (2022). GIS partial discharge pattern recognition based on dual attention mechanism optimized CNN architecture. Journal of Electric Power Science and Technology, 37(2), 22–29. [Google Scholar]
2. Niu, C., Jiao, L., Wang, X., Yang, A., Li, X. et al. (2020). Thermal characteristics analysis of environmentally friendly GIS based on multi-field coupling. Transactions of China Electrotechnical Society, 35(17), 3765–3772. [Google Scholar]
3. Yuan, W., Liu, B., Xu, H., Wang, Z., Dong, X. et al. (2021). Identification of partial discharge fault types in GIS based on composite neural network. Journal of Electric Power Science and Technology, 36(4), 157–164. [Google Scholar]
4. Li, X., Li, J., Du, L., Qian, G., Wang, P. et al. (2015). Development of smart sensor for ultra-high-frequency partial discharge detection. High Voltage Engineering, 41(12), 3944–3951. [Google Scholar]
5. Tan, Q., Tang, J., Zeng, F. (2016). Design of fourfold-band micro-strip monopole antenna for partial discharge detection in gas insulated switchgear. Transactions of China Electrotechnical Society, 31(10), 127–144. [Google Scholar]
6. Song, Y., Chen, W., Zhang, Z., Liu, F., Wu, K. et al. (2022). Ultrasonic sensing technology of partial discharge in GIS based on fiber-optic Michelson interferometer. High Voltage Technology, 48(8), 3088–3097. [Google Scholar]
7. Rui, Y., Wang, Y., Zhou, M., Luo, Y., Wang, H. et al. (2022). Joint sensing technology of partial discharge in GIS based on flexible feeding helical antenna and silicon photomultiplier tube. Chinese Journal of Electrical Engineering, 1–12. [Google Scholar]
8. Wang, G., Gao, C., Yang, Y., Zhou, F., Huang, R. et al. (2018). Research on the effectiveness of partial discharge detection for GIS insulation defects. High Voltage Electrical Appliances, 54(11), 62–72. [Google Scholar]
9. Dong, J., Liu, J., Li, Y., Liu, C., Tang, Z. et al. (2018). Research on long-interval sparse partial discharge in GIS and its sudden breakdown. High Voltage Apparatus, 54(11), 73–79+85. [Google Scholar]
10. Wang, H., Ding, D., Jia, Z., Tang, M., Zhao, C. et al. (2018). Research on intermittent discharge characteristics of defects on the surface of disc-insulators of GIS under long-time constant voltage. Proceedings of the CSEE, 38(20), 6188–6194. [Google Scholar]
11. Zhang, L., Lu, S., Li, C., Cui, B., Wu, Y. et al. (2019). Observation on the characteristics of long-term partial discharge sparseness of surface metal particle in gas insulated switch. Transactions of China Electrotechnical Society, 34(18), 3928–3936. [Google Scholar]
12. Liu, J., Dong, J., Li, Y., Zhang, X., Liu, C. et al. (2019). Detection and analysis on intermittence partial discharge of solid insulation defect in gas-insulated switchgear. Electrical Automation, 41(4), 96–98+110. [Google Scholar]
13. Niu, B., Wei, Y., Ma, F., Wu, H., Li, X. et al. (2021). Research on long-interval sparse partial discharge detection system for electrical equipment. Electrical Measurement & Instrumentation, 58(7), 173–179. [Google Scholar]
14. Li, L. (2015). Research on insulation condition evaluation and fault diagnosis technology of gas combination electric appliances. Chongqing University, Chongqing, China. [Google Scholar]
15. Zhang, Q., Han, X., Zhang, Z., Pang, P., Sun, Z. et al. (2019). Effects of size and location of air gap defect in solid insulation on its partial discharge characteristics. High Voltage Technology, 45(4), 1313–1322. [Google Scholar]
16. Li, T., Rong, M., Wang, X., Zhang, A., Pan, J. et al. (2017). Design, optimization and experiment study of internal UHF sensor for partial discharge detection in GIS. Proceedings of the CSEE, 37(18), 5483–5493. [Google Scholar]
17. Li, J., Zhang, X., Han, X., Yao, X. (2018). A partial discharge detection method for SF6 insulated inverted current transformers adopting inner shield case as UHF sensor. IEEE Transactions on Power Delivery, 33(6), 3237–3239. https://doi.org/10.1109/TPWRD.2018.2807982 [Google Scholar] [CrossRef]
18. Zhang, G., Han, J., Liu, J., Chen, K., Zhang, S. (2023). Research on GIS PD detection antenna body and balun coplanar flexible miniaturized UHF antenna sensor. Journal of Electrotechnical Technology, 38(4), 1064–1075. [Google Scholar]
19. Zhang, H., Zhang, G., Zhang, X., Tian, H., Lu, C. et al. (2022). PD flexible built-in high-sensitivity elliptical monopole antenna sensor. Sensors, 22(13), 1424–8220. [Google Scholar]
20. Zhang, G., Zhang, S., Zhang, X., Cheng, K., Hang, J. et al. (2022). Research on a new type of GIS partial discharge flexible built-in archimedes spiral antenna. High Voltage Apparatus, 1–10. [Google Scholar]
21. Yue, M., Yang, X., Xu, J., Sun, M., Huang, W. et al. (2021). Analysis of free particle defect in GIS based on ultrasonic detection technology. Shandong Electric Power, 48(2), 44–47. [Google Scholar]
22. Wang, P., Liu, Y., Zou, Y., Zhou, Q., Liu, M. et al. (2020). Application of TEV and ultrasonic detection methods in partial discharge detection of switchgear. High Voltage Apparatus, 56(10), 75–83. [Google Scholar]
23. Xu, Y., Liu, W., Chen, W., Li, X., Yang, Y. et al. (2020). High-sensitivity measurement method and application of GIS spacer partial discharge. Proceedings of the CSEE, 40(5), 1703–1713. [Google Scholar]
24. Tang, J., Liu, F., Zhang, X., Meng, Q., Zhou, J. et al. (2012). Partial discharge recognition through an analysis of SF6 decomposition products part 1: Decomposition characteristics of SF6 under four different partial discharges. IEEE Transactions on Dielectrics and Electrical Insulation, 19(1), 29–36. https://doi.org/10.1109/TDEI.2012.6148499 [Google Scholar] [CrossRef]
25. Tang, J., Liu, F. (2012). Partial discharge recognition through an analysis of SF6 decomposition products part 2: Feature extraction and decision tree-based pattern recognition. IEEE Transactions on Dielectrics and Electrical Insulation, 19(1), 37–44. https://doi.org/10.1109/TDEI.2012.6148500 [Google Scholar] [CrossRef]
26. Cao, Z. (2021). Research on identification of UHF partial discharge types in GIS based on deep learning and multi-information fusion. North China Electric Power University (BeijingChina. [Google Scholar]
27. Huang, C. (2016). Propagation characteristics and detection system design of partial discharge ultrasonic signal in GIS. Hunan University, China. [Google Scholar]
28. Zou, Y., Zhou, Q., Liu, M., Tang, Z., Zhang, D. et al. (2020). Research on quantitative evaluation on anti-electromagnetic interference capability of ultra high frequency partial discharge detection instrument. Transactions of China Electrotechnical Society, 35(10), 2275–2282. [Google Scholar]
29. Zhang, X., Yao, Y., Tang, J., Sun, C., Wan, L. (2008). Current situation and development of SF_6 discharge decomposition gas component analysis. High Voltage Technology, 2008(4), 664–669+747. [Google Scholar]
Cite This Article
 Copyright © 2023 The Author(s). Published by Tech Science Press.
This work is licensed under a Creative Commons Attribution 4.0 International License , which permits unrestricted use, distribution, and reproduction in any medium, provided the original work is properly cited.
 Downloads
 Citation Tools