
 Submit a Paper
 Propose a Special lssue
 Open Access
ARTICLE
A Techno-Economical Characterization of Solar PV Power Generation in Rwanda: The Role of Subsidies and Incentives
1 African Center of Excellence in Energy for Sustainable Development, University of Rwanda, Kigali, Rwanda
2 African Center of Excellence for Sustainable Cooling and Cold Chain, University of Rwanda, Kigali, Rwanda
3 Department of Agricultural Mechanization, School of Agriculture Engineering, University of Rwanda, Nyagatare, Rwanda
4 Department of Electrical and Electronics Engineering, Kyambogo University, Kampala, Uganda
* Corresponding Author: Morris Kayitare. Email:
(This article belongs to the Special Issue: Key Technologies of Renewable Energy Consumption and Optimal Operation under )
Energy Engineering 2023, 120(9), 2155-2175. https://doi.org/10.32604/ee.2023.028559
Received 24 December 2022; Accepted 23 March 2023; Issue published 03 August 2023
 View Full Text
 Download PDF
Abstract
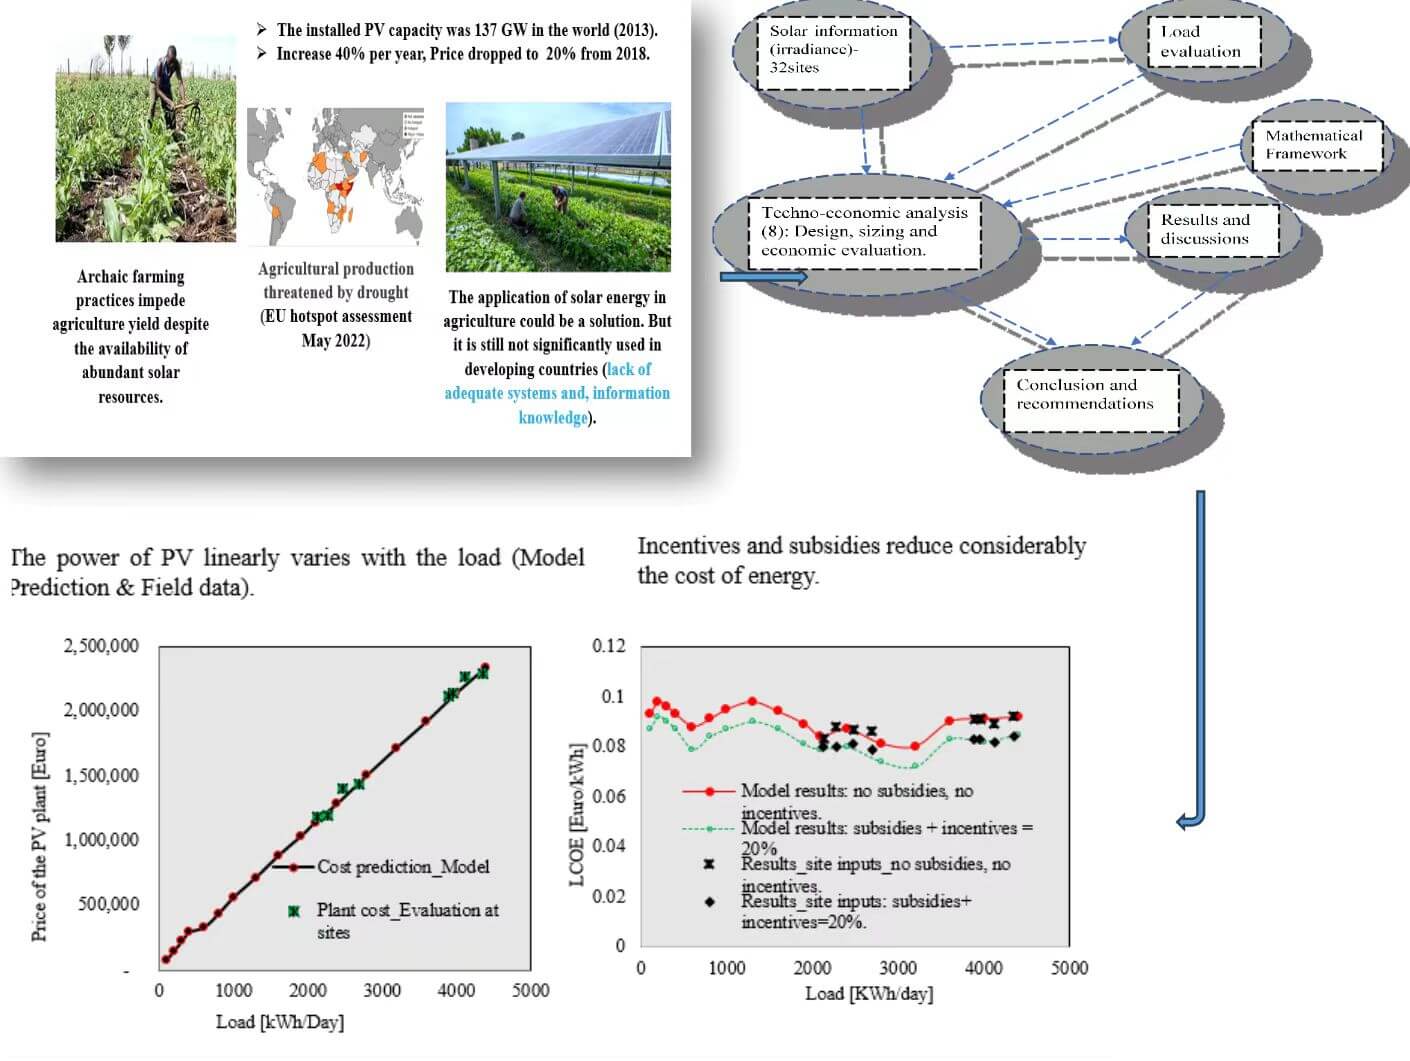
Standalone Solar PV systems have been vital in the improvement of access to energy in many countries. However, given the large cost of solar PV plants’ components, in developing countries, there is a dear need for such components to be subsidised and incentivised for the consumers to afford the produced energy. Moreover, there is a need for optimal sizing of the solar PV plants taking into account the solar information, energy requirement for various activities, and economic conditions in the off-grid regions in Rwanda. This study aims to develop optimally sized solar PV plants suited to rural communities in Rwanda. Likewise, it aims at characterizing the impacts of subsidies and incentives on the profitability and affordability of solar PV plants’ energy in Rwanda. In the study, we have developed a model on basis of which the plant power (peak power) and costs of energy can be predicted given the load requirements using PVSyst. The model was validated using data corrected at eight different sites. Our generalized predictive model’s results matched the results obtained using field measurement data as inputs. The models have been able to replicate with a by degree of accuracy the peak powers and the plants’ costs for different loads and were used to evaluate the economic viability of solar PV plants in Rwanda. It was found that with incentives and subsidies of 20%, the solar PV systems’ costs, the Levelised Cost of Energy would drop from a maximum of 0.098 Euro to a minimum of 0.072 Euro, the payback period was reduced from a maximum of 7.5 years to a minimum of 6.0 years while the return on investments was seen to vary between 425.72 and 615.32 per cent over the plants’ lifetime of 25 years. Overall our findings underscore the importance of government subsidies and incentives for solar PV energy generation projects to be significantly profitable.Graphic Abstract
Keywords
The developing world has a variety of energy-related issues that hinder its socioeconomic development. According to Ganda et al. [1], the following factors make it difficult to advance sustainable energy in developing countries: (1) continued fossil fuel subsidies; (2) insufficient initial capital, and (3) hefty costs of energy. It is worthwhile to note that focusing on issues specific to the local settings, especially those connected to financial and technological developments in the area might help ease some of these issues [2–7]. It is thought that currently available policies and investments to support sustainable energy systems need to be revised or modified.
There have been researches aiming to understand and address matters associated with clean energy integration. In fact, The high-level platform for clean energy securities in emerging markets, particularly in Africa, suggests overhauling subsidies for fossil fuels as well as introducing carbon reduction mechanisms, resource-efficient practices, and strong social and ecological guidelines which comply with energy efficiency, pollution prevention, and emission levels quality standards [8]. Hirth et al. [9] examined the impact of capital costs and carbon prices on the incorporation of renewable energy (RE) and other low-carbon technologies in the grid using the Electricity Market Model EMMA. After analyzing the data, they presented a plan to reduce the amount of gaseous carbon compounds in the grid-based energy supply in developing countries. It was suggested that among other efforts, the energy economic sector should have unique strategies for zero-carbon power supply, including proper handling of waste and roofing of large buildings with solar panels. Most importantly, nations were recommended to support renewable energy by reallocating fossil fuel subsidies to renewable energy technologies. In addition to electrification programs and grid expansion plans should promote decentralized mini-grids fueled by locally accessible renewable energy resources [9].
Based on such research findings and recommendations, there has been a dramatic technological transition from fossil fuels to environmentally friendly renewable energy generation, in the past decade [10]. Numerous initiatives to support renewable energy integration have been formed [11] and photovoltaic (PV) technology has emerged as one of the most promising among REs all over the globe [12,13]. Goldthau [14] supported the fact that a systemic shift towards more effective resources requires a strategic plan of action incorporating regulations from the local to the international authorities. Diverse regulations, including negotiable allowances for the reduction of emissions, tax waivers, and increased incentives for the generation of renewable energy, have been suggested. As stipulated by the World Trade Organisation (WTO) in its Agreement on Subsidies and Countervailing Measures (ASCM), if a policy measure confers a benefit or entails financial assistance, it qualifies as a subsidy [15,16]. Although the ASCM does not provide an exhaustive listing of subsidy types, it does refer to a few common ones, including: direct credit support; forgone taxes and provision of goods or services below market value. Other categories have often been taken into consideration as possible subsidies outside of these widely established subsidy kinds. Examples include, social and environmental externalities or using tariff policies as a kind of market price support [17].
In recent times, more than US$240 billion were subsidized annually in the global energy sector by governments throughout the world [18]. This sum is unprecedented in the history of global economic subsidy distribution [19]. Such a huge amount of subsidies prompted claims that RE technologies get unfairly large amounts of financing in relation to their installed capacity compared to other electricity-generating technologies [20,21]. However, such claims are not always backed by sufficient evidence as the concept of subsidies itself has been a controversial subject in the field [19,22]. However, whatever might be the arguments, RE development involves large, high-risk, and uncertain-return investments that certainly require special financial support from governments. Thus, extensive studies need to be carried out to ascertain the impacts of subsidies on RE penetrations and profitability in terms of variation of the Levelised Cost of Energy (LCOE) and payback periods vis a vis energy Tariffs, especially in the developing world.
It is worthwhile to note that LCOE is particularly useful for the comparison of costs of various kinds of generating technologies, and it is widely acknowledged as the measure for economic analysis of power production systems [23]. This approach calculates the average total cost of building and running an energy production asset throughout its whole plant life, divided by the asset’s total power output during that period. Comparing the LCOE with the market energy tariff allows us to determine the competitiveness of various technologies and whether or not to invest in a particular renewable energy project. Furthermore, with the use of LCOE estimates, policymakers might establish regulations for renewable energy subsidization [24].
In Rwanda as in many other Sub-Saharan African nations, energy generation, access, and infrastructure are insufficient. Despite Rwanda’s strong development rate, the cost of delivering energy is among the highest in the region hindering economic and industrial expansion. Most solar projects in Rwanda require large grants to be bankable. The Rwandan Energy Group (REG), the country’s corporation overseeing energy production and distribution, encourages investments in the RE sector [25]. Either private forms of investments or partnerships with the government of Rwanda are highly encouraged. Among other RE systems, Solar PV power plant generation systems have lowered the cost of energy generation over the decade, and its cost is expected to decrease even further. Furthermore, under Rwanda’s geopolitical location, solar production might be even more competitive and reduce power bills.
Concerning subsidies, Rwanda has put in place various incentives to attract investments in the development of PV plants. These incentives include subsidies, free transmission access, tax-free importations of equipment for PV projects, and free lands for private developers [26]. However, such efforts have not yet resulted in significant private-sector investments in the development of PV power plants in Rwanda [26]. The low level of participation of the private sector which continues to be an obstacle to the development of PV energy systems can be associated with the scarcity of information on available subsidies and incentives to stimulate investments in the development of PV energy systems. There has not been quantitative research on the contribution of available subsidies and incentives to the profitability of PV projects in different regions of the country. This study intends to develop techno-economic models on a basis of which the effects of incentives and subsidies to the LCOE, payback periods, and Return on Investment (ROI) of solar PV projects will be quantified. This study is of significant importance to energy providers as may serve as a reference while perceiving the benefits of solar PV energy production with regard to available incentives and subsidies in Rwanda.
Fig. 1 shows the procedure used to carry out this research work. After conducting the physical assessment at 31 different locations, eight were selected for detailed load evaluation in different provinces of the country, see Fig. 2. The total load demand was obtained as a sum of the energy needed for various activities at the considered sites. These are farming activities, electrification, village activities and the use of electrical utensils in households. The estimation of the total energy required, considered inventorying equipment in use, recording their corresponding power ratings and the daily usage of each piece of equipment in terms of working hours as well as summing energy loads for all equipment for the considered activities in each village/site.
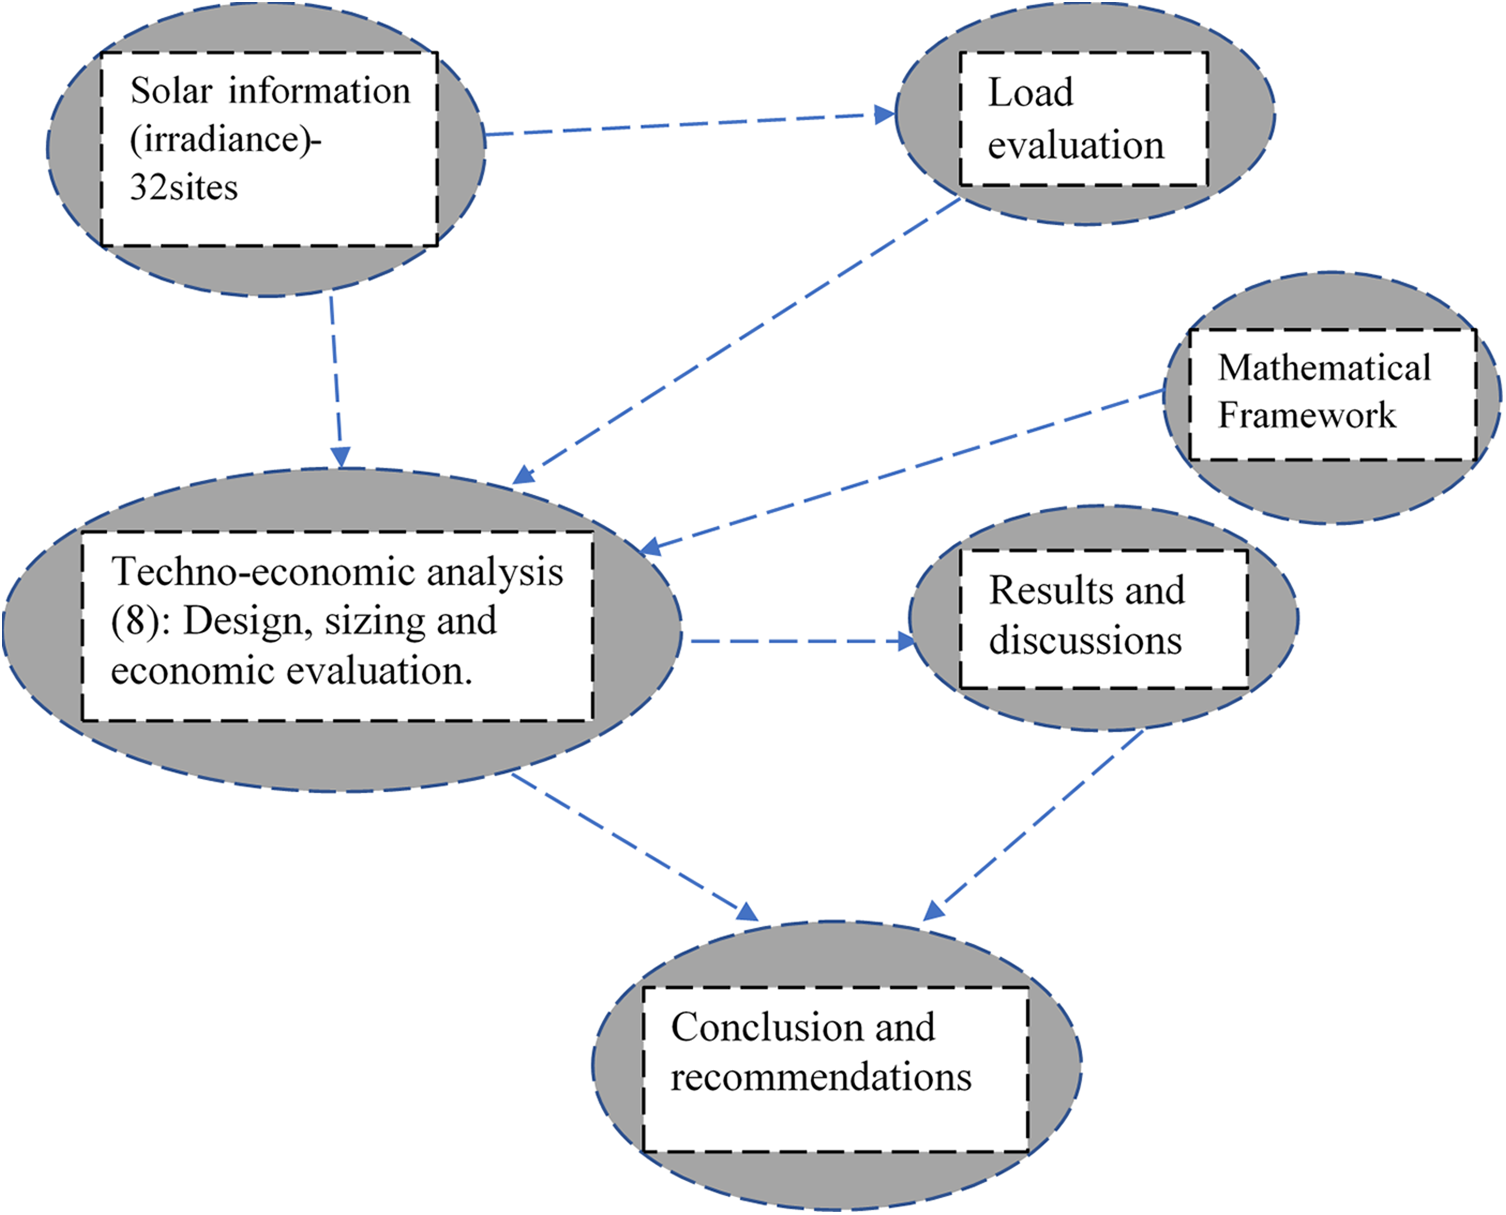
Figure 1: Analysis framework
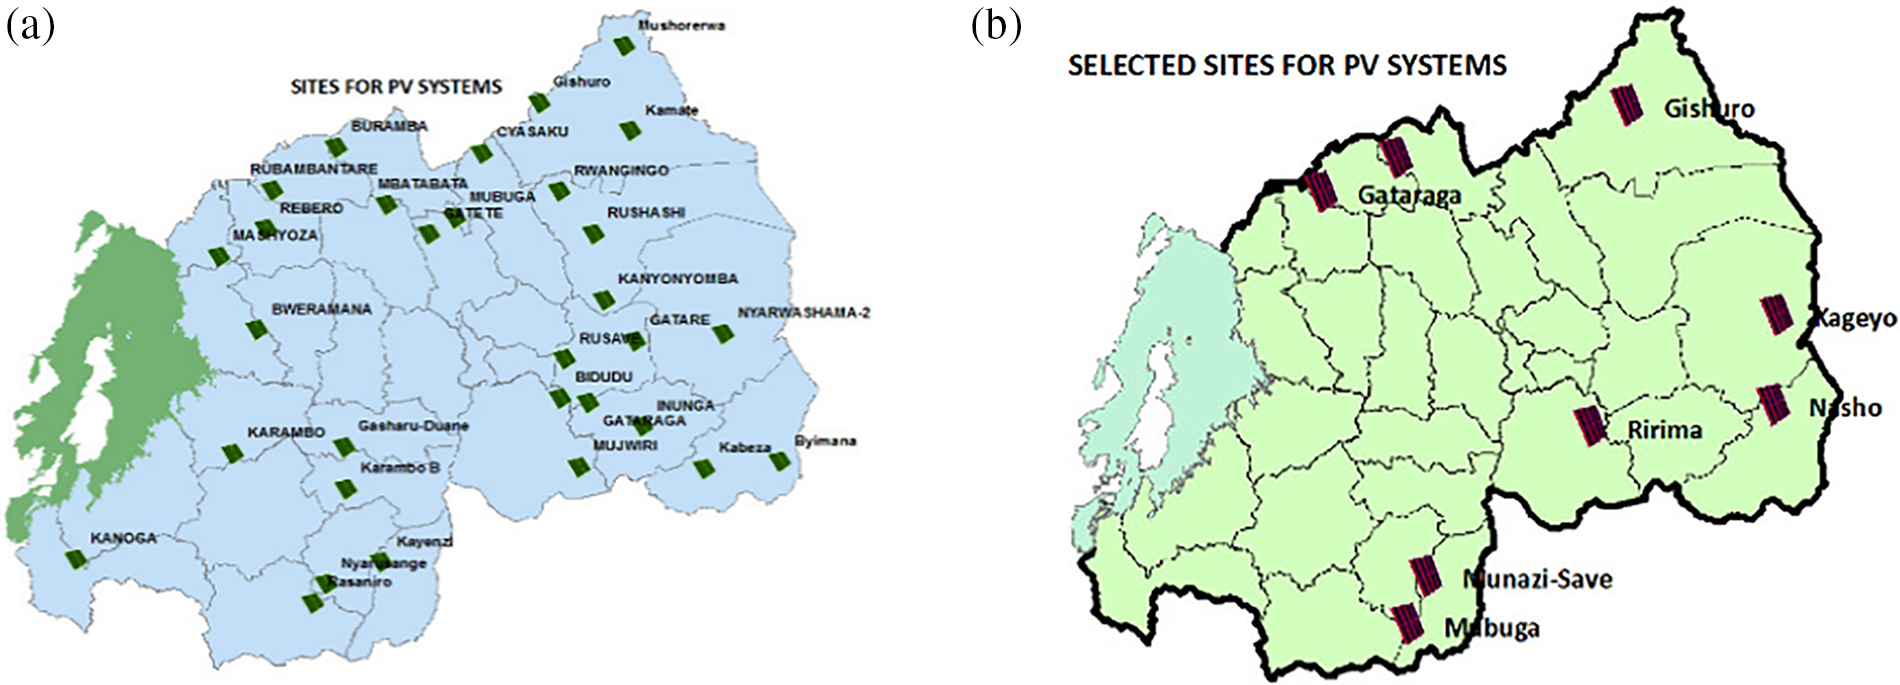
Figure 2: (a) Sites at which a preliminary-physical study was done and (b) sites selected for detailed techno-economic study on solar PV plants
Thereafter, a techno-economic analysis that consists of design, sizing & simulation, and economic evaluation on the PV power Plants using PVSyst was carried out. Eight sites were selected based on their solar potentials, their needs in electrification as well as land configuration and availability among 31 sites where the initial assessments were conducted, see Fig. 2. It is worthwhile to note that even though design and sizing were briefly studied, this study is centred on the economic analysis on the designed PV plants.
The economic modelling of PV plants in this study was adapted from reference [27]. It consists of the determination Net Present Cost of the plant and the cost of energy based on the PV plant components.
For each component,
In Eq. (2)
The total initial cost of any item in the PV can be calculated as a product of its unit price,
The total replacement cost for given components
where DF is the discount factor,
Having defined the rate of discount DF as a function of the discount rate and lifetime of the PV plant’s component, the total cost for operating and maintaining the PV plant system,
In Eq. (5),
The salvage value of the plants’ components,
The remaining lifetime for the components,
The discount factor used in Eqs. (4) and (5) is calculated using Eq. (8).
The Levelised Cost of Energy (
The yearly cost of the plant is determined from Eq. (10) based on the capital recovery factor, (
where the capital recovery factor is calculated using Eq. (11).
In Eq. (11), the capacity recovery factor is dependent on the discount rate, which in turn is calculated from Eq. (12).
where dn is the nominal discount rate while
For solar panels, the power output, efficiency, and cost are modelled by Eq. (13) through Eq. (17). The power output is determined by Eq. (13)
Here,
The efficiency of the PV module is determined by Eq. (14) where
The efficiency of the PV module under standard
The temperature of the solar cell is determined by Eq. (16).
The cost estimation (
where
The energy storage in batteries can assure the dependability of the energy systems. Consequently, it is necessary for maintaining the reliability of PV plants by incorporating energy storage in the batteries. The capacity of battery storage, the battery charge, and the batteries’ discharge are modelled by Eqs. (18)–(20), respectively.
Eq. (18)
Here
In Eq. (20),
In Eq. (21), the state of charge of a battery equals the energy stored in the battery,
Same as for the state of charge for the battery storage system, the stored energy has to be limited between the acceptable minimum and maximum values too, as indicated by Eq. (23).
The maximum energy storage one could expect can be calculated from Eq. (24).
The cost estimate (
In Eq. (25),
The PV facility has a converter to convert direct current to alternating current. Using Eqs. (26) and (27) from reference [27], the
The price of an inverter is obtained
As in the previous case,
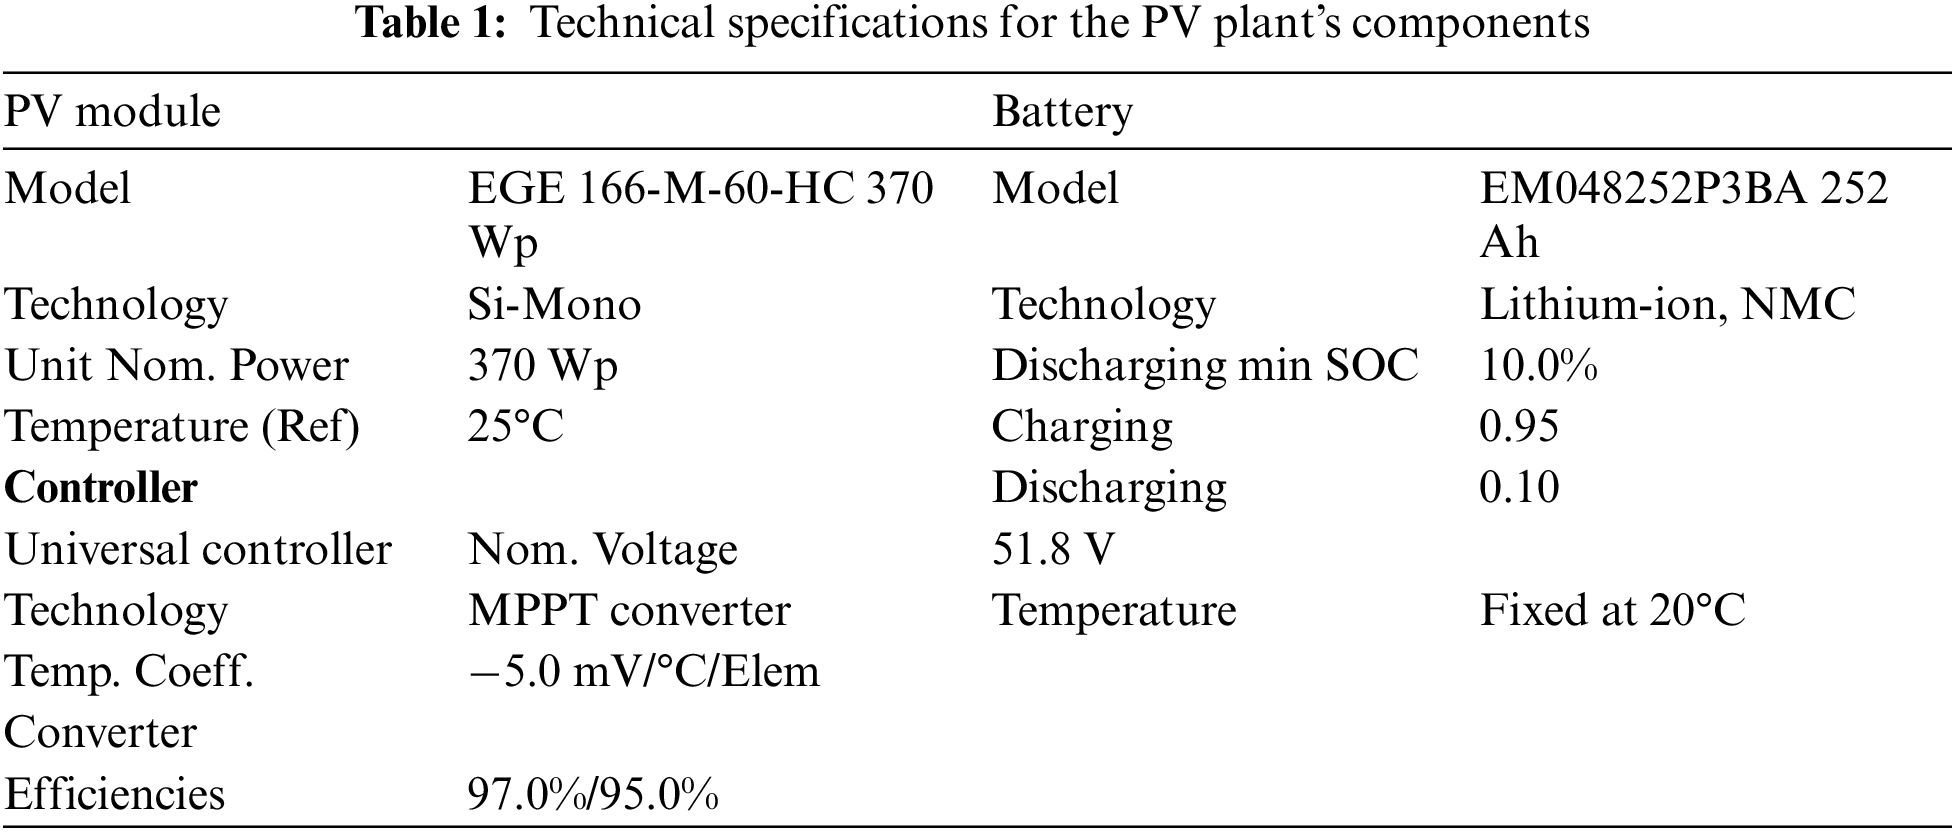
2.3 Technical Specifications and Inputs
Having collected the solar irradiation intensities at the selected sites presented in Fig. 2 and evaluated the load at each site, the design, and sizing of the standalone PV power systems have been carried out. Table 1 presents the technical specifications of the main components for designed PV plants’ models. The Monocrystalline-Silicon PV module with nominal power of 370 Wp was used. The reference operating temperature was considered ambient, 25°C. For energy storage, the lithium-ion battery with a capacity of 252 Ah and a nominal voltage of 51.8 V was used. The battery minimum state of charge (
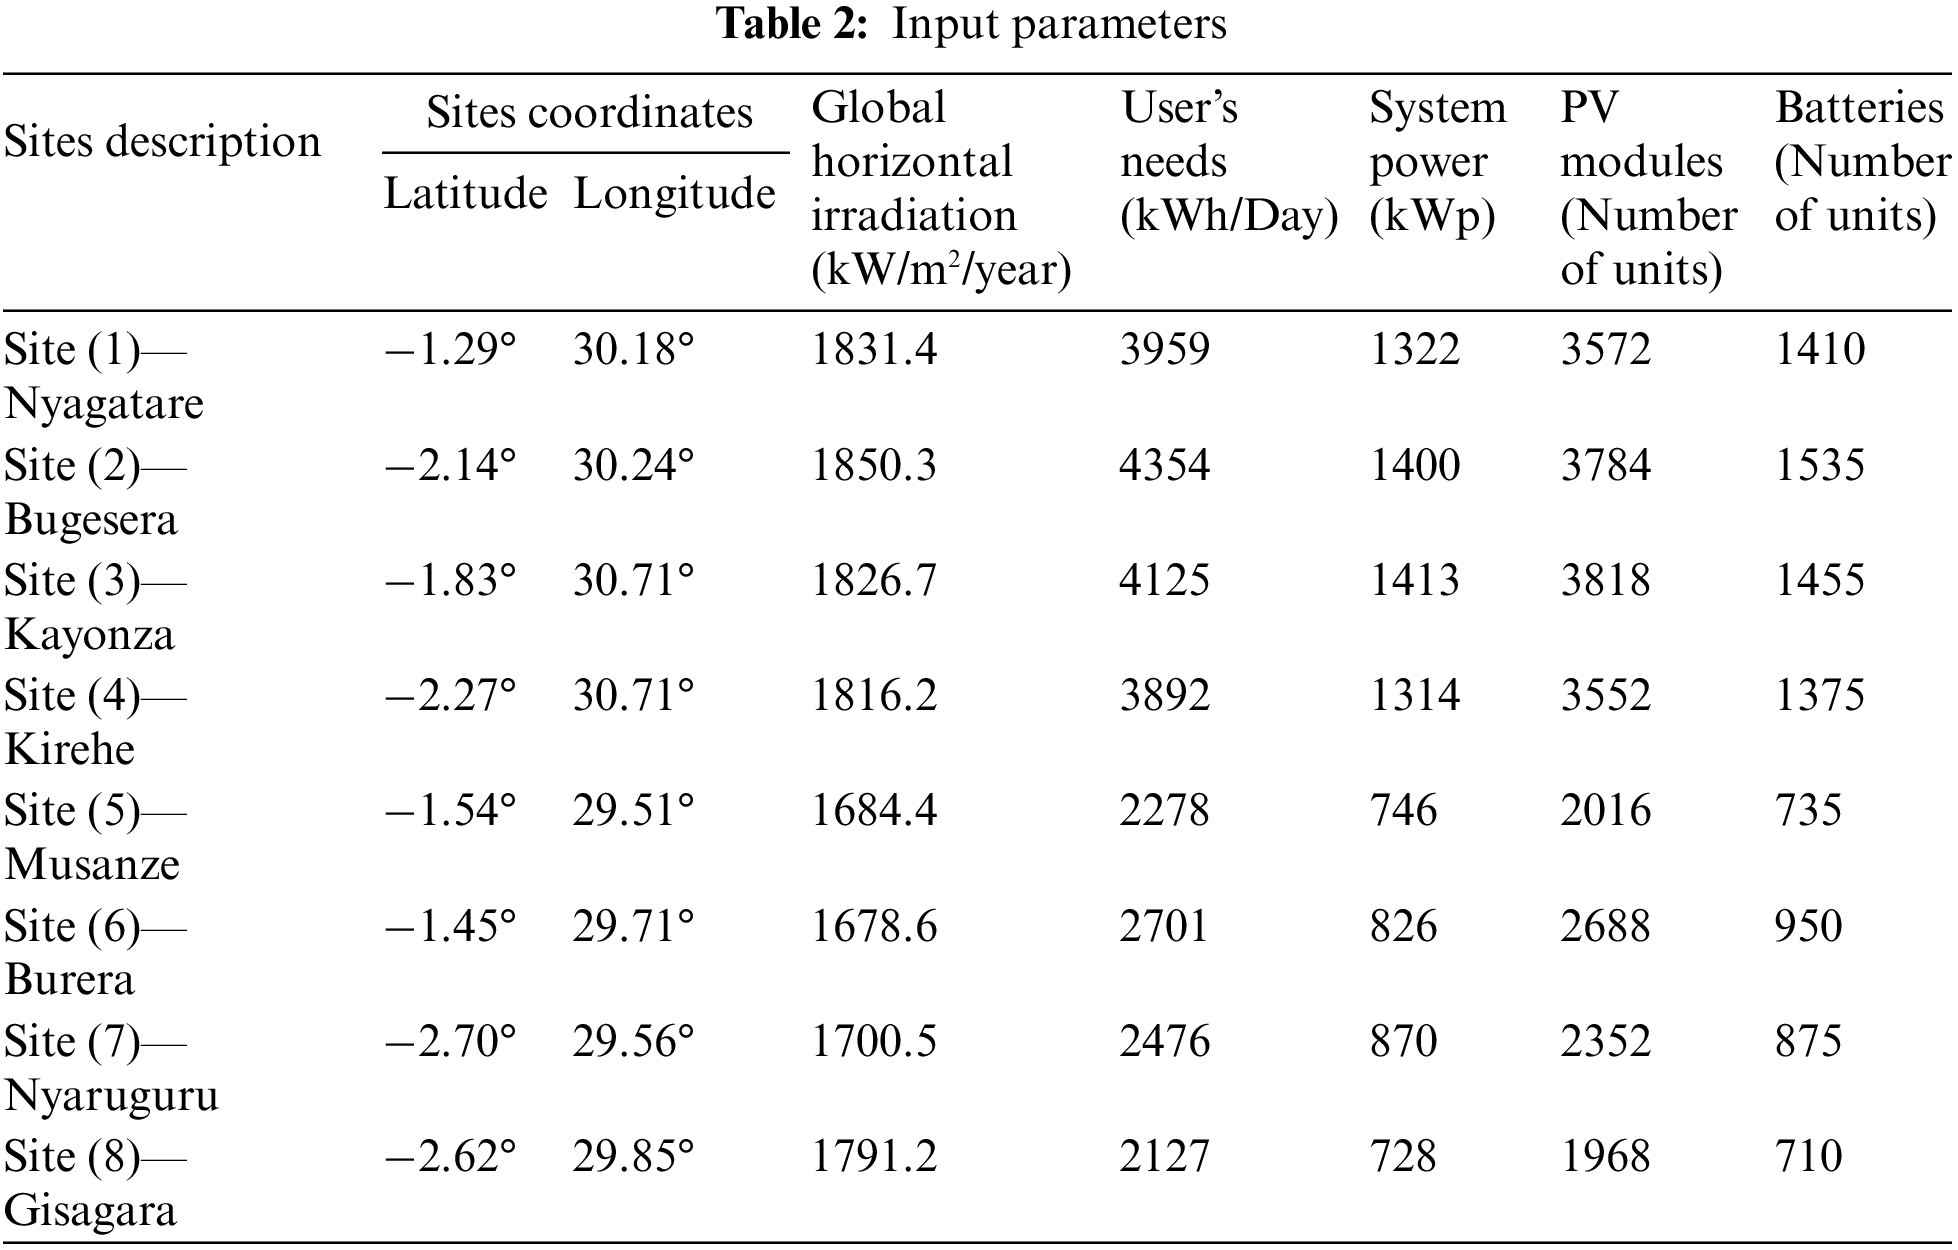
In addition to technical specifications of the PV plant components, the economic study on the eight standalone PV plants under this study considered input parameters such as site locations, solar irradiances, load, system power for each plant as well as the number of PV panels and storage batteries were determined. Table 2 summarises the values of solar radiation intensity, energy requirement, desired plant power as well as the number of panels and batteries needed to design an optimal PV plant at each site. According to the table, the minimum global horizontal irradiation (GHI) observed was at 1678.6 (kW/m2/year) in Burera. This irradiance is however high enough to sustain enough solar energy production by a PV power plant. One may notice that the number of solar panels of 3818, and batteries of as many as 1535 is too high. However, such an investment is worth it given that these are to serve a load of more than 4000 kWh/day.
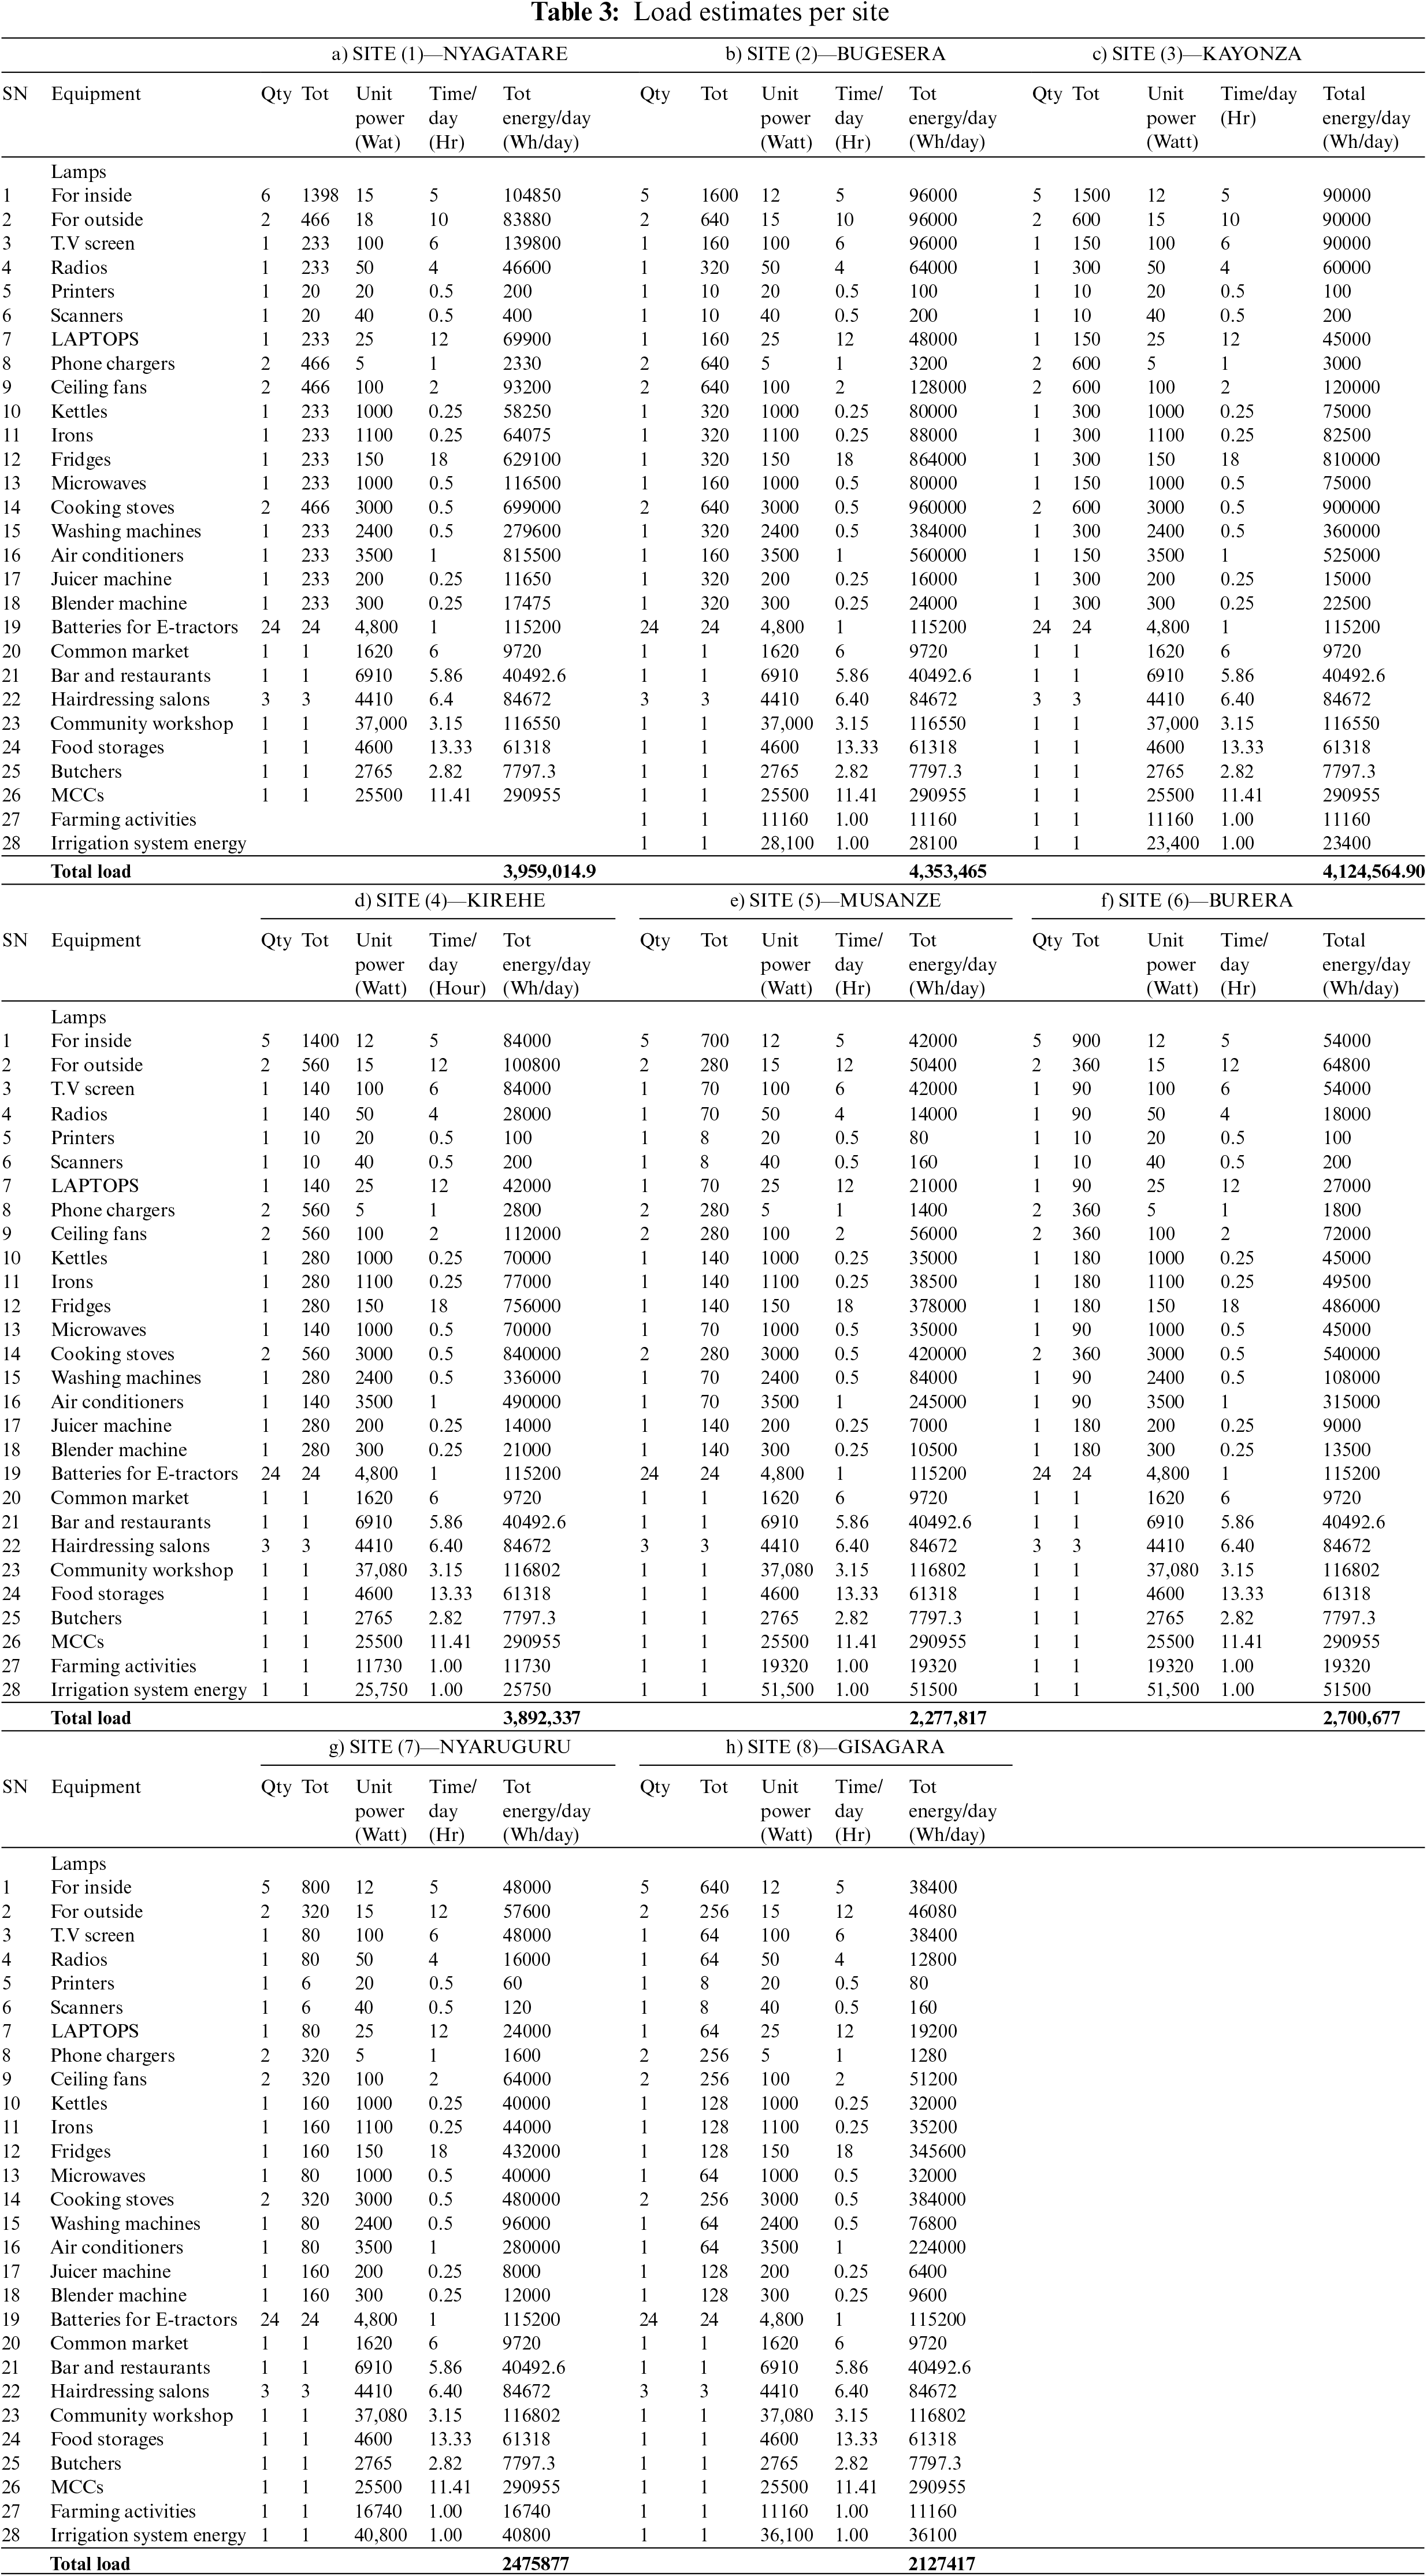
The study evaluated the energy requirements at eight different sites throughout the country presented in Fig. 2. Table 3 presents the energy requirement per site. The required total load was obtained as a sum of daily energy consumption per equipment. Home activities, farm activities, office activities and small businesses were considered in the load requirement estimation. As can be seen from the table, among the eight selected sites in Rwandan territory, the SITE (2)—BUGESERA (Gashanga village) has the highest value in total energy demand at approximately 4.4 MWh per day to serve 320 community households. On the other hand, the SITE (8)—GISAGARA (Zihare village) has the smallest value in total energy demand. It is about half of the load requirement at Bugesera, precisely around 2.2 MWh per day. At Gisagara a community with only 128 households need to be served. It is worthwhile to note that domestic appliances (fridges, ACs, washing machines, and resistive loads) would mainly contribute to energy consumption in villages. Nevertheless, it is to be noted that this study took into consideration the projected additional loads in the next five (5) years in line with the government of Rwanda’s ambitions for sustainable development as National Strategies for Transformation (NST1) stipulates.
One can note, however, that it is important to describe the variation of power consumption with the hours of the day. This is due to the fact that the daily distribution of load influences both the size, the required plant performance, and hence the cost of the plant in general. In fact, when high consumptions do not coincide with hours with high irradiation intensities, large storage capacity or more efficient panels are required, thence the cost of the PV plant raise. The consumption distribution over 24 h of the day at four sites is captured in Fig. 3. As can be seen from the figure, at three sites out of four (Burera, Nyaruguru, and Kayonza) more power is consumed in the evening hours, precisely between 6 and 9 PM. Moreover, the major daily energy consumption is predicted to remain between these hours as people return home and do many activities at home during these hours. For the site at Kirehe, the consumption was almost evenly distributed from 6 to 9 PM. At Kirehe and other districts that are likely to depend on mechanized agriculture as Rwanda’s economy grows, the even distribution from morning hours to evening can be explained by the fact that the farmer will make use of energy from morning to sun-set in agriculture activities and keep using power for home activities in evening hours.
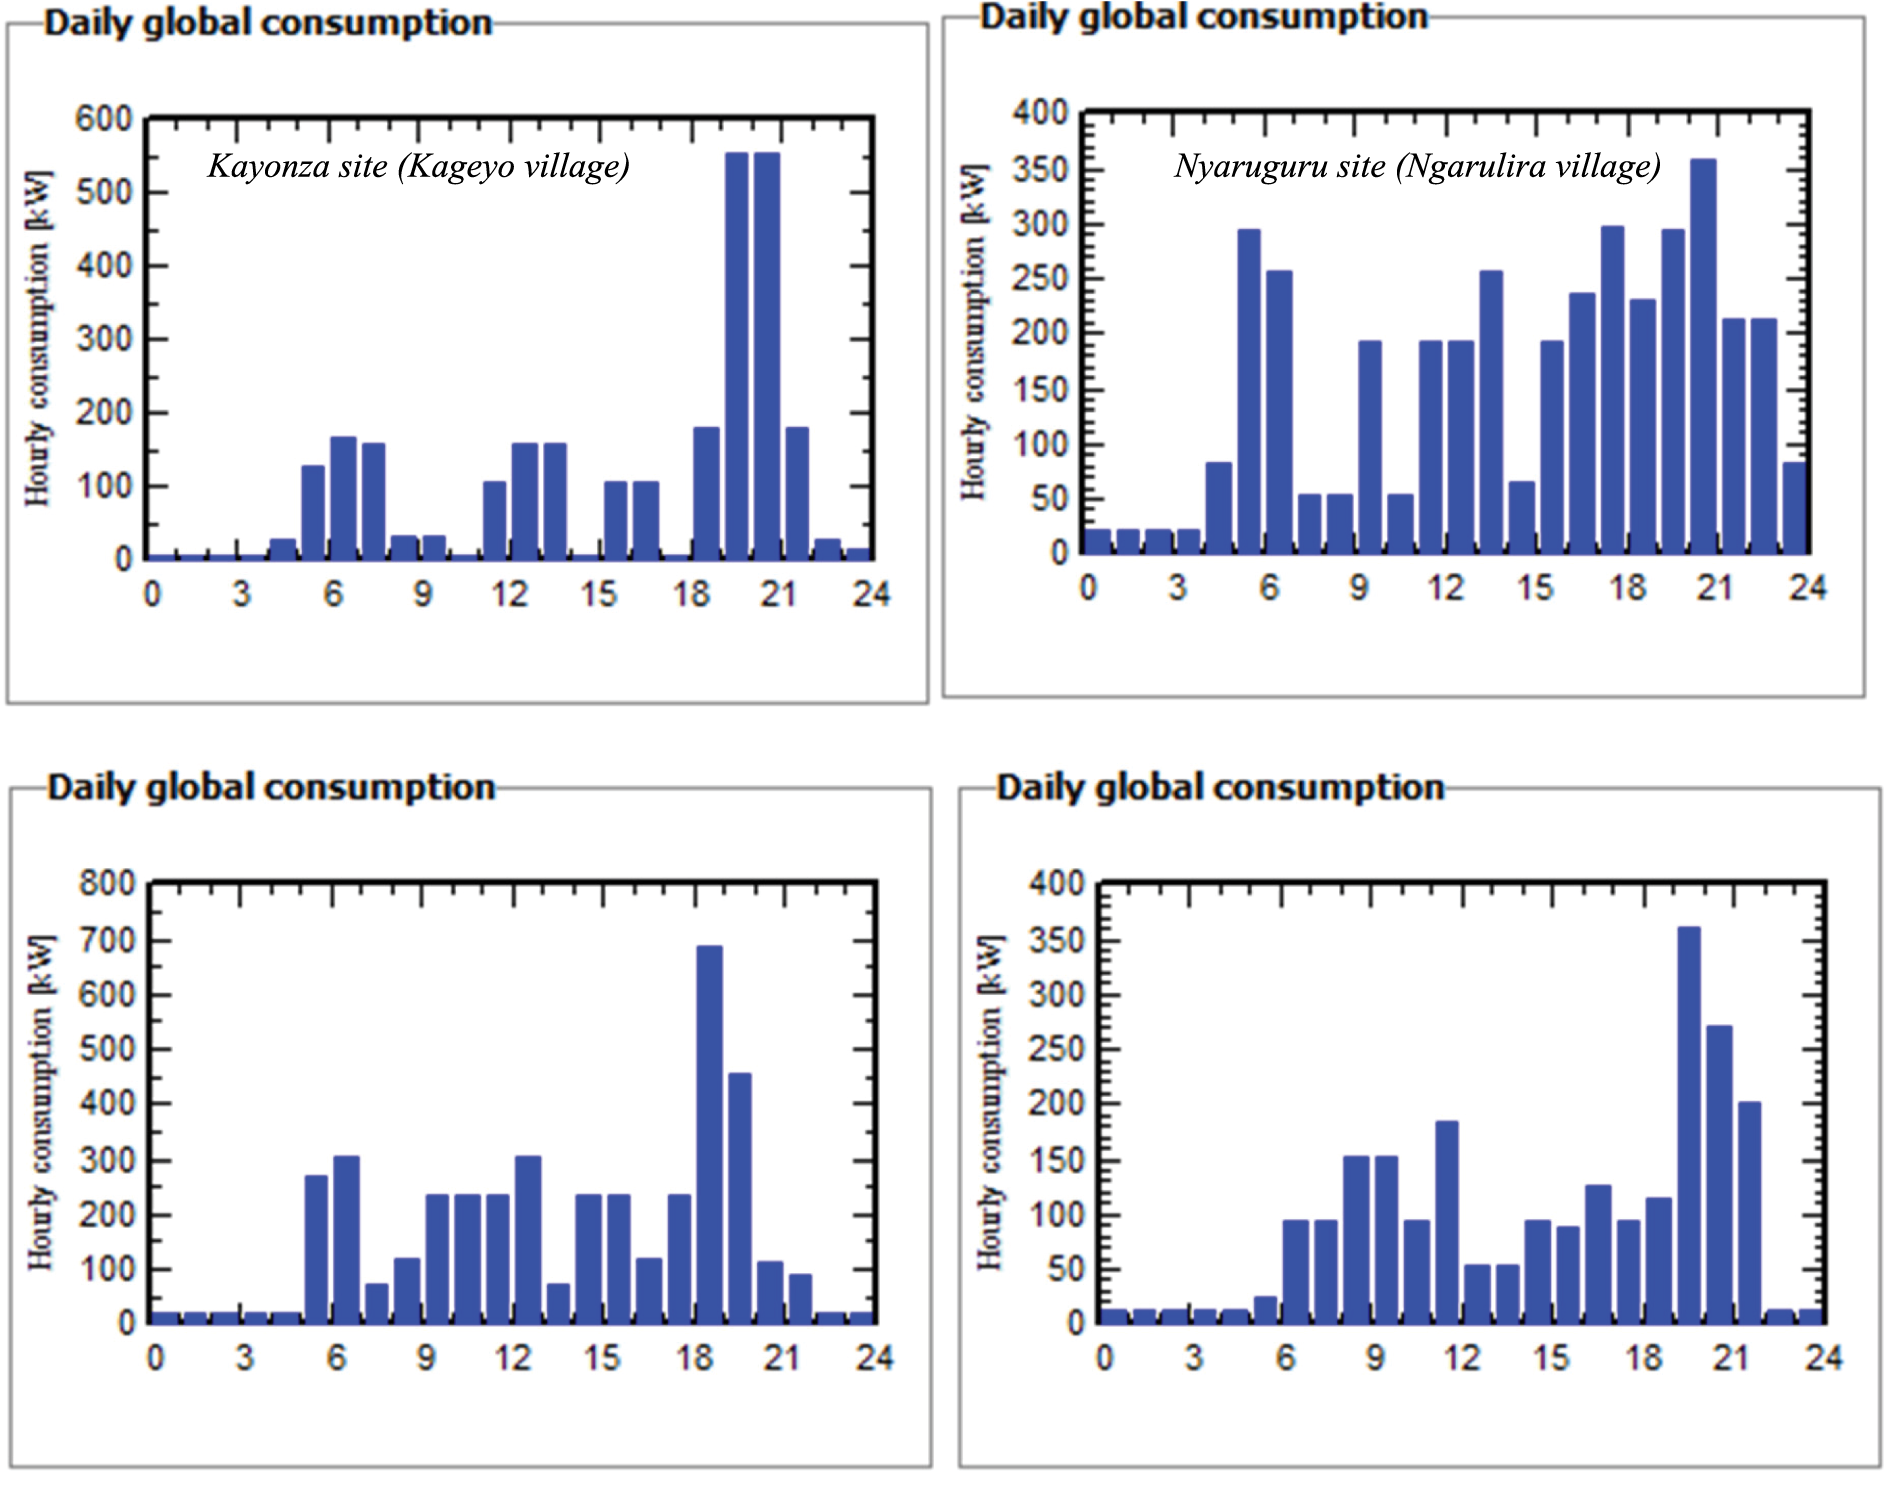
Figure 3: Daily power consumption
For the technical analysis of the PV plants’ system power, a model has been developed for the energy load up to 4400 kWh/day. The model was developed considering the average solar radiation intensity in Rwanda at 5 kWh/m2/day and the peak period approximated at 5 h/day. Moreover, the model was validated by the results of detailed studies conducted at the eight selected sites throughout the country, see Fig. 2. Fig. 4 presents the predicted peak power/system for PV plants of various sizes at sites with different daily energy consumption profiles in rural villages in Rwanda. It also shows the results of detailed studies on the sites priorly specified. One can see from the figure that the model has been able to replicate the results of the field study fairly well. Therefore one can note that such a validated model is significantly important as it can serve as a reference for further studies. Particularly, in this research, it was further used for economic analyses including the evaluation of the impact of incentives and subsidies on the PV plants’ profitability at the chosen eight sites.

Figure 4: Peak power of the PV plants as vs. load
Likewise, an economic model was designed on basis of which the cost of the PV plants can be estimated depending on energy requirements for a given site. Fig. 5 shows the total costs required to construct PV plants of various sizes (load). It comprises the cost estimations carried out under general conditions in terms of solar radiation availability and intensity, the inclination of solar rays, and the daily energy load profile in the country. It also contains the deep cost evaluation carried out at eight different sites that were selected among thirty-two sites based on the need for energy in these locations and on the suitability of solar PV plants in these given regions. It can be seen from the figure that the predicted costs by our model match the field-study-based costs. The similarities between the results obtained through the two-different approaches confirm that the developed model can be used for the estimation of PV plants’ costs at any other locations even with slightly different physical conditions. One might think that the validation of model results by comparison with field data would have been carried out for small loads to increase the reliably of the model for locations with total energy requirements below 2000 kWh/day. However, it is worth noting that for all off-grid regions given the current population and needs for machinery in agriculture activities, needs of community workshops, and use of technology facilities and tools, it is rare for even a small region that communities will keep their energy requirement at less than 2000 kWh the whole day even in the near future. The energy demand is expected to keep growing sharply and the expected increase in load demand was accommodated in this study for only 5 years even though the PV plants are expected to last for 25 years. This makes the validation at only high loads reasonable.
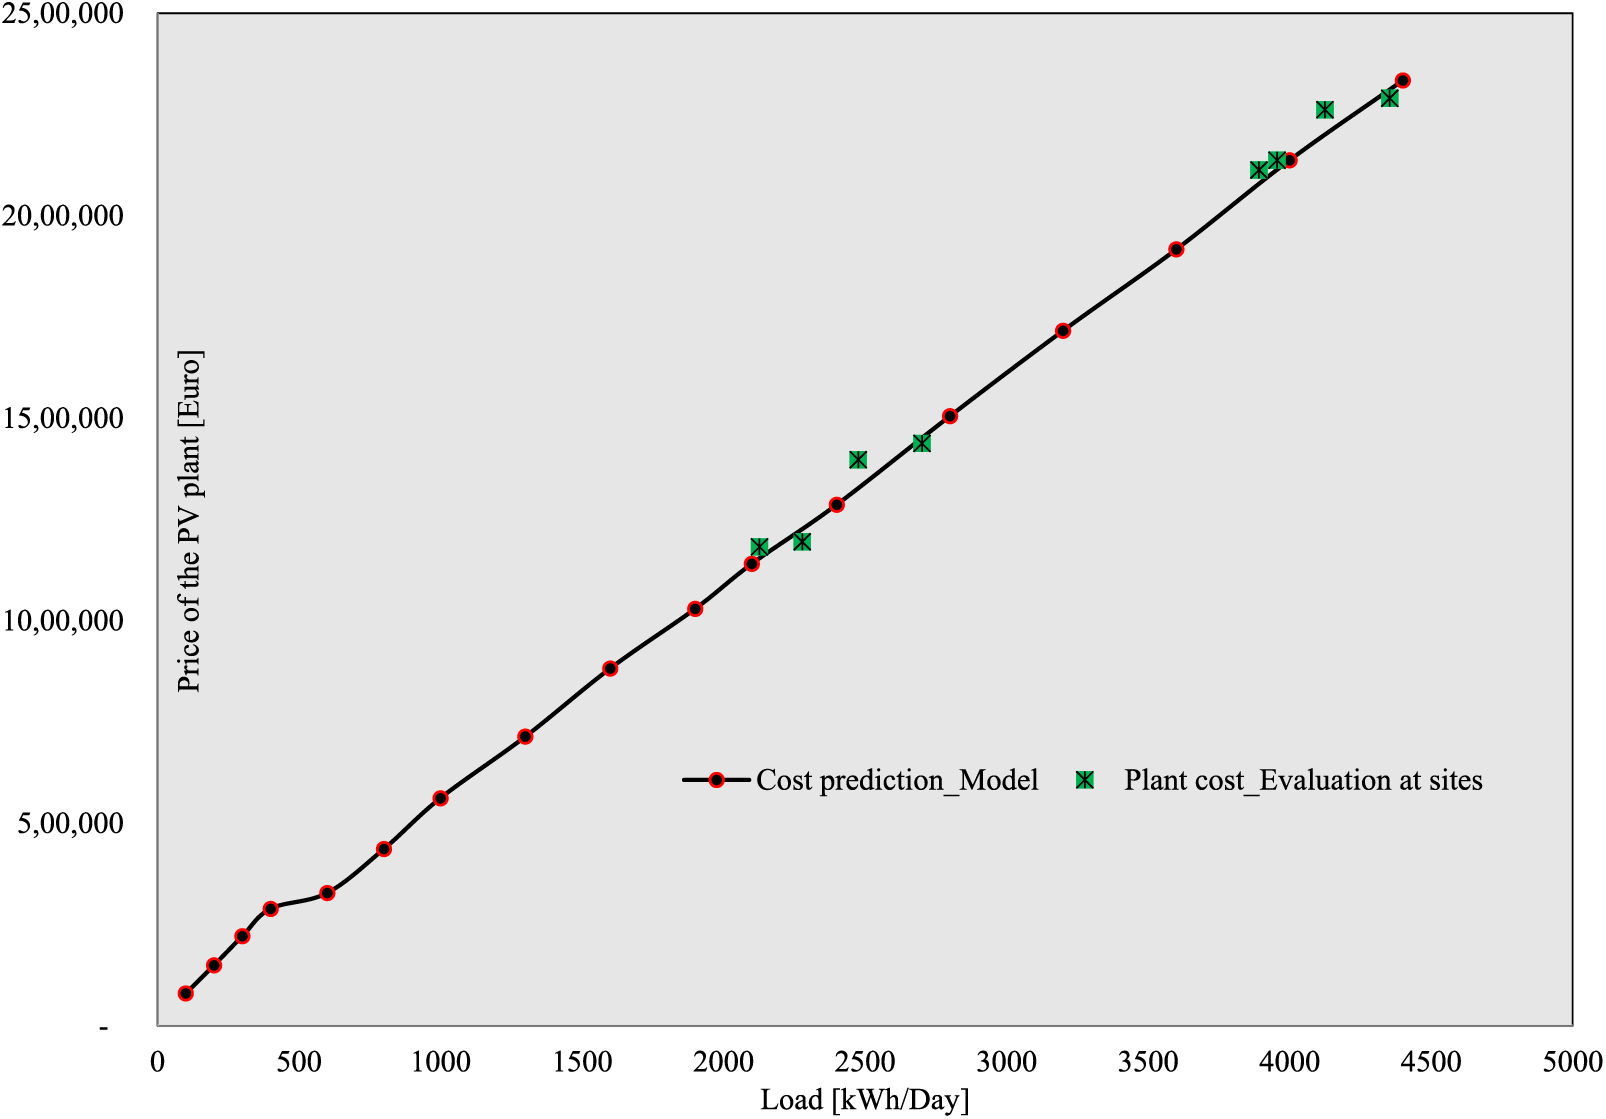
Figure 5: Installation cost per PV plant size (Load)
The financial performance of the developed PV plant models was characterised by both the Leviterised Cost Energy (LCOE) or cost of useful energy at production and the payback period. The LCOEs and the payback periods are presented in Figs. 6 and 7, respectively. As can be seen from Fig. 6, the LCOEs calculated using the developed model under different nominal load sizes and generalized conditions over the country were benchmarked to LCOEs calculated with site-specific data as inputs. Two cases were considered. In the first case, the LCOEs were estimated without considering incentives and subsidies that could be provided by both the government of Rwanda and the beneficial local administrative entities as well as the contribution from the community in the villages. While the second case considered incentives, subsidies, and community contributions equal to 20% of each plant’s total cost, see Table 4.
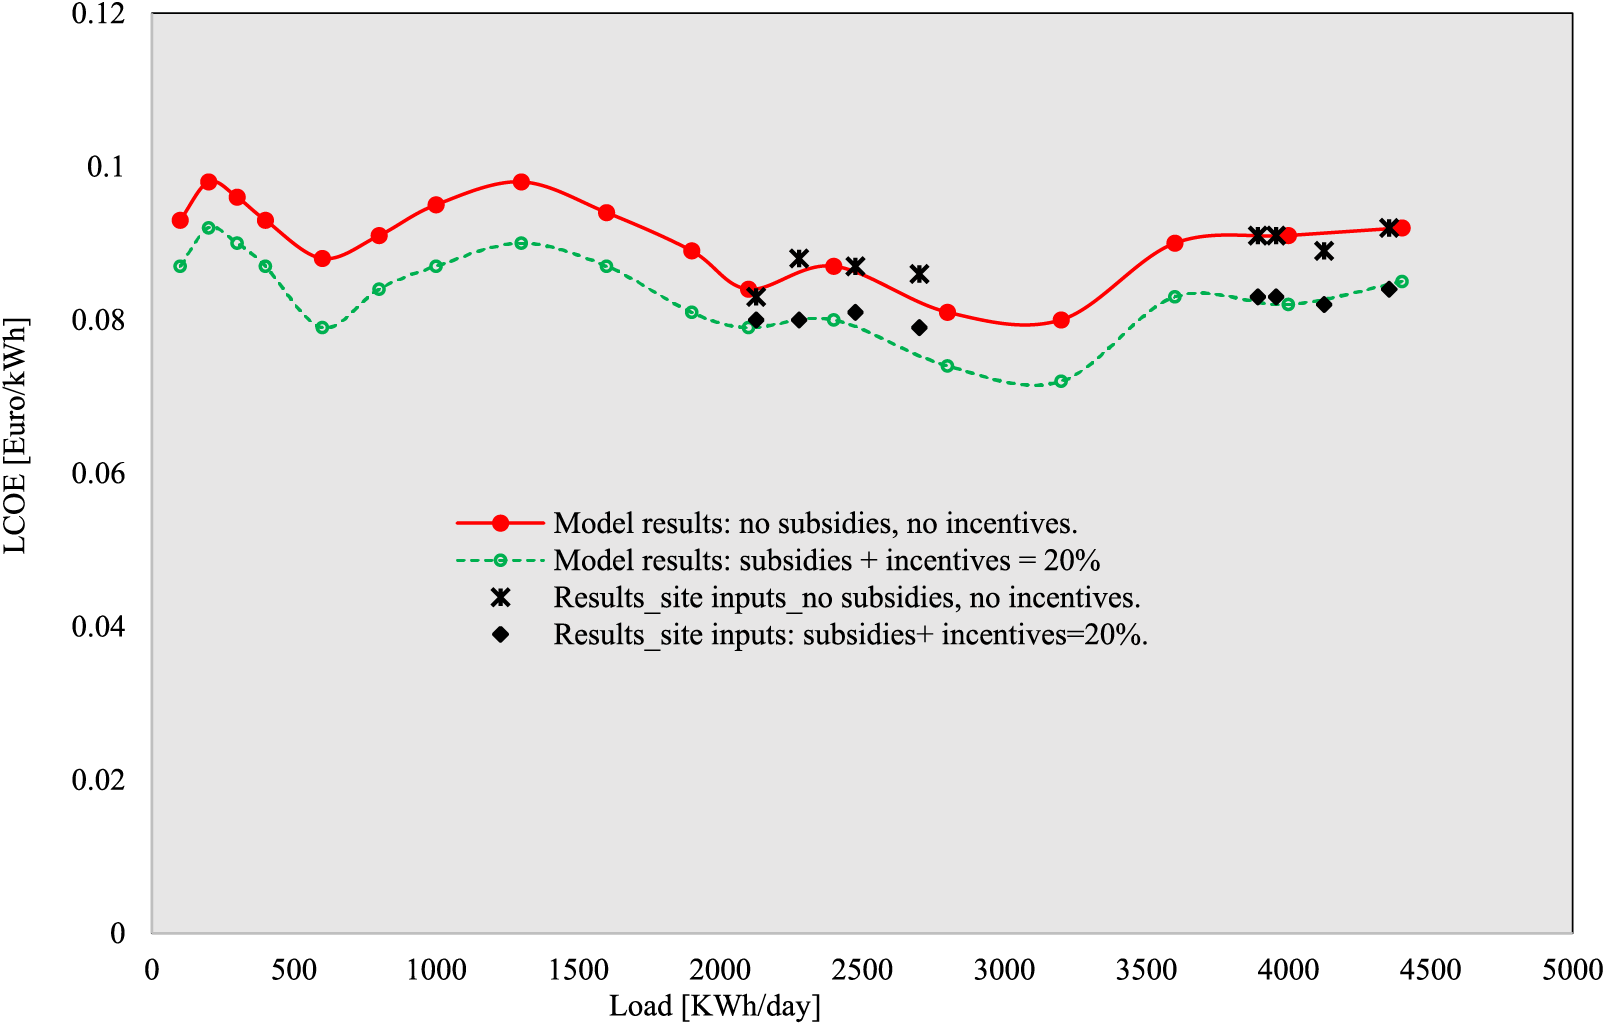
Figure 6: Levelised cost of energy
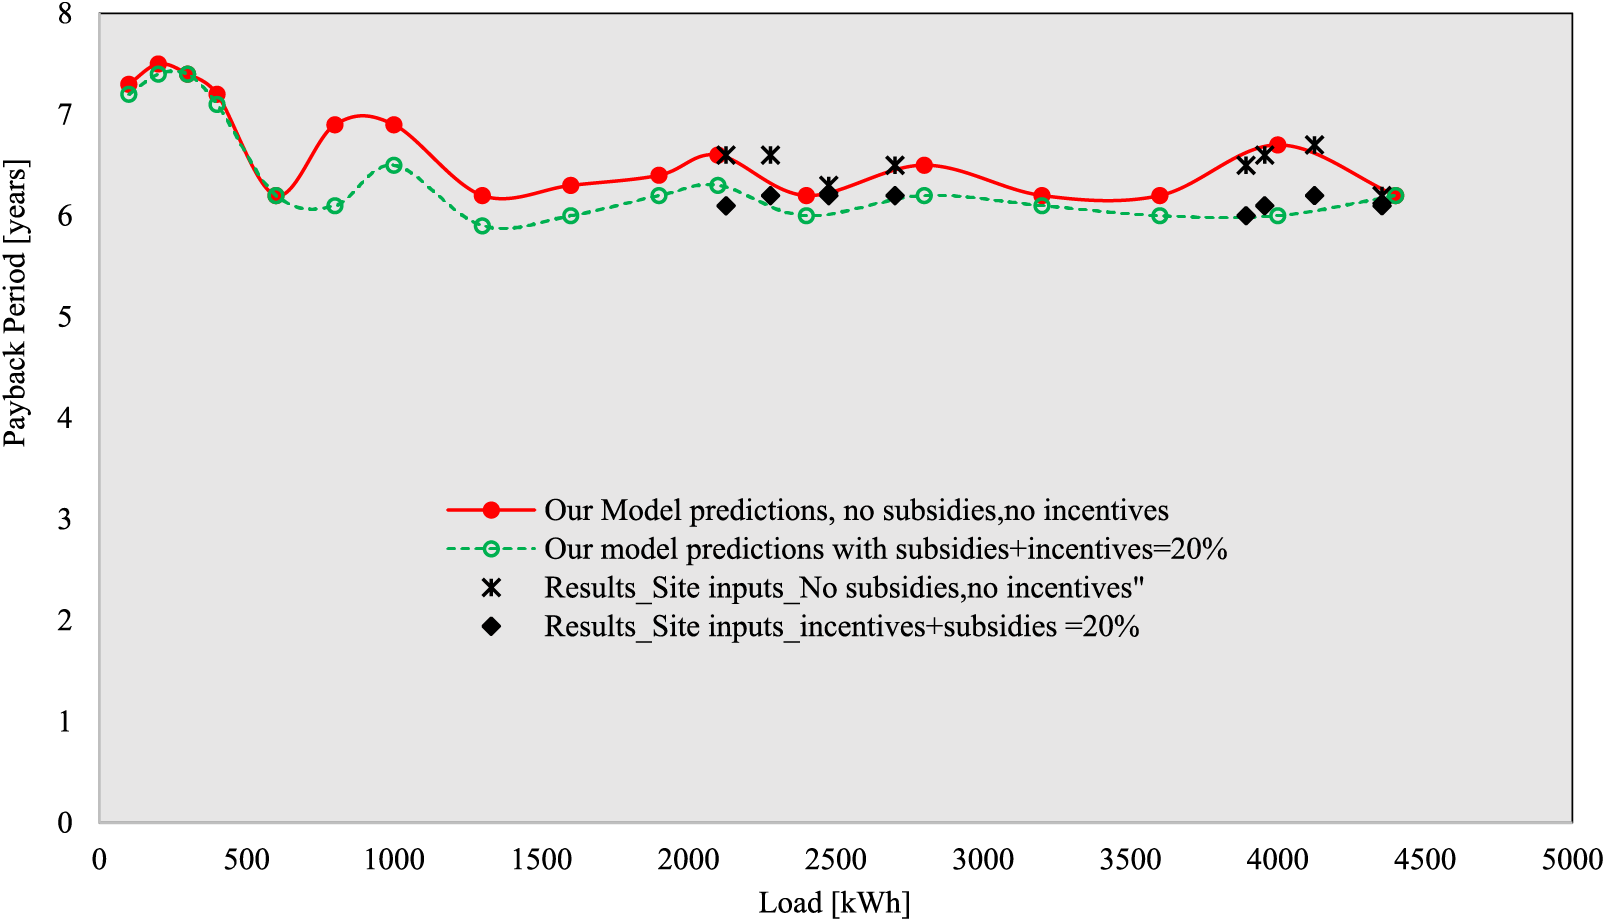
Figure 7: Payback periods
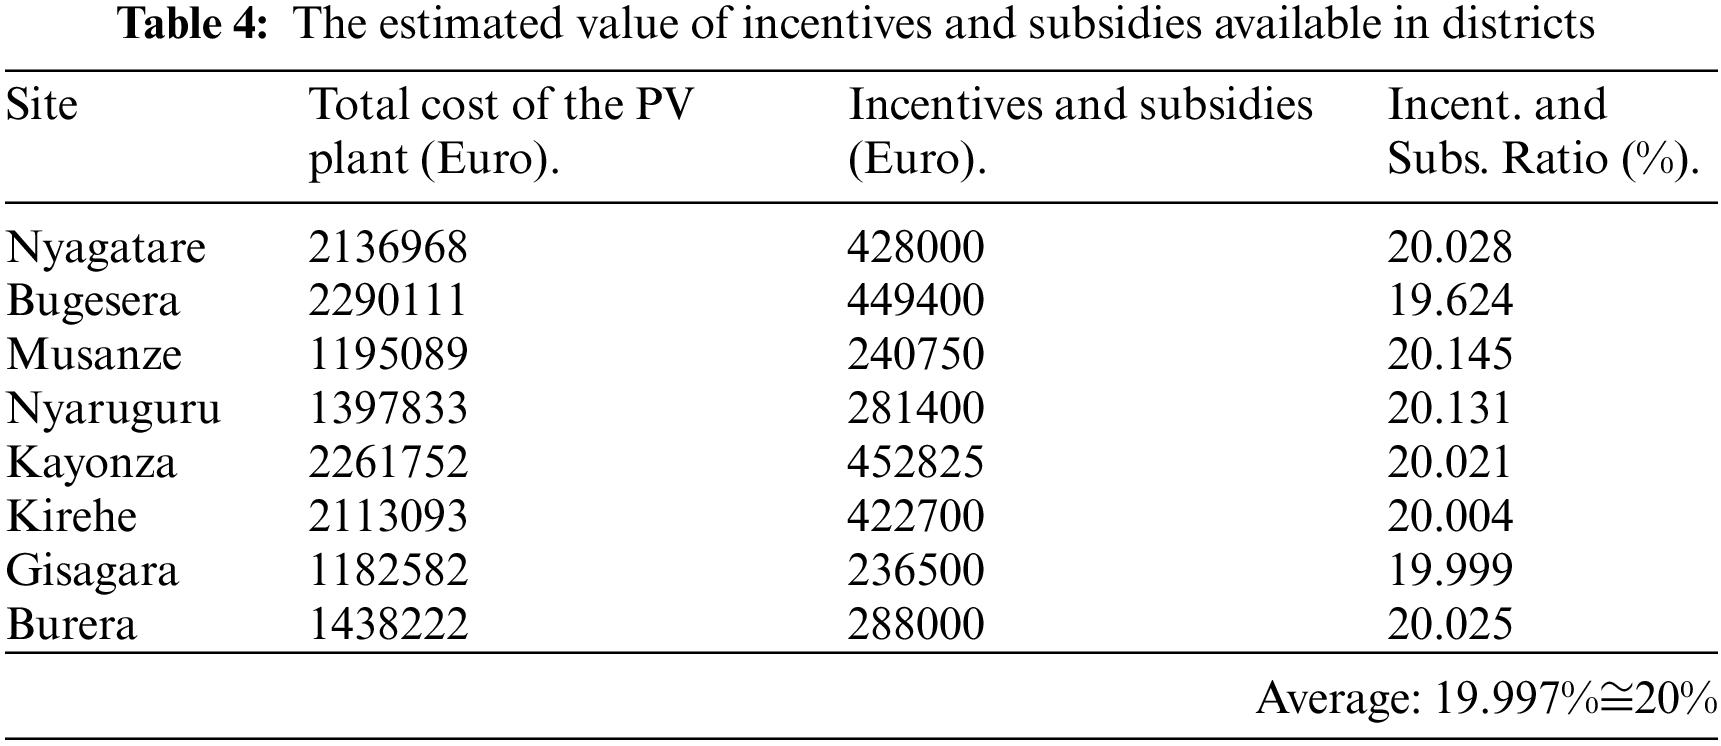
The available incentives and subsidies estimated are constituted by the exoneration of taxes, land costs, permitting and administrative fees and other contributions from the local administration. In addition, the local community’s contribution to land preparation and assuring the security of the plants were valued among factors influencing the drop in the total plants’ costs.
Likewise, the evaluation of the payback periods of the PV plants of different sizes showed that the subsidies and incentives are potentially significant as they can assist the investors to recover their capital in reduced periods.
Fig. 7 recapitulates the payback periods for the designed PV plants at different sites. The figure compares the values of these payback periods obtained using sites-specific-inputs to the ones from our extended predictive model developed for the PV plants to serve varied loads. As can be seen from the figure, the results of detailed field studies also match our model results. Also, it shows that incentivizing and subsiding the production of solar energy will alleviate the burden on investors as they considerably reduced the payback periods on the PV plants. As one can see, in some cases these periods to recoup the investments in the PV plants were reduced from 6.9 to 6.1 years. Another important remark that one can make is that the observed maximum payback period was 7.5 years. Noting that the lifetime of PV plants is 25 years, one can obviously confirm that the investors in development will be able to obtain financial gains for more than a decade.
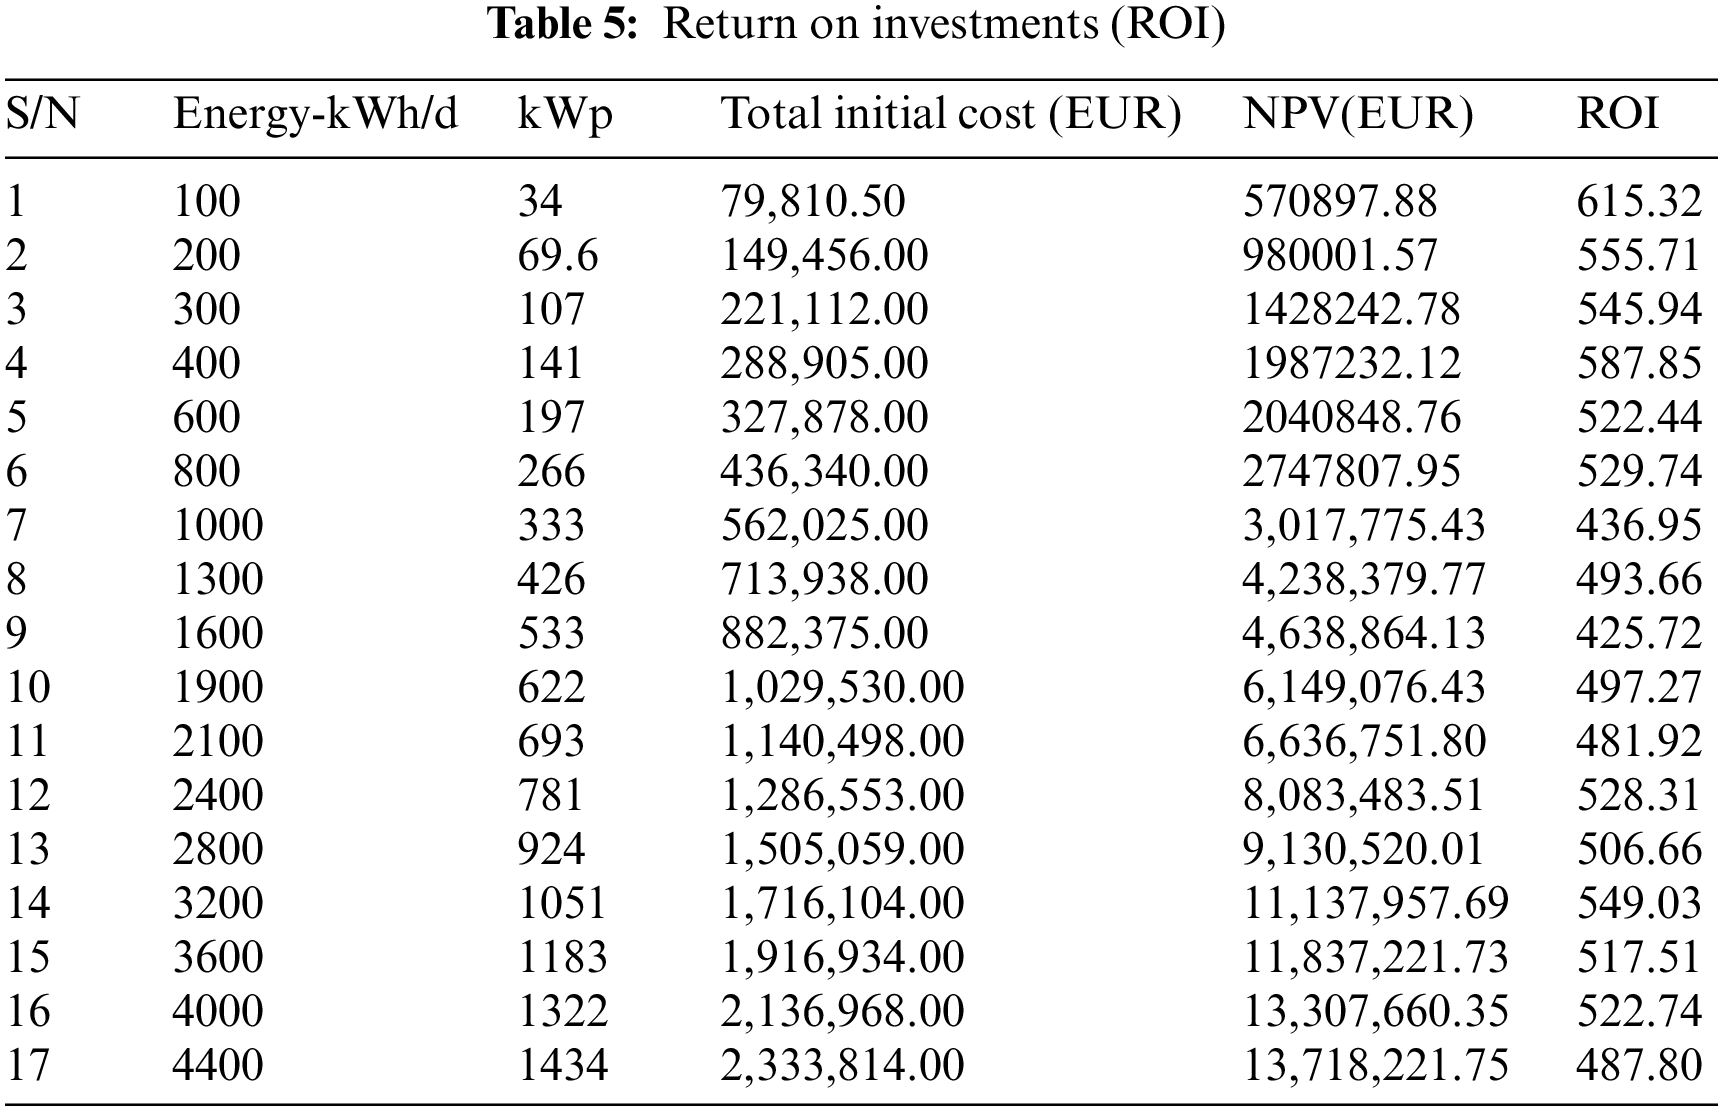
Moreover, to quantify further the potential financial interests for such big investments, it is necessary to determine the return on investments (ROI) for plants of various sizes. These estimates of return on investments are presented in Table 5. According to the findings in the table, the investments in the PV plants could lead to net profits between 425.72 and 615.32 per cent of the total investments over the plants’ lifetime of 25 years. In most cases, such profits are above 500% which justifies that such investments are worth making. However, such profits can only be achieved only if the consumers’ price is set at least equal to the LCOE.
The costs of susceptible to reduce below the Levelised Cost of Energy for the PV plants’ energy to be competitive on the national market. That is since the current price of electricity for consumers is set to 0.086 Euro/kWh for consumers that use less than 15 kWh per month and 0.180 Euro/kWh for consumers that uses more than 15 kWh per month. In Table 6, the financial benefits for customers were calculated considering the current cost of energy as per regulations. As can be seen from the table, small PV plants are not likely to make profits if they are only used by small consumers. The results indicate that the PV plants’ energy price can only be lower than the current energy price in Rwanda if a given community can consume more than 1600 kWh/day.
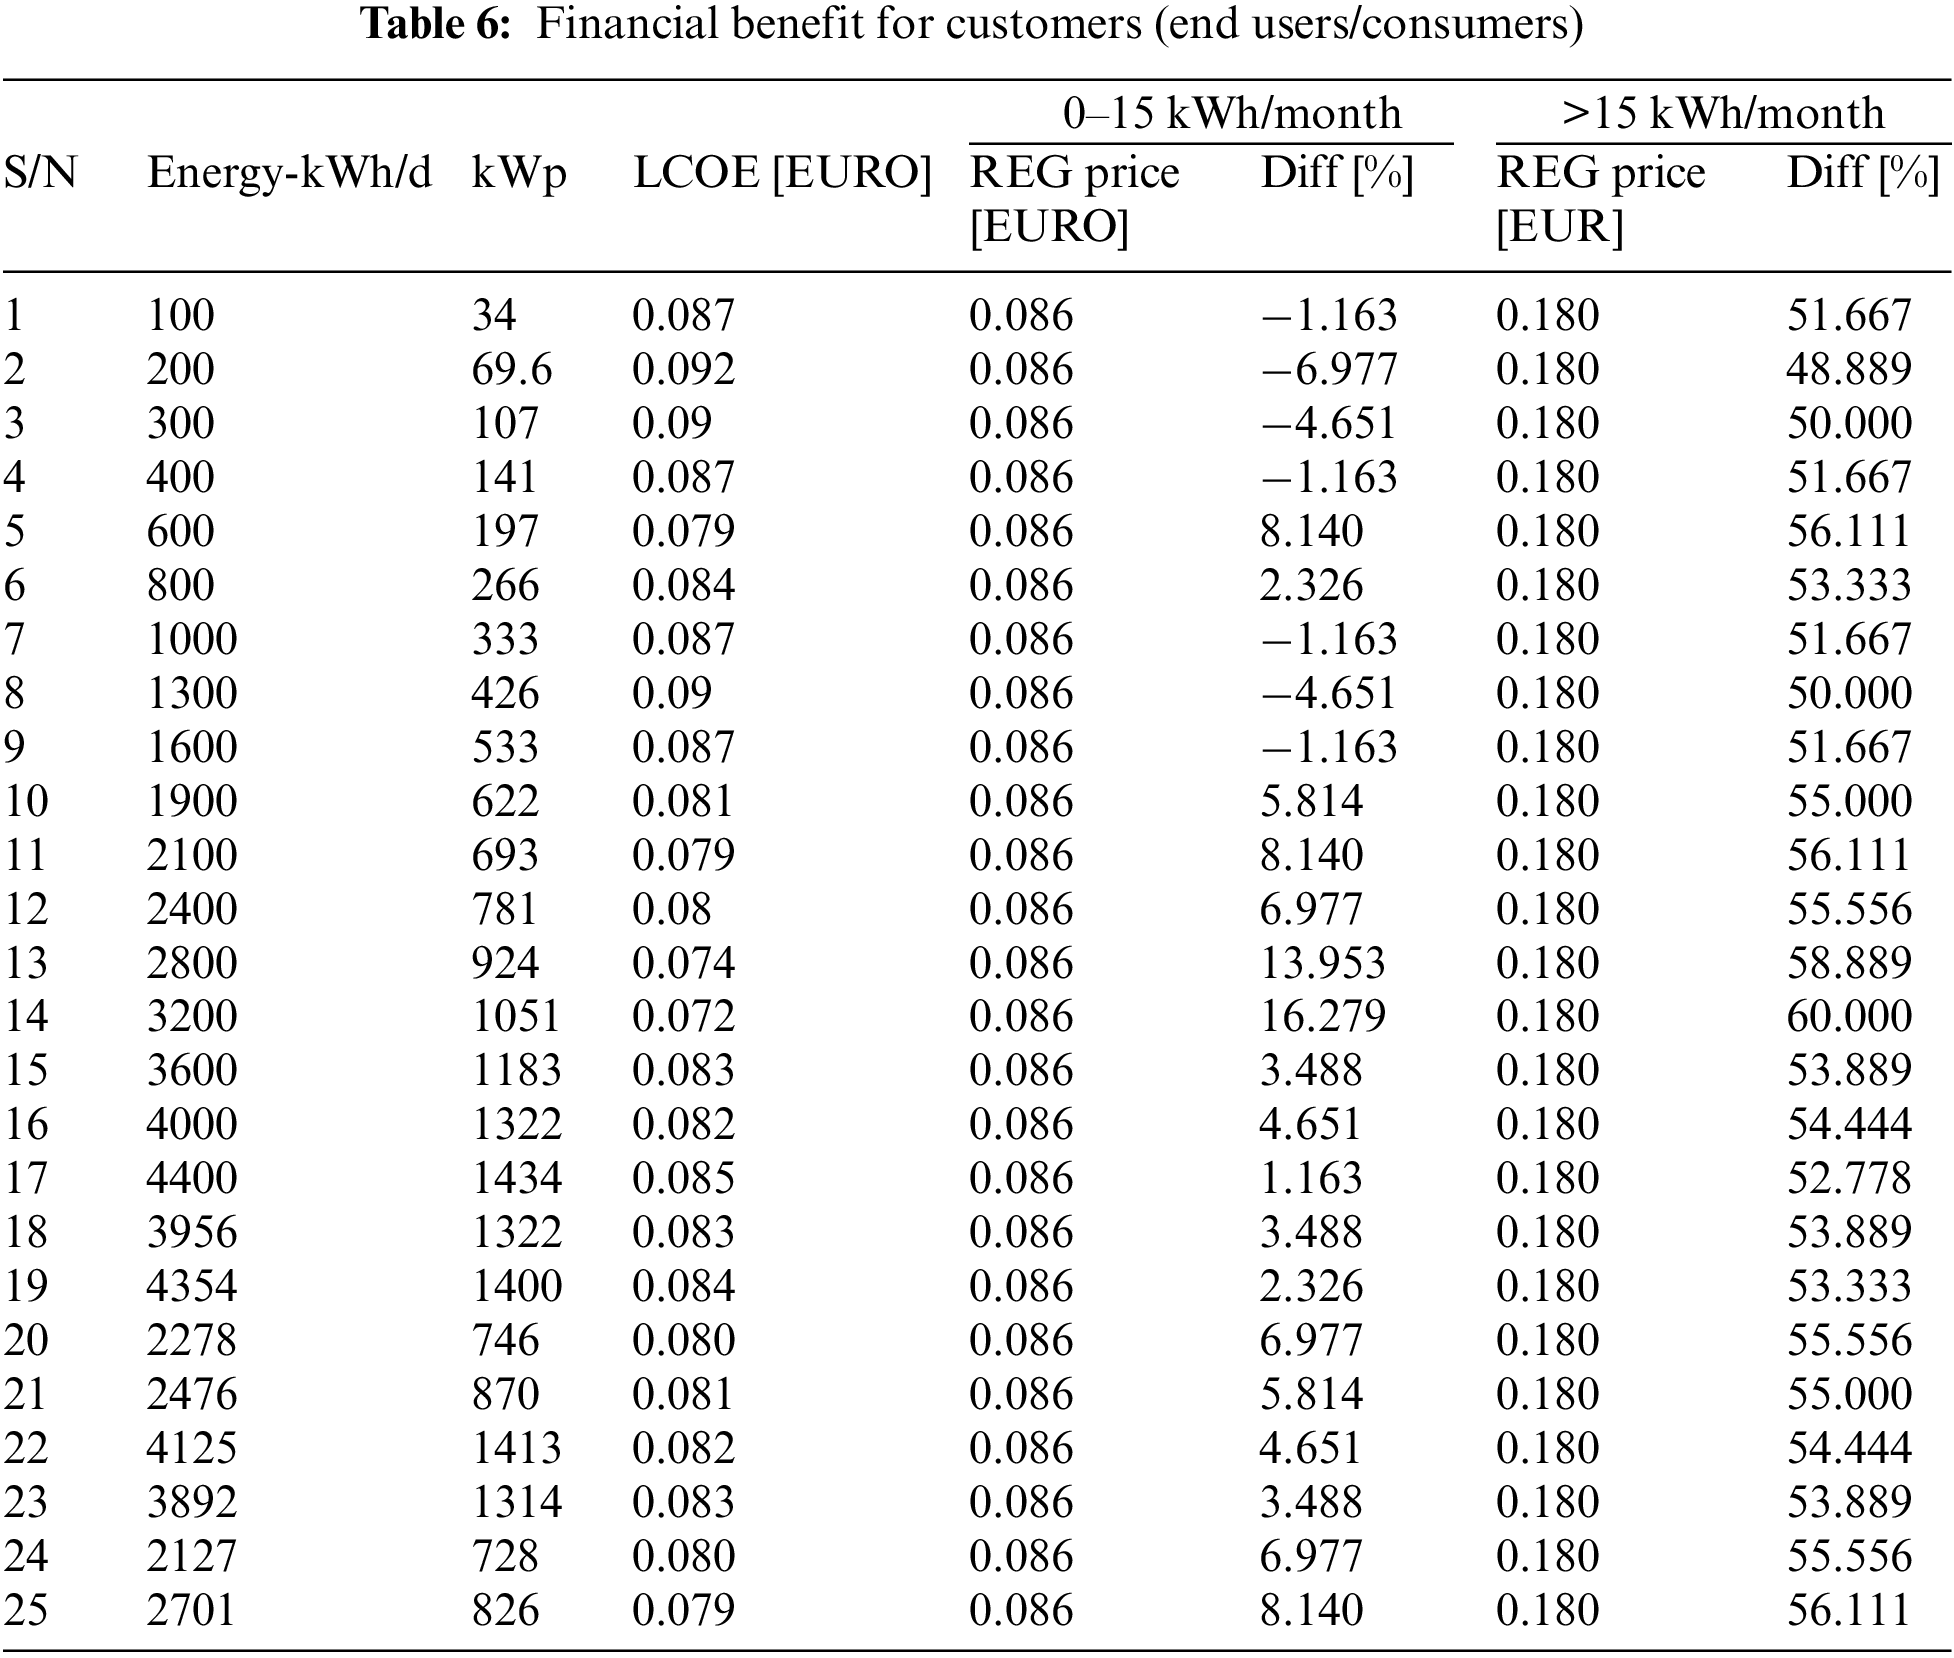
It is however obvious from the table that for the consumers of more 15 kWh/month, any PV plant development project will be financially competitive in the Rwandan energy market. The generated energy is expected to be 48.889% to 60% cheaper compared to the current energy price. The uncompetitive prices of small PV plant energy can be associated with the high price of batteries for energy storage and a large number of subsidies available for other forms of energy on the market.
Nevertheless, one can optimistically predict that PV plants’ energy will be very competitive on the market under any circumstances. That is likely to be influenced by two major factors. Firstly, the government and other organs are likely to increase the incentives and subsidies on the PV plants’ energy to raise the portion of clean renewable energy in the energy mix in Rwanda. For instance, the total production for eight designed solar PV plants under this study is expected to be 8.927 MW corresponding to an increase of 3.13% in the solar energy portion in the energy mix compared current total installed Capacity to generate in Rwanda 276.068 MW. That increases the total share of clean renewable solar energy to 7.33% from the current 4.2% percentage. That share is considerable and one can affirm that the incentives and subsidies for such considerable energy generation will be increases considerably.
4 Conclusion and Recommendations
This study aimed to characterise both technically and economically the PV plants for the production of solar energy for use by the rural communities in Rwanda. Specifically, describing the impact of the subsidies and incentives put in place on the affordability, profitability, and penetration of renewable solar PV energy was the major objective. The results of the study indicate that even though the energy loads are greatly increasing in rural communities in Rwanda due to the increasing number of households and farming mechanization, the available solar resources and solar distribution can allow for achieving full electrification by the use of solar PV plants.
Both the modelling and the field-data-based characterization agree with the results of many other studies that subsidies and incentives significantly influence renewable energy integration and increase the profitability of solar PV systems. In fact, the study noted a return investment of up to 615.32 percent and an increment of renewable energy share of 8.927 MW equivalent to 3.13% in the energy mix as well as the drop in the payback period and Levelised Cost of Energy when 20% incentives and subsidies are applied.
Such a study is unique as it has designed and sized the PV plant that can serve the energy load for households, community businesses, and agriculture activities in specific off-grid regions in Rwanda. Such a study has never been done. The findings of this study are particularly significant as they can serve to estimate the potential financial profits and other benefits for potential developers of the PV plants, the community, and the government of Rwanda. Noting that the study was limited to standalone solar PV plants; the heavy costs of battery storage are unavoidable to assure the plants’ autonomy. Hence, it is recommended that future studies may consider carrying out such a techno-economic characterization on grid-connected solar PV plants in order to check if that could be the most profitable option. It can also be recommended that future study could assess the possibility of developing hybrid solar-hydro PV plants and estimate their profits under Rwanda’s climatic and economic situations.
Acknowledgement: None.
Funding Statement: The authors received no specific funding for this study.
Author Contributions: The authors confirm contribution to the paper as follows: study conception and design: M. Kayitare, A. D. Gace, A. Sendegeya; data collection: M. Kayitare; analysis and interpretation of results: M. Kayitare, A. D. Gace. Author; draft manuscript preparation: M. Kayitare, A. D. Gace. All authors reviewed the results and approved the final version of the manuscript.
Availability of Data and Materials: The data used to support the findings of this study are included within the article. Any additional information, data or materials are available and can be provided when requested.
Conflicts of Interest: The authors declare that they have no conflicts of interest to report regarding the present study.
References
1. Ganda, F., Ngwakwe, C. C. (2014). Role of energy efficiency on sustainable development. Environmental Economics, 5(1), 86–99. [Google Scholar]
2. Jacobsson, S., Lauber, V. (2006). The politics and policy of energy system transformation—Explaining the German diffusion of renewable energy technology. Energy Policy, 34(3), 256–276. [Google Scholar]
3. Friedmann, J. (1992). Empowerment: The politics of alternative development. USA: John Wiley & Sons. [Google Scholar]
4. Gross, R., Heptonstall, P. (2010). Time to stop experimenting with UK renewable energy policy. UK: Imperial College Centre for Energy Policy and Technology. [Google Scholar]
5. Sen, A. (2013). A survey of sustainable development: Social and economic dimensions, vol. 6. USA: Island Press. [Google Scholar]
6. Umar, N. H., Bora, B., Banerjee, C., Umar, N., Panwar, B. S. (2018). Study of different PV Technologies under Composite Climates using test beds at NISE View project Solar Photovoltaic Hub at BESU View project Comparison of different PV power simulation softwares: Case study on performance analysis of 1 MW grid-connected P. http://www.ijesi.org%7C%7Cvolumewww.ijesi.org [Google Scholar]
7. Şevik, S. (2022). Techno-economic evaluation of a grid-connected PV-trigeneration-hydrogen production hybrid system on a university campus. International Journal of Hydrogen Energy, 47(57), 23935–23956. [Google Scholar]
8. Hackenesch, C., Högl, M., Knaepen, H., Iacobuta, G., Asafu-Adjaye, J. (2021). Green transitions in Africa–Europe relations: What role for the European green deal. Belgium: ETTG Publication. [Google Scholar]
9. Hirth, L., Steckel, J. C. (2016). The role of capital costs in decarbonizing the electricity sector. Environmental Research Letters, 11(11), 114010. [Google Scholar]
10. Tagliapietra, S., Zachmann, G., Edenhofer, O., Glachant, J. M., Linares, P. et al. (2019). The European union energy transition: Key priorities for the next five years. Energy Policy, 132, 950–954. [Google Scholar]
11. Lu, Y., Khan, Z. A., Alvarez-Alvarado, M. S., Zhang, Y., Huang, Z. et al. (2020). A critical review of sustainable energy policies for the promotion of renewable energy sources. Sustainability, 12(12), 1–30. https://doi.org/10.3390/su12125078 [Google Scholar] [CrossRef]
12. Agency, I. E., Outlook, W. E. (2019). World energy outlook 2019. https://www.iea.org/reports/world-energy-outlook-2019 [Google Scholar]
13. IEA-PVPS (2020). National survey report of pv power applications in Italy 2020. https://iea-pvps.org/wp-content/uploads/2021/11/NSR_Italy_2020.pdf [Google Scholar]
14. Goldthau, A. (2016). The handbook of global energy policy. USA: John Wiley & Sons. [Google Scholar]
15. Crowley, M. (2006). The agreement on subsidies and countervailing measures: Tying one’s hand through the WTO. USA: Federal Reserve Bank of Chicago. [Google Scholar]
16. Clarke, P. A., Horlick, G. N. (2005). The agreement on subsidies and countervailing measures. In: The world trade organization: Legal, economic and political analysis, pp. 679–734. Germany: Springer. [Google Scholar]
17. Riedy, C., Diesendorf, M. (2003). Financial subsidies to the Australian fossil fuel industry. Energy Policy, 31(2), 125–137. [Google Scholar]
18. Badcock, J., Lenzen, M. (2010). Subsidies for electricity-generating technologies: A review. Energy Policy, 38(9), 5038–5047. https://doi.org/10.1016/j.enpol.2010.04.031 [Google Scholar] [CrossRef]
19. de Moor, A. (2001). Towards a grand deal on subsidies and climate change. Natural Resources Forum, 25(2), 167–176. https://doi.org/10.1111/j.1477-8947.2001.tb00758.x [Google Scholar] [CrossRef]
20. Goldberg, G. (2000). Federal energy subsidies: Not all technologies are created equal (research report) . https://www.unep.org/resources/factsheet/renewable-energy-performance-platform [Google Scholar]
21. Lenzen, M. (2010). Current state of development of electricity-generating technologies: A literature review. Energies, 3(3), 462–591. https://doi.org/10.3390/en3030462 [Google Scholar] [CrossRef]
22. Hafner, M., Luciani, G. (2022). The palgrave handbook of international energy economics. https://library.oapen.org/handle/20.500.12657/57011 [Google Scholar]
23. Tran, T. T. D., Smith, A. D. (2018). Incorporating performance-based global sensitivity and uncertainty analysis into LCOE calculations for emerging renewable energy technologies. Applied Energy, 216, 157–171. https://doi.org/10.1016/j.apenergy.2018.02.024 [Google Scholar] [CrossRef]
24. Zhao, Z. Y., Chen, Y. L., Thomson, J. D. (2017). Levelized cost of energy modeling for concentrated solar power projects: A China study. Energy, 120, 117–127. https://doi.org/10.1016/j.energy.2016.12.122 [Google Scholar] [CrossRef]
25. Chang, K. C., Hagumimana, N., Zheng, J., Asemota, G. N. O., Niyonteze, J. D. D. et al. (2021). Standalone and minigrid-connected solar energy systems for rural application in Rwanda: An in situ study. USA: Hindawi Publishing Corporation. [Google Scholar]
26. Bimenyimana, S., Asemota, G. N. O., Li, L. (2018). The state of the power sector in Rwanda: A progressive sector with ambitious targets. Frontiers in Energy Research, 68, 2845. [Google Scholar]
27. Elkadeem, M. R., Kotb, K. M., Elmaadawy, K., Ullah, Z., Elmolla, E. et al. (2021). Feasibility analysis and optimization of an energy-water-heat nexus supplied by an autonomous hybrid renewable power generation system: An empirical study on airport facilities. Netherlands: Elsevier. [Google Scholar]
Cite This Article
 Copyright © 2023 The Author(s). Published by Tech Science Press.
This work is licensed under a Creative Commons Attribution 4.0 International License , which permits unrestricted use, distribution, and reproduction in any medium, provided the original work is properly cited.
 Downloads
 Citation Tools