
 Submit a Paper
 Propose a Special lssue
 Open Access
ARTICLE
Fault Current Identification of DC Traction Feeder Based on Optimized VMD and Sample Entropy
1 Hebei Provincial Collaborative Innovation Center of Transportation Power Grid Intelligent Integration Technology and Equipment, Shijiazhuang Tiedao University, Shijiazhuang, 050043, China
2 School of Electrical and Electronic Engineering, Shijiazhuang Tiedao University, Shijiazhuang, 050043, China
3 Tianjin Branch of China Railway Shanghai Design Institute Group Corporation Limited, Tianjin, 300073, China
* Corresponding Author: Zhixian Qi. Email:
(This article belongs to the Special Issue: Fault Diagnosis and State Evaluation of New Power Grid)
Energy Engineering 2023, 120(9), 2059-2077. https://doi.org/10.32604/ee.2023.028595
Received 27 December 2022; Accepted 14 March 2023; Issue published 03 August 2023
 View Full Text
 Download PDF
Abstract
A current identification method based on optimized variational mode decomposition (VMD) and sample entropy (SampEn) is proposed in order to solve the problem that the main protection of the urban rail transit DC feeder cannot distinguish between train charging current and remote short circuit current. This method uses the principle of energy difference to optimize the optimal mode decomposition number k of VMD; the optimal VMD for DC feeder current is decomposed into the intrinsic modal function (IMF) of different frequency bands. The sample entropy algorithm is used to perform feature extraction of each IMF, and then the eigenvalues of the intrinsic modal function of each frequency band of the current signal can be obtained. The recognition feature vector is input into the support vector machine model based on Bayesian hyperparameter optimization for training. After a large number of experimental data are verified, it is found that the optimal VMD_SampEn algorithm to identify the train charging current and remote short circuit current is more accurate than other algorithms. Thus, the algorithm based on optimized VMD_SampEn has certain engineering application value in the fault current identification of the DC traction feeder.Keywords
Nomenclature
| VMD | Variational mode decomposition |
| IMF | Intrinsic modal function |
| ILMD | Improved local mean decomposition |
| SampEn | Sample entropy |
| EMD | Empirical mode decomposition |
| EWT | Empirical wavelet transform |
| ILMD | Improved local mean decomposition |
| SVM | Support vector machine |
| PMSM | Permanent magnet synchronous motor |
| Person correlation coefficient | |
| Energy difference |
The reliability of the urban rail transit power supply system is very important under complex driving conditions. Currently, the traction substation feeders of the urban rail transit in China are responsible for protecting the power supply security of traction network lines in power supply regions mainly by using the current rising rate and current increment protection (DDL protection). However, the misoperation of relay protection in the urban rail transit is one of the large hidden dangers that can threaten the safe operation of the electrical power system [1,2]. During rush hour, the feeders generate a large peak current when the train passes the insulating sections. In this moment, the current signal on the feeder is most consistent with current variation when the remote short circuit fault occurs. Thus, DDL protection cannot distinguish frequent misoperations of safety restraints caused by two kinds of current [3,4]. Researchers [5–7] created an accurate model of the AC/DC power supply system of the urban rail transit and offered rationales for the identification of fault current. In order to identify two kinds of current accurately, Yu et al. [8] used the method of Mexh wavelet transform to perform feature extraction involving the difference between two kinds of current in the time constant to accomplish current identification. Yang et al. [9] identified the oscillation current and fault current by using the method of improved local mean decomposition (ILMD) and multi-scale time-frequency entropy. Liu et al. [10] distinguished faults between short circuit fault current and train over section current in a time-frequency domain by using a method based on empirical wavelet transform (EWT) and an energy entropy method when the energy distribution was different. Researchers [11] identified the short circuit of the traction power supply system by using a method based on EMD and singular value entropy when the train charging current and remote short circuit current were different. However, among these methods, the Mexh wavelet transform method lacks adaptability. When there are fewer signal poles, the EMD-based method becomes inapplicable, leading to the occurrence of modal aliasing phenomenon. Additionally, the partitioning approach utilized by the EWT-based method in the frequency region lacks rationality, and the decomposition capacity is relatively weak as well.
In recent years, machine learning has gained widespread usage in the field of state evaluation and pattern recognition. In the literature [12,13], a modified feedforward long-short term memory modeling method was employed, considering the variations in current, voltage, and temperature. This approach successfully achieved accurate prediction of the battery’s charging state throughout its entire life cycle. In another study [14], an enhanced VMD energy entropy technique was utilized to extract vibration characteristics of circuit breakers, coupled with support vector machine (SVM) for fault state determination. The experiment demonstrated effective extraction of circuit breaker operating states and fault classification even with a limited number of samples. Similarly, literature [15] applied an optimized parameter VMD-based feature extraction method combined with sample entropy and SVM for motor bearing fault diagnosis, leading to significantly improved accuracy in rolling bearing fault diagnosis. Additionally, in literature [16], a hybrid algorithm of VMD and multidimensional entropy effectively identified short circuit current and atypical load current. However, the parameter selection of VMD in this approach did not reach the optimal level, as the decomposition effect of VMD was influenced by the number of decomposed signal components, resulting in inaccurate analysis outcomes due to excessive or insufficient decomposition. Therefore, selecting an appropriate value for parameter k before decomposition is crucial for the wide applicability of VMD. To address these issues, this paper proposes a fault current identification algorithm for DC traction feeders based on optimized VMD and sample entropy. Firstly, VMD pre-decomposition is performed on the DC traction feeder current signal, followed by calculating the energy sum of each IMF component signal under different k values. Secondly, the optimal number of modal decompositions is determined based on the selection criterion of the largest energy difference for VMD decomposition of the current signal. The optimal IMF components obtained after decomposing the two currents are extracted using SampEn and then fed into an SVM model based on Bayesian hyperparameter optimization for training. Finally, the trained model is used for current identification. Simulation and measurement signal analysis, compared with EMD_SampEn and VMD_SampEn, confirm that the proposed current identification method effectively identifies DC traction feeder fault currents with higher accuracy than the aforementioned methods.
2 Train Charging Current and Remote Short Circuit Current
To investigate the causes of DDL protection misoperation, a comprehensive model of the tractive power supply system for urban rail transit and trains is developed in order to capture the remote short circuit current and train charging current on the DC traction feeders. Drawing on the AC/DC power supply system modeling theory presented in literature [5,6], this study constructs a simulation model encompassing the main transformer station, medium voltage ring, traction substation, and traction network. The schematic diagram of the urban rail transit traction power supply system simulation is depicted in Fig. 1. Analyzing the transient behavior of the feeder current signal requires a detailed examination of the train charging current and remote short circuit current due to the limitations of the equivalent train as a power source. Consequently, a more sophisticated model is needed. In literature [17], the author employed a three-phase induction motor to represent the urban rail transit train. However, in recent years, the utilization of permanent magnet synchronous motors (PMSMs) in traction drive systems has been growing steadily, owing to advancements in permanent magnet materials and power electronics. PMSMs offer higher power density compared to asynchronous motors and exhibit superior efficiency when considering equal volume. Therefore, this article establishes DC train models based on the vector control of PMSMs [18] to represent the new generation of urban rail transit trains employing PMSMs as their power source. The simulation model comprises an LC filter module, a traction inverter module, and a permanent magnet synchronous motor (PMSM). The simulation model of the PMSM train is illustrated in Fig. 2.
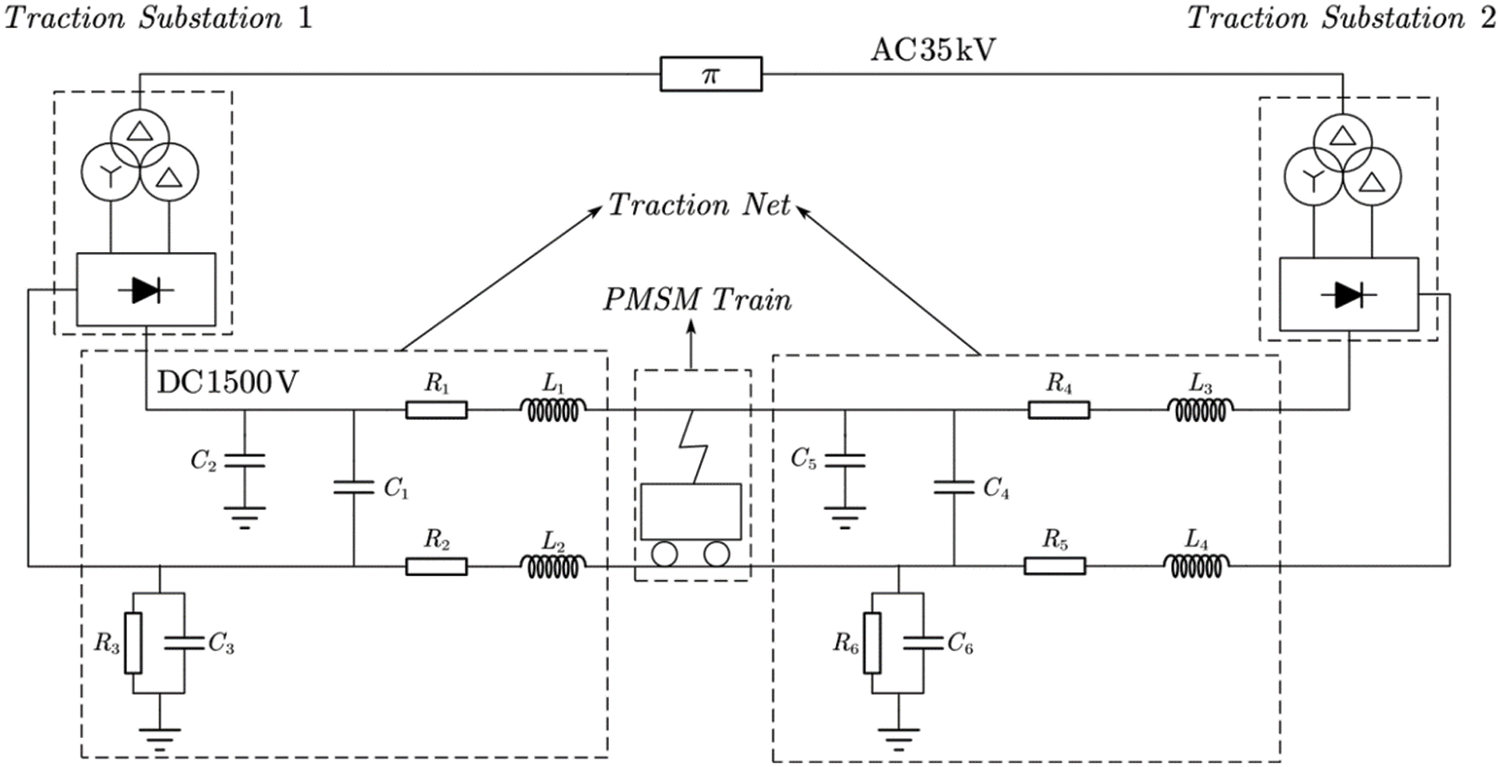
Figure 1: Simulation diagram of traction power supply system for urban rail transit
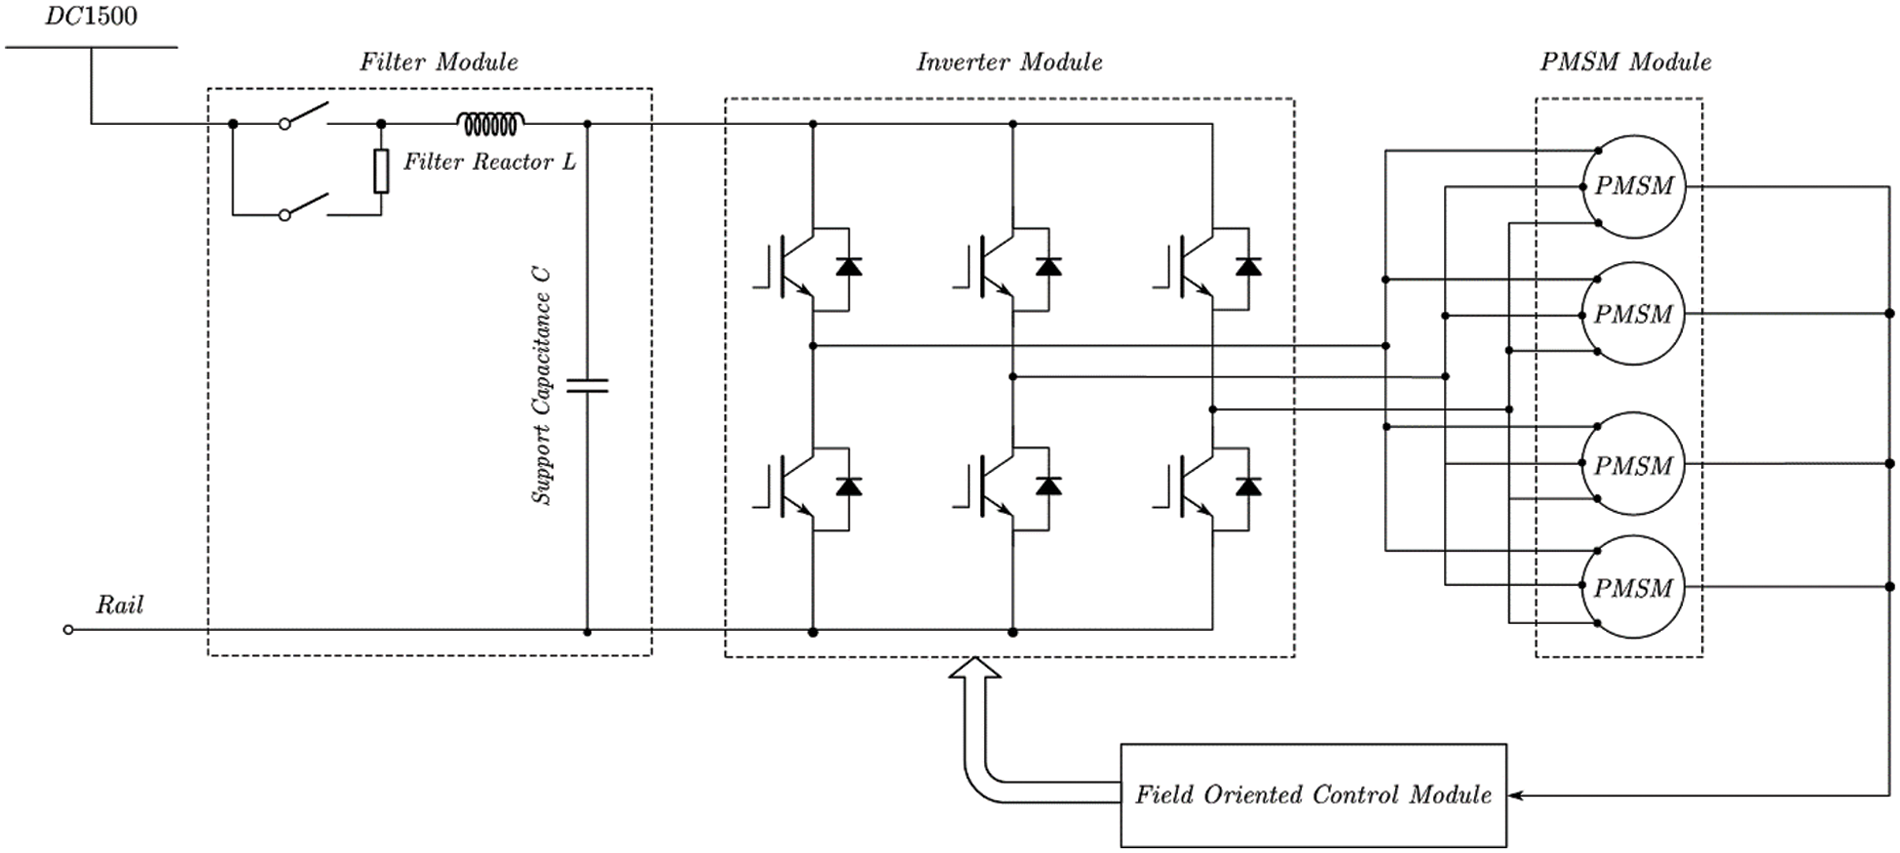
Figure 2: Train simulation model of PMSM train
The PMSM train model is employed as a load in the simulation of the traction power supply system for urban rail transit, enabling the analysis of the remote short circuit current and train charging current. Fig. 3 illustrates the simulation waveforms of these two currents, demonstrating the consistency between the simulated train charging current waveform and the field measured data waveform mentioned in literature [17]. This confirms the accuracy of the simulation model. The field measured train charging current waveform is presented in Fig. 4.
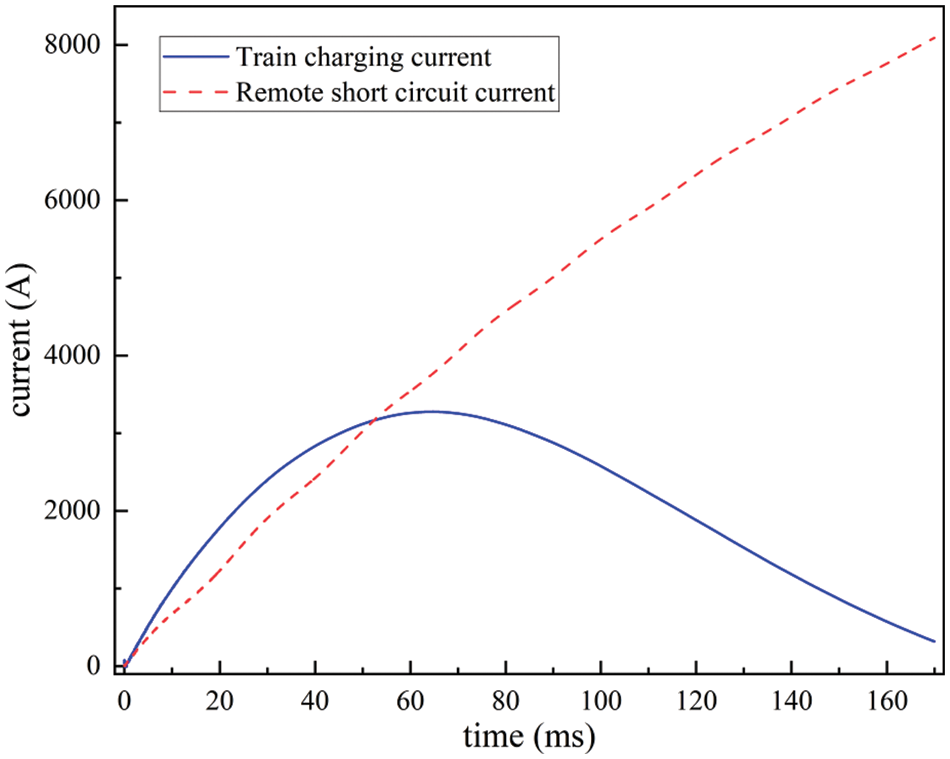
Figure 3: Train charging current and remote short circuit current
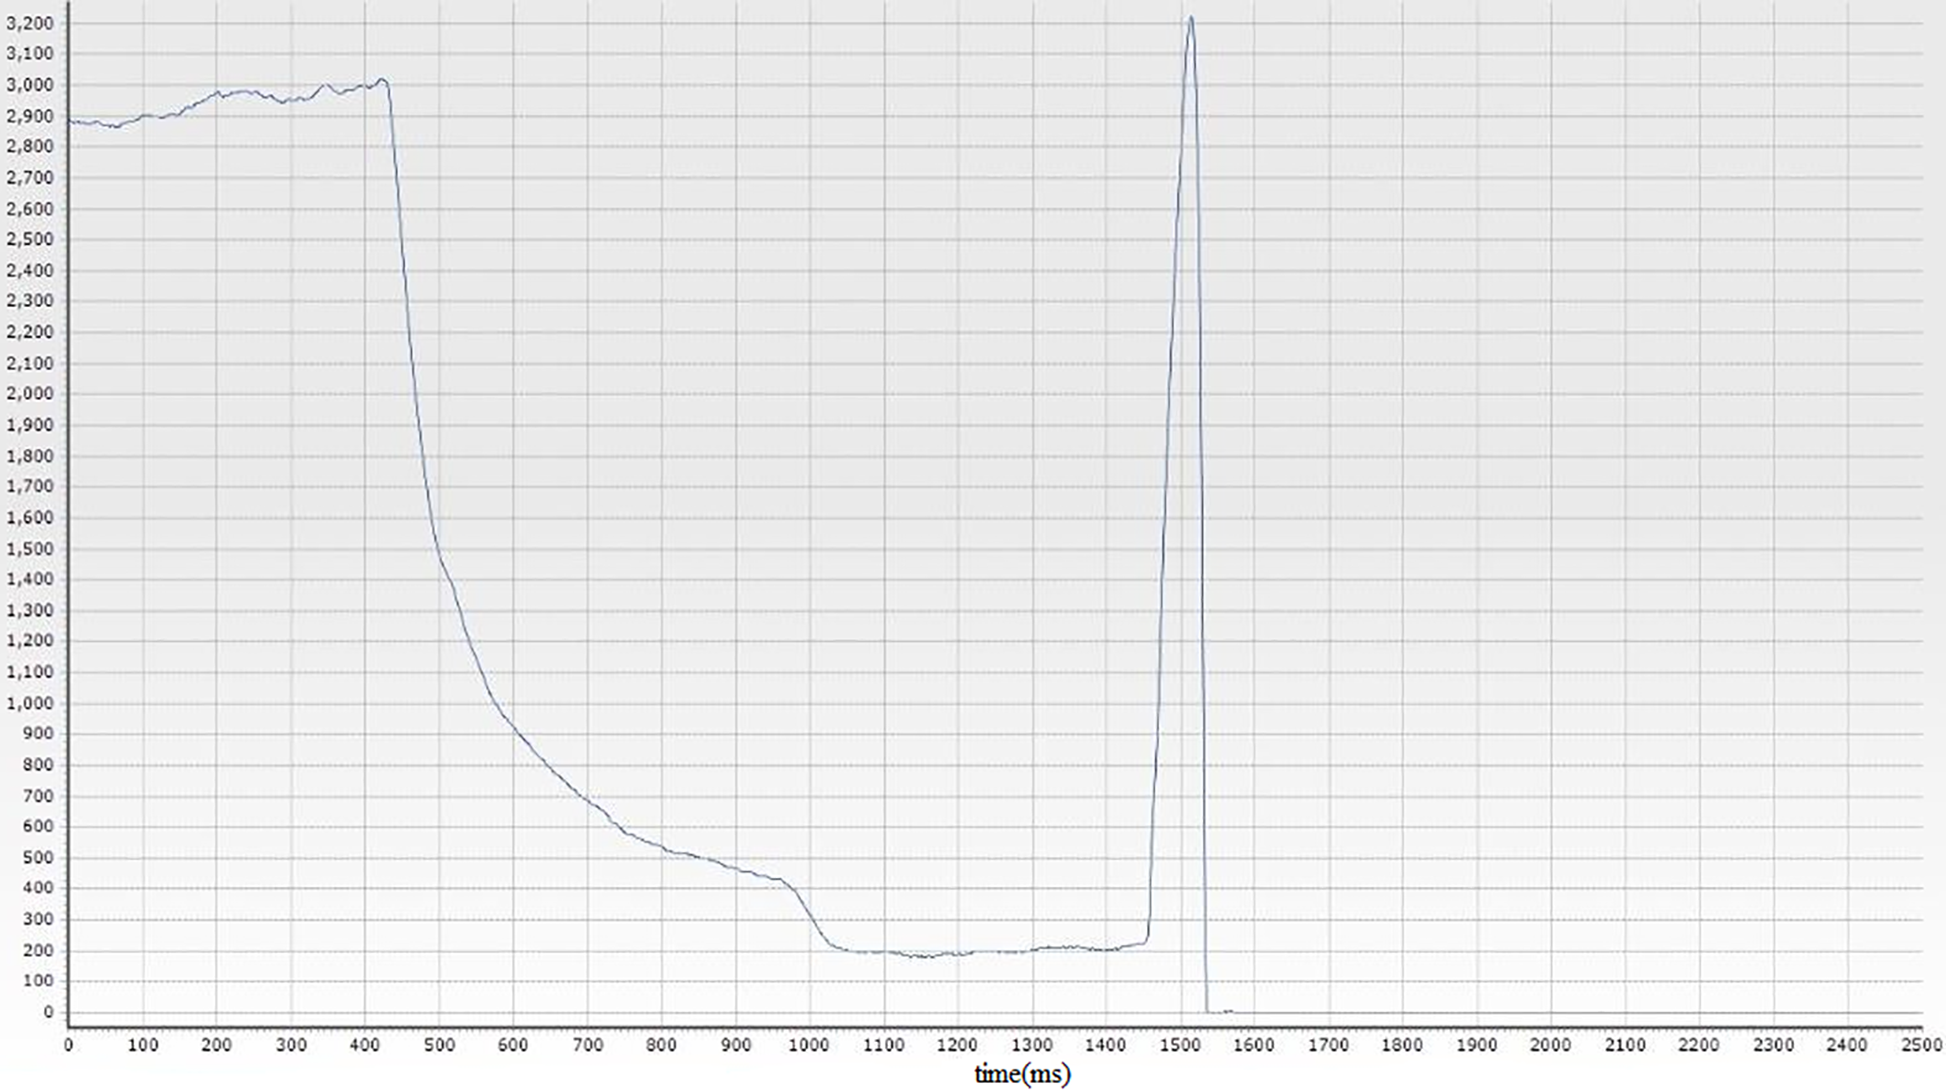
Figure 4: Train charging current is actually measured on site
As depicted in Fig. 3, it is evident that the rate of current rise for both the remote short circuit current and train charging current exhibits similarity during the interval of 0 to 40 ms. Additionally, the amplitude of the train charging current surpasses that of the remote short circuit current. Consequently, the train charging current is highly prone to causing DDL protection misoperation. Subsequent to the train passing through the insulation section of the traction substation, the pantograph reconnects with the positive pole of the traction network, resulting in the charging of the supporting capacitance of the LC filter circuit in the train. During the charging process, given the relatively short distance from the traction substation, the size of the traction network circuit is sufficiently small to neglect the skin effect of the rail [19]. However, when a short circuit occurs between the positive pole of the traction network and the rail, the size of the traction network circuit increases, necessitating consideration of the skin effect on the rail. Under the influence of the skin effect, the resistance of the rail circuit rises, while the inductance of the rail circuit decreases. As a result, a broad spectrum of remote short circuit current emerges, whereas the spectrum of the train charging current becomes narrower.
3 Feature Extraction Based on Optimized VMD and Sample Entropy
The process of VMD decomposition involves utilizing the alternate multipliers iterative method for constant iteration, enabling the acquisition of the optimal solution for this model. This approach aims to determine the central frequency and bandwidth of each intrinsic mode function by constructing a variational mode model. Subsequently, the effective separation of IMF is accomplished. The step-by-step procedure is outlined below.
1. By performing Hilbert transformation on each modality
Here,
2. This paper considers the constraint that the sum of each modality is equal to the original signal. We present the corresponding variational model, which is depicted in Eq. (2).
Here, k is the number of decomposed modalities,
3. The Lagrange formulation of the non-binding variational problem is presented by introducing the quadratic penalty factor
Here,
The saddle point of the augmented Lagrange function can be obtained by utilizing the alternate direction multiplier algorithm (ADMM), resulting in the optimal solution for the constraint variational model. The calculation formula for all modal components
With the help of Plancherel Fourier isometric transformation, the frequency domain expression can be obtained as is shown in Eq. (5).
The Eq. (5) is converted to the form of non-negative frequency interval integral, which is shown in Eq. (6).
By solving the Eq. (6), the optimal solution of the non-constrained variational problem can be obtained. The optimal solution is shown in Eq. (7).
Here, the iterative formulas of Lagrange penalty operator
During the solutions,
Here,
3.2 K-Value Optimization Based on Energy Difference
VMD effectively decomposes the original signal, enabling easy extraction of relevant features. The model’s decomposition number (k) and penalty factor require manual selection as two key parameters. Among these parameters, the size of k has a more noticeable impact on the decomposition results of VMD [20]. To mitigate the influence of k choice on VMD decomposition, this research introduces an energy-based k-value optimization method, which analyzes the energy differences in the decomposition results of VMD to determine the optimal value for k.
The principle behind VMD involves decomposing the signal by seeking the optimal solution of the constraint variational model. However, upon energy analysis, it is observed that the sum of energy for each Intrinsic Mode Function (IMF) is nearly equal to the energy of the original signal after VMD decomposition. Consequently, when an appropriate value is chosen for the optimal mode decomposition number (k), the sum of energy for each IMF will hover around the energy value of the original signal. In cases where k is larger, over-decomposition may occur, leading to the generation of false IMF and resulting in a sum of energy greater than both the original signal’s energy and the sum of energy under normal decomposition of IMFs. Thus, there is a need for optimizing the energy-based parameter k in VMD.
The calculation formula for signal energy is depicted in Eq. (11).
Here, E is the energy of the signal,
To accurately capture the variations in signal energy following decomposition with different k values, this study employs a two-step approach. Firstly, the total energy sum of all IMF components is calculated for each k value after VMD decomposition. Next, the energy sum between adjacent k values is computed and the absolute difference is obtained. This absolute difference effectively represents the trend of energy change.
The equation for calculating the energy difference is presented as Eq. (12).
Here,
From Eq. (12), for any signal with fluctuations, if VMD decomposition is under decomposition and normal decomposition,
3.3 Feature Extraction Based on Sample Entropy
Sample entropy is a parameter used to quantify the complexity of a time domain signal and assess the likelihood that the signal produces new patterns as the dimensionality changes. A higher probability of generating new patterns indicates a higher complexity level and corresponds to larger entropy values.
After VMD decomposition, the original current signal
1. Let the feeder current signal X = {x (1), x (2), …, x (N)} have a length of N. The current signal X is transformed into m-dimensional vector. The calculation formula for reconstructed signal is shown in Eq. (13).
2. Figure out the distance between
3. For the given
4. The mean value of
5. Add 1 to reconstructed dimension m and repeat Step (1) to Step (4).
6.
4 The Step of the Feeder Fault Current Identification Based on Optimized VMD and Sample Entropy
Considering the challenge of incomplete feature extraction in train charging current and remote short circuit current, which can result in a low recognition rate for these two types of current, this paper proposes a method to optimize the k value of VMD using the principle of energy difference. This optimization process helps determine the optimal number of mode decompositions, denoted as k. By applying the VMD algorithm with the optimized k value, the feeder current signal can be decomposed into IMFs representing different frequency bands. Subsequently, a suitable sample entropy measure is selected as the feature vector, which is then input into the SVM for current classification and identification. The specific steps of this approach are outlined as follows:
1. The train charging current signals and remote short circuit current signals on the feeder of an urban rail transit traction substation are collected.
2. The principle of energy difference is employed to determine the optimal value of k for VMD for both types of feeder currents. The algorithm of k-value optimized VMD divides the two types of feeder current signals into k IMF components based on this determined value of k.
3. The k sample entropies of each IMF are calculated, and a suitable sample entropy measure is selected to construct feature vectors.
4. This paper utilizes the fitcsvm function in Matlab to perform training based on low and medium-dimensional forecast yield datasets or cross-validation binary classification SVM models. The SVM model incorporates the Bayesian hyperparameter optimization function provided by the fitcsvm function. This optimization function aims to minimize the cross-validation binary classification error by adjusting parameters, thus improving the accuracy of SVM classification and prediction. The parameters that can be set for the fitcsvm function are the box constraint BC and the kernel function g. The BC represents the penalty relaxation variable, where a higher BC value imposes a greater penalty for misclassification. This results in high accuracy on training sets but weaker generalization ability. Conversely, a smaller BC value allows more training errors and enhances the generalization ability. The fitcsvm function offers three types of kernel functions: linear kernel, Gaussian kernel, and polynomial kernel. For the Gaussian kernel, the kernel scale parameter s needs to be determined. For the polynomial kernel, the order of the polynomial kernel function q needs to be specified. In this paper, the cross-validation binary classification error of the fitcsvm function is considered as the objective function, and Bayesian hyperparameter optimization is employed to optimize multiple parameters of the fitcsvm function.
5. Put the constructed feature vectors into the SVM model for training and get the SVM classification and prediction model.
6. Feeder current signals are collected for testing purposes. The test signals are then used to construct feature vectors following Step 2 and Step 3. These feature vectors are input into the trained SVM classification and prediction model. By doing so, the signal recognition results can be obtained.5 Instance Analysis.
Generally, in urban rail transit power supply systems, the delay of the Directional Distance Relay (DDL) protection is around 20–50 ms. To analyze the distinct signal characteristics between train charging current influenced by the LC filter circuit and remote short circuit current influenced by the skin effect, this paper selects two simulated current waveforms as shown in Fig. 3. The simulation analysis is conducted after the DDL protection has been active for 40 ms. The resulting waveforms for the two types of current are illustrated in Fig. 5.
Figure 5: Protection of train charging current and remote short circuit current of 40 ms after start-up
Observations from Fig. 5 include:
1. The train charging current exhibits an initial rate of increase of 94 A/ms, resulting in a total increment of 2834 A.
2. The remote short circuit current demonstrates an initial rate of increase of 80 A/ms, with a total increment of 2425 A.
3. To quantitatively describe the similarity between the train charging current and the remote short circuit current within the first 40 ms after the initiation of DDL protection, the Pearson correlation coefficient
Here,
The Pearson correlation coefficient
In this paper, the penalty factor
It can be found in Fig. A1:
1. The charging current of the train is generated when the traction network charges the supporting capacitor in the LC filter circuit. The LC filter module in the simulation model is supplied by Zhuzhou CRRC Times Co., Ltd., China. The electric reactor in the LC filter circuit has an inductance value of L = 5 mH, and the supporting capacitor has a capacitance of C = 5.4 mF. As a result, the natural resonance frequency of the filter circuit can be determined using Eq. (1).
When k = 5, the decomposition of the train charging current VMD reveals that the frequency distribution of each IMF is within 100 Hz. This observation aligns with the narrow spectrum distribution characteristic of the train charging current, which is attributed to the small circuit of the traction network. Notably, IMF2 exhibits a center frequency of 31.7 Hz, which is approximately equal to the natural resonance frequency
2. When k = 6, upon decomposing the train charging current using VMD, the center frequencies of IMF2 and IMF3 exhibit rough consistency. This indicates that the VMD decomposition has entered an over-decomposition state, causing modal aliasing between IMF2 and IMF3. Consequently, IMF2 represents a false component.
3. When k = 5, following the decomposition of the remote short circuit current using VMD, the frequency distribution of each IMF remains within the range of 200 to 5000 Hz. This finding aligns with the wide spectrum distribution characteristic of the remote short circuit current, which arises due to the skin effect on the rails.
4. When k = 6, after applying VMD decomposition to the remote short circuit current, the center frequencies of IMF3 and IMF4 show approximate consistency. This indicates that the VMD decomposition has reached an over-decomposition state, resulting in modal aliasing between IMF3 and IMF4. Therefore, IMF4 represents a false component.
5. The Res component obtained from the VMD decomposition of both types of currents is significantly large. At this stage, the center frequency is nearly zero, and Res corresponds to the DC component. This finding aligns with the high DC component characteristic of the tractive power supply system in urban rail transit.
This paper employs an algorithm based on k-value optimization VMD to decompose the train charging current and remote short circuit current, followed by feature extraction of all Intrinsic Mode Functions (IMF) using the sample entropy algorithm. The parameters for the sample entropy algorithm are chosen by referencing literature [15], with a reconstruction difficulty of m = 2 and a threshold of r = 0.2. Fig. 6 illustrates the sample entropy diagram resulting from the VMD decomposition of the two types of currents.
Figure 6: Sample entropy diagram of two kinds of current VMD decomposition
From Fig. 6, the following observations can be made:
1. Res component of both types of currents represents the DC component, characterized by low complexity and a low probability of generating new patterns. Consequently, the SampEn of the residual component for both currents is 0. As such, SampEn computed from IMF1 to IMF4 can be considered as effective features for the identification of the two types of current. These features will be utilized to construct the feature vector for current identification.
2. In the train charging current, IMF2 corresponds to the inherent resonance current generated by the filter circuit. The SampEn of this component is relatively larger, while the SampEn of other IMFs is smaller. This indicates that the complexity of the train charging current is low, with a low probability of generating new patterns.
3. Due to the influence of the skin effect on rails, the remote short circuit current exhibits larger SampEn values across IMF1 to IMF4 after VMD decomposition compared to the train charging current. This demonstrates that the complexity of the remote short circuit current is high, and there is a higher probability of generating new patterns.
In conclusion, the algorithm based on k-value optimization VMD successfully decomposes the train charging current and remote short circuit current into individual IMF components. Additionally, the sample entropy algorithm effectively extracts distinctive features from both types of currents. Therefore, the combination of optimized VMD and sample entropy for feature extraction provides reliable and meaningful feature vectors for the identification of train charging current and remote short circuit current.
This study utilizes performance test data from the pantograph and catenary of urban rail transit trains, collected by the China Academy of Railway Sciences Locomotive and Vehicle Research Institute, for current recognition analysis. A total of 120 sets of data are selected to form the sample set, comprising 60 sets of train charging current and 60 sets of remote short circuit current. Among these, 40 sets of data for each current are used as training samples, while 20 sets of data are reserved for testing purposes. The optimal number of mode decompositions for both types of currents in the sample set is determined using the principle of k-value optimization VMD based on energy difference. The results of the optimization, indicating the respective optimal decomposition numbers, are presented in Table 2.
The optimal mode decomposition number for VMD, as determined by the energy difference principle and presented in Table 2, is utilized to set the value of k in VMD as 3000. The training samples are then subjected to decomposition using the algorithm based on k-value optimization VMD, and the SampEn values are computed from IMF1 to IMF3. For each type of current, this process yields 40 SampEn values, resulting in a set of feature vectors for each column. To train a support vector machine (SVM) recognition model, the feature vectors of both types of current are fed into the fitcsvm function. The objective function for optimization is the cross-validation binary classification accuracy. The box constraint BC and kernel function g of the fitcsvm function are optimized using Bayesian hyperparameter optimization. Eventually, the best SVM recognition model is obtained. The iteration curve depicting the training and optimization process is illustrated in Fig. 7.
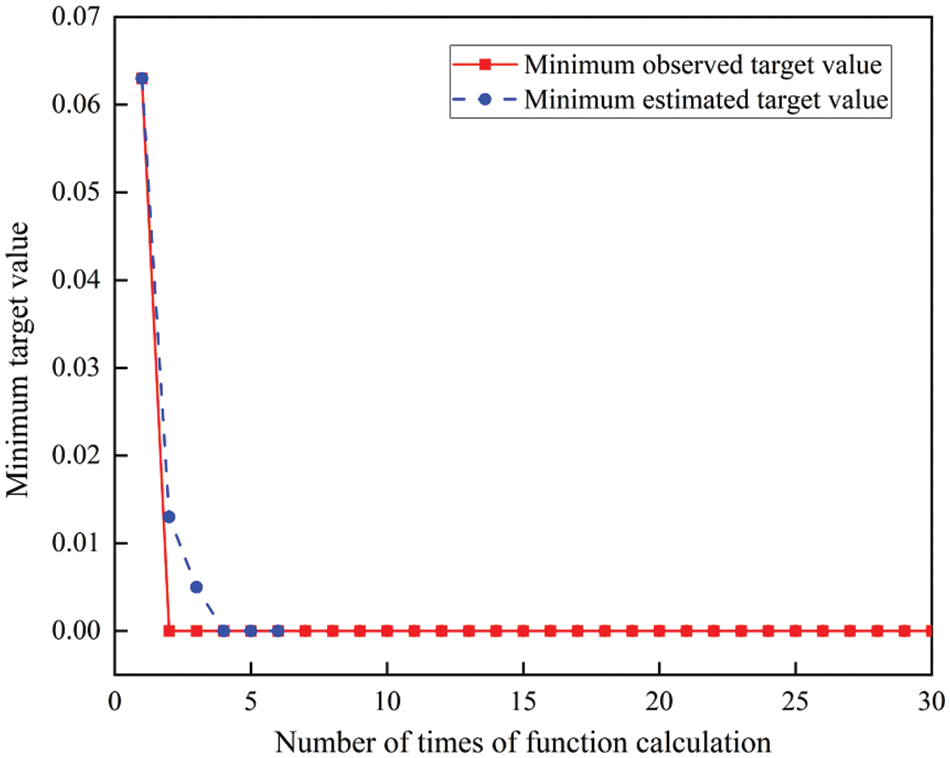
Figure 7: SVM optimized iterative graph
After the training process, the best box constraint (BC) is determined to be 13.98, and the optimal kernel function for the SVM model is found to be the Gaussian kernel. The polynomial kernel function order for the Gaussian kernel is s = 995.58. Using the trained SVM identification model, the test samples of the two types of current are subjected to recognition. The results of the test sample identification are presented in Fig. 8. In the training and testing stages, digital labels are assigned to represent the different currents on the feeder. Specifically, values 1 to 20 correspond to the train charging current (with labels set as 0), while values 21 to 40 represent the remote short circuit current (with labels set as 1).
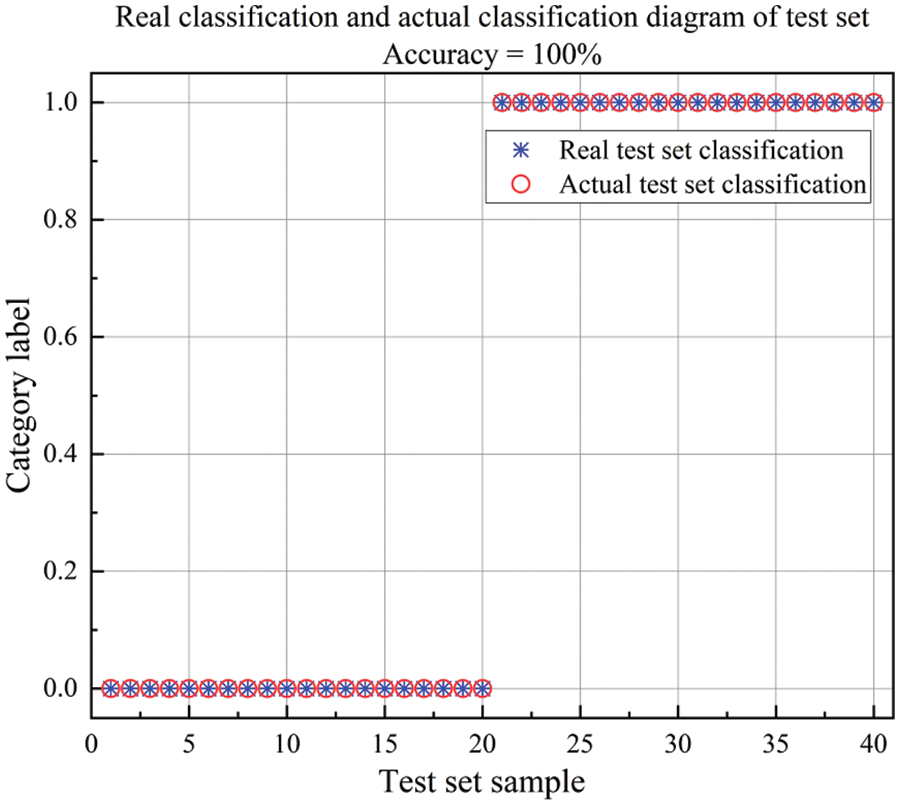
Figure 8: Test sample classification result diagram
As depicted in Fig. 8, this paper achieves a recognition accuracy of 100% for both types of current by employing feature extraction through the algorithm based on k-value optimization VMD and sample entropy. Furthermore, this paper compares the performance of different decomposition methods, including EMD and VMD (with k = 6 and λ = 3000, following traditional experience), for decomposing the sample data. The feature vectors are constructed using the sample entropy algorithm, and the fitcsvm function is employed for training the SVM recognition model using Bayesian hyperparameter optimization. The recognition accuracy of the different decomposition methods is summarized in Table 3.
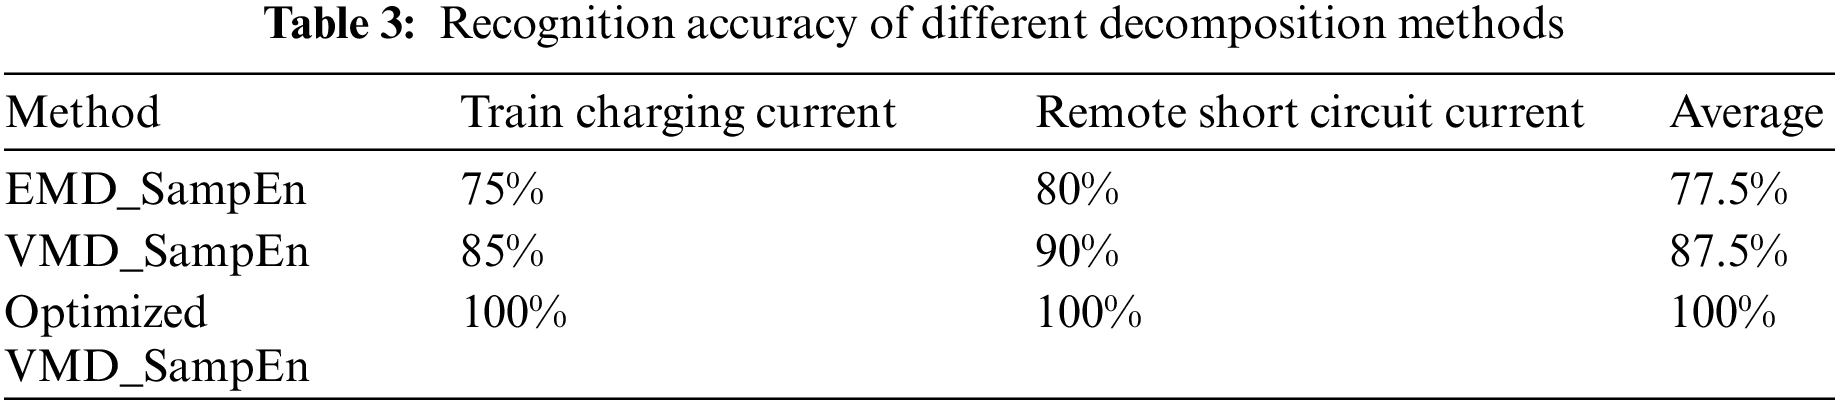
From Table 3, it is evident that the DC feeder current signal in the traction substation has a relatively high DC component content, resulting in a smooth signal with fewer poles. To address the issue of modal aliasing, EMD is used for decomposition. However, the average recognition accuracy of the EMD_SampEn feature extraction method is only 77.5%. On the other hand, the parameters of the VMD algorithm are typically determined using empirical values, which makes it challenging to select the appropriate modal decomposition number based on the characteristics of different signals. As a result, the signal may not reach the optimal decomposition state. Consequently, the average recognition accuracy of the VMD_SampEn feature extraction method is only 87.5%. In contrast, the VMD algorithm with optimized k values, determined based on the principle of energy difference, overcomes the limitation of empirical parameter selection. This leads to the signal reaching the optimal decomposition state. Therefore, the average recognition accuracy of the optimized VMD_SampEn feature extraction method for both types of currents is 100%.
In summary, the feature extraction method based on optimized VMD and sample entropy in this paper effectively captures the features of tiny signals with a high DC content. This enables accurate identification of fault currents in urban rail transit traction substation feeders, surpassing the recognition accuracy of the EMD_SampEn and VMD_SampEn methods.
This paper presents a fault current identification method for DC traction feeders, utilizing optimized variational mode decomposition and sample entropy. The effectiveness of the proposed method was validated through the analysis of both simulated and measured signals. The study yielded the following conclusions:
1. The current identification method proposed in this paper effectively identifies the train charging current and remote short circuit current signals in the DC feeder of a traction substation. Experimental comparisons demonstrate that this method outperforms the EMD_SampEn and VMD_SampEn methods in terms of identification accuracy.
2. By utilizing the k-value optimized VMD method based on energy difference, the optimal modal decomposition number is determined. This approach mitigates the issues of under-decomposition or over-decomposition that may arise from the empirical selection of VMD algorithm parameters. Consequently, it provides a practical strategy for applying the VMD method to power system fault identification.
3. Considering the wide frequency distribution and high likelihood of generating new modes in far-end short circuit current, as well as the narrow frequency distribution and low likelihood of generating new modes in train charging current, the SampEn algorithm is employed to extract the IMF components obtained after optimized VMD decomposition. Experimental verification confirms that the SampEn algorithm effectively captures the specific characteristics of these two types of currents.
4. The proposed method inputs the extracted eigenvectors from optimized VMD_SampEn, EMD_SampEn, and VMD_SampEn into an SVM model based on Bayesian hyperparameter optimization for training. These three trained identification models are then utilized to identify fault currents in the DC traction feeder. Extensive testing using various data sets demonstrates the effectiveness of the current identification method proposed in this paper, surpassing the performance of EMD_SampEn and VMD_SampEn methods. This research holds significant practical value and implications for fault identification in the DC feeders of urban rail transit systems.
Funding Statement: This project supported by The National Natural Science Foundation of China (No. 11872253).
Conflicts of Interest: The authors declare that they have no conflicts of interest to report regarding the present study.
References
1. Lin, S., Lin, X. H., Feng, D. (2018). Reliability evaluation of relay protection for traction substation of urban rail transit. Journal of Southwest Jiao Tong University, 53(6), 1102–1109. [Google Scholar]
2. Li, Q. Z. (2015). Industrial frequency single-phase AC traction power supply system and its key technologies for urban rail transit. Journal of Southwest Jiaotong University, 50(2), 199–207. [Google Scholar]
3. Wang, G. F., Sun, Y. K., Chen, K. H. (2007). DDL protection in subway DC traction power supply system. Proceedings of the CSU-EPAS, 19(1), 59–62. [Google Scholar]
4. Tian, X., Sun, X., Lu, N., Song, J. (2020). A new scheme to identify the special load current waveform for a metro DC traction system. International Transactions on Electrical Energy Systems, 31(2), e12749. [Google Scholar]
5. Yu, L., He, J. H., Hu, J., Bo, Z. Q., Li, M. X. et al. (2010). Accurate track modeling for fault current on DC railways based on MATLAB/Simulink. IEEE PES General Meeting, pp. 1–6. Minneapolis, USA. [Google Scholar]
6. Zhang, J. T. (2017). Modeling and simulation of AC/DC power supply system for urban rail transit based on MATLAB/Simulink (Master Thesis). Beijing Jiao Tong University, Beijing, China. [Google Scholar]
7. Hu, J., He, J. H., Yu, L., Li, M. X., Xu, J. F. (2010). The research of DC traction power supply system and the DDL protection algorithm based on MATLAB/Simulink. China International Conference on Electricity Distribution, Nan Jing, China, IEEE. [Google Scholar]
8. Yu, L., He, J. H., Wang, X. J. (2012). DC feeder protection based on Mexh wavelet. Power System Protection and Control, 40(11), 42–45, +54. [Google Scholar]
9. Yang, H. G., Leng, Y., Wang, Z. Q. (2018). Identification approach of oscillation current and fault current in DC traction network based on ILMD multi-scale time-frequency entropy. High Voltage Engineering, 44(8), 2457–2463. [Google Scholar]
10. Liu, W., Li, S. W., Wang, J., Cui, H. M., Li, F. Q. et al. (2020). Identification of DC short circuit fault based on EWT energy entropy. Electric Power Automation Equipment, 40(2), 149–154. [Google Scholar]
11. He, L., Wu, H., Li, S. W., Zhang, Y. X., Cui, H. et al. (2021). Identification of urban rail transit DC power supply system short circuit transmission fault based on EMD singular value entropy. Urban Mass Transit, 24(9), 88–93. [Google Scholar]
12. Wang, S., Takyi-Aninakwa, P., Jin, S., Yu, C., Fernandez, C. et al. (2022). An improved feedforward-long short-term memory modeling method for the whole-life-cycle state of charge prediction of lithium-ion batteries considering current-voltage-temperature variation. Energy, 254, 124224. [Google Scholar]
13. Wang, S., Ren, P., Takyi-Aninakwa, P., Jin, S., Fernandez, C. (2022). A critical review of improved deep convolutional neural network for multi-timescale state prediction of lithium-ion batteries. Energies, 15(14), 5053. [Google Scholar]
14. Tian, S., Kang, Z. H. (2019). Circuit breaker mechanical fault vibration analysis based on improved variational mode decomposition and SVM. Journal of Vibration and Shock, 38(23), 90–95. [Google Scholar]
15. Liu, J. C., Quan, H., Yu, X., He, K., Li, Z. H. (2022). Rolling bearing fault diagnosis based on parameter optimization VMD and sample entropy. Acta Automatica Sinica, 48(3), 808–819. [Google Scholar]
16. Sun, X., Tian, X., Wang, H., Wang, N., Lu, N. et al. (2021). A new fault diagnosis method for an atypical load current in a metro. International Transactions on Electrical Energy Systems, 31(12), e13088. [Google Scholar]
17. Tang, Y. W. (2020). Research on short circuit fault identification and location of DC traction power supply system of urban rail transit (Master Thesis). Southwest Jiao Tong University, Chengdu. [Google Scholar]
18. Cao, Q. Y. (2017). Modeling and simulation research of permanent traction system for urban rail transit (Master Thesis). Chang’an University, Xi’an, China. [Google Scholar]
19. Yu, L., He, J. H., Wang, X. J., Bo, Z. Q. (2012). Research of short-circuit skin effect current of DC railway based on step series algorithm. Transactions of China Electrotechnical Society, 27(4), 7–12. [Google Scholar]
20. Wang, F. T., Liu, C. X., Zhang, T., Dun, B. S., Han, Q. K. et al. (2018). Fault diagnosis method of rolling bearing based on k-value optimization VMD. Journal of Vibration, Measurement & Diagnosis, 38(3), 540–547. [Google Scholar]
Appendix A
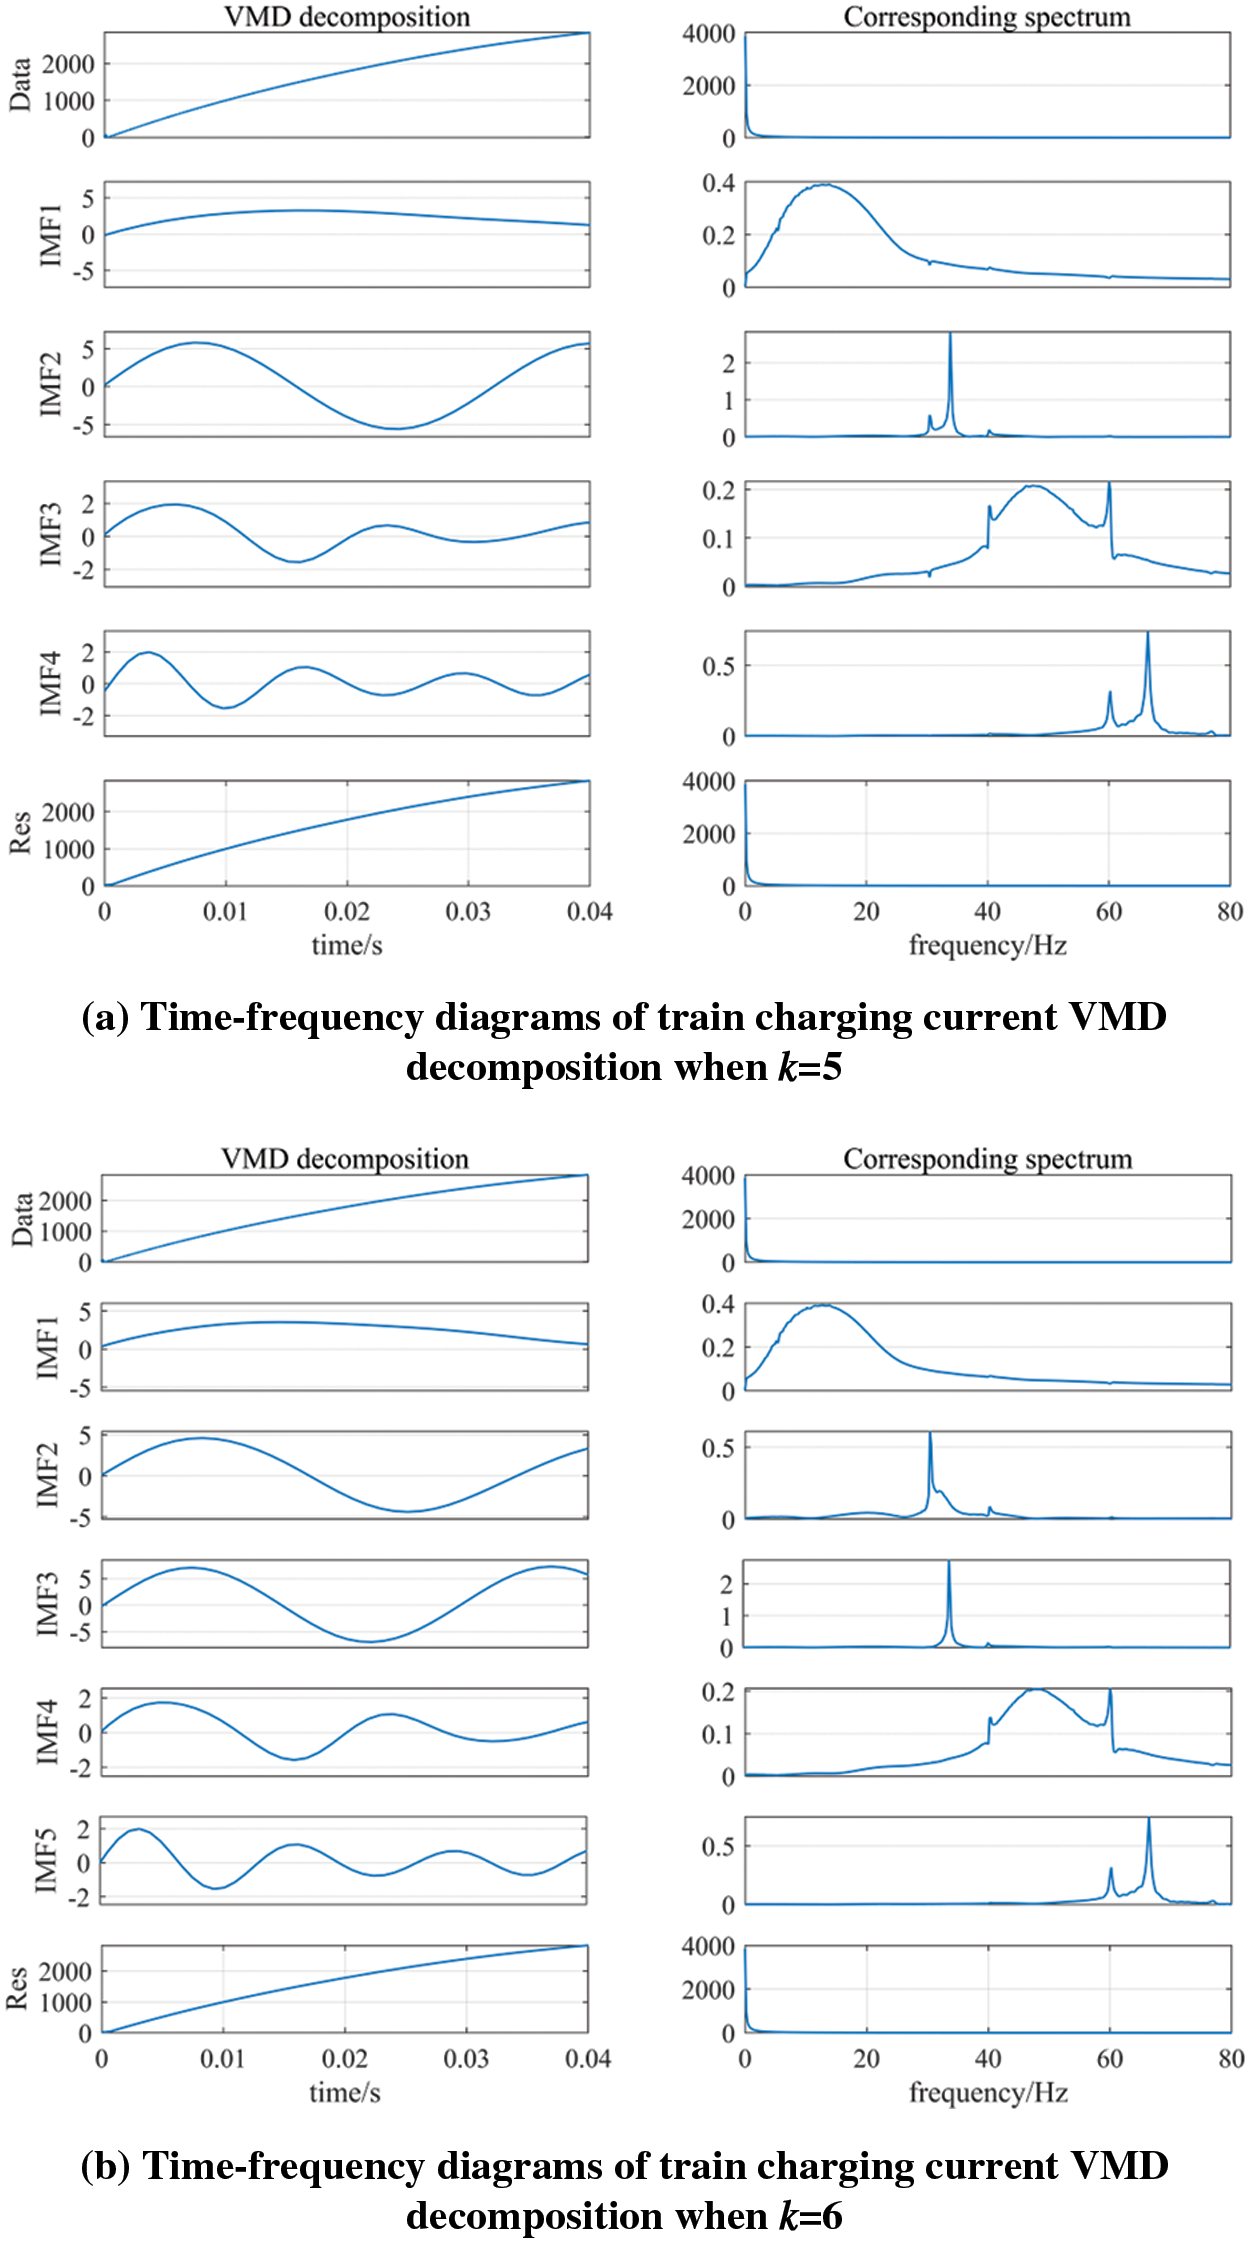
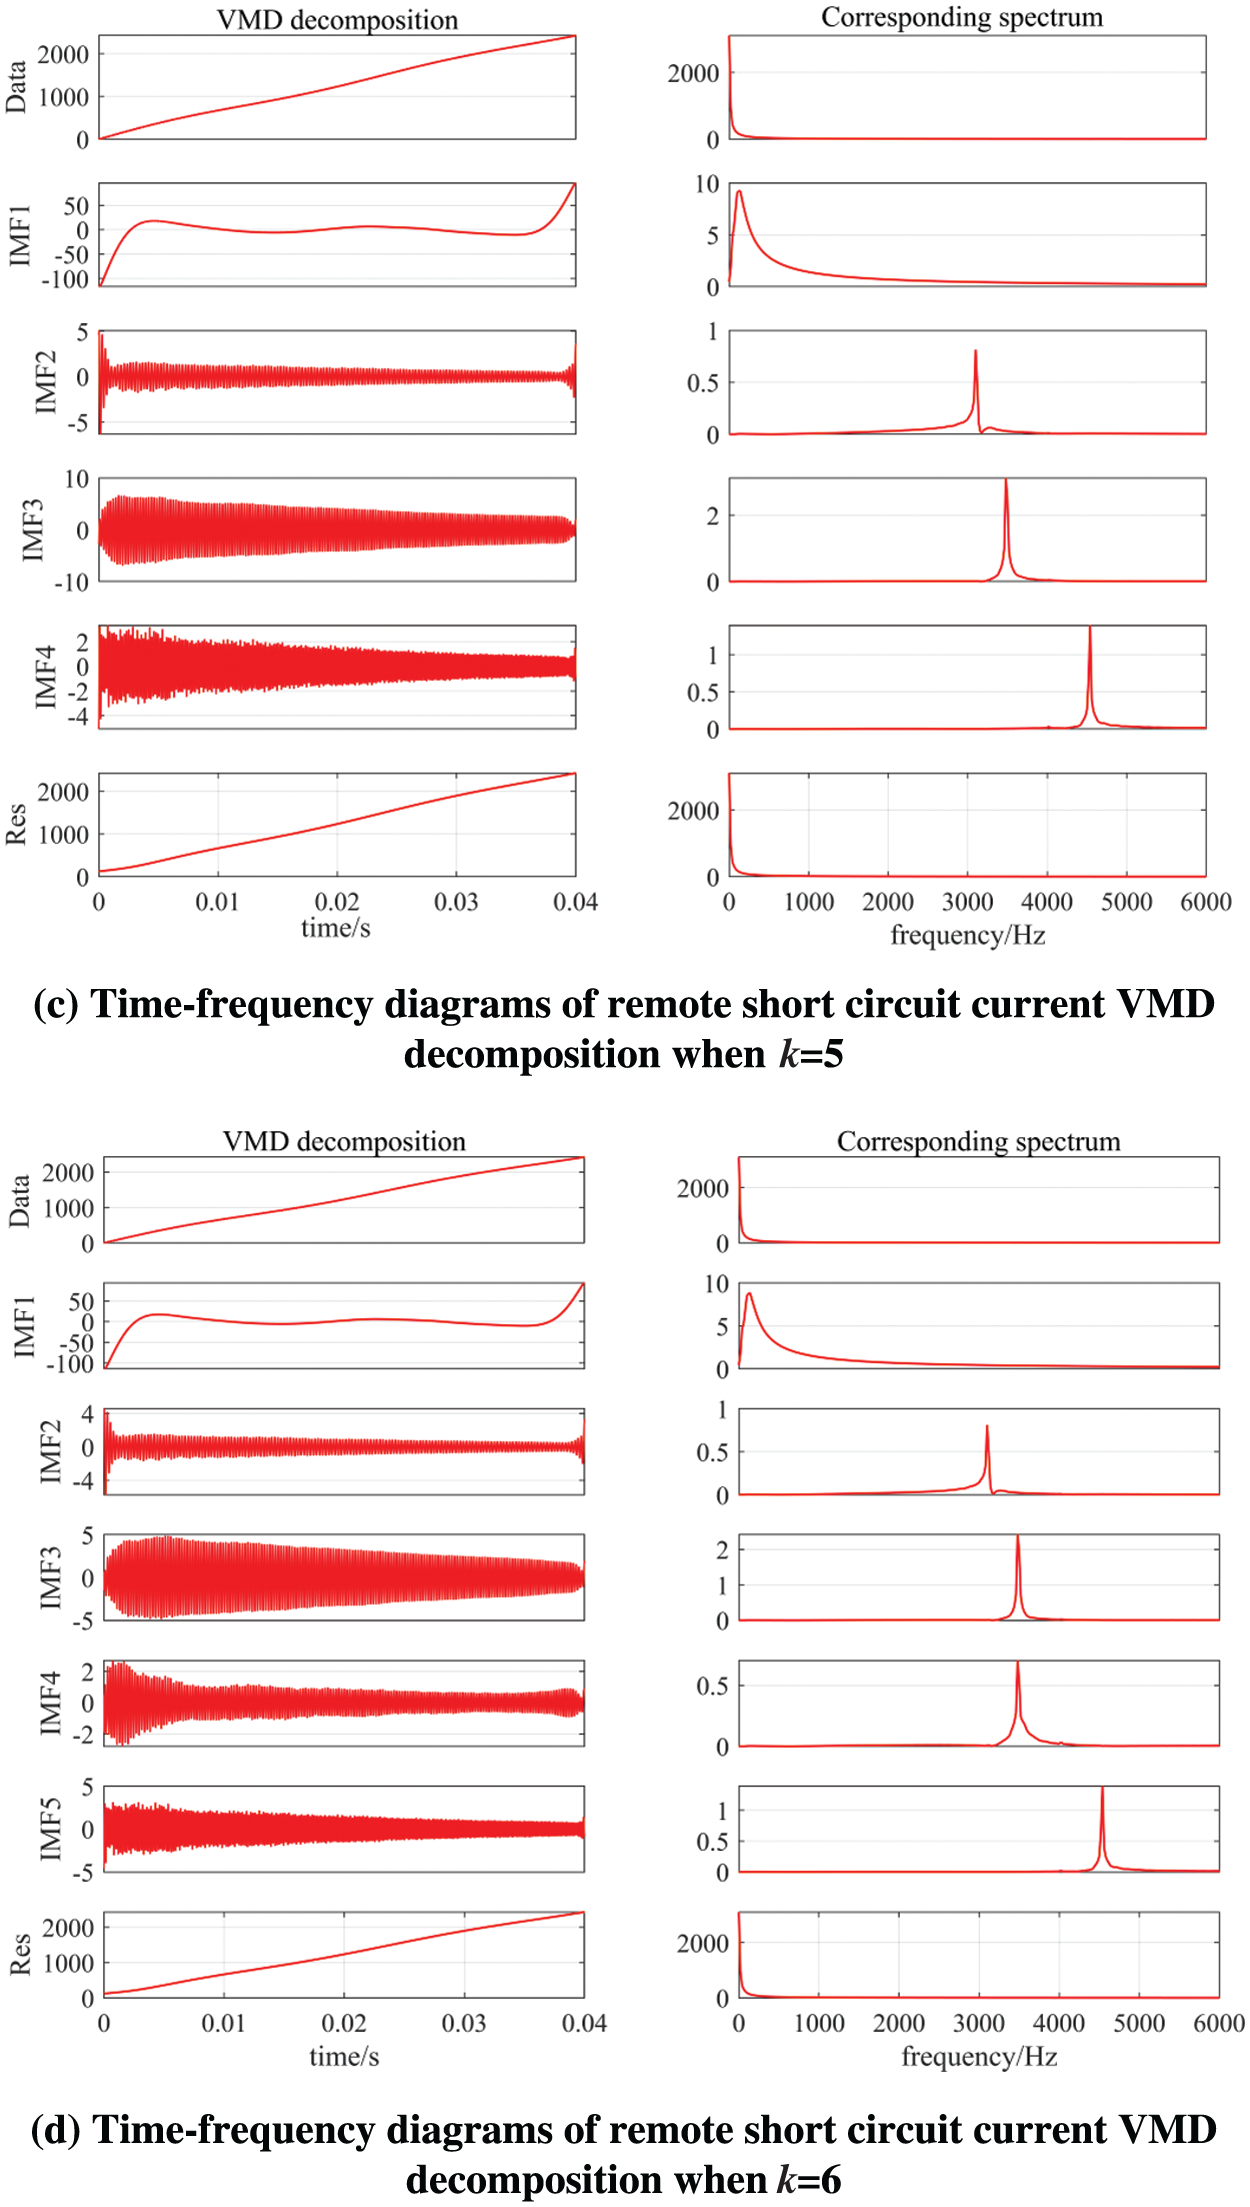
Figure A1: Time-frequency diagrams of two kinds of current VMD decomposition
Cite This Article
 Copyright © 2023 The Author(s). Published by Tech Science Press.
This work is licensed under a Creative Commons Attribution 4.0 International License , which permits unrestricted use, distribution, and reproduction in any medium, provided the original work is properly cited.
 Downloads
 Citation Tools