
 Submit a Paper
 Propose a Special lssue
 Open Access
ARTICLE
Optimal Location and Sizing of Distributed Generator via Improved Multi-Objective Particle Swarm Optimization in Active Distribution Network Considering Multi-Resource
Dali Power Supply Bureau of Yunnan Power Grid Co., Ltd., Dali, 671099, China
* Corresponding Author: Guobin He. Email:
(This article belongs to the Special Issue: Fault Diagnosis and State Evaluation of New Power Grid)
Energy Engineering 2023, 120(9), 2133-2154. https://doi.org/10.32604/ee.2023.029007
Received 23 January 2023; Accepted 13 April 2023; Issue published 03 August 2023
 View Full Text
 Download PDF
Abstract
In the framework of vigorous promotion of low-carbon power system growth as well as economic globalization, multi-resource penetration in active distribution networks has been advancing fiercely. In particular, distributed generation (DG) based on renewable energy is critical for active distribution network operation enhancement. To comprehensively analyze the accessing impact of DG in distribution networks from various parts, this paper establishes an optimal DG location and sizing planning model based on active power losses, voltage profile, pollution emissions, and the economics of DG costs as well as meteorological conditions. Subsequently, multi-objective particle swarm optimization (MOPSO) is applied to obtain the optimal Pareto front. Besides, for the sake of avoiding the influence of the subjective setting of the weight coefficient, the decision method based on a modified ideal point is applied to execute a Pareto front decision. Finally, simulation tests based on IEEE33 and IEEE69 nodes are designed. The experimental results show that MOPSO can achieve wider and more uniform Pareto front distribution. In the IEEE33 node test system, power loss, and voltage deviation decreased by 52.23%, and 38.89%, respectively, while taking the economy into account. In the IEEE69 test system, the three indexes decreased by 19.67%, and 58.96%, respectively.Keywords
With the development of modern society, the speed of economic growth is fast, but energy shortages and environmental pollution becoming increasingly serious, which will create a negative impact on traditional energy generation more and more obvious. Nowadays, with the efforts to build a low-carbon and environment-friendly society all over the world countries [1,2], the position of distributed generation (DG) has grown unprecedentedly indispensable at home and abroad [3,4]. Active distribution network is widely used in future grid planning because of their higher level of automation. At the same time, with the development of the power market and the demand for reducing carbon emissions, the permeability of DR In the active distribution network is getting higher [5–8]. With reasonable access to DG, it will reduce power loss as well as environmental pollution, and improve power supply stability. However, although DG can provide enough power supply to the grid and improve the reliability of the system, the active distribution network structure is different and the number of nodes is huge making the location and capacity of DG difficult. In addition, a large number and various types of DG are usually selected to be connected to the active distribution network, to give full play to the advantages of DG and make the system run more reliably, safely, and stably [9]. At present, photovoltaic system, and wind turbine technology is the most mature, become the first choice of installation. However, its output power is affected by illumination and wind speed to a large extent, showing strong randomness, intermittence, and uncertainty. When extreme weather occurs, DG even needs to stop generating electricity to ensure the safety of active distribution network operation [10,11]. Access to the active distribution network brings many uncertain factors [12]. The improper capacity of DG and unreasonable access to any node of the active distribution network will further worsen the network loss, voltage distribution, and harmonics of the system [13]. The output power of DG is extremely random which creates the voltage level to decrease and the stability of the system to reduce. In addition, active distribution networks are distribution networks with internally distributed or decentralized energy sources with control and operational capabilities.
With a large number of random power loads and DG access, the difficulty of management construction, and scheduling of active distribution networks become intricate, and the disturbance caused by any fault point will have a negative impact on the power system. In special, in case of serious disturbance, it may cause a large-scale power outage with serious and catastrophic consequences [14,15]. The reasonably connected DG to the active distribution network and have numerous preponderances for practical engineering, i.e., they can play a critical role in reducing power losses, improving voltage distribution, and reducing environmental deterioration in the active distribution network [16,17]. However, the unreasonable connection of DG not only causes a waste of investment funds but also seriously endangers the normal operation of the power system [18,19]. How to reasonably allocate the capacity and access nodes of different types of DG, so as to most effectively reduce the construction cost, maintenance cost and the system network loss, improve the voltage distribution, correctly use the direct value of the power supply provided by DG, and scientifically and reasonably connect DG to the active distribution network have become urgent problems to be solved. Hence, it is crucial to adopt a scientific approach to research the location and capacity of DGs for the economic, stability, and social benefits of the active distribution network operation.
Location and capacity determination of DG is a complex multi-objective optimization problem, mainly because it is nonlinear and contains discrete optimization variables, etc. When investigating the DG location and sizing planning problem, several scholars prefer the mathematical model to optimize the power loss of the active distribution network or to optimize a series of costs arising from DG location and sizing. Multi-optimization objectives are simply transformed into a single optimization objective by methods such as linear weighting, which causes the optimization results to be mainly determined by weighting coefficients that are defined by experts and scholars according to their expertise, such mathematical models constructed in a single optimization direction cannot guarantee [20–22]. In comparison, the multi-objective intelligence approach based on Pareto can address sophisticated nonlinear multi-objective optimization problems more appropriately. Literature [23] proposed a DG multi-objective programming model based on the chance-constrained programming theory to solve the programming model by using the distribution network probabilistic power flow embedded non-dominated sorting genetic algorithm-II (NSGA-II) considering correlation, to obtain the Pareto optimal solution set for decision-makers to choose. In literature [24], a multi-objective optimization both taking power losses and voltage stability into consideration was proposed to establish a simulation model, upon which a multi-island genetic algorithm was exploited as a solver. Besides, a multi-objective DG optimization model was designed and optimized via a hybrid ant colony-artificial bee colony algorithm in literature [25], which included power losses, voltage distribution, DG costs, and environmental pollution. Literature [26] established a numerical method based on continuous currents for the optimization of 85 bus distribution systems, which effectively improved the load capacity of the system, but does not consider the specific DG types in the planning process, which did not have engineering practicality. Literature [27] studied the optimal allocation of multiple types of DG, which proposed an artificial neural network (ANN) based on the optimality criterion for load uncertainty, different DG permeability, and different DG reactive power output characteristics. The simulation results illustrated that this method can be applied to power systems under various operating conditions, while it can effectively reduce the power loss of the system.
On the other hand, wind turbines and photovoltaic systems are more technically mature, which are preferred for DG installations [28,29]. Nevertheless, the output power of DG based on renewable energy is affected by light and wind speed to a greater extent that exhibits strong randomness, intermittency, and uncertainty, which creates plenty of uncertainty factors for DG access to the distribution network [30]. The inappropriate capacity and unreasonable connection of DG will cause further deterioration of the stability of the system. The above kinds of literature ignore the impact of meteorological conditions. When installing wind turbines and photovoltaic systems [31], the local wind speed and light conditions are not considered simultaneously in the optimization objectives, so it is laborious to install wind turbines and photovoltaic systems with abundant wind and light resources. Additionally, the above literature did not consider the economy, stability, and environment simultaneously, which lacked planning DG in multiple dimensions.
Therefore, a multi-objective optimization model based on active distribution network loss, voltage distribution, DG allocation cost, pollutant emission and meteorological conditions is established in this paper. In addition, the original MOPSO algorithm is improved based on the particle distance vector, so that the improved MOPSO algorithm can update the Pareto solution set in multiple iterative directions, so as to obtain better global and uniform Pareto solution set. In this paper, improved ideal point decision method is used to find the best compromise solution from Pareto solution set. In order to verify the effectiveness of the proposed method, simulation experiments based on IEEE33 and IEEE69 nodes are designed.
The main contributions of this paper are as follows:
(1) In this paper, the influence of various indexes has been fully considered in the configuration of DG, such as power loss of active distribution network, voltage distribution, cost of DG, pollutant emission, and meteorological conditions.
(2) This paper adopts the improved multi-objective particle swarm optimization (MOPSO) algorithm to solve the multi-objective optimization model, and the improved MOPSO algorithm can obtain better global and diverse Pareto solution sets in the multi-iteration direction. In addition, the optimal compromise solution is obtained by using the improved ideal point decision method, which can effectively avoid the subjective influence of decision-makers.
(3) Simulation tests based on IEEE33 and IEEE69 nodes are designed in this paper, and the simulation tests show that the improved MOPSO can obtain a more evenly distributed and wider Pareto frontier. The simulation result shows that the power loss and voltage profile can be decreased by 52.23% and 38.89% in IEEE 33 node system and 19.67% and 58.96% in IEEE 69 node system by accessing the DG, respectively.
2 Multi-Objective Mathematical Optimization Model for DG Location and Sizing
It is essential to conduct research into the technical, economic, and environmental aspects of DGs to ensure that it is reasonably connected to the distribution network to maximize their effectiveness, with full consideration of the technical and economic characteristics of DGs together with their impact on the distribution network, thus making reasonable decisions on access capacity and access nodes.
The high permeability of DGs into the distribution network may result in the magnitude and direction of the power tide changing, which may have a benign or malignant effect on the active power loss magnitude. The power loss index is employed to measure the size of active power loss in the distribution network. Active power loss indicators are established as follows [32]:
where
2.1.2 Voltage Distribution Indicator
The acceptable connections of DGs to the distribution network perform a critical task in refining the voltage distribution. DG can be well connected to the distribution network to optimize voltage distribution, yet as DG penetration in the distribution network progressively expands, nodal voltages can exceed the rated power. Therefore, this paper employs the voltage distribution index to give a quantitative analysis of the optimization effect, as follows [32]:
where
2.1.3 Pollution Emission Target
For the sake of decreasing the emission of polluting/harmful gases, carbon dioxide, nitrogen compounds, and sulfur dioxide are considered in this paper, as follows [32]:
where
The economic cost of DG location and sizing is mainly composed of the total cost
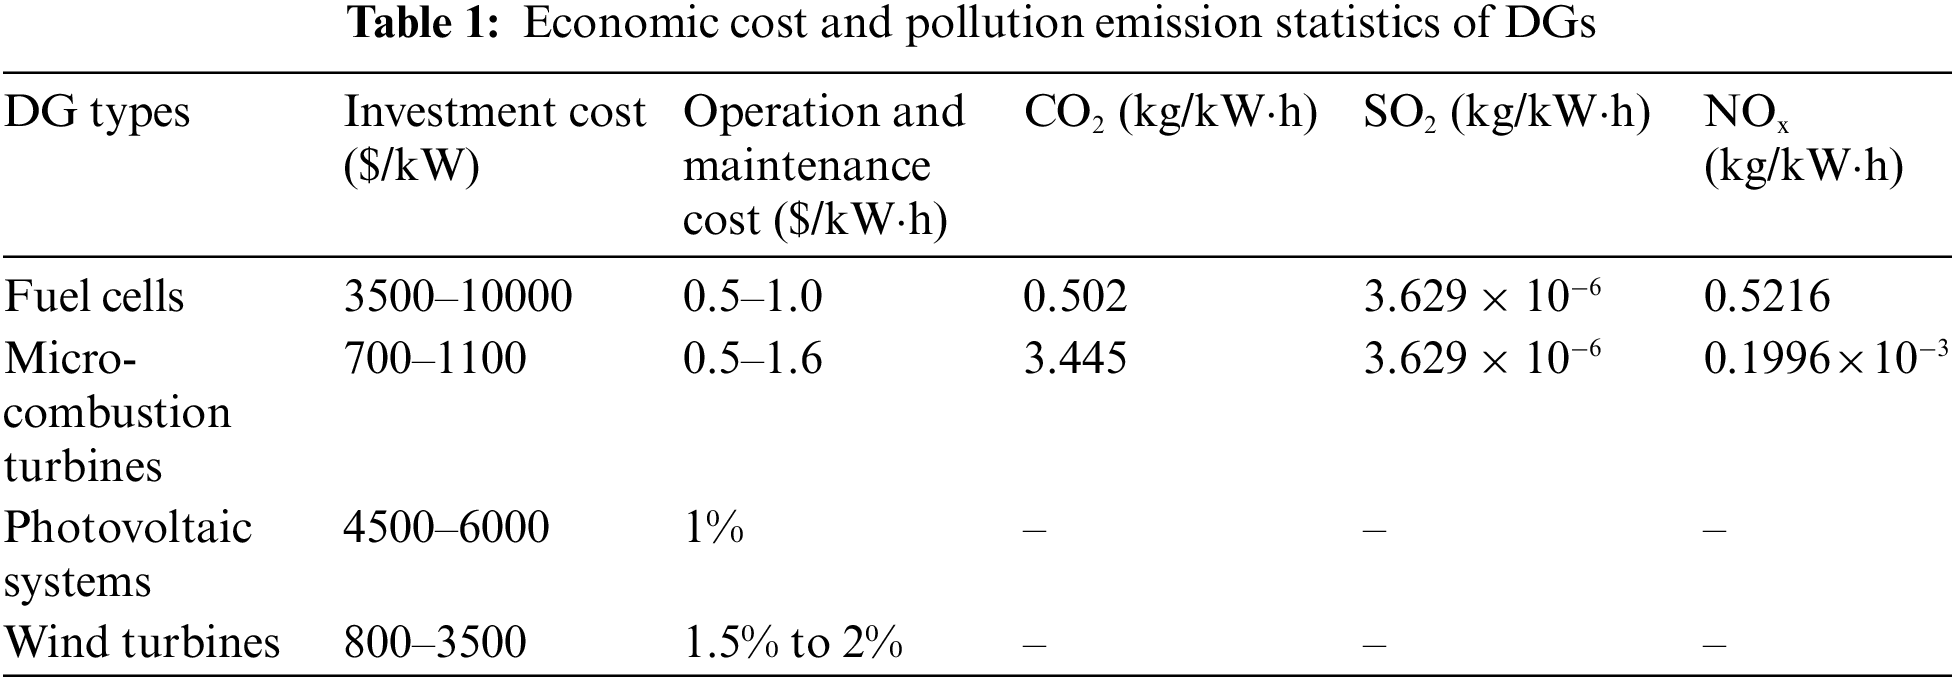
It is noteworthy that this paper considers that each unit operates for 20 years and 300 days per year, that is t = 144000 h. In addition, Table 1 gives statistics on the cost and pollution emissions of DG [32].
2.1.5 Meteorological Indicator
This paper proposes an objective function considering the annual average wind speed
where
Notably, DGs access to the distribution network operation may generate changes in the voltage distribution and tidal current distribution of the nodes in the power system, which directly affects line heating and indirectly diminishes the technical and economic capabilities of the distribution network in terms of security, dependability, and economy, etc. The following limitations are expected to guarantee the reliability and smooth operation of the system [32].
(1) Transmission line power constraints
where
(2) Voltage constraints
where
(3) Distributed power capacity constraints
where
In this paper, the types of DG considered are photovoltaic systems, wind power systems, fuel cells, and micro-gas turbines. Among them, the output of fuel cells and micro-gas turbines is affected by the input fuel flow rate, the faster the flow rate, the greater the output power. Therefore, the output of fuel cells and micro-gas turbines can be considered constant and adjustable. In addition, the output data of photovoltaic system and wind power generation system in this paper are obtained by fitting the average irradiance and wind speed of typical days in four seasons. Therefore, the output model of photovoltaic system and wind power system can be established as a distributed power supply whose output varies with time scale. The output curve of photovoltaic system and wind power system is shown as Figs. 1 and 2.
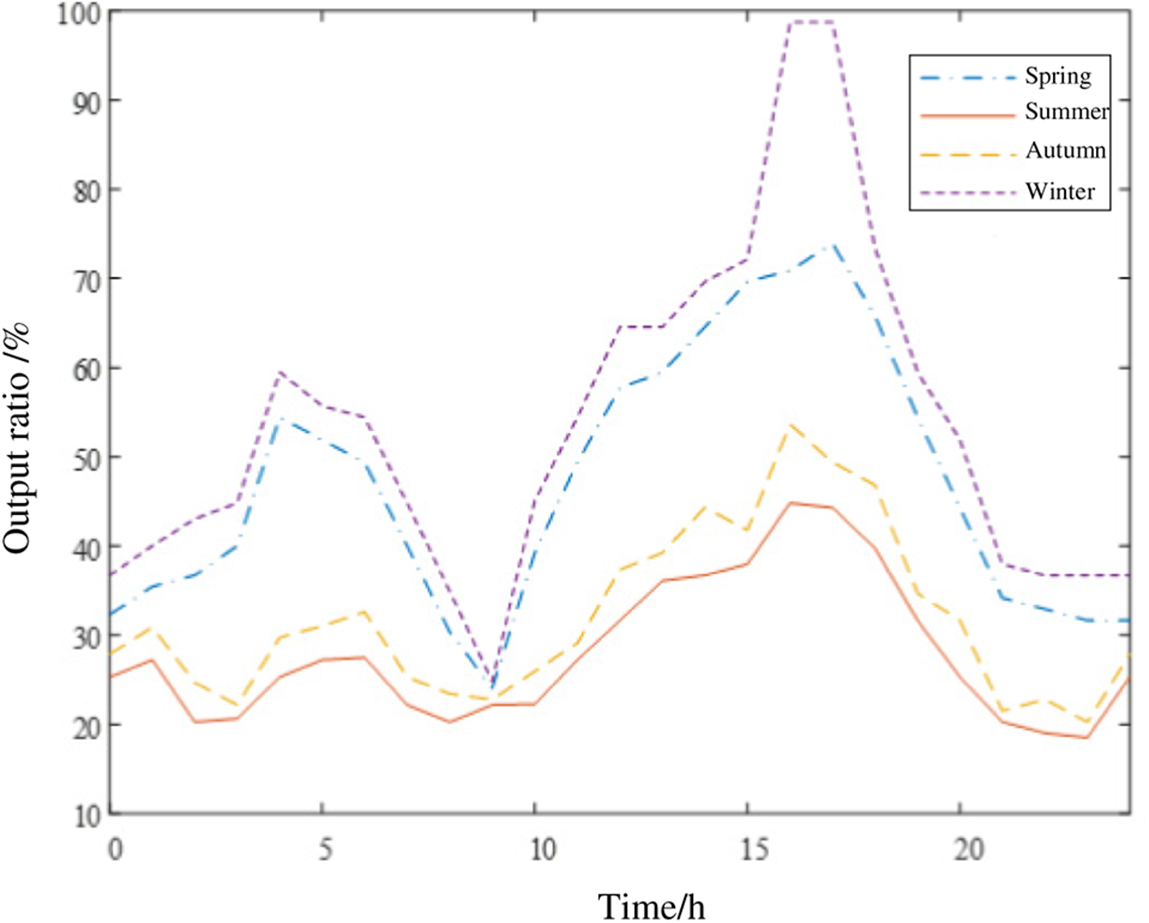
Figure 1: Annual output curve of wind power system
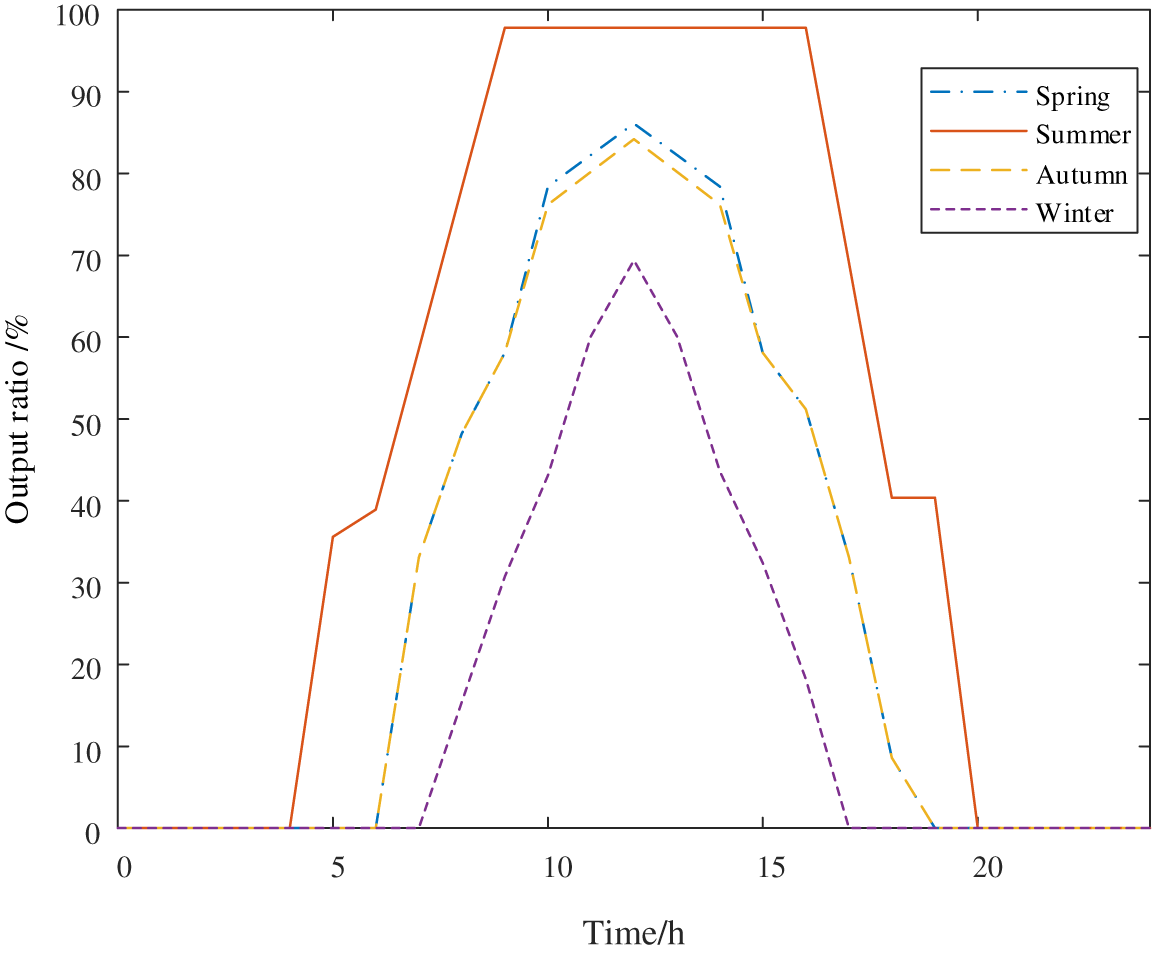
Figure 2: Annual output curve of photovoltaic system
3 Particle Swarm Optimization Algorithm
3.1 Traditional Particle Swarm Optimization Algorithm
Inspired by previous scholars’ research on the foraging behavior of birds, after setting some rules for the foraging behavior of birds, through modeling and data processing, American social psychologist James Kennedy and electrical engineer Eberhart experimented and completed the research on particle swarm optimization (PSO) through accuracy analysis [34]. The fundamental concept of the method is to learn from the intelligence of a bird community, which rapidly and completely searches for food by emulating the collaboration and information sharing between elements of the community [35], to achieve a global optimum solution in a real-world optimization problem. The algorithm abstracts the object of the demand solution as an individual with no mass or volume [36], which can be generalized to D-dimensional space. In the basic PSO algorithm, each bird in the population can be called a particle. The location of the particle is the initial solution to the problem. In the process of foraging [37], each particle evaluates the distance from the food according to the fitness value of the function of the problem. Each particle will fly to search near the current optimal particle, while the flight direction and distance of the particle are controlled by the speed. Among them, each particle is represented by two physical quantities [38], i.e., position
For each generation of individuals, the velocity and position of the particles are updated in the process of searching for the optimum value according to the following equation [39]:
where
3.2 Multi-Objective Particle Swarm Optimization Algorithm
The major differences between the MOPSO [40] and PSO algorithms can be summarized in two points, namely the determination and preservation of non-inferior solutions as well as the selection of
where
For
The crowding distance selection strategy is widely used for updating the Pareto solution set. However, the interaction information in the traditional crowding distance is limited to adjacent particles, which simplifies the calculation process but results in poor globality and uniformity of the Pareto solution set. To enhance the globality and uniformity of the Pareto solution set, this paper proposes a dynamic updating strategy for the Pareto solution set using multiple iterative directions: if the Pareto solution set exceeds the scale, the two particles with the smallest values in the crowding distance vector group are deleted until the Pareto solution set meets the scale; the two particles with the maximum values in the crowding distance vector group and the two particles with the maximum values in the opposite crowding distance vector group are selected as the optimal particles, and the Pareto solution set is updated using multiple iterative directions.
Before updating the Pareto solution set, the fitness values of each particle need to be dimensionless, to define and calculate the minimum distance vector group and maximum distance vector group.
where
3.3 Algorithm Application Design
The final solution of MOPSO is the Pareto frontier composed of non-dominated solutions. In multi-objective optimization problems, in order to avoid the subjective influence of the decision maker, a decision method is needed to avoid the subjective decision. Ideal point decision based on Mahalanobis distance is a popular decision method, and this method is used in literature [44–47] as a decision method. Hence, this paper uses the ideal point decision to obtain the best compromise solution. For specific steps please refer to the literature [48].
To confirm the availability of the presented method, this paper performs a sizing and capacitance study in the IEEE 33, 69 bus node system as illustrated in Figs. 3 and 4, which includes the photovoltaic system (two node installation), wind turbine (two node installation), fuel cell (one node installation), and micro gas turbine (one node installation). In addition, MOPSO [49] is exploited to compare with nonoptimized results, while the population size is set to 200 and the maximum number of iterations is set to 200, while the storage pool size is set to 100, upon which the method parameters are set according to the default values.
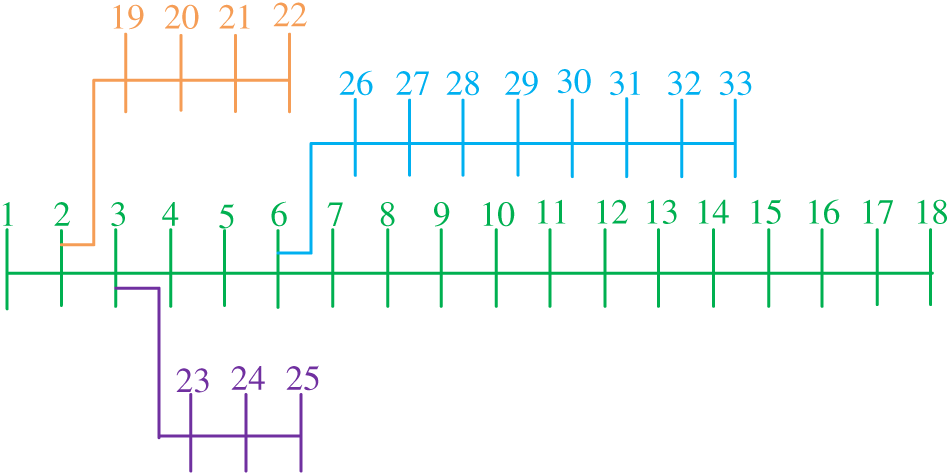
Figure 3: IEEE 33 bus distribution network
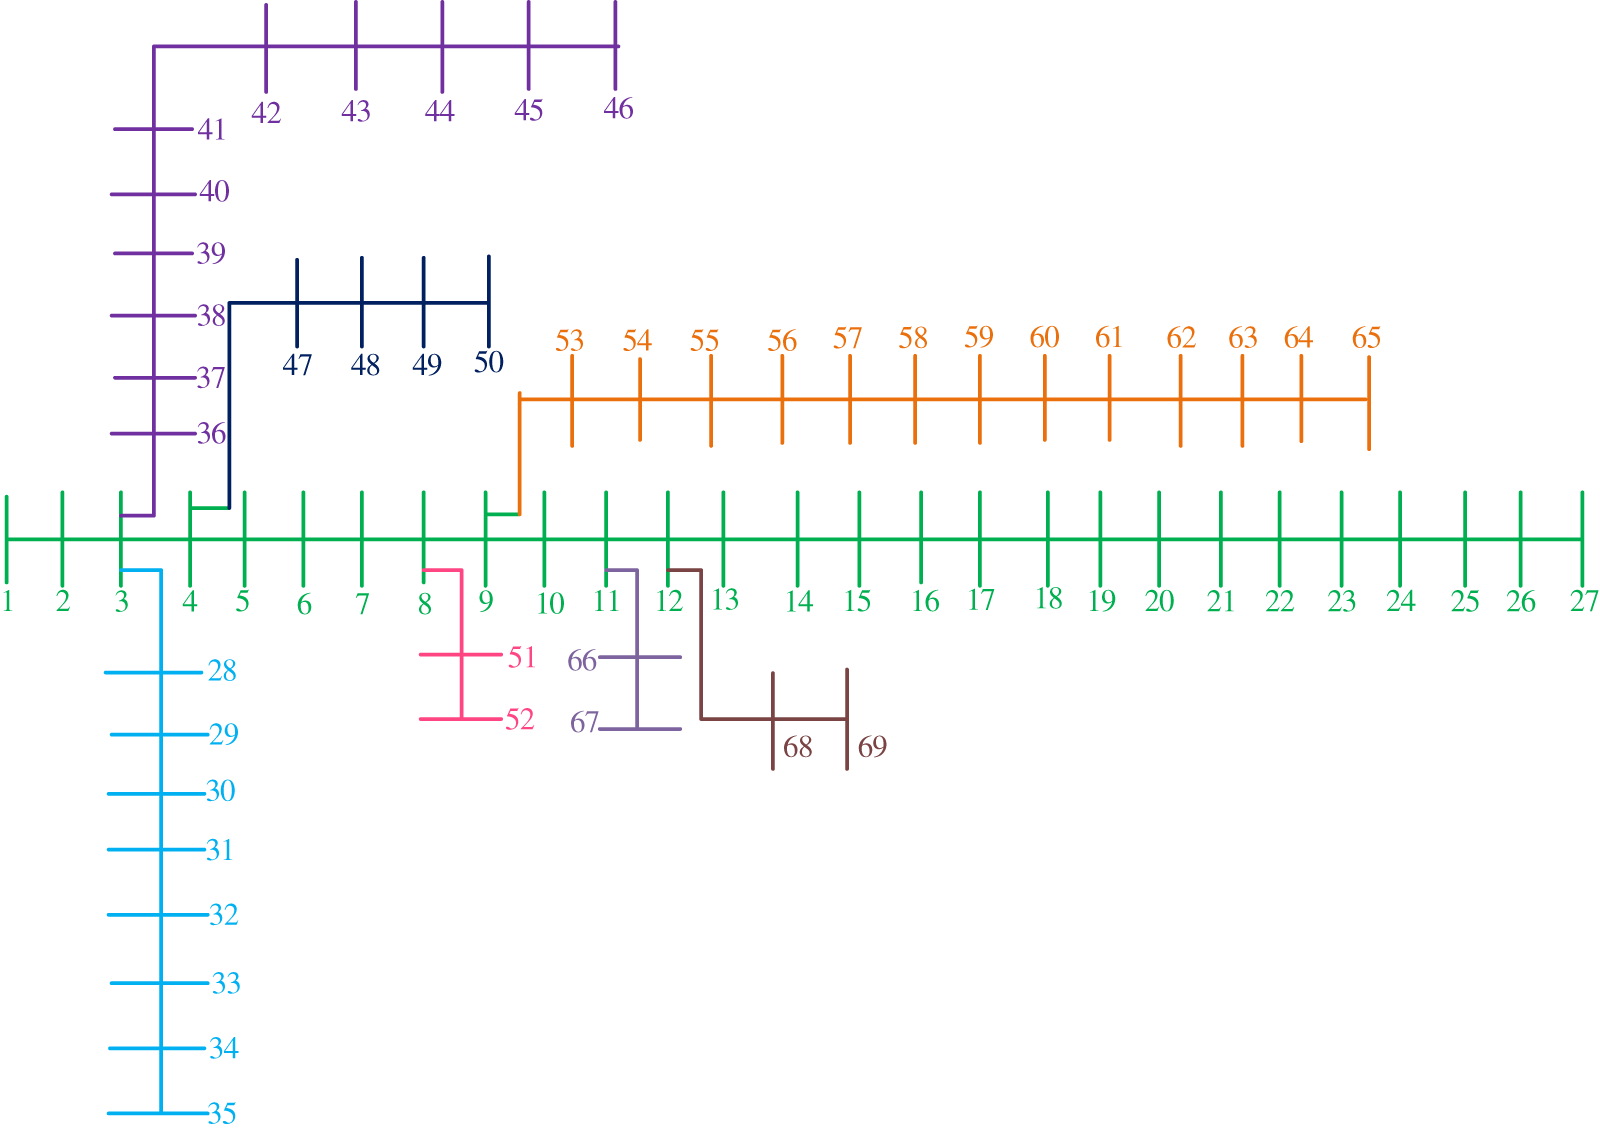
Figure 4: IEEE 69 bus distribution network
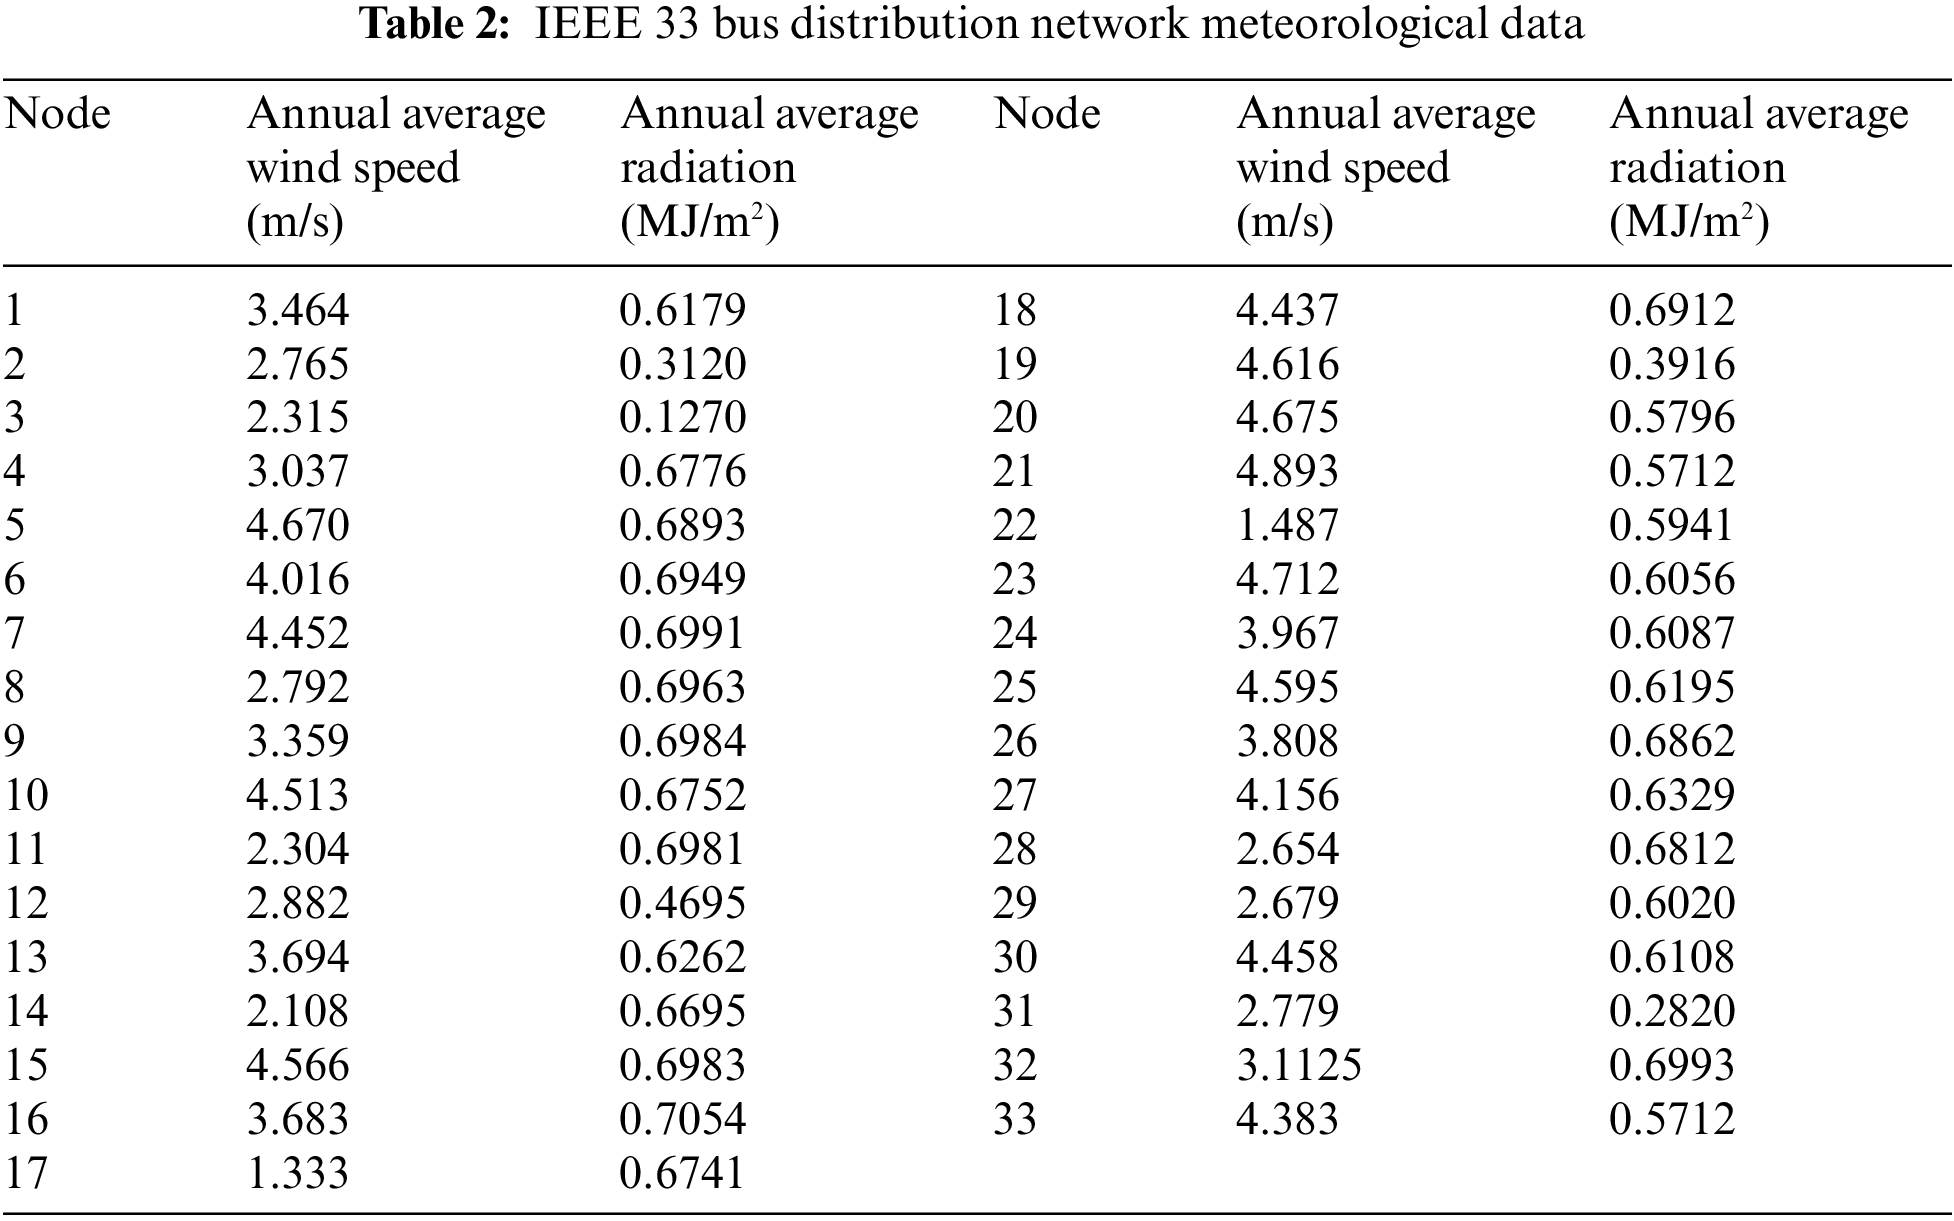
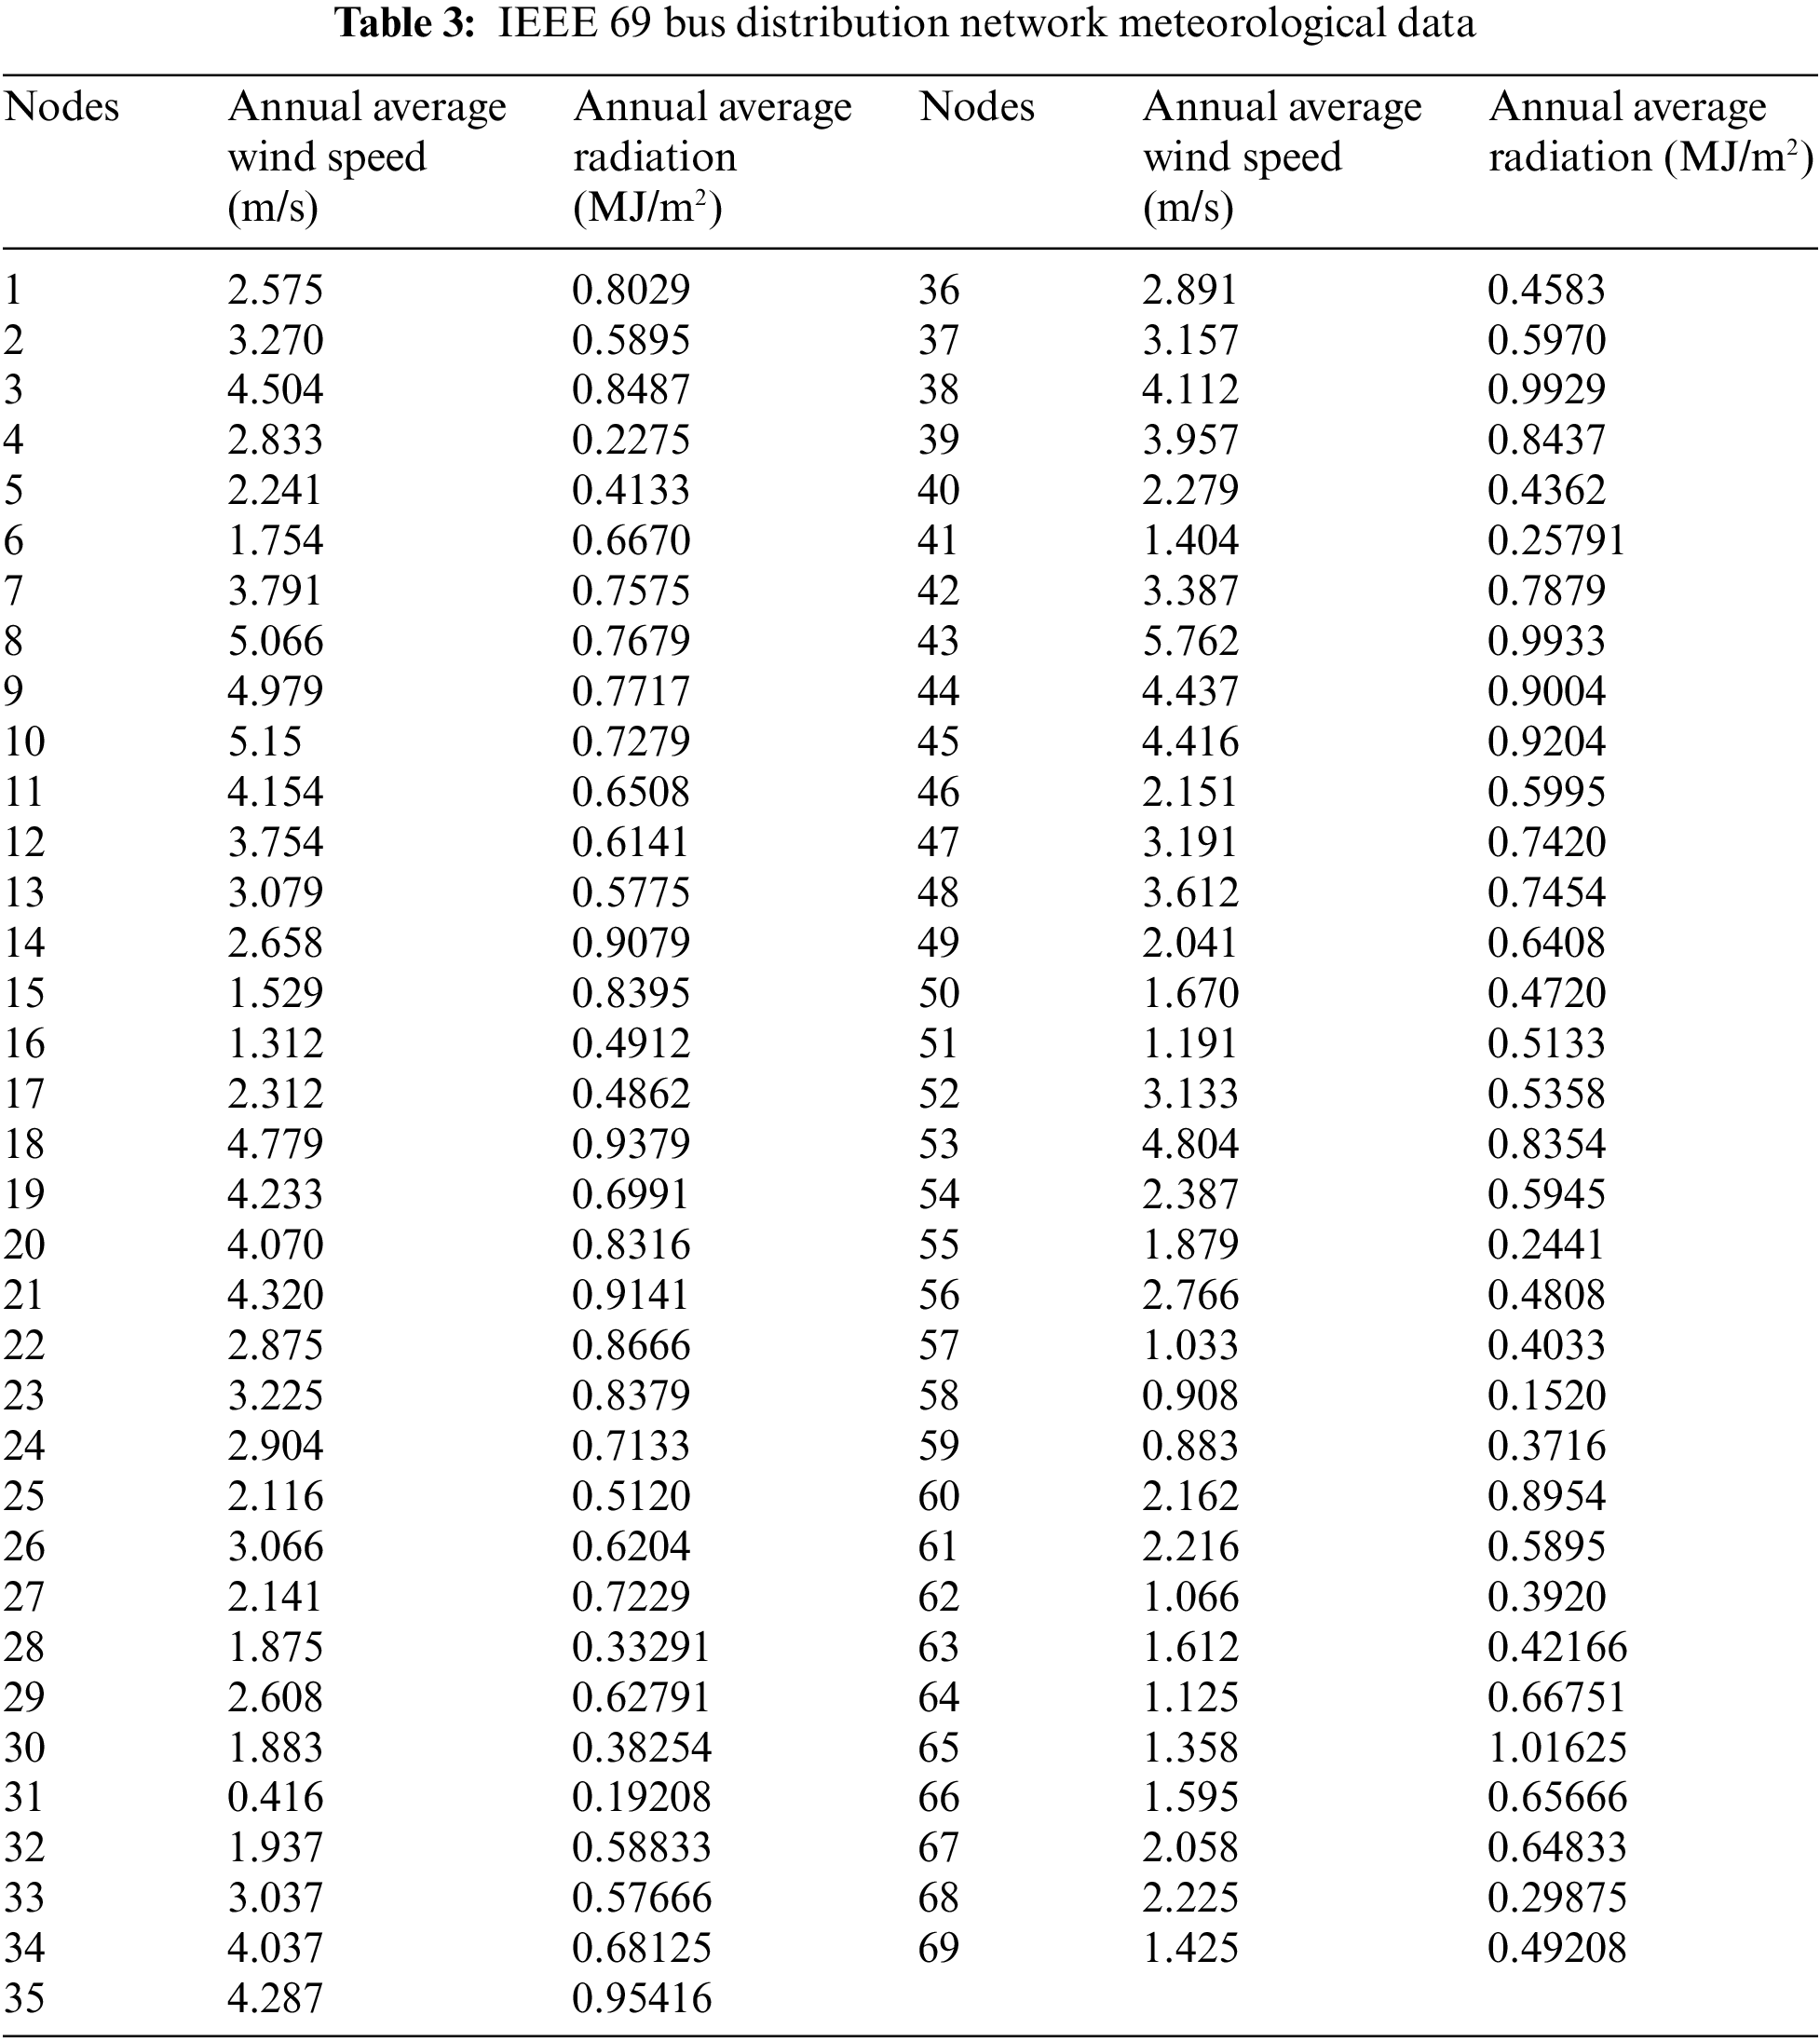
The active power losses of the IEEE 33, 69 bus nods system can be seen in the literature [50,51]. Note that since the test system is difficult to find in the actual project, the meteorological data used in this paper are the historical measured data of a grid-connected photovoltaic power station in 2020. Besides, the measured data from each of its measurement points are averaged and randomly used as the meteorological data for each node, as shown in Tables 2 and 3. What is more, the algorithm is optimized in the environment of MATLAB 2018b with an Intel (R) core (TM) i5-8400 CPU with a dominant frequency of 2.80 GHz and a computer with a memory of 8 GB.
4.1 IEEE 33 Bus System Optimization Results
Table 4 shows seven indices, including inverse generation distance (IGD), generation distance (DG), pure diversity (PD), hypervolume (HV), diversity measure (DM), universality, and spatial distribution (SP) [52] after the MOPSO algorithm has been run 10 times. In addition, Fig. 5 is plotted to provide a better representation of the values of the seven evaluation indexes.
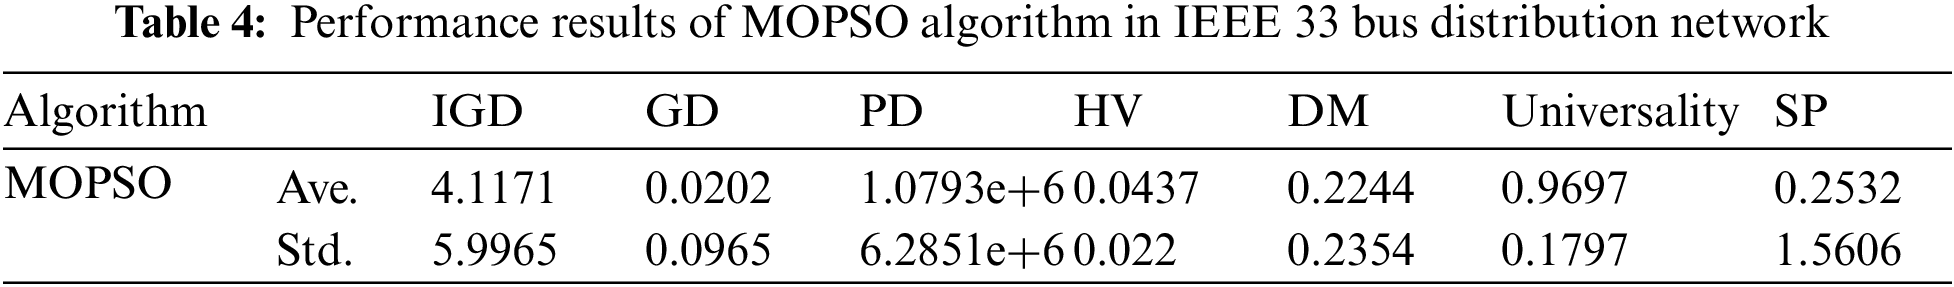
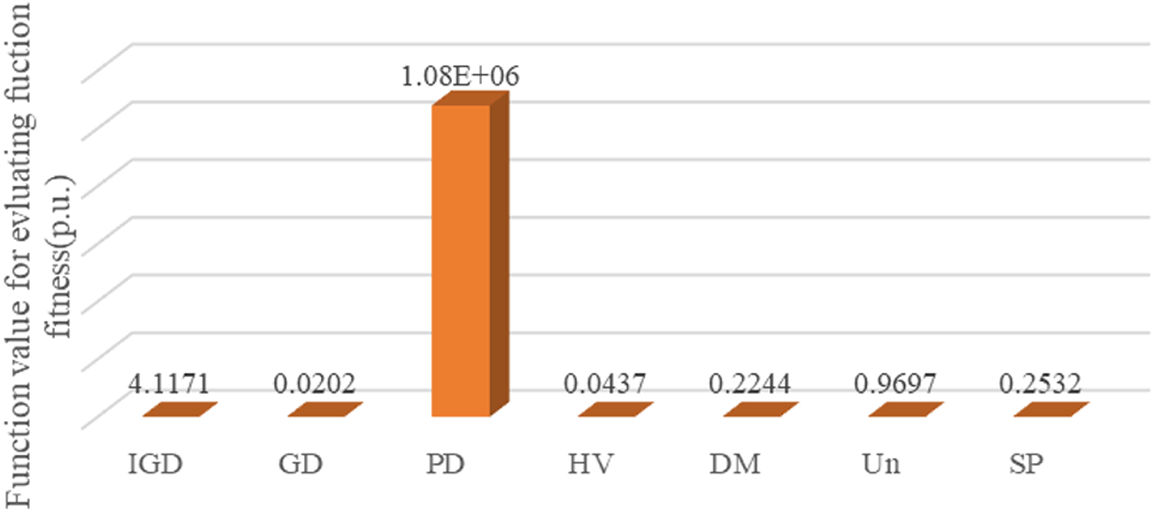
Figure 5: Comparison of average values of indexes under IEEE 33 bus distribution network
The results of MOPSO and without optimization are demonstrated in Tables 5 and 6. It is worth noting that without optimization (without access to DG), the pollution emission targets, economic indicators and meteorological indicators of DG are all zero. Two Photovoltaic systems are installed at nodes 27 and 16, fuel cells and micro gas turbines are installed at nodes 23 and 31, and two wind turbines are installed at nodes 25 and 20, respectively. There is no doubt that the power loss and voltage fluctuation decreased and the voltage profile improved markedly after configuring different types of DGs through MOPSO optimization. With accessing DG, power loss and voltage deviation are decreased by 52.23% (from 38.297 to 24.309 kW), and 38.89% (from 0.6899 to 0.4236 p.u.), respectively. With the power loss decreased, the economy of electric transmission is improved, upon which the price of electricity may reduce. Besides, the voltage distribution of the IEEE 33 bus distribution network optimized by MOPSO are revealed in Fig. 6. It can be seen from Fig. 6 that the voltage level of all nodes is improved after accessing DG under the voltage condition of stable voltage fluctuation. The improved voltage level and stability of voltage fluctuation will improve the stability and reliability of users’ electricity consumption. The change in the power loss of the DG access to the network is since the line current and power loss from the power source to the DG access point varies depending on where the distributed power source is connected. When the incoming power of DG is higher than all the loads of A-nodes and downstream nodes, reverse power flow will occur in the distribution line and power loss will increase, even endangering the operation of the power grid. However, when the incoming power of DG is less than the load at the A-node, the increase in power will reduce the network loss. The improved voltage quality is because the power flow distribution of the grid will be affected when the new energy is connected to the grid. The voltage drop of the branch will be reduced when the output of DG is optimized by MOPSO, thus raising the voltage of the node.
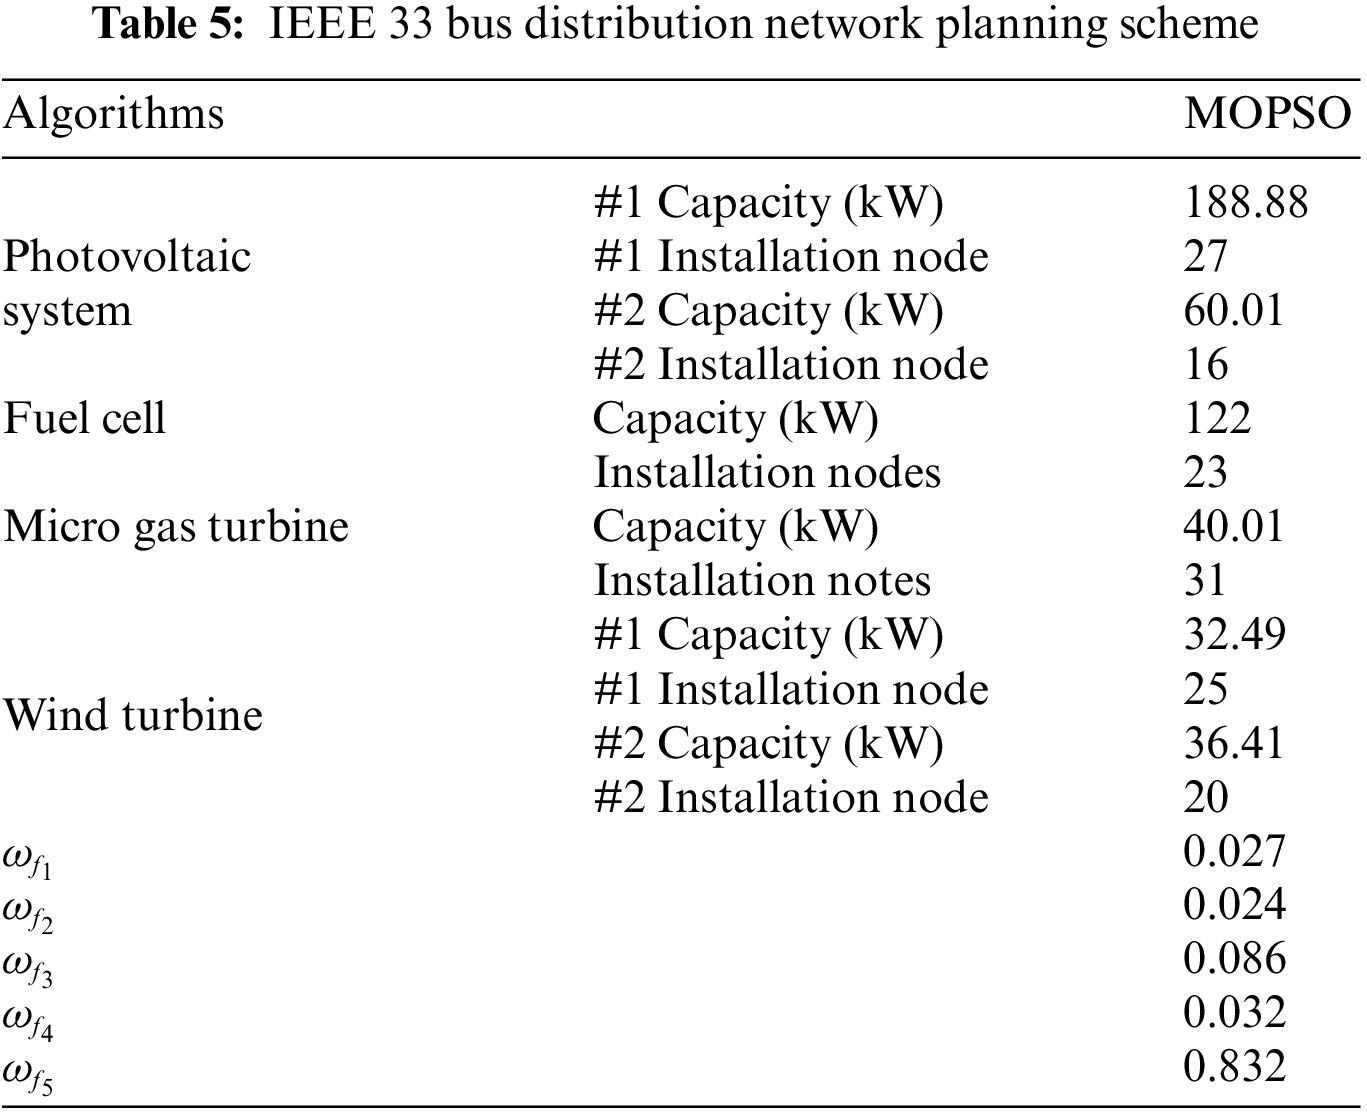
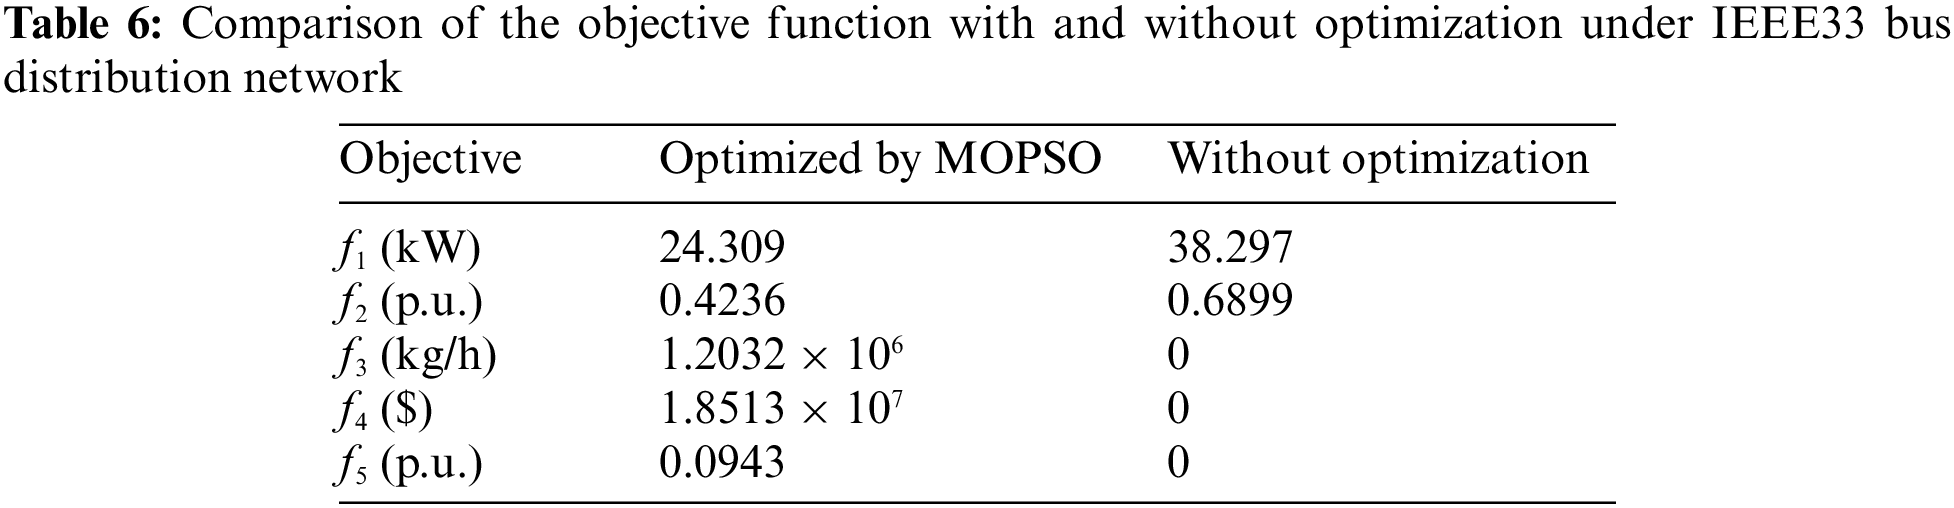
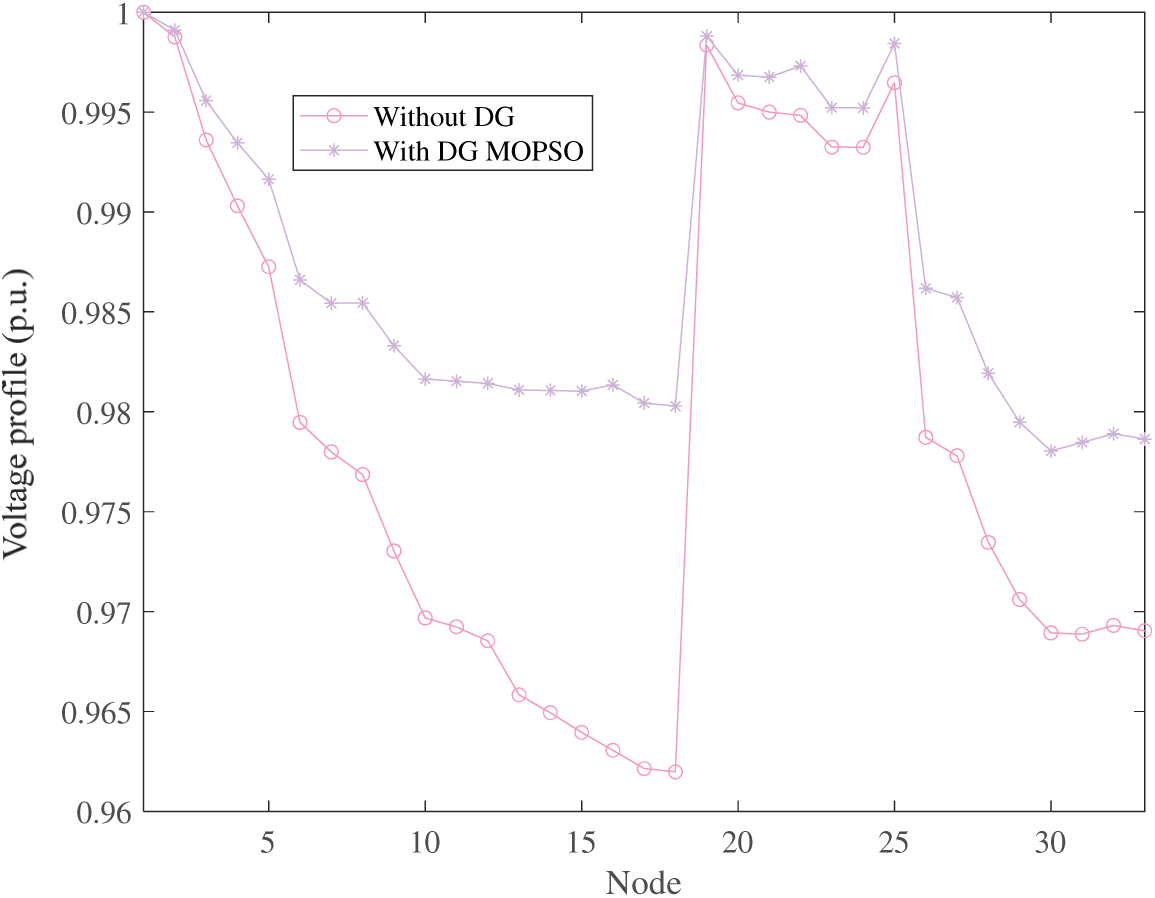
Figure 6: Voltage profile obtained under IEEE 33 bus distribution network
In addition, MOPSO can obtain good meteorological indicators. In order to verify the optimization effect of MOPSO on meteorological indicators, the access positions of photovoltaic systems and wind turbines are exchanged, and the meteorological indicators obtained are 0.1114 p.u. After optimization, it increased by 15.35% (from 0.1114 to 0.0943 p.u.), so that photovoltaic systems and wind turbines can be installed in areas rich in scenery resources.
Generally speaking, as can be seen from Table 6 and Fig. 6, the power losses and voltage profile of the distribution network are considerably enhanced by the optimization of the MOPSO with different types of DGs, while the nonoptimized distribution network further aggravates the reactive power deficit in the area and makes the voltage distribution at this node deteriorate noticeably.
Because this paper optimizes six different metrics (i.e., objective function), the Pareto solution set cannot be plotted in the Cartesian coordinate system. Hence, the Pareto solution set running ten times is mapped from the Cartesian coordinate system to the parallel coordinate system which is shown in Fig. 7. In addition, the relations of the six objective functions are contradictory to each other, which demonstrates the rationality of the multi-objective model has been established.
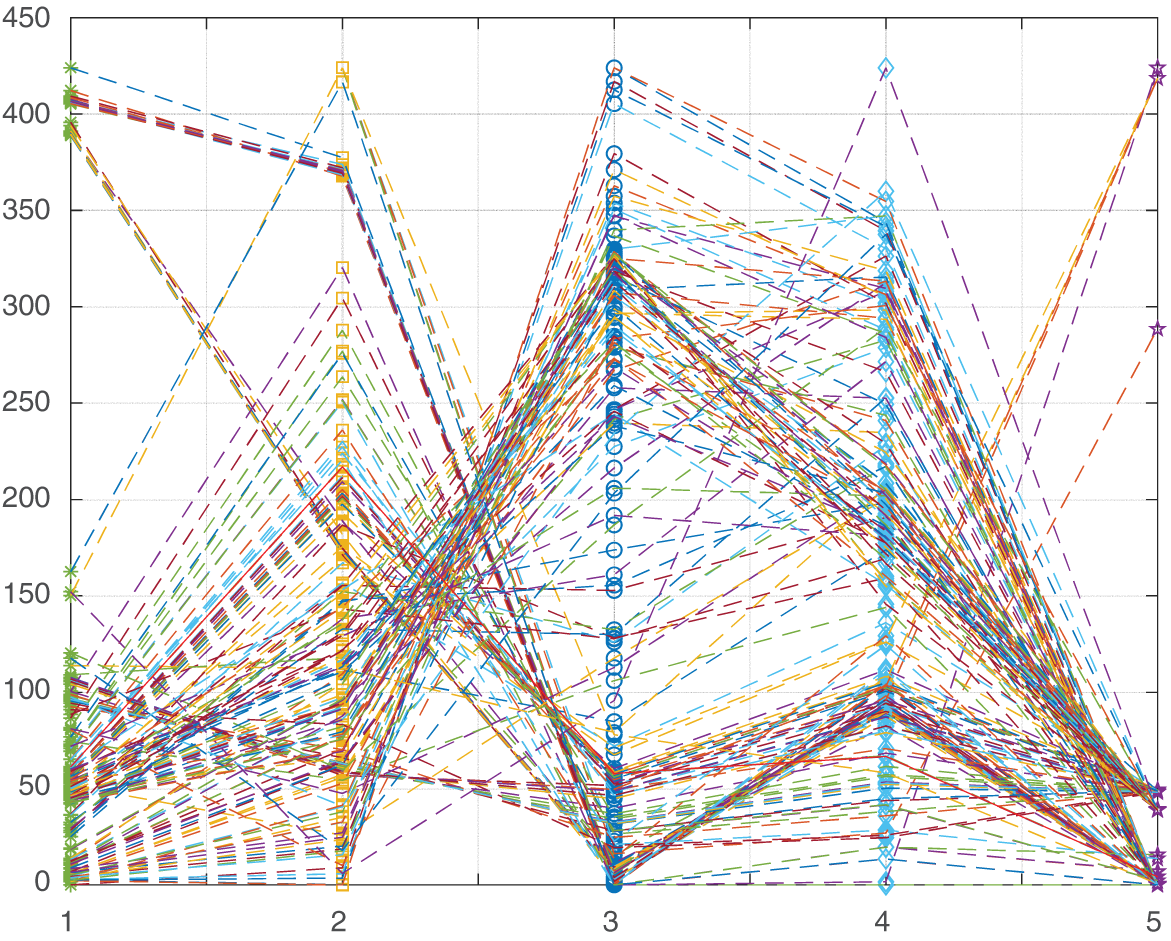
Figure 7: Pareto search results obtained under IEEE 33 bus distribution network
4.2 IEEE 69 Bus Optimization Results
Table 7 shows the seven evaluation indexes of the Pareto frontier (i.e., IGD, DG, PD, HV, DM, universality, and SP) obtained by the MOPSO algorithm under the IEEE 69 bus distribution network. Furthermore, Fig. 8 is derived from the data in Table 7, thus representing the average value of each index.
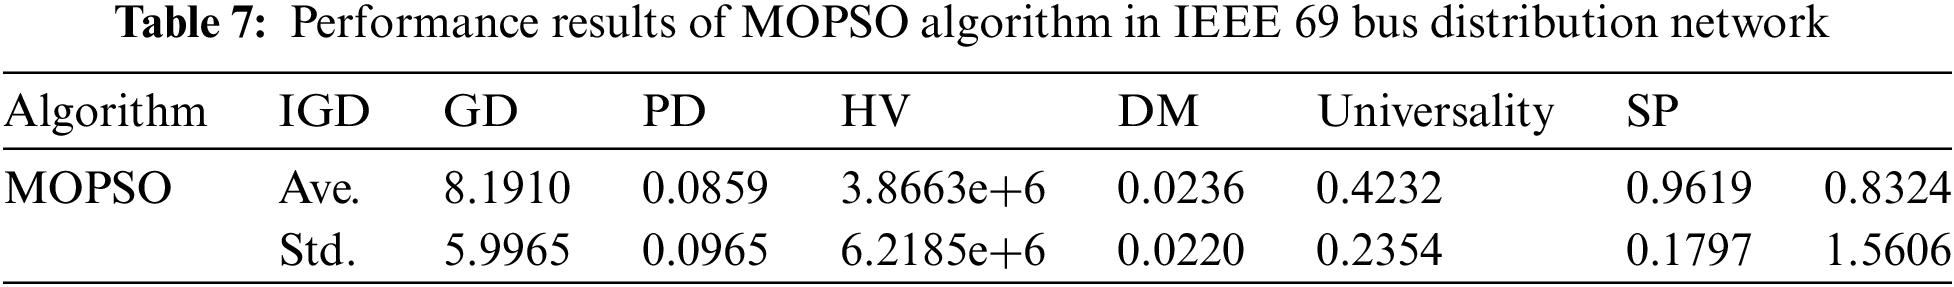
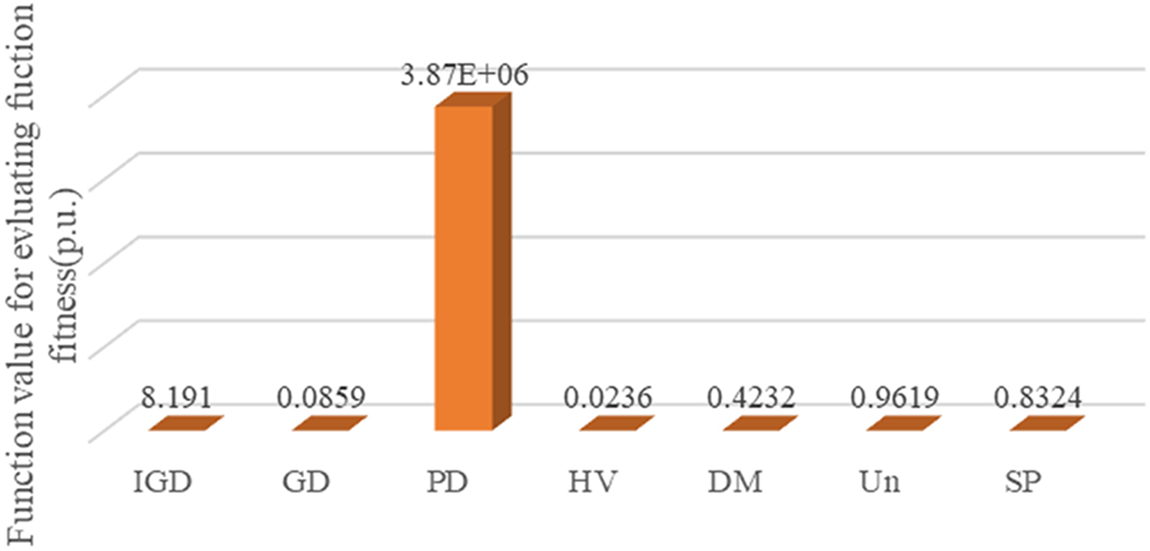
Figure 8: Comparison of average values of indexes under IEEE 69 bus distribution network
Tables 8, 9 and Fig. 9 show the optimization results obtained by MOPSO, the values of objective function with and without optimization, and the optimized voltage distribution, respectively. Two Photovoltaic systems are installed at nodes 22 and 14, fuel cells and micro gas turbines are installed at nodes 53 and 42, and two wind turbines are installed at nodes 43 and 10, respectively. With the access of DG, the voltage level increases steadily but does not exceed 1 p.u. It can be seen that the capacity and location of DG configured by MOPSO are very reasonable after compared with the without optimization results. As concluded from Table 9, the power loss and voltage deviation are reduced by 19.67%, and 58.96%, respectively.
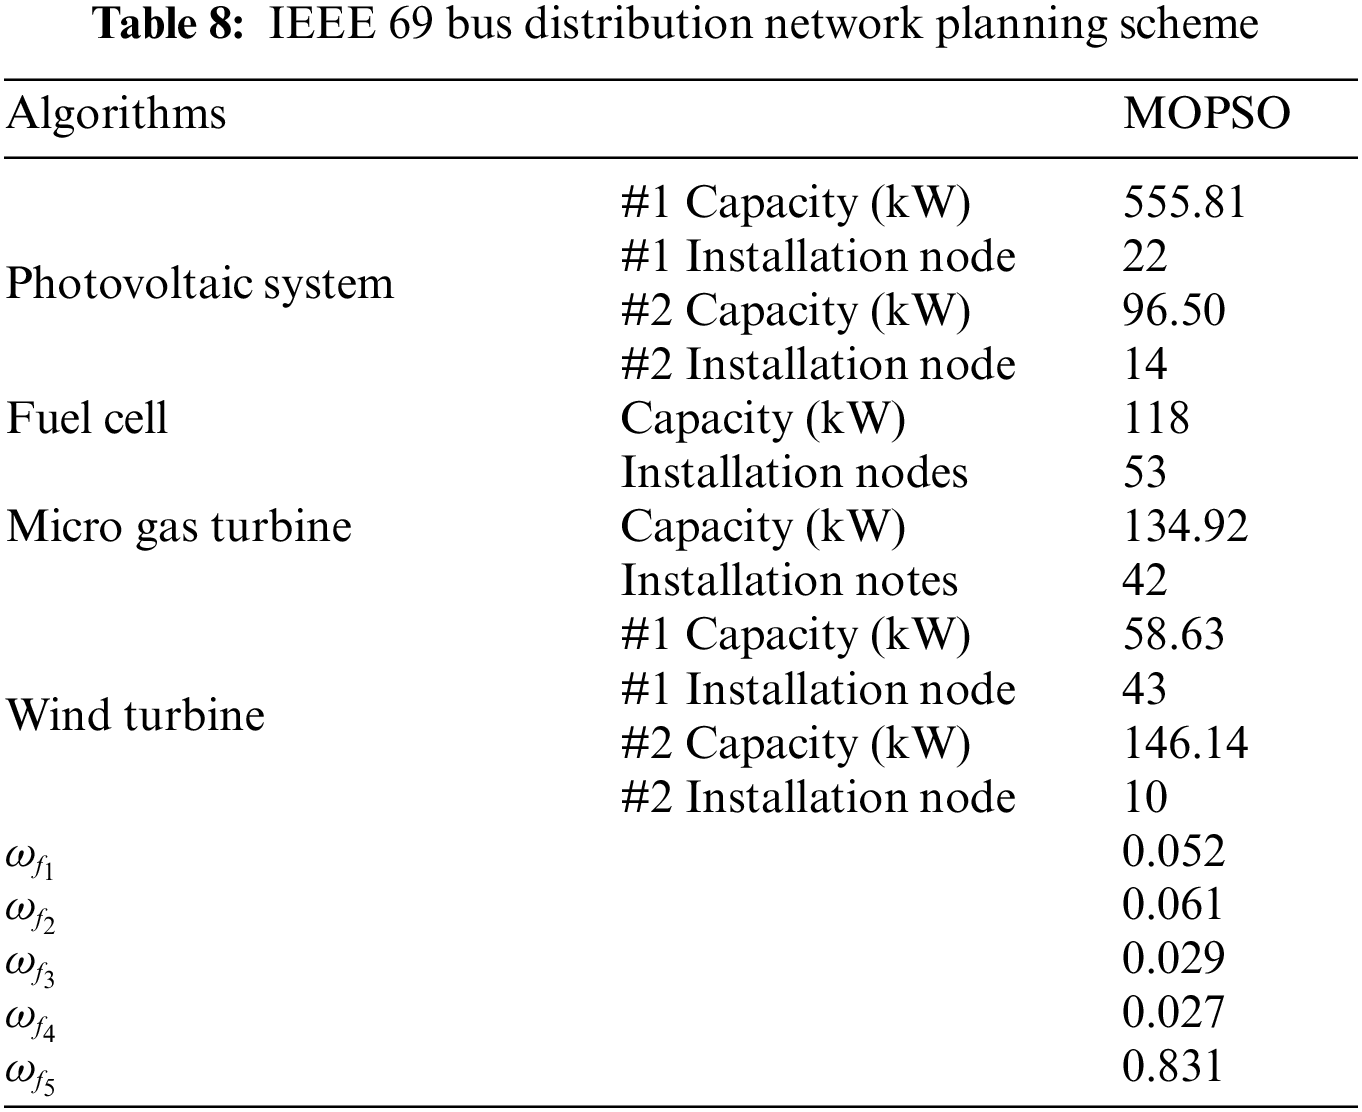
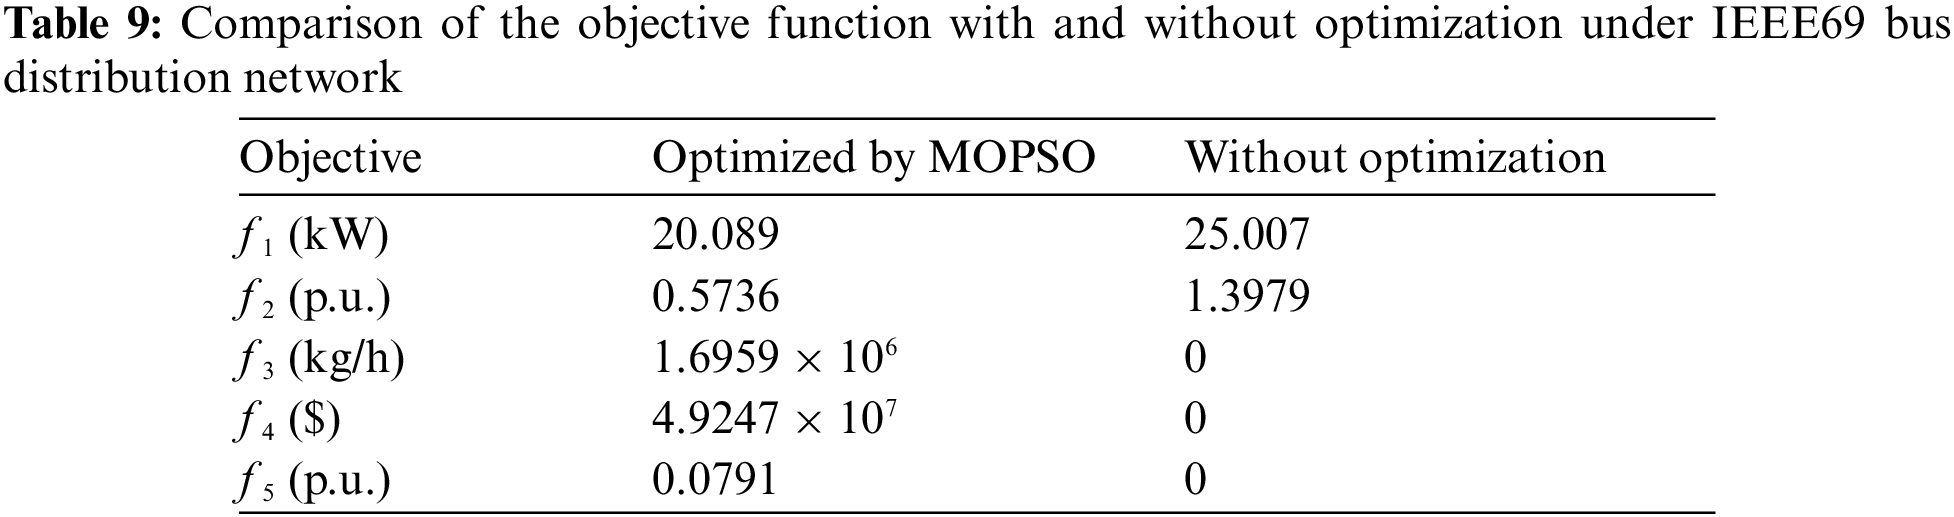
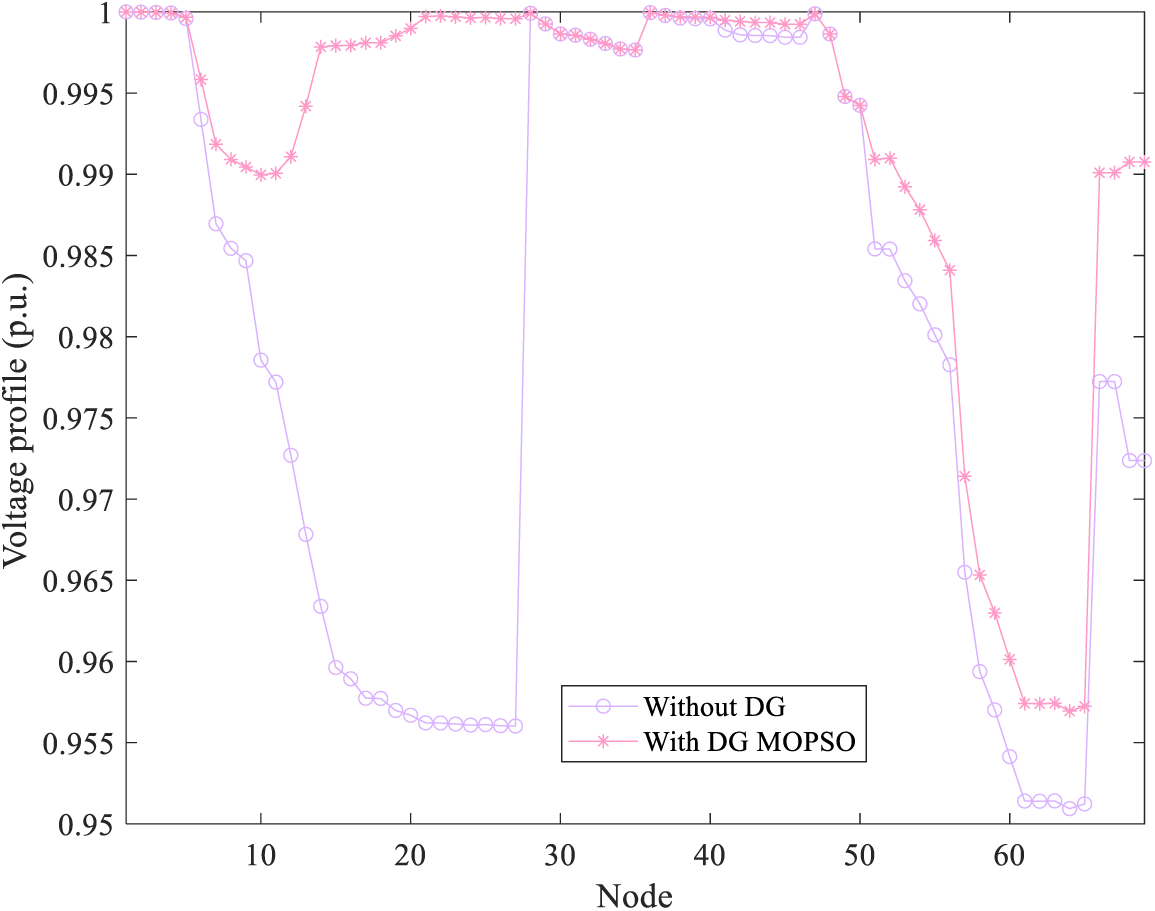
Figure 9: Voltage distribution obtained under IEEE 69 bus distribution network
Fig. 10 shows the Pareto solution set obtained by MOPSO running independently. The unoptimized results show that the optimal comprehensive optimization effect is brought to the distribution network without ensuring the economy, and the power loss and voltage distribution indexes are exceeded. In addition, it can be observed that MOPSO still has strong search performance in systems with large-scale nodes, and can effectively optimize the power loss and voltage distribution of the distribution network when configuring photovoltaic systems and wind turbines to areas rich in wind and solar resources.
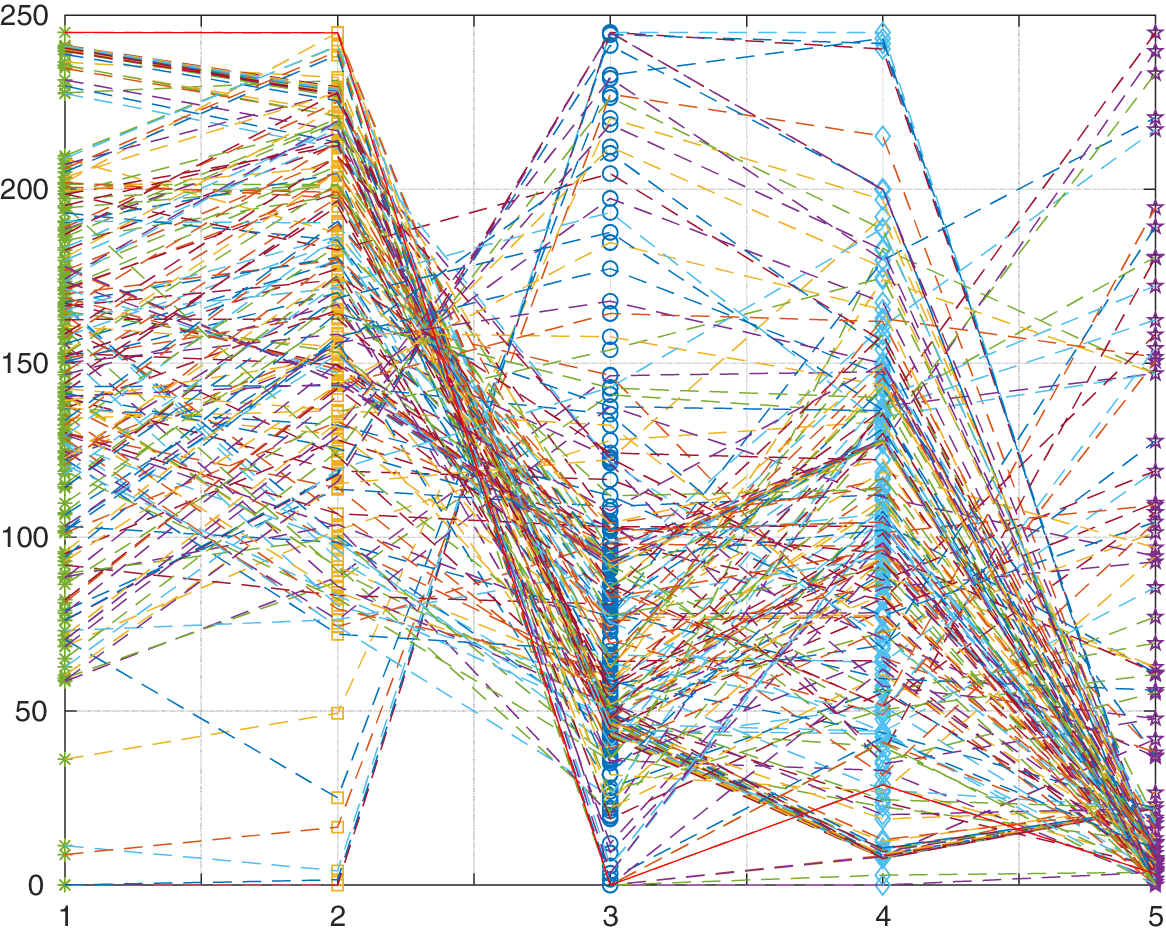
Figure 10: Pareto search results obtained under IEEE 69 bus distribution network
Based on the research of meteorological conditions involved in DG location and sizing, this paper proposes a Pareto multi-objective optimization method based on MOPSO. The main contributions are as follows:
(1) A DG location and sizing model considering active power loss, voltage distribution, pollution emissions, economic costs, and meteorological conditions is established. The introduction of meteorological conditions can effectively install photovoltaic systems and wind turbines in areas with rich scenic resources.
(2) MOPSO algorithm based on Pareto multi-objective optimization is proposed, and the implementation and calculation process of MOPSO algorithm are described. In particular, through the IEEE 33 and 69 bus distribution network test, it is proved that the MOPSO algorithm has good convergence and global search ability, and can obtain a widely distributed and uniform Pareto front.
(3) Taking IEEE 33 and 69 bus distribution networks as examples, the simulation results show that the MOPSO algorithm can effectively reduce the active power loss of the distribution network and improve the voltage distribution in a better economic range. Under IEEE 33 bus distribution network, power loss, and voltage deviation are decreased by 52.23%, and 38.89%, respectively. Meanwhile, MOPSO can obtain good meteorological indicators, simulation result shows that the access positions of photovoltaic systems and wind turbines are exchanged, and the meteorological indicators obtained are increased by 15.35%. Under IEEE 69 bus distribution network, the power loss and voltage deviation are reduced by 19.67%, and 58.96%, respectively. Hence, this strategy has been proven to be effective in solving multi-objective programming problems.
For the purpose of operating DGs into the distribution network in a more appropriate manner, the renewable energy sites installed with energy storage systems will be studied in the future. Besides, dynamic load models will be deployed to simulate loads that are more relevant to the actual project, so that DGs can be utilized efficiently. Furthermore, load growth should be considered in the planning of DG.
Funding Statement: The authors gratefully acknowledge the support of the Enhancement Strategy of Multi-Type Energy Integration of Active Distribution Network (YNKJXM20220113).
Author Contributions: Guobin He: Conceptualization, Writing-reviewing, and editing; Rui Su and Jinxin Yang: Writing-original draft preparation, Investigation; Yuanping Huang and Huanlin Chen: Visualization and contribution to the discussion of the topic; Donghui Zhang, Cangtao Yang, and Wenwen Li: Validation.
Conflicts of Interest: The authors declare that they have no conflicts of interest to report regarding the present study.
References
1. Yang, B., Li, J. L., Shu, H. C., Cai, Z. L., Tang, B. et al. (2022). Recent advances of optimal sizing and location of charging stations: A critical overview. International Journal of Energy Research, 43(13), 17899–17925. [Google Scholar]
2. Tungadio, D. H., Sun, Y. (2021). Energy stored management of islanded distributed generations interconnected. Journal of Energy Storage, 44(19), 10329. [Google Scholar]
3. Yang, B., Wang, J. T., Chen, Y., Li D.Y., X., Zeng, C. Y. et al. (2020). Optimal sizing and placement of energy storage system in power grids: A state-of-the-art one-stop handbook. Journal of Energy Storage, 32(4), 101814. [Google Scholar]
4. Xc, A., Si, B., Fw, B., Li, L. J., Tang, C. H. (2021). Power estimation method of low-voltage distributed photovoltaic generation based on similarity aggregation. Energy Reports, 7(1), 1344–1351. [Google Scholar]
5. Mansouri, S. A., Jordehi, A. R., Marzband, M., Tostado-Véliz, M., Jurado, F. et al. (2023). An IoT-enabled hierarchical decentralized framework for multi-energy microgrids market management in the presence of smart prosumers using a deep learning-based forecaster. Applied Energy, 333, 120560. [Google Scholar]
6. Yang, B., Li, J. L., Li, Y. L., Guo, Z. X., Zeng, K. D. et al. (2022). A critical survey of proton exchange membrane fuel cell system control: Summaries, advances, and perspectives. International Journal of Hydrogen Energy, 47(17), 9986–10020. [Google Scholar]
7. Mansouri, S. A., Ahmarinejad, A., Sheidaei, F., Javadi, M. S., Rezaee Jordehiet, A. et al. (2022). A multi-stage joint planning and operation model for energy hubs considering integrated demand response programs. International Journal of Electrical Power and Energy Systems, 140(1), 108103. [Google Scholar]
8. Mansouri, S. A., Nematbakhsh, E., Ahmarinejad, A., Jirdehi, A. R., Javadi, M. S. et al. (2022). A Multi-objective dynamic framework for design of energy hub by considering energy storage system, power-to-gas technology and integrated demand response program. Journal of Energy Storage, 50, 104206. [Google Scholar]
9. Xie, X. F., Wang, K., Liu, Q. L., Liu, Q. L., Li, B. et al. (2019). Distributed generation locating and capacity planning method considering harmonic index. Engineering Journal of Wuhan University, 52, 616–621. [Google Scholar]
10. Mansouri, S. A., Nematbakhsh, E., Ahmarinejad, A., Jordehi, A. R., Javadi, M. S. et al. (2022). A hierarchical scheduling framework for resilience enhancement of decentralized renewable-based microgrids considering proactive actions and mobile units. Renewable and Sustainable Energy Reviews, 168, 112854. [Google Scholar]
11. Mansouri, S. A., Ahmarinejad, A., Javadi, M. S., Nezhad, A. E., Shafie-Khah, M. et al. (2021). Demand response role for enhancing the flexibility of local energy systems. In: Distributed energy resources in local integrated energy systems, pp. 279–313. Amsterdam, Netherlands: Elsevier. [Google Scholar]
12. Ma, L., Liu, J. P. (2016). Multi-objective planning of multi-type distributed generation considering timing characteristics and environmental benefits. Power System Protection and Control, 44(19), 32–40. [Google Scholar]
13. Pei, W., Sheng, K., Kong, L., Qi, Z. P. (2008). Impact and improvement of distributed generation on distribution network voltage quality. Proceedings of the CSEE, 28(13), 152–157. [Google Scholar]
14. Mansouri, S. A., Ahmarinejad, A., Nematbakhsh, E., Javadi, M. S., Jordehi, A. R. et al. (2021). Energy management in microgrids including smart homes: A multi-objective approach. Sustainable Cities and Society, 69(1), 102852. [Google Scholar]
15. Mansouri, S. A., Ahmarinejad, A., Nematbakhsh, E., Javadi, M. S., Jordehi, A. R. et al. (2022). A sustainable framework for multi-microgrids energy management in automated distribution network by considering smart homes and high penetration of renewable energy resources. Energy, 245(2), 123228. [Google Scholar]
16. Kumari, S., Kalyan, C. (2021). A review on the state of the art of proliferating abilities of distributed generation deployment for achieving resilient distribution system. Journal of Cleaner Production, 287(1), 125023. [Google Scholar]
17. Chang, L. Y., Lin, S. F. (2021). Power dispatch combining meteorological forecast and dynamic game model in multivariate distributed power generation systems. Sensors and Materials, 33(1), 379–391. [Google Scholar]
18. Xu, Z., Liu, H., Sun, H., Ge, S. Y., Wang, C. S. (2022). Power supply capability evaluation of distribution systems with distributed generations under differentiated reliability constraints. International Journal of Electrical Power & Energy Systems, 134(1), 107344. [Google Scholar]
19. Ehsan, A., Yang, Q. (2019). State-of-the-art techniques for modelling of uncertainties in active distribution network planning: A review. Applied Energy, 239(3063–72), 1509–1523. [Google Scholar]
20. Yang, B., Yu, L., Chen, Y. X., Ye, H. Y., Shao, R. N. et al. (2020). Modelling, applications, and evaluations of optimal sizing and placement of distributed generations: A critical state-of-the-art survey. International Journal of Energy Research, 45(3), 3615–3642. [Google Scholar]
21. Abu-Mouti, F. S., El-Hawary, M. (2011). Optimal distributed generation allocation and sizing in distribution systems via artificial bee colony algorithm. IEEE Transactions on Power Delivery, 26(4), 2090–2101. [Google Scholar]
22. Quadri, I. A., Bhowmick, S., Joshi, D. (2019). A hybrid teaching-learning-based optimization technique for optimal DG sizing and placement in radial distribution systems. Soft Computing, 23(20), 9899–9917. [Google Scholar]
23. Li, K., Tai, N. L., Zhang, S. X., Chen, X. (2017). Multi-objective planning method of distributed generators considering correlations. Automation of Electric Power Systems, 41(9), 51–57. [Google Scholar]
24. Kumari, S. M., Maheswarapu, S. (2010). Enhanced genetic algorithm based computation technique for multi-objective optimal power flow solution. International Journal of Electrical Power & Energy Systems, 32(6), 736–742. [Google Scholar]
25. Kefayat, M., Ara, A. L., Niaki, S. N. (2015). A hybrid of ant colony optimization and artificial bee colony algorithm for probabilistic optimal placement and sizing of distributed energy resources. Energy Conversion and Management, 92, 149–161. [Google Scholar]
26. Hedayati, H., Nabaviniaki, S., Akbarimajd, A. (2006). A new method for placement of DG units in distribution networks. 2006 IEEE PES Power Systems Conference and Exposition, pp. 1904–1909. Atlanta, GA, USA. [Google Scholar]
27. Šemić, E., Hubana, T., Šarić, M. (2019). Distributed generation allocation in low voltage distribution network using artificial neural network. IEEE EUROCON 2019-18th International Conference on Smart Technologies, pp. 1–6. Novi Sad, Serbia. [Google Scholar]
28. Akpolat, A. N., Dursun, E., Siano, P. (2021). Inverter-based modeling and energy efficiency analysis of off-grid hybrid power system in distributed generation. Computers & Electrical Engineering, 96(5), 107476. [Google Scholar]
29. Chatterjee, S., Kumar, P., Chatterjee, S. (2017). A techno-commercial review on grid connected photovoltaic system. Renewable and Sustainable Energy Reviews, 81(6), 2371–2397. [Google Scholar]
30. Muttaqi, K. M., Le, A. D. T., Aghaei, J., Mahboubi-Moghaddam, E., Negnevitsky, M. et al. (2016). Optimizing distributed generation parameters through economic feasibility assessment. Applied Energy, 165(3), 893–903. [Google Scholar]
31. Monteiro, R. V. A., Bonaldo, J. P., Da, S. R. F., Bretas, A. S. (2020). Electric distribution network reconfiguration optimized for PV distributed generation and energy storage. Electric Power Systems Research, 184(3), 106319. [Google Scholar]
32. Doagou-Mojarrad, H., Gharehpetian, G. B., Rastegar, H., Olamae, J. (2013). Optimal placement and sizing of DG (distributed generation) units in distribution networks by novel hybrid evolutionary algorithm. Energy, 54(1), 129–138. [Google Scholar]
33. Montoya, O. D., Gil-González, W., Grisales-Noreña, L. F. (2019). An exact MINLP model for optimal location and sizing of DGs in distribution networks: A general algebraic modeling system approach. Ain Shams Engineering Journal, 11(2), 409–418. [Google Scholar]
34. Chen, Z. P., Yu, L. (2018). A new structural damage detection strategy of hybrid PSO with Monte Carlo simulations and experimental verifications. Measurement, 122, 658–669. [Google Scholar]
35. Zhang, Z., Li, X., Luan, S., Xu, Z. (2021). An efficient particle swarm optimization with homotopy strategy for global numerical optimization. Journal of Intelligent and Fuzzy Systems, 40(3), 4301–4315. [Google Scholar]
36. Ren, X. Q., Liu, S. L., Yu, X. D., Dong, X. (2021). A method for state-of-charge estimation of lithium-ion batteries based on PSO-LSTM. Energy, 234(8), 121236. [Google Scholar]
37. Zhu, W., Rad, H. N., Hasanipanah, M. (2021). A chaos recurrent ANFIS optimized by PSO to predict ground vibration generated in rock blasting. Applied Soft Computing, 108(7), 107434. [Google Scholar]
38. Zong, T. C., Li, J. H., Lu, G. P. (2021). Auxiliary model-based multi-innovation PSO identification for Wiener–Hammerstein systems with scarce measurements. Engineering Applications of Artificial Intelligence, 106(1), 104470. [Google Scholar]
39. Yuan, X. J., Liu, Y. C., Bucknall, R. (2021). Optimised MOPSO with the grey relationship analysis for the multi-criteria objective energy dispatch of a novel SOFC-solar hybrid CCHP residential system in the UK. Energy Conversion and Management, 243, 114406. [Google Scholar]
40. Soheyli, S., Shafiei, M. M. H., Mehrjoo, M. (2016). Modeling a novel CCHP system including solar and wind renewable energy resources and sizing by a CC-MOPSO algorithm. Applied Energy, 184(12), 375–395. [Google Scholar]
41. Tian, Z. G., Zhang, Z. Q., Zhang, K. W., Tang, X. M., Huang, S. L. (2021). Statistical modeling and multi-objective optimization of road geopolymer grouting material via RSM and MOPSO. Construction and Building Materials, 275(15), 121534. [Google Scholar]
42. Lin, Y., Huang, L. C., Chen, S. Y., Yu, C. M. (2018). The optimal route planning for inspection task of autonomous underwater vehicle composed of MOPSO-based dynamic routing algorithm in currents. Applied Ocean Research, 75, 178–192. [Google Scholar]
43. Malik, M. Z., Kumar, M., Soomro, A. M., Baloch, M., Kaloi, G. S. (2020). Strategic planning of renewable distributed generation in radial distribution system using advanced MOPSO method. Energy Reports, 6(7), 2872–2886. [Google Scholar]
44. Yang, L., Wu, C., Huang, W., Guo, C., Xiang, C. et al. (2020). Pareto-based multi-objective reactive power optimization for power grid with high-penetration wind and solar renewable energies. Electric Power Construction, 41(7), 100–109. [Google Scholar]
45. Yang, B., Wang, J. T., Yu, L., Cao, P. L., Shu, H. C. et al. (2022). Peafowl optimization algorithm based bi-level multi-objective optimal allocation of energy storage systems in distribution network. Journal of Shanghai Jiaotong University, 56(10), 1294–1307. [Google Scholar]
46. An, D. L., Zhen, H., Yang, Z. (2016). Bi-objective variable selection for key quality characteristics selection based on a modified NSGA-II and the ideal point method. Computers in Industry, 82, 95–103. [Google Scholar]
47. Jing, M., Wei, M., Dong, X., Yang, Q., Wang, Z. (2014). A power restoration strategy for the distribution network based on the weighted ideal point method. International Journal of Electrical Power & Energy Systems, 63(4), 1030–1038. [Google Scholar]
48. Li, L. F., Cai, W. T., Feng, Y., Sun, P., Lu, S. Y. et al. (2022). Multi-objective optimization for optimal placement and sizing of DG in distribution system. 2022 4th Asia Energy and Electrical Engineering Symposium (AEEES), pp. 724–729. Chengdu, China. [Google Scholar]
49. Ding, S. X., Chen, C., Xin, B., Pardalos, P. M. (2018). A bi-objective load balancing model in a distributed simulation system using NSGA-II and MOPSO approaches. Applied Soft Computing, 63(12), 249–267. [Google Scholar]
50. Goswami, S. K., Basu, S. K. (1992). A new algorithm for the reconfiguration of distribution feeders for loss minimization. IEEE Transactions on Power Delivery, 7(3), 1484–1491. [Google Scholar]
51. Li, L., Tan, W., Bai, M., Zhang, L., Lu, T. (2013). Multi-objective location and sizing of distributed generators based on time-sequence characteristics. Automation of Electric Power Systems, 37(3), 58–63, +128. [Google Scholar]
52. Zhou, A., Jin, Y., Zhang, Q., Sendhoff, B., Tsang, E. (2006). Combining model-based and genetics-based offspring generation for multi-objective optimization using a convergence criterion. 2006 IEEE International Conference on Evolutionary Computation, pp. 892–899. Vancouver, BC, Canada. [Google Scholar]
Cite This Article
 Copyright © 2023 The Author(s). Published by Tech Science Press.
This work is licensed under a Creative Commons Attribution 4.0 International License , which permits unrestricted use, distribution, and reproduction in any medium, provided the original work is properly cited.
 Downloads
 Citation Tools