
 Submit a Paper
 Propose a Special lssue
 Open Access
ARTICLE
Research on Low Voltage Series Arc Fault Prediction Method Based on Multidimensional Time-Frequency Domain Characteristics
1 China Electric Power Research Institute Distribution Technology Center, China Electric Power Research Institute, Beijing, 100192, China
2 National Key Laboratory of Disaster Prevention and Reduction for Power Grid, Changsha University of Science and Technology, Changsha, 410114, China
* Corresponding Author: Feiyan Zhou. Email:
Energy Engineering 2023, 120(9), 1979-1990. https://doi.org/10.32604/ee.2023.029480
Received 21 February 2023; Accepted 17 May 2023; Issue published 03 August 2023
 View Full Text
 Download PDF
Abstract
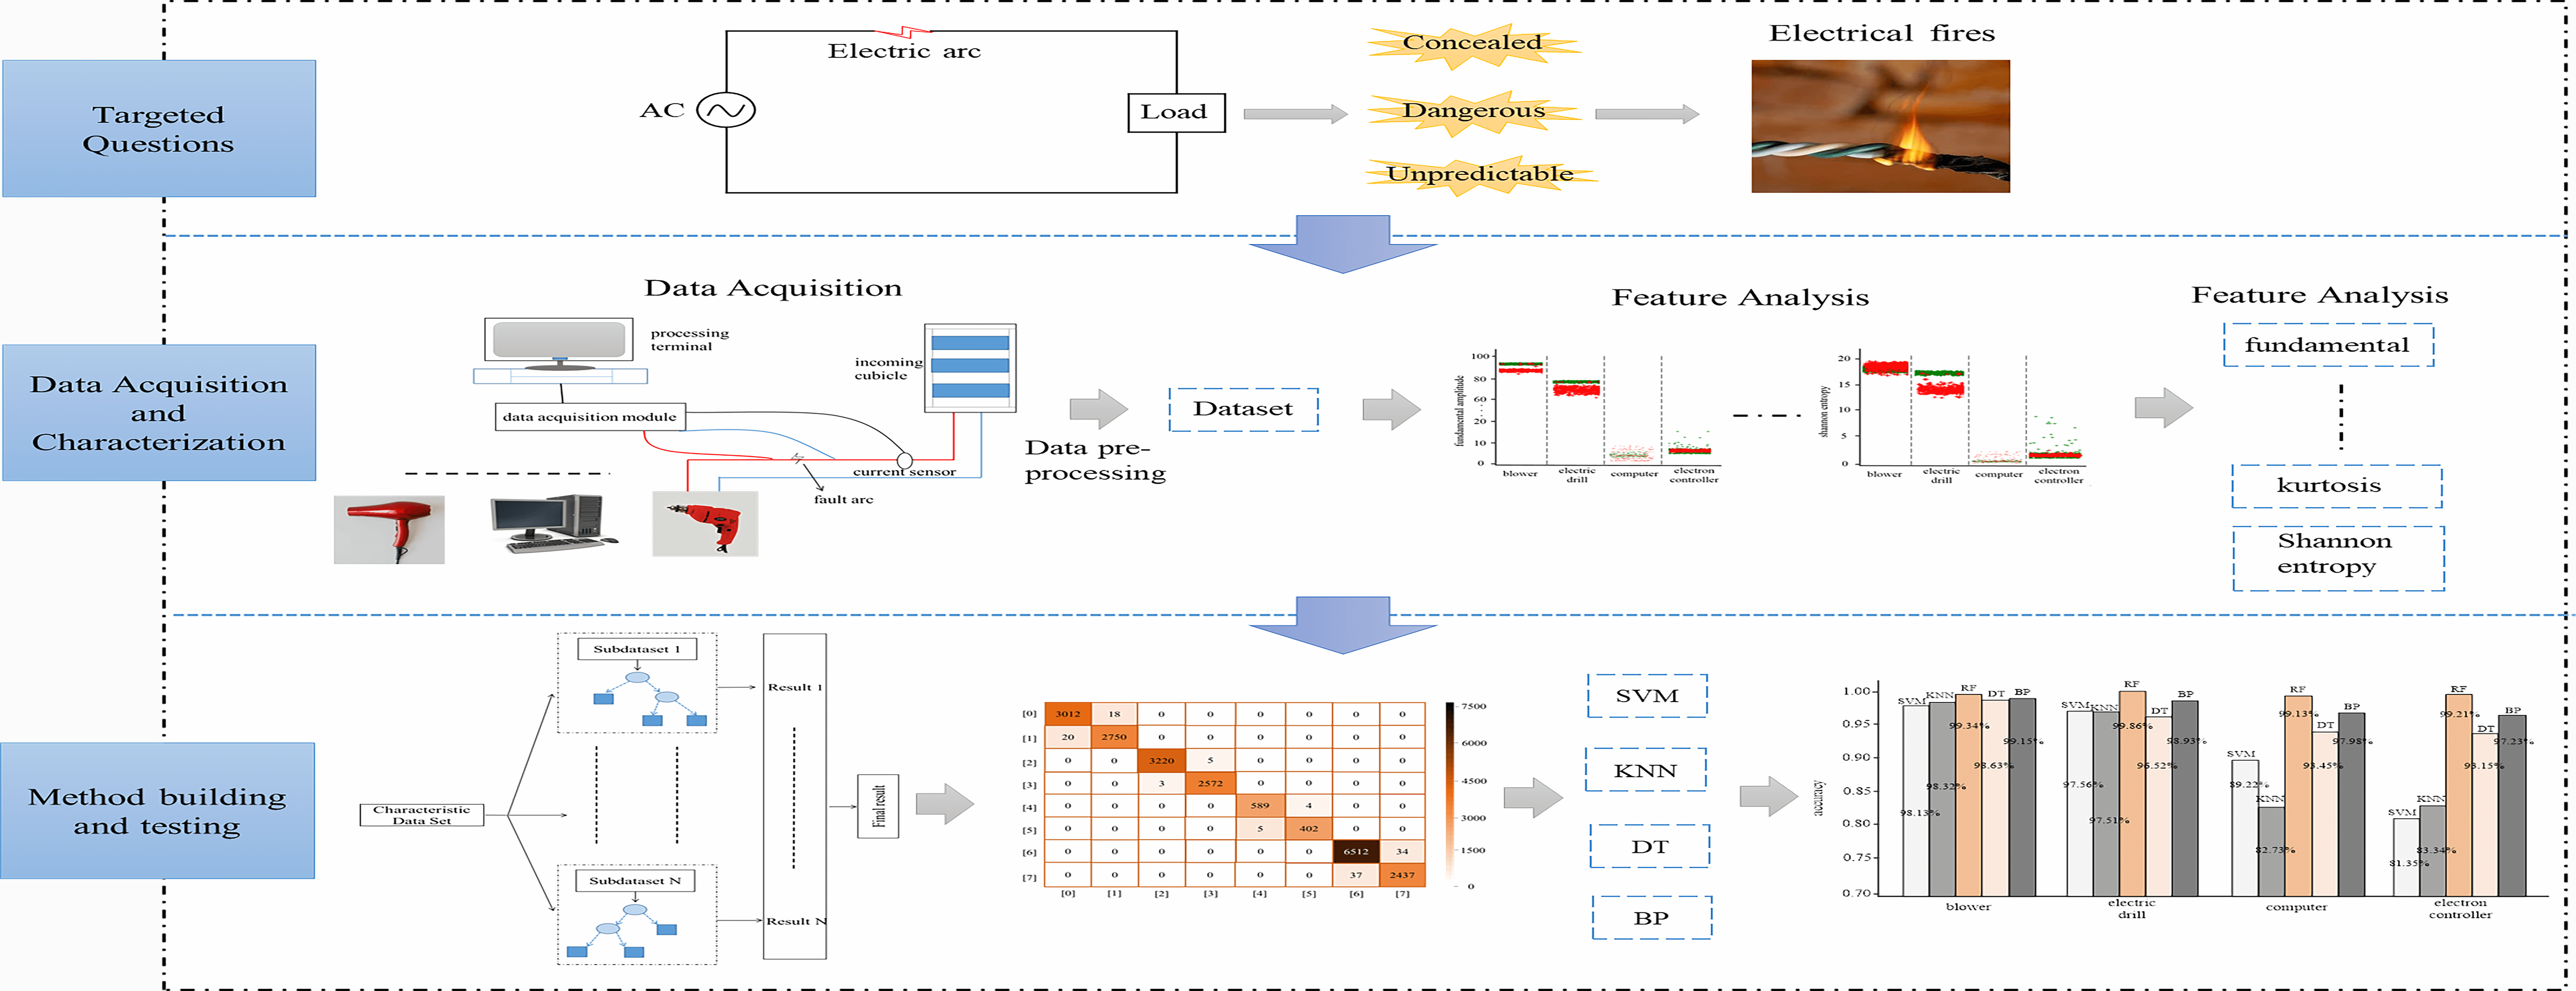
The load types in low-voltage distribution systems are diverse. Some loads have current signals that are similar to series fault arcs, making it difficult to effectively detect fault arcs during their occurrence and sustained combustion, which can easily lead to serious electrical fire accidents. To address this issue, this paper establishes a fault arc prototype experimental platform, selects multiple commonly used loads for fault arc experiments, and collects data in both normal and fault states. By analyzing waveform characteristics and selecting fault discrimination feature indicators, corresponding feature values are extracted for qualitative analysis to explore changes in time-frequency characteristics of current before and after faults. Multiple features are then selected to form a multi-dimensional feature vector space to effectively reduce arc misjudgments and construct a fault discrimination feature database. Based on this, a fault arc hazard prediction model is built using random forests. The model’s multiple hyperparameters are simultaneously optimized through grid search, aiming to minimize node information entropy and complete model training, thereby enhancing model robustness and generalization ability. Through experimental verification, the proposed method accurately predicts and classifies fault arcs of different load types, with an average accuracy at least 1% higher than that of the commonly used fault prediction methods compared in the paper.Graphic Abstract
Keywords
Low voltage distribution systems are deeply integrated into user terminals, distributed in various corners of daily life, with complex and hidden wiring. As scientific and technological continue to improve, the demand for electricity continues to rise, leading to an increasing accident rate resulting from improper use of electricity. Therefore, early detection of faults has become increasingly important. The frequent occurrence of fault arcs in electrical circuits, caused by long-term overload, poor wire quality, and non-standard wiring, further highlights the need for early fault detection. However, the random and hidden nature of fault arc locations makes it difficult to effectively detect faults at the embryonic stage. Once a fault arc occurs, the high arc gap temperature easily ignites surrounding combustibles and causes electrical fires [1–4]. According to statistics from the fire department of the Emergency Management Department, of the 29 large fires that occurred in the first quarter of 2022, 10 were electrical fires, accounting for more than 30% of the total. This poses a great threat to people’s economic, property, and personal safety.
Scholars from both domestic and foreign institutions have conducted research on fault arc hidden danger, focusing on three different detection methods based on signal, mathematical models, and data analysis [5–10]. For instance, Kayano et al. discovered through experiments that a large quantity of high-frequency signals occur near the zero-crossing point during arc faults. Their research also revealed that arc faults generate high-frequency signals between 1 MHz and 3 GHz under different working conditions [11–13]. Moreover, Spyker et al. proposed a frequency-based method for identifying fault arcs. Their studies found that the harmonic content of the current signal between 10 and 100 kHz increases when a fault arc occurs on an airplane [14]. Following this line of thought, American scholars. Momoh et al. Button proposed a method for identifying aviation DC fault arcs based on neural networks and Fourier transforms. By decomposing the collected arc current and voltage signals using Fourier transforms and comparing them to normal working conditions, they successfully extracted the characteristic values of fault arcs [15]. Chinese scholars have focused on the changes in voltage and current signal characteristics before and after fault arc occurrences. For example, Sun et al. used the method of wavelet entropy to detect fault arcs. They rapidly decomposed the current signal of the fault arc using wavelets and judged the fault occurrence by calculating the changes in energy over adjacent periods [16]. Ma et al. used FFT to extract the high-frequency current profile and studied its frequency domain and phase characteristics as a judging criterion [17]. These methods have enriched the detection of faulty arcs, but there is less research on the fusion of multiple features, and most research is conducted on whether a faulty arc has occurred at the current moment, which may lead to an electrical fire once it occurs. Therefore, the advanced prediction of fault arcs is more conducive to their correct handling, which is an effective way to adapt to national policies and reduce the probability of electrical fires.
Based on the aforementioned, this paper mainly focuses on the following works:
(1) In consideration of the diverse electricity load on the user side in low-voltage distribution systems, we built a true-to-life experimental platform for fault arcs and obtained experiment data of diverse loads under both normal and fault arc conditions.
(2) By analyzing the changes of time-frequency characteristics of current signal before and after fault arc occurrence, we extracted six feature indicators that are closely related to fault arcs, including the first, third, and fifth harmonics, zero-crossing rate, peak factor, and Shannon entropy. We constructed a fault arc discrimination feature dataset based on these indicators.
(3) We established a random forest algorithm model, completed hyperparameter optimization through grid searching, and fitted and tested the model using the true-to-life experimental data.
2 Data Acquisition and Waveform Characteristic Analysis
2.1 Fault Arc Experiment Platform Construction
The fault arc is a gas-ionization discharge phenomenon. When a circuit operates under overload for an extended period, causing the core of the line to heat up, or when the line is exposed to damp or corrosive air for an extended period, the insulation layer of the line gradually ages and breaks down, leading to air breakdown, which is the fault arc phenomenon. This phenomenon frequently occurs in daily life electrical usage. To simulate realistic fault arc hazards in real-life scenarios, a true-to-life experimental platform was constructed based on the GB14287.4-2014 arc detector standard published in China using an electric arc generation device available in the laboratory. The schematic diagram and physical layout of the platform are shown in Fig. 1.
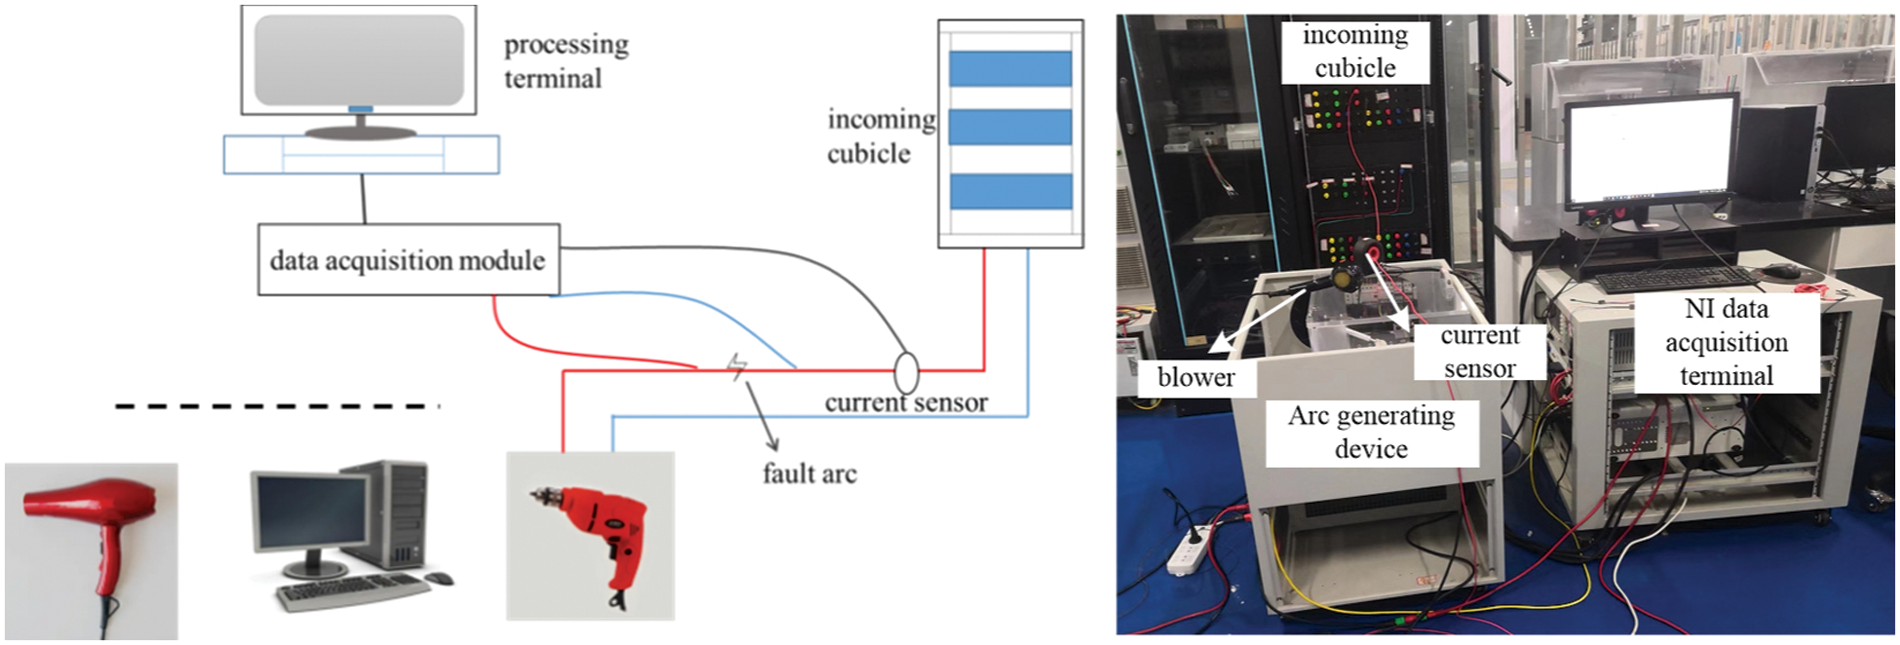
Figure 1: Experimental principle and physical diagram of the apparatus
The experimental platform is mainly composed of a programmable power supply module, arc generation device, data acquisition module, experimental load, and several other modules. The programmable power supply and the fault arc generator are controlled by a computer, and the programmable power supply outputs different voltage levels and frequencies of AC voltage as required. The arc generator is mainly composed of the chassis fan, stepper motor, and carbon and copper electrodes, with the carbon rod being the fixed electrode and the copper rod being the moving electrode. Before the experiment, the carbon rod and copper rod close to form a normal power supply circuit to collect the normal state currently, and then slowly move the copper rod arc generation to collect the fault arc current, the arc distance can be set by the computer to automatically control, to avoid the generation of human error. The experimental load module can be connected to the required load for experiments, to obtain different experimental load normal and fault arc current data.
2.2 Data Acquisition and Pre-Processing
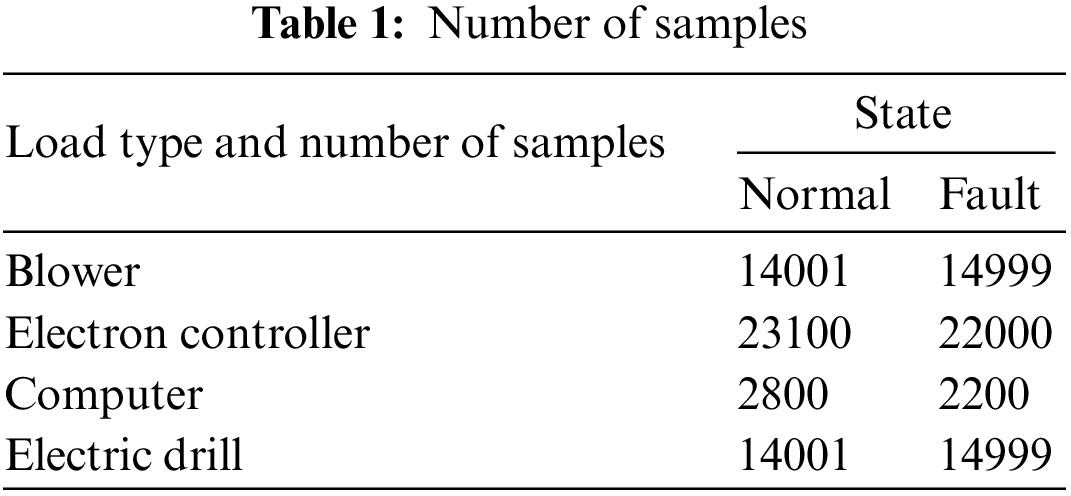
There are various types of electric loads used in households. To make the experiments more realistic, we selected different types of loads, including a hair dryer (resistive load), an electronic dimmer and computer (nonlinear loads), and a drill (inductive load) as the loads for the arc fault experiment. We used a DS200UB-10V current sensor and set the experiment sampling rate to 10 kHz to obtain normal and arc fault experimental data with time-series characteristics. The effective samples are shown in Table 1.
In order to filter out the noise signals and enhance the signal-to-noise ratio of the data in power lines, this study employs wavelet decomposition to transform the current signals. Specifically, the wavelet transform is utilized to decompose the current signals into different frequency components, and the heuristic threshold selection function based on Heursure in MATLAB is used to automatically select the threshold value and remove signals with wavelet coefficients below this threshold. Finally, signal reconstruction is applied to the remaining signals to achieve the objective of noise reduction. This proposed method contributes to significantly improving the quality of the current signal and maintaining its original characteristics [18,19].
Under different operating conditions of loads, the current data of power lines varies significantly. Moreover, different features possess different units, which can potentially affect the prediction accuracy of fault arcs. To address this issue, denoised data is normalized to eliminate the dimensional differences among various loads and features. This normalization enables the model to learn the changes of different features before and after faults more efficiently, thus saving computational time. The denoised data of each load is subjected to a linear transformation and then normalized to fall within the range of [−1, 1]. The normalization formula is presented in Eq. (1).
In Eq. (1),
2.3 Analysis of Waveform Characteristics
To gain a more intuitive understanding of the changes in current characteristics before and after the occurrence of fault arcs, waveform characteristic analysis was performed on the pre-processed currents. Fig. 2 shows the waveform diagrams of current signals under various loads, both normal and during fault arc conditions.

Figure 2: Normal and fault arc waveform analysis diagram
The mechanism of arc generation is that when current passes through a medium, the flow of electrons will ionize the atoms or molecules in the medium, releasing free electrons and ions. These free electrons and ions are accelerated by the electric field and therefore move faster, colliding with surrounding atoms or molecules, causing ionization again and releasing more free electrons and ions. Under certain specific conditions, these free electrons and ions will gather together to form a region with high electron density and large potential difference, forming an arc. Therefore, when a series arc occurs, the arc gap can be equivalent to a nonlinear variable resistor, and high order harmonics will be mixed in the arc current. Moreover, “zero-crossing” phenomenon may occur in most load current waveforms.
Combining the arc mechanism and Figs. 2a–2c, it can be seen that the waveform of the computer presents a similar sine wave profile during normal operation. However, under the fault arc operating condition, the waveform shows many spikes with a large number of sharp pulses. The current of the blow dryer is a smooth sine wave during normal operation, but when a fault arc occurs, a “zero-crossing” phenomenon appears at the zero position of the waveform. The waveform of the electric drill presents a triangular-like shape during normal operation, and the “zero-crossing” phenomenon also appears at the zero position of the waveform when a fault arc occurs. Visible changes occur in the current waveforms of these three types of loads before and after the occurrence of fault arcs, with high feature distinguishability, making prediction relatively easy. Loads with power electronic switches, however, exhibit only slight changes in current waveform before and after arc fault occurrence (as shown in Fig. 2d). Also, because this type of load itself contains single-phase conduction devices such as diodes, there is a “zero pause” phenomenon in both normal and arc waveforms at the zero-crossing point. This makes it difficult to classify and predict a faulty arc in the early stage for such loads. It is challenging to achieve accurate arc prediction before a faulty arc occurs using only single time-domain features such as the zero-crossing time or zero-crossing rate, which can result in misjudgment and missed detection.
To this end, this paper conducts a multi-dimensional analysis of line current data in the time-frequency domain, extracts multiple frequency domain and statistical data feature indicators with strong correlation to fault arcing, and constructs a multi-dimensional fault arcing discrimination feature dataset.
3 Time-Frequency Domain Feature Analysis and Dataset Construction
There is a diverse range of loads used in daily life, and for some loads the changes in current waveform characteristics before and after a fault are extremely subtle. Using a single feature as a criterion for fault prediction can easily lead to false positives and missed detection. Therefore, to improve the feature generalization ability and solve the problem of the failure of single feature quantities as fault features, this study analyzes the current time-domain waveform and selects six feature values for visualization analysis, including the fundamental, third harmonic, fifth harmonic, zero-crossing index, kurtosis, and Shannon entropy. Fig. 3 shows the distribution of feature values before and after various load faults.

Figure 3: Feature distribution map
From the analysis of Fig. 3, it can be observed that the fundamental, third harmonic, and fifth harmonic frequency domain features of the line current for the four types of loads exhibit significant changes before and after the occurrence of fault arcs. The value of the fundamental decreases, while the values of the third and fifth harmonic increase. Except for power electronic switched regulated loads, all other three types of loads exhibit visible changes in the current zero-crossing index before and after the occurrence of fault arcs. In addition, there is a significant change in the kurtosis trend of the four types of loads before and after the occurrence of fault arcs, especially when the computer is used as a load and experiences a fault arc, the current kurtosis increases significantly. Furthermore, Shannon entropy, which is sensitive to signal changes, also exhibits significant changes in the four types of loads before and after the occurrence of fault arcs. Therefore, all six feature indicators are strongly related to fault arcs and can serve as criteria for predicting the occurrence of fault arcs. This preliminarily demonstrates the validity of the selected features for predicting fault arcs. Hence, a multidimensional feature vector was formed by combining the six feature values, and an N × 8 dataset of fault arc discrimination features was constructed. In this dataset, the first column represents the sample number, columns 2–7 respectively represent the six feature values, and the eighth column represents the sample status number.
4 Arc Fault Prediction Model Based on Random Forest Algorithm
The Random Forest algorithm [20,21] is an ensemble learning algorithm based on decision trees. It adopts the “brainstorm” approach by combining multiple decision trees to conduct ensemble learning. Each decision tree outputs a classification voting result, and the final output result is obtained by integrating all the classification voting results and taking the most frequent classification result. This approach leads to a classification prediction result that is closer to the actual value. Compared to a single decision tree model, it has a higher classification prediction accuracy and anti-interference ability. Moreover, it also has strong adaptability to imbalanced datasets. The problem of decision tree overfitting is solved by introducing two random quantities, improving the overall performance of the model. Random Forest can be used to analyze complex and interdependent high-dimensional features, and has fast learning speed and high robustness even when dealing with data with missing values.
The characteristics of line current changes are extremely subtle in the eve of a fault arc occurrence, and there are many interfering factors in the fault arc current data characteristics. However, the random forest algorithm model has strong anti-interference ability and can sensitively perceive such small changes. It can accurately predict whether a fault arc will occur before the fault occurs, thereby achieving fast and accurate prediction of series arc faults. Therefore, using the random forest algorithm to build a fault arc hazard prediction model has strong technical advantages.
In this paper, two random variables, namely random feature selection and random repeated sampling, are used to construct a random forest model consisting of multiple decision trees. The specific process is summarized as follows (as shown in Fig. 4).

Figure 4: Schematic diagram of the structure of the random forest algorithm
(1) A random sampling method is used to generate k random training subsets from the normal and fault arc hidden danger prediction feature data based on time data series, denoted as
(2) Using k training subsets, k decision tree models
(3) The decision tree models
4.2 Fault Arc Prediction Implementation Process
This paper presents the development of an arc fault prediction model that achieves accurate predictions of arc faults based on the current time of a single sampling period. This approach enables proper handling of arc faults on the eve of their occurrence, effectively extinguishing arc faults in their nascent stages. The model is built using a random forest algorithm, which is fast to train, can run on large data sets, and is not easily over-fitted. The specific steps for constructing the model are as follows, and the construction and implementation process of the method are shown in Fig. 5.

Figure 5: The flowchart for the construction and implementation process of the method
(1) Data acquisition. Real experiments were conducted to collect arc data with time sequences for normal and fault conditions. The data was pre-processed using techniques such as denoising and normalization, and then sampled with a time window approach. State encoding was applied to each moment of data based on different load types and operating states.
(2) Feature engineering. Through feature analysis of experimental data, feature indicators highly correlated with fault arcs are extracted and a multidimensional fault arc prediction feature database is constructed. The selected features in this paper are: three frequency-domain features including fundamental, third harmonic, and fifth harmonic; two time-domain features including zero-crossing index and kurtosis; and Shannon entropy.
(3) Model hyperparameter setting. Random forest has relatively few hyperparameters. Based on the advantages of simple operation and being able to find the optimal hyperparameters within a local range, grid search is chosen to optimize model hyperparameters in this paper.
(4) Model data fitting. After obtaining the sampled feature data set with time series, the fault arc prediction feature data set is divided into a training set and test set in the ratio of 4:1, and the training set is read into the model so that the model completes the training set data fitting under the optimal hyperparameter environment, and the learned fault arc prediction model is obtained.
(5) Model performance evaluation. The trained fault arc prediction model was evaluated by the test set for prediction accuracy and training time, and the model generalization abilit.
5 Example Analysis and Validation
5.1 Analysis of Prediction Results
After pre-processing the experimental data, the fault arcing hidden danger prediction dataset was constructed and divided into a training dataset and a test dataset according to a 4:1 ratio. The model hyperparameters were obtained by grid search as shown in the Table 2.
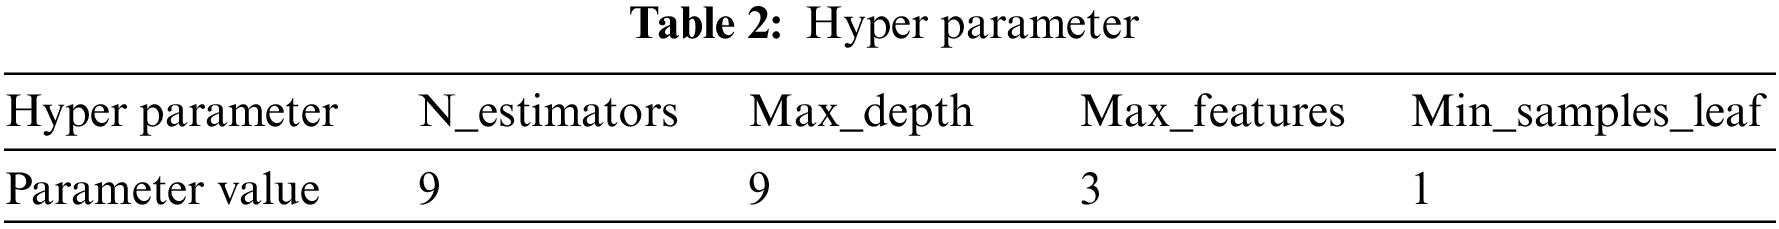
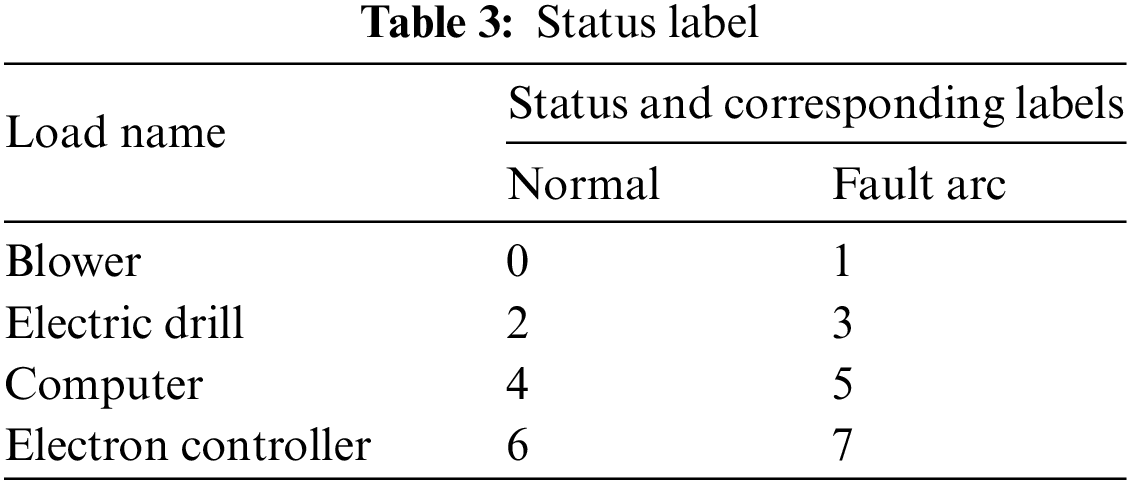
Entropy was used to select the most suitable node. The model was trained and tested using data samples obtained from real experiments. The test results are shown in the confusion matrix in Fig. 6. The state codes are presented in Table 3.
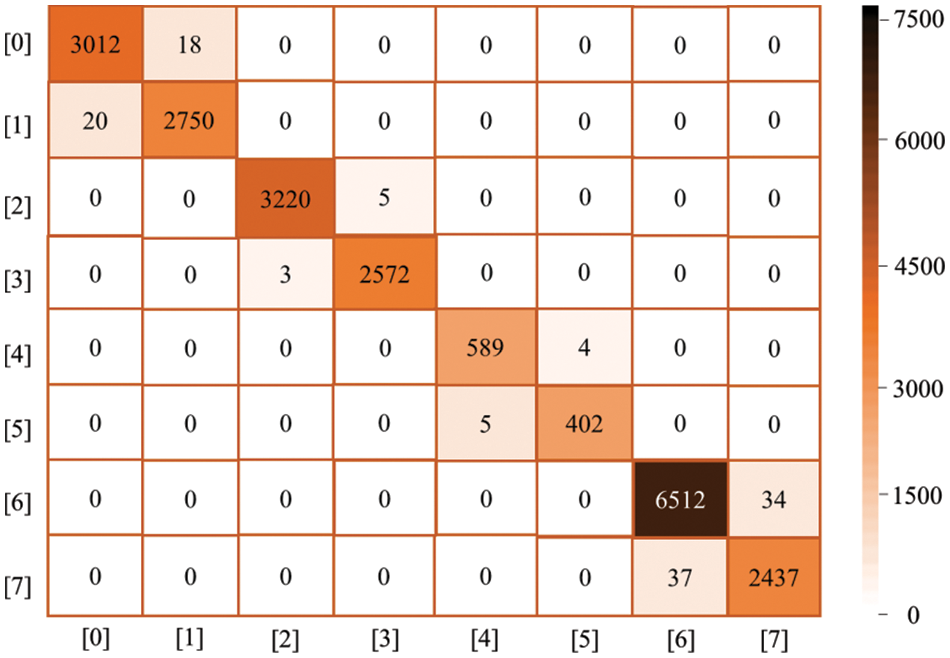
Figure 6: Identification of classification result confusion matrix
The prediction accuracy of the model for each type of load can be calculated from Fig. 6: 99.34% for hairdryers, 99.86% for drills, 99.13% for computers, and 99.21% for electronic regulators. For electronic regulator loads, where it is difficult to predict the occurrence of fault arcs through time domain waveforms, the proposed method achieves a prediction accuracy of 99.21%, and the prediction accuracy can reach more than 99.1% for different load types and different sample sizes, which can demonstrate the effectiveness of the proposed method in predicting the potential risk of fault arcs. In order to test the generalization capability of the model, the prediction accuracy curves of the model under four different loads were verified using the multi-fold cross-validation method, and it was verified that the accuracy curves all met or even exceeded the prediction accuracy, indicating that the model does not have overfitting phenomenon and has strong generalization capability.
5.2 Comparative Analysis of Methods
To further demonstrate the overall superiority of the proposed method, four mainstream classification prediction models, including SVM, KNN, Decision Tree (DT), and BP neural network, were selected for comparative analysis using the same training and testing sample set [22–25]. The test results are shown in Fig. 7.

Figure 7: Multi-model identification classification accuracy statistics chart
According to Fig. 7, it can be observed that all five models achieve good prediction performance under the operating conditions of hair dryer and electric drill loads. However, under the operating conditions of nonlinear loads such as computers and electronic regulators, the prediction accuracy of four models, including GRU, RNN, DT, and BP, shows a significant decline, indicating poor generalization ability. The proposed method in this paper demonstrates strong advantages in various types of load operating conditions with the highest prediction accuracy, further highlighting its superiority.
To address the issue of arc fault missed detection and false positives caused by the similarity between the normal current signal and the series arc fault current signal for certain loads, this paper proposes an arc fault prediction method based on multi-dimensional time-frequency domain features. The following conclusions are drawn:
(1) In the case of electronic switch type loads such as electronic regulators, the current waveform before and after the fault is similar. It is difficult to accurately predict arc faults using only a single feature indicator.
(2) Based on the pattern of current waveform changes before and after faults, feature engineering was carried out, and a comprehensive multidimensional feature library for predicting arc fault hazards was constructed, solving the problem of single-feature-based arc fault prediction being prone to failure.
(3) The paper adopted an ensemble learning algorithm, which utilizes minimizing node information entropy to drive model parameter adjustment and model hyperparameter optimization through grid search, resulting in improved prediction accuracy and reduced computational time.
(4) The proposed method can accurately classify and predict arc faults for different loads, with higher accuracy rates than SVM, KNN, DT, BP, and other methods. This provides a new approach to improve the safety factor of residential electricity consumption and reduce the occurrence of electrical fires.
Funding Statement: This work was funded by Beijing Key Laboratory of Distribution Transformer Energy-Saving Technology (China Electric Power Research Institute).
Conflicts of Interest: The authors declare that they have no conflicts of interest to report regarding the present stud.
References
1. Shi, Z. N. (2009). Research on the means of electrical fire arc fault detection. Electronics Quality, 263(2), 13–15. [Google Scholar]
2. Yu, Q. F., Hu, Y. Q., Yang, Y. (2020). A review of low voltage ac series arc fault detection. Electrical & Energy Management Technology, 586(1), 24–30. [Google Scholar]
3. Zhao, J. (2017). Statistical analysis of electrical fire. Fire Community, (12), 71–72. https://doi.org/10.16859/j.cnki.cn12-9204/tu.2017.12.034 [Google Scholar] [CrossRef]
4. Chen, X. G. (2012). Analysis of characteristics of electrical fire in China based on statistical data. Fire Technique and Products Information, (5), 47–49. [Google Scholar]
5. Bao, G., Gao, X., Jiang, R., Huang, K. (2019). A novel differential high-frequency current transformer sensor for series arc fault detection. Sensors, 19(17), 3649. [Google Scholar] [PubMed]
6. Liu, Z. K., Ding, X. Z., Xu, S. D., Dong, T. (2018). Research on switchgear arc discharge fault and its measurement. Yunnan Electric Power, 46(1), 121–125. [Google Scholar]
7. Zhang, G. Y., Ma, H. M., Cheng, Z. W., Peng, Z. Y., He, S. (2019). A detection method of rekindling phenomenon of switch cabinet based on radiated electromagnetic wave signal. Yunnan Electric Power, 47(3), 41–43. [Google Scholar]
8. Qu, N., Wang, J. H., Liu, J. H., Wu, F. C. (2018). A series arc fault detection method based on Cassie model and L3/4 norm. Power System Technology, 42(12), 3992–3997. [Google Scholar]
9. Yan, K., Ma, S., Wang, W., Du, P., Xu, Z. B. (2019). Simulation and research of low voltage series arc discharge detection and fault protection based on Cassie model and wavelet analysis. Electrical & Energy Management Technology, (18), 48–52+67. https://doi.org/10.16628/j.cnki.2095-8188.2019.18.008 [Google Scholar] [CrossRef]
10. Uriarte, F. M., Gattozzi, A. L., Herbst, J. D., Estes, H. B., Hotz, T. J. et al. (2012). A DC arc model for series faults in low voltage microgrids. IEEE Transactions on Smart Grid, 3(4), 2063–2070. https://doi.org/10.1109/TSG.2012.2201757 [Google Scholar] [CrossRef]
11. Kayano, Y., Nakamura, T., Miyanaga, K., Inoue., H. (2007). Current and radiation noise up to GHz band generated by slowly breaking silver-compound contacts. IEICE Transactions on Electronics, E90-C(7), 1504–1506. [Google Scholar]
12. Kayano, Y., Miura, H., Miyanaga, K., Inoue, H. (2008). The relationship between voltage and duration of short-time arc generated by slowly breaking silver contact. IEICE Transactions on Electronics, E91-C(8), 1230–1232. [Google Scholar]
13. Inoue, H., Miura, H., Kayano, Y., Miyanaga, K. (2010). Current noise up to GHz band generated by slowly breaking silver-compound contacts with external DC magnetic field. European Physical Journal, 49(2), 22908–22915. [Google Scholar]
14. Spyker, R., Schweickart, D. L., Horwath, J. C., Walko, L. C., Grosjean, D. (2005). An evaluation of diagnostic techniques relevant to arcing fault current interrupters for direct current power systems in future aircraft. Electrical Insulation Conference & Electrical Manufacturing Expo, pp. 146–150. Indianapolis, USA. [Google Scholar]
15. Momoh, J. A., Button, R. (2003). Design and analysis of aerospace DC arcing faults using fast fourier transformation and artificial neural network. 2003 IEEE Power Engineering Society General Meeting, vol. 2, pp. 788–793. Toronto, Canada. [Google Scholar]
16. Sun, P., Zheng, Z. C., Yan, R. N. (2010). Detection method of arc fault in series with wavelet entropy. Proceedings of the CSEE, 30(S1), 232–236. [Google Scholar]
17. Ma, Z., Zhang, G. G., Ke, C. J. (2010). A method of fault arc detection based on spectral analysis of high-frequency current. Electrical & Energy Management Technology, 354(9), 10–12+15. [Google Scholar]
18. Bai, H., Pan, S. H., Shao, X. C., Gao, J. H., Li, W. et al. (2022). A high impedance grounding fault semi-supervised identification method based on wavelet denoising and random forest. Power System Protection and Control, 50(20), 79–87. [Google Scholar]
19. Hu, C. M., Liu, Z., Liu, N., Song, X. J., Du, C. Y. (2023). Engine knock recognition based on wavelet domains denoising and convolutional neural network. Journal of Aerospace Power, 1–9. https://doi.org/10.13224/j.cnki.jasp.20220414 [Google Scholar] [CrossRef]
20. Zhu, F. Y., Wu, G. Q. (2021). Load forecasting of the power system: An investigation based on the method of random forest regression. Electric Engineering, 118(6), 1703–1712. [Google Scholar]
21. Qiao, L. W., Wang, J. Y., Guo, W., Li, G. W., Han, J. J. (2020). Short-and medium-term electricity consumption prediction based on stochastic forest algorithm. Transactions of Electric Power Science and Technology, 35(2), 150–156. [Google Scholar]
22. Lu, K. F., Zhang, F., Zhang, S. W., Wang, Y. K. (2020). Fault arc identification method based on combination of BP neural network and current feature extraction. Electrical Automation, 42(3), 45–48. [Google Scholar]
23. Lou, J. Y., Ma, Q. (2015). An SVM-based method for arc fault detection. Journal of Hangzhou Dianzi University(Natural Sciences), 35(6), 28–31. [Google Scholar]
24. Li, Y. Y. (2022). KNN algorithm considering sample distribution and its application to wine quality prediction (Master Thesis). Shenyang University, Shenyang, China. [Google Scholar]
25. Lv, Q., Liu, C. Q., Jin, H. F. (2022). Power battery life prediction method based on SVM and decision tree. Electric Engineering, (20), 36–38. https://doi.org/10.19768/j.cnki.dgjs.2022.20.012.52+67 [Google Scholar] [CrossRef]
Cite This Article
 Copyright © 2023 The Author(s). Published by Tech Science Press.
This work is licensed under a Creative Commons Attribution 4.0 International License , which permits unrestricted use, distribution, and reproduction in any medium, provided the original work is properly cited.
 Downloads
 Citation Tools