
 Submit a Paper
 Propose a Special lssue
 Open Access
ARTICLE
Research on Transmission Line Tower Tilting and Foundation State Monitoring Technology Based on Multi-Sensor Cooperative Detection and Correction
1 College of Science and Technology (CST), Ningbo University, Ningbo, 315000, China
2 Dadong Power Supply Company, State Grid Liaoning Electric Power Co., Ltd., Dandong, 118000, China
3 Dalian Power Supply Company, State Grid Liaoning Electric Power Co., Ltd., Dalian, 116000, China
4 Yanbian Power Supply Company, State Grid Jilin Electric Power Co., Ltd., Yanji, 133000, China
5 Liaoyuan Power Supply Company, State Grid Jilin Electric Power Co., Ltd., Liaoyuan, 136200, China
* Corresponding Author: Minzhen Wang. Email:
Energy Engineering 2024, 121(1), 169-185. https://doi.org/10.32604/ee.2023.027907
Received 20 November 2022; Accepted 17 February 2023; Issue published 27 December 2023
 View Full Text
 Download PDF
Abstract
The transmission line tower will be affected by bad weather and artificial subsidence caused by the foundation and other factors in the power transmission. The tower’s tilt and severe deformation will cause the building to collapse. Many small changes caused the tower’s collapse, but the early staff often could not intuitively notice the changes in the tower’s state. In the current tower online monitoring system, terminal equipment often needs to replace batteries frequently due to premature exhaustion of power. According to the need for real-time measurement of power line tower, this research designed a real-time monitoring device monitoring the transmission tower attitude tilting and foundation state based on the inertial sensor, the acceleration of 3 axis inertial sensor and angular velocity raw data to pole average filtering pre-processing, and then through the complementary filtering algorithm for comprehensive calculation of tilt angle, the system meets the demand for inclined online monitoring of power line poles and towers regarding measurement accuracy, with low cost and power consumption. The optimization multi-sensor cooperative detection and correction measured tilt angle result relative accuracy can reach 1.03%, which has specific promotion and application value since the system has the advantages of unattended and efficient calculation.Keywords
Due to the limitation of installation conditions, transmission lines may be located in agricultural irrigation, landslide prone and other geological harsh areas. Once the inclined collapse is caused by the change of geological conditions or man-made external damage, and it cannot be detected and treated in time, it is easy to lead to power supply and even personal injury accidents and significant property losses [1,2]. At present, there are more studies on tower tilt and foundation state, especially on the reliability of single components such as transmission line structure, foundation and ground wire, while there are fewer studies on the structural reliability and optimal allocation of structural components such as the overall structure, foundation, wire and insulator of transmission line tower as a whole system [3]. According to the results of field investigation and analysis of transmission lines, the reliability of transmission line components, tower structure and the whole line structure system will directly affect the safe and stable operation of the power grid [4]. However, due to the limitation of structural design theory and design method, the existing research and measures on the overall reliability and disaster prevention control of transmission line system are not perfect.
To ensure the safe and reliable power supply of the power grid, it is a hot topic to study the reliability of the transmission tower structure system under certain constraints by using the optimal distribution method, to achieve the optimal matching of the reliability of the structure system. The optimal configuration of structural system reliability needs to consider various factors, namely constraint conditions, and carry out engineering design step by step from top to bottom from whole to part with scientific decision-making methods to finally determine the reliability of each subsystem, to ensure the reliability index of the whole system’s structural objectives [5,6]. Peng et al. [7] pointed out that the target reliability index of each subsystem component of the transmission tower can be reasonably determined by optimizing the distribution of the structural system reliability index, to ensure the reliability of each component in design, processing and operation. By understanding the reliability of each component, the reliability of the subsystem and the relationship between the reliability of each structure and the system, it can more comprehensively weigh the relationship between the functional requirements of the structural system, material consumption, cost and durability, get a more reasonable system design structure, improve the quality and level of the design technology of the structural system. Existing studies generally divide the reliability allocation methods of structural systems into two categories, namely the unconstrained allocation method and constrained allocation method [8–12]. The unconstrained distribution method is not affected by other constraints, which is quite different from the actual situation. In practical engineering, the distribution of structural system reliability is inevitably restricted under various conditions [13]. Mridha et al. [14] proposed a method for the dynamic monitoring of tower state, however, it lacks real-time analysis functions and is limited by the computing power of edge computing servers, making it difficult to effectively respond to emergencies. To address the issue of limited point cloud tower data, some researchers removed the tower base and used a vertical stratification method and a convex shell algorithm to determine the tower inclination [15], although this method focuses on 3D data presentation and does not respond in real time. Gao et al. [16] used an optical fiber sensing technology to monitor the stress deformation and tilting angle of the power tower, although the accuracy was not high. Hou et al. [17] proposed that the optimal allocation of structural system reliability is a global optimization problem, the core idea of which is to decompose and coordinate the constraint relations among tower components, but it remains in the theoretical simulation stage. Alotaibi et al. [18] determined the indexes of each subsystem according to experimental means and took the decomposition and coordination method as the leading idea to solve the optimization and distribution problem of reliability of the transmission line structural system. Aiming at the estimation of uncertain process and measurement noise covariance in nonlinear multi-sensor systems with statistical uncertainty of noise, Dong et al. [19] proposed an improved adaptive varied-DB Bayesian volume information fusion algorithm to jointly estimate the system state and uncertain noise covariance of nonlinear systems by using volume sampling method. In view of the limitation that the precision of multi-sensor joint detection is difficult to guarantee, Robertson et al. [20] proposed two efficient approximate formulas of multi-sensor label Dobernoulli (LMB) filter, both of which allow parallel calculation of sensor measurement updates. But these two filters have constant complexity in the number of sensors and linear complexity in the number of measurements and objects. This is an improvement on the iteratively corrected LMB (IC-LMB) filter, which has linear complexity in the number of sensors. When multiple sensors are used to track multiple variables, the filtering algorithm can effectively improve the detection accuracy.
In view of the limitations of the current analysis and research on tower stability, this paper combined with a 220 kV double-circuit project in Northeast China and took the detection index as the constraint condition to study the monitoring technology of line attitude and basic state, structure, function state and main system reliability, and proposed that in the global coordinated optimization of transmission line system design, system reliability should be reasonably distributed to tower structure, foundation, grounding, insulator and hardware subsystems to achieve the optimal matching of transmission line system reliability. Through the data processing and comprehensive analysis of multiple sensors, the experimental results are consistent with the expected trend. The results show that the multi-sensor system can effectively improve the monitoring accuracy and avoid the false alarm caused by the fault of a single sensor during the monitoring process of the attitude and foundation state of the transmission tower, and the tower state curve can be formed according to the historical data for the reference of the inspection personnel.
2 Establishment of the Tower Foundation and Tilt Angle Monitoring and Calculation Model
The tower foundation is designed to ensure the tower is firmly secured to the ground. The foundation should be designed using the appropriate materials to ensure it can provide the necessary support to the tower. The design should also consider the effects of vibration, weather, and seismic activity. The foundation should also be designed to allow for easy installation and maintenance. The foundation should also be designed to ensure that the tower can tilt to the desired angle and remain at that angle.
The tilt angle monitoring and calculation model is used to monitor and calculate the tilt angle of the tower. This model can be used to determine the tilt angle of the tower in real-time and detect any changes that occur in the tower’s attitude. The model can also be used to calculate the maximum tilt angle of the tower and the time it takes for the tower to reach its maximum tilt angle. The model can also be used to analyze the data from the tower’s sensors to detect any changes in the tower’s attitude. The tilt angle is based on an accelerometer, using the triangle function between gravity acceleration and the sub-axis vector component. When the gravitational acceleration coincides with the Earth’s gravitational field, there is a functional relationship between the gravity acceleration component and the tilt angle.
2.1 Inclination Angle Calculation of Tower
The attitude of the tower in space is represented by three tilt angles in 3D space, which can be obtained by calculating the data of the accelerometer and gyroscope output in the inertial sensor. Let X, Y, and Z be the three axes of the reference coordinate system, x, y, and z be the inertial sensors of the pole and tower, and the angles corresponding to X, Y, Z and x, y, z are, and, namely, the tilt angle of 3D space. The relationship is shown in Fig. 1.
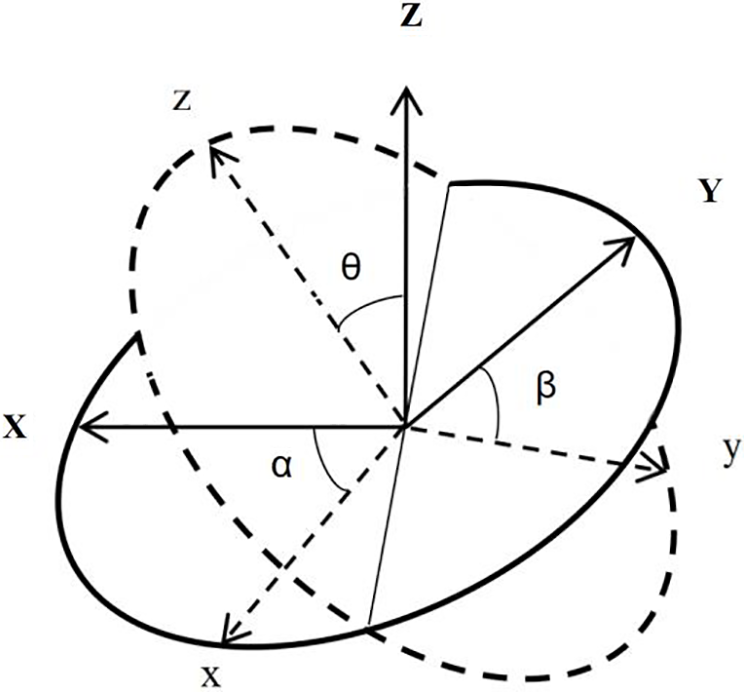
Figure 1: Space structure of inclination angle
In this study, the basic principle of measuring tower tilt Angle is to use the trigonometric function relation between gravity acceleration and the corresponding axis and obtain, according to the parallelogram rule. The calculation relation of the corresponding inclination Angle is shown in Eq. (1).
In the component of gravity acceleration in the three directions,
In the formula,
From the above principle, analysis can see using the tilt Angle sensor to monitor the tower tilt state and calculating the foundation settlement method are some deficiencies. So it is necessary to process the original data, filter or reduce the interference and principle error, and consider the credibility flexibly adjust the weight to get closer to the actual value of the data.
2.2 Error-Processing Algorithm
The data processing algorithm has wavelet analysis and a Kalman filter [21,22]. This kind of processing algorithm is complex. Kalman filter calculation is an iterative process, large calculation, occupy the calculation time is long, put forward certain requirements for the processor, not suitable for the embedded real-time system, especially in low power consumption, low-cost edge computing system.
The tower is not static. Due to external factors such as wind, the line will dance to drive the Angle of the tower. The pendulum effect brought by the line dancing and the operating frequency electromagnetic interference in the working environment, the corresponding mechanical and electromagnetic signal interference will be applied to the attitude and the circuit of the sensor manifested as the numerical periodic fluctuation in the original data output by the sensor. And because the tilt Angle needs to calculate the gyroscope data, the integral calculation is more sensitive to significant fluctuations. If not eliminated, the spike may cause the error and need a long time to eliminate, so the original data to extreme average filtering preprocessing to reduce or eliminate periodic and spike interference initially. The angular velocity measured by the gyroscope used in this paper is usually accompanied by low-frequency noise, and the accelerometers are often accompanied by high-frequency noise. This paper uses the high pass filter and the low pass filter and adds different weights to obtain the processed inclination. A complementary filter is simple to calculate and efficient, very suitable for low-performance processor work, with mathematical expressions such as in Eq. (3).
2.2.1 Error Measurement Principle Based on Coordinate Dystem Rotation
By establishing the reference coordinate system o0x0y0z0, the axis frame system o1x1y1z1, the axis frame system o2x2y2z2, and the electronic level base coordinate system o3x3y3z3, using the conversion relationship of the rotating coordinate system, the readings of the o3x3 direction and the o3x3 direction are:
When measured by a horizontal electronic instrument, the verticality
The synthesis error is:
2.2.2 Error Measurement Principle Based on Geometry
Using electronic horizontal to vertical axis tilt error, if the base of the electronic level and the shaft end horizontally strictly parallel, electronic level reading is the tilt error. Still, the electronic level base and the shaft end, the shaft end, and the horizontal plane have a certain angle. The angle is generally much larger than the inclination rotation error. The functional relationship between the measuring value and the rotation angle is used. The difference between the measurement and ideal values is the vertical axis inclination rotation error.
The measurement model is as follows: Xoy surface is the horizontal reference surface, and Xoy is the rotation axis surface. An object T is located in the axis plane, from the initial position X around the origin O radius
Available by geometric relationships:
Approximal by a small angle
Since
where a, b, and c are constants. In this model, θ represents the reading of the electronic level, and
2.3 Multi-Sensor Structure System Reliability Optimization Allocation Model
Assume that the normal operation reliability of the transmission line system is P0, and the reliability and direct influence of the ith subsystem are Pi and Ki respectively. Establish the functional relationship between the reliability P of the transmission line system and the reliability Pi of each subsystem, P = F (Pi), and the functional relationship between the reliability Pi of each subsystem and its influence coefficient Ki, Pi = g(Ki). Then, the reliability optimization allocation model of the transmission line system based on economic indicators can be expressed as Eqs. (12) and (13) [23]:
The objective function is the max P. Constraints are:
According to the above mathematical model of transmission line system reliability optimization allocation, two functional relations need to be established for optimal allocation of transmission line system reliability based on impact indicators: (1) The functional relationship between transmission line system reliability
Due to the lack of statistical data, it is difficult to establish a functional relationship between the reliability of the guide ground wire, hardware, and insulator subsystem and the respective cost. Therefore, when optimizing the reliability of the transmission line system, only the reliability of the transmission line tower structure and foundation is allocated. Therefore, the mathematical model of the reliability optimization distribution of the transmission line system can be simplified to Eqs. (14) and (15) [20]:
After testing, with a fully charged battery, the calculation response time of the running terminal was 1.4 s, while the upload data time was 0.7 s when the 4G signal strength was −95 dBm. The total calculation and data communication time was approximately 2 s.
3 Design Scheme and Implementation of the Monitoring System
The hardware design of the tower attitude monitoring device consists of several components. These components include a main board to house the necessary electronics, the power supply, the microcontroller, the communications interface, the GPS receiver the tilt sensor and pressure sensor. The main board is designed to contain the necessary electronics, such as the microcontroller, to monitor the tower’s attitude. The power supply is used to provide power to the device. The communications interface is used to connect the device to a network the GPS receiver is used to provide location data. The pressure sensor is used to measure the pressure of the tower’s environment. The layout of the device is designed to ensure the components are securely attached to the tower and are easily accessible for maintenance.
The real-time monitoring system comprises several tilt angle monitoring devices (node), tower base settlement monitoring devices, and an edge calculation host. The receiving host selects different configurations according to the communication mode of the system. The communication management machine of the wired communication station is directly used as the data receiving host and sent to the communication management machine. The system structure is shown in Fig. 2. The real-time attitude monitoring device of the tower is the key to the system. The installation installed on the tower of the device puts forward certain requirements on temperature, low power consumption, low volume, etc., so it is necessary to choose the components not lower than industrial level and with low power consumption characteristics. In order to reduce the volume and convenient arrangement of the tower tilt monitoring device, the 6-axis inertial sensor based on MEMS technology collects the acceleration and angular speed, which has the advantages of high integration, small volume, and low power consumption. The device takes the micro-controller as the core of data processing and control. After reading the inertial sensor data, it calculates the tilt angles of X, Y, and Z directions through data analysis and filtering. It then sends them to the communication management machine through the communication circuit. Data upload can be configured as one of LoRa and RS-485, selected according to engineering needs; the power supply is divided into wired direct supply and battery to meet the application requirements of different occasions.
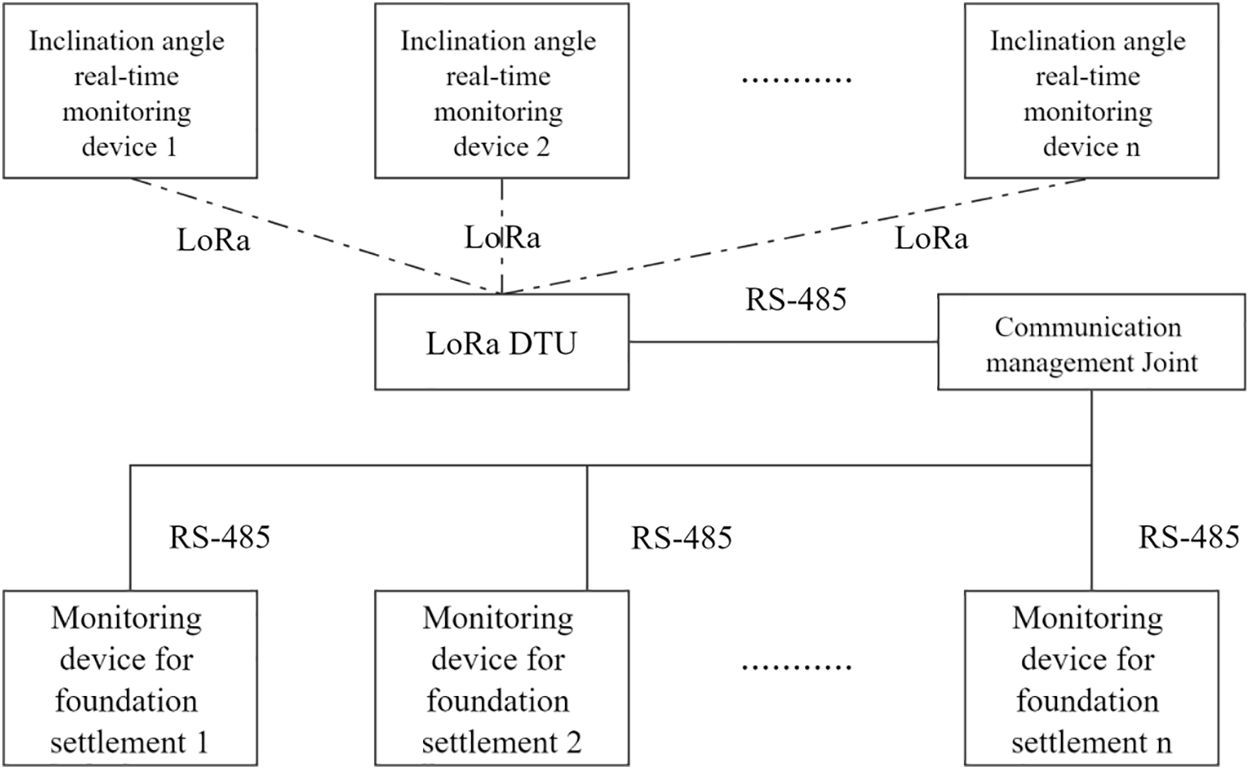
Figure 2: Schematic diagram of the system structure
3.1 Hardware Design and Layout of the Tower Attitude Monitoring Device
Because the tower is most prone to force tilt and vibration at the top of the tower and the waist at 2/3 from the ground, the tilt sensor is installed in a position prone to force tilt. The vibration sensor is installed at the vibration arm of the tower arm to reflect the tilt state of the tower from different positions and directions. Through the tilt, the vibration sensor detects the state of the transmission tower. It issues the alarm in time, which realizes the real-time online monitoring, early warning, and protection of the transmission tower tilt and vibration, effectively reducing the possibility of the tower dumping accident. The cloth point of the sensor rod tower is shown in Fig. 3a. A solid circle represents the position of the six inclination sensors fixed by the actual tower, and a hollow circle represents the position of the four foundation settlement sensors. The six inclination sensors are powered by solar panel + lithium battery storage mode. The data is transmitted through wireless LoRa, not affecting high-voltage lines’ standard transmission and distribution. To run the state of the reaction tower as accurately as possible, the sensor is installed at the tower arm as far as possible and is distributed symmetrically.
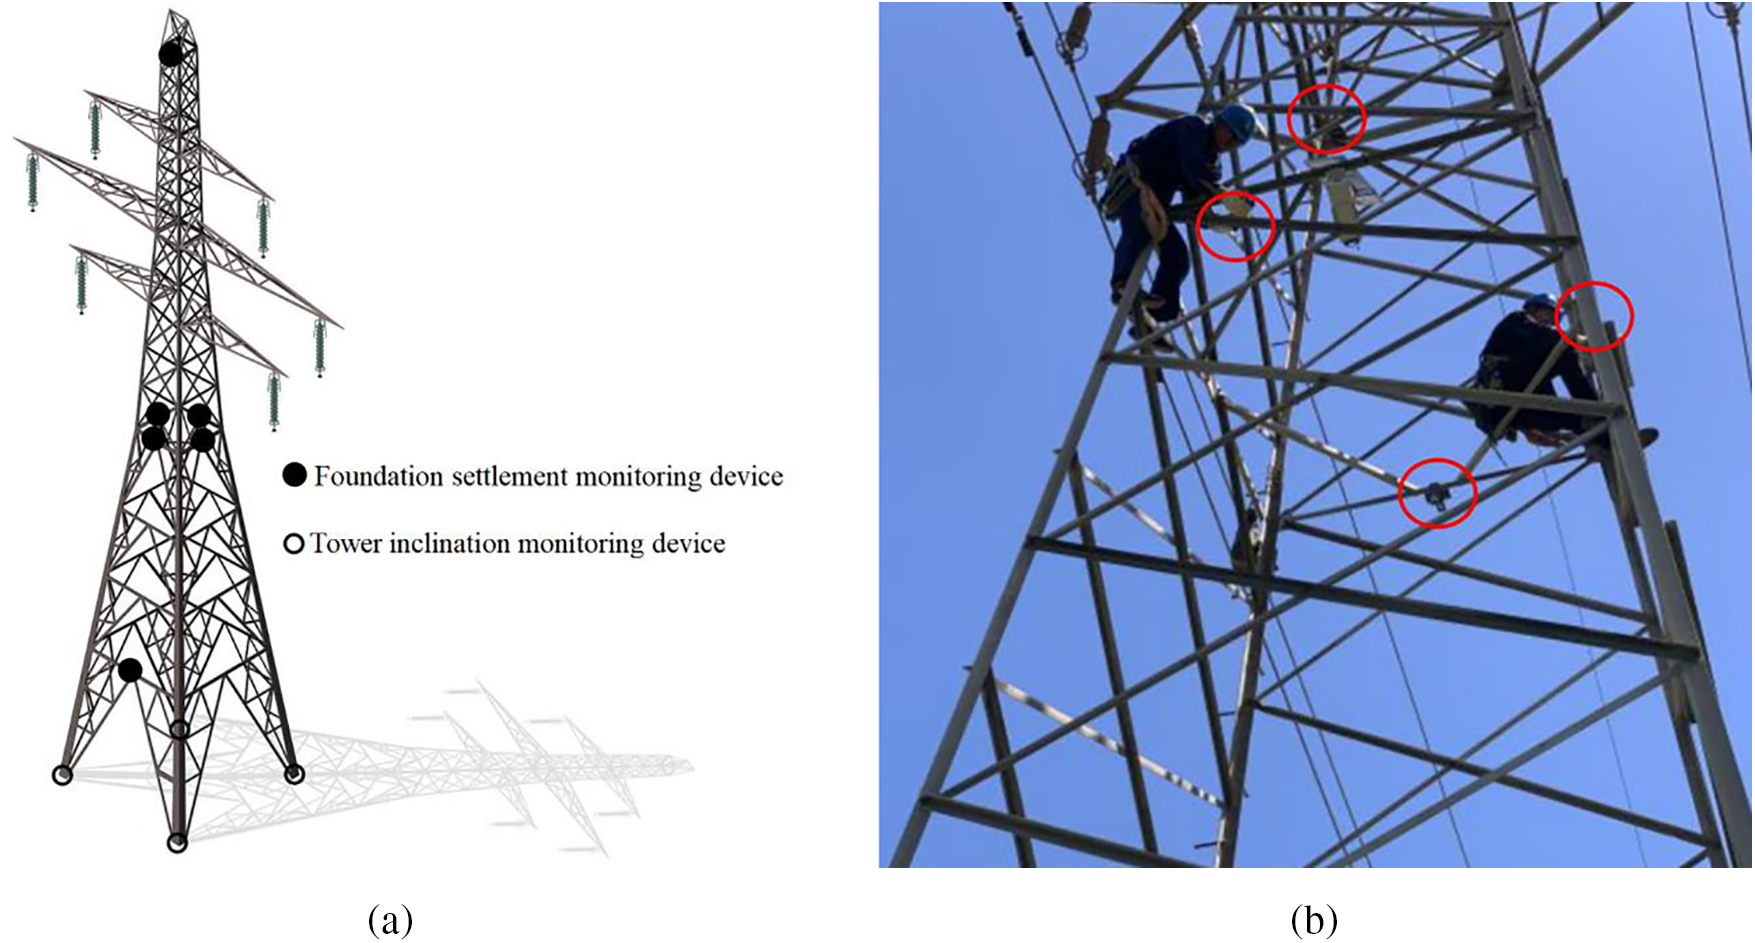
Figure 3: Transmission line tower tilting and foundation trend monitoring system ((a) Schematic diagram of sensors distribution, (b) Photos of monitoring device site installation)
When sensor battery power supply in northern China, the hardware design puts special requirements on low power consumption compared with wired power supply. To extend the battery life, low-power consumption devices should be selected as far as possible in the hardware design, and the low-power consumption strategy should be adopted in the software design to reduce the operating power consumption. The low-power microcontroller is selected as the control and data processing core of the tilt angle monitoring device. The microcontroller is connected with the 3-axis inertial sensor through the SPI interface to obtain acceleration and angular velocity and upload data via the RS-485 interface circuit or LoRa module. According to the working strategy, the power transformation and control part provides power supply to different functional circuits. The hardware design adopts the modular design method, and the welding-related components can be selected according to the system implementation to meet the different requirements.
The software is divided into inertial sensor data acquisition, inclination calculation, communication, and parameter configuration modules according to its functions. After the system is powered up, read the dial switch status first to determine the configuration mode and different operation modes. The software’s working mode adopts different working mechanisms in the battery power supply and the wired power supply, and the software process in the battery power supply mode is shown in Fig. 4.
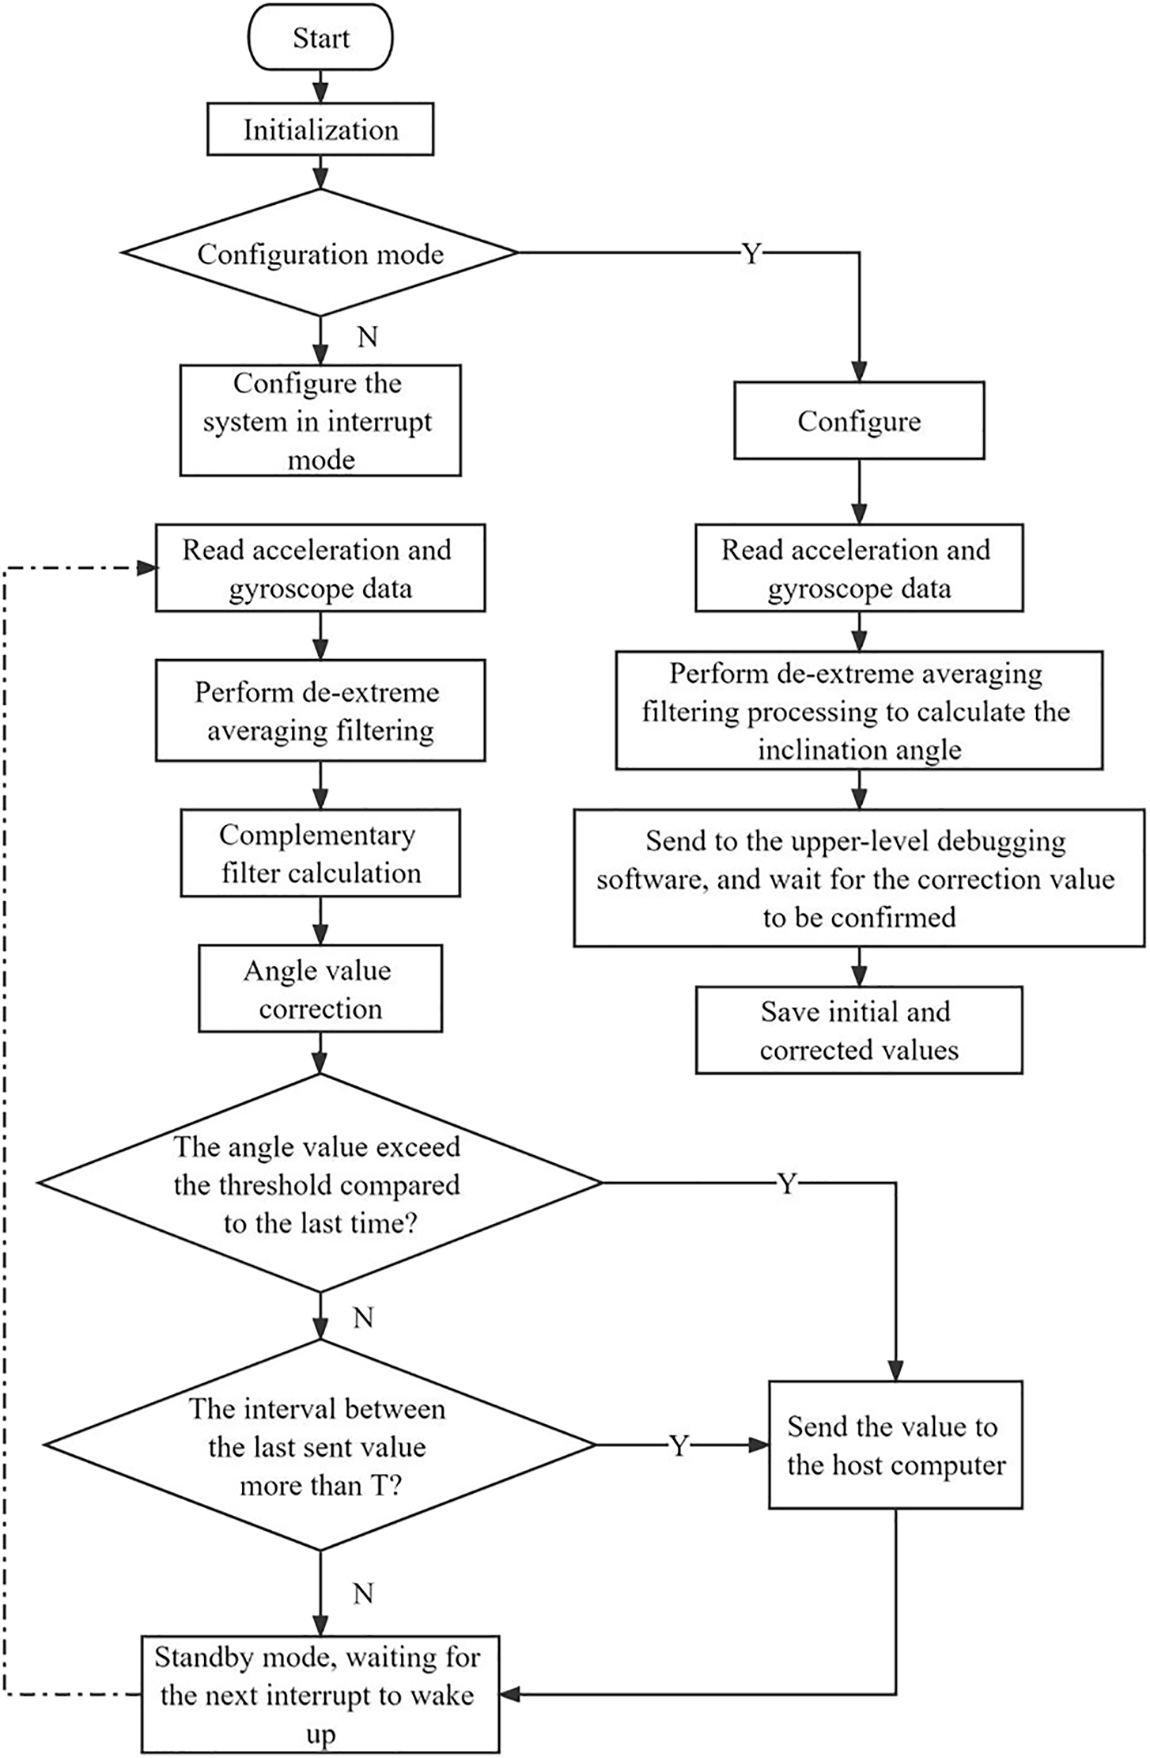
Figure 4: Software process in battery power supply mode
The main work of the configuration mode is to set the initial parameters according to the field installation. Consider tower tilt measurement device installation is convenient. The installation of the tower has a fait accompli. It may not require the tower itself to be in a fully vertical ideal state. Still, because the monitoring devices need to be fixed on the tower, it is impossible to do monitoring device shell and monitoring device of six-axis inertial sensors and tower in three directions coincide. Due to manufacturing, installation, and other reasons, there will inevitably be a deviation from the ideal coordinate system, so it is necessary to measure the initial deviation Angle caused by these reasons. The subsequent measurement is modified so that the subsequent online measurement can obtain a relatively accurate tilt Angle and the change of the relative installation. The Angle variation relative to installation focuses on online monitoring of tower tilt, which indicates the attitude variation range of the tower.
Configuration mode of the inertial sensor set in the first place set up the relevant register, read the acceleration and angular velocity data. Then the data is to extremum average filtering after calculating the initial value of tilt Angle in the X direction Angle ɑ. For example, set the initial value of, i is set to, i back to online monitoring, measured Angle is set to n. Then n−i is the actual change in inclination Angle and the inclination angle relative to the initial state. In addition, the inertial sensor and installation deviation, the initial value of i, and actual tower angle deviation may also exist in the project or requirement for high accuracy measurement of absolute angle. It can be in the construction site by the plumb line method, transit method such as artificial measure the actual Angle, measured Angle for
Complementary filtering is an ideal choice for applications with limited resources, as it is computationally efficient, robust to noise and outliers, and can be easily implemented in an embedded system. It is capable of effectively combining data from multiple sensors and providing accurate and reliable real-time information, making it suitable for a wide range of applications, from error tracking to fault detection and failure analysis.
The tilt angle measurement and base monitoring system are divided into data acquisition and processing. The data collection section uses a combined 3-axis accelerometer and a 3-axis gyroscope. The edge calculation module can eliminate the inter-axis coupling bias by measuring the tilt angle and angular velocity, respectively.
The results show that the tilt angle measurement and base monitoring system have a high accuracy in measuring the tilt angle and angular velocity. The tilt angle measurement system can measure the tilt angle with a maximum error of 0.5° and angular velocity with a maximum error of 0.3°/s. The base monitoring system can measure the tilt angle with a maximum error of 0.5° and angular velocity with a maximum error of 0.5°/s.
The tilt angle measurement and base monitoring system also have good stability, which can effectively reduce the errors caused by external interference. The system can work stably under different environmental conditions, such as temperature, humidity, and vibration. The system has also proven to be efficient in terms of energy consumption. The system can operate for more than 8 days on a single battery charge.
4.1 Pole and Tower Tilt Measurement
Each node of the system monitoring device according to the following method: the tower tilt monitoring device is fixed on the test tower, determine the vertical line, cross two-level determine the benchmark plane, test tower movement in the process of shaking, which can simulate the wind caused by tower slight shaking, and when the inclination is too large can think the tower has collapsed or damaged, then lost the significance of online measurement. The tilt test is conducted for 0–60° in the XZ plane, and a measurement point is selected every 5°. The data of the tilt angle output by different units are shown in Table 1.
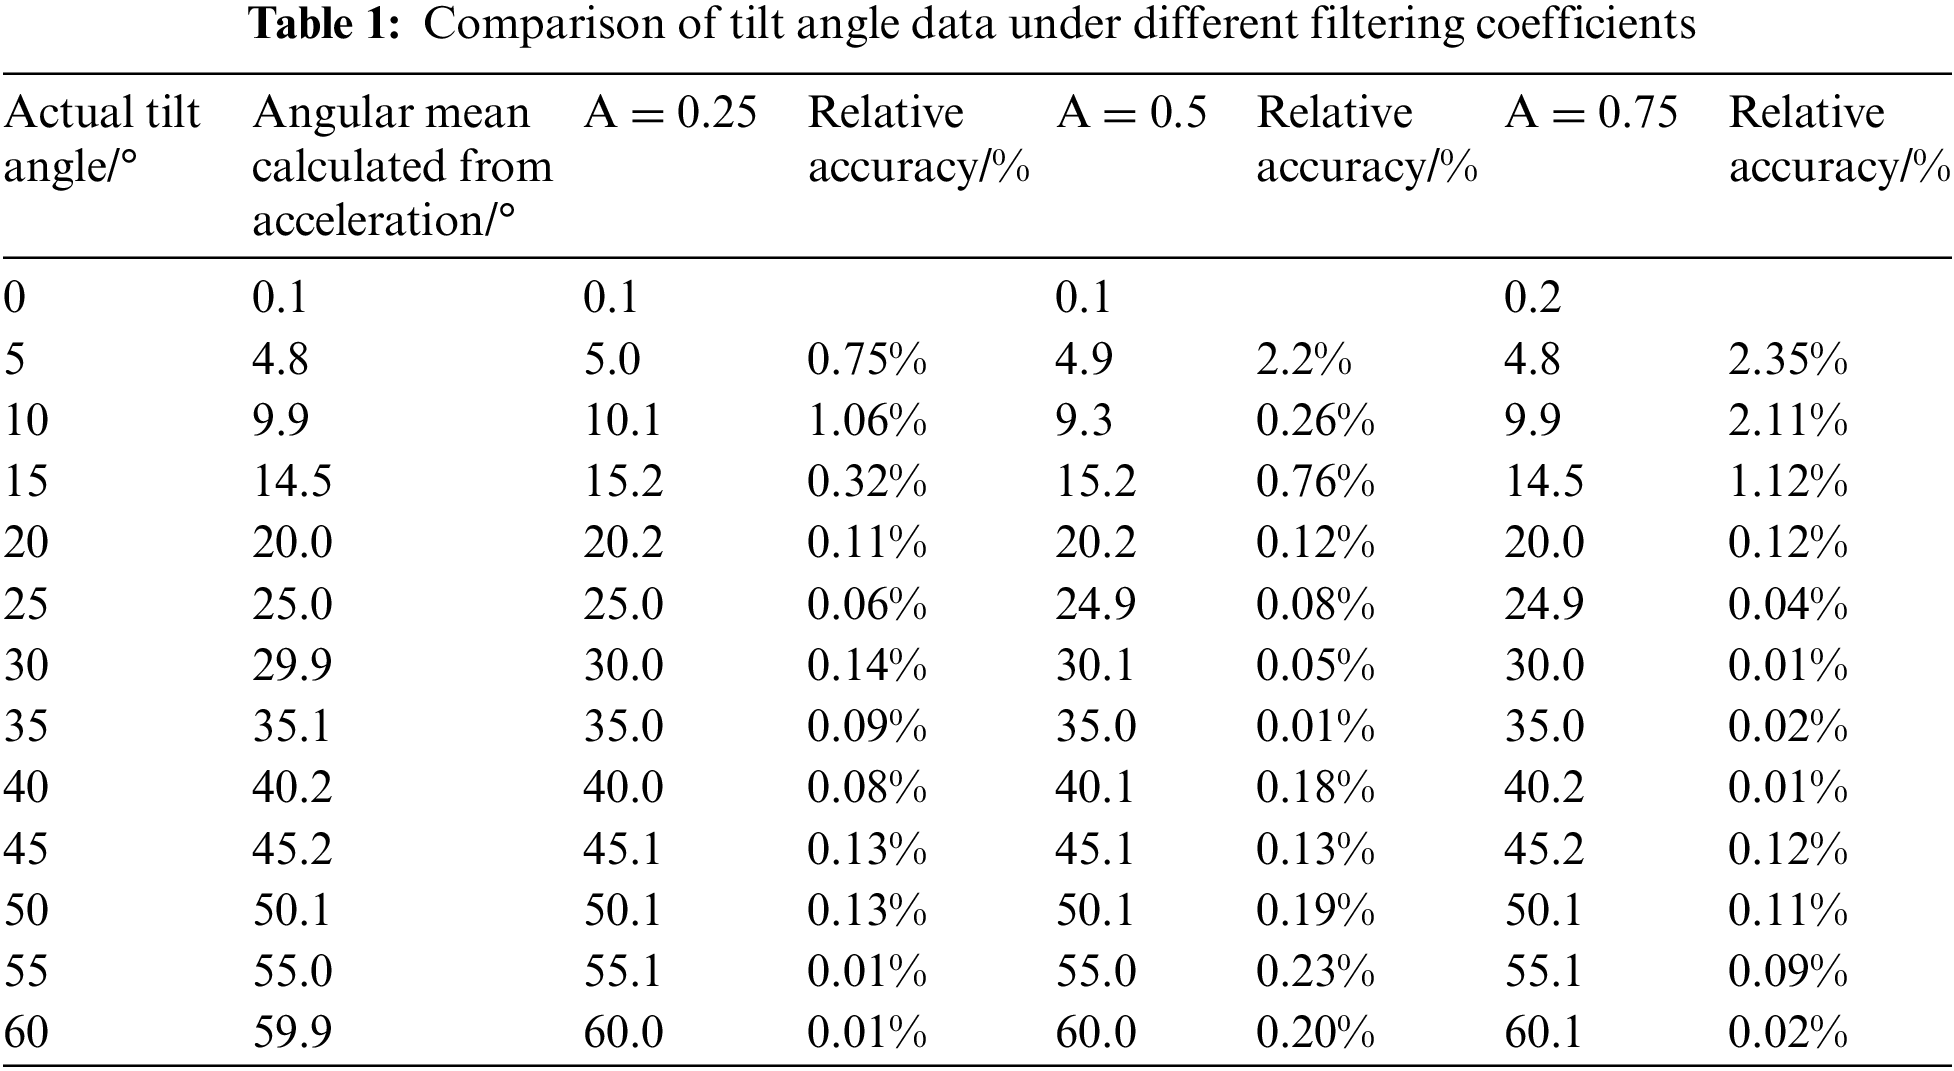
From Table 1, it is evident that the angle computed directly using the accelerometer exhibits significant errors. In contrast, angles derived through the complementary filtering method display reduced errors with varying coefficients. Notably, when assigning greater weight to the accelerometer’s inclination angle, the output angle from the complementary filter approximates the actual value more closely. This outcome aligns with the fact that the rod’s acceleration primarily comprises gravitational acceleration, which can be effectively mitigated through precise preprocessing. With a weight coefficient of A = 0.25, the measured data’s relative accuracy can be maintained within 1.40%. This level of accuracy satisfactorily meets the requirements for online monitoring of tower structures.
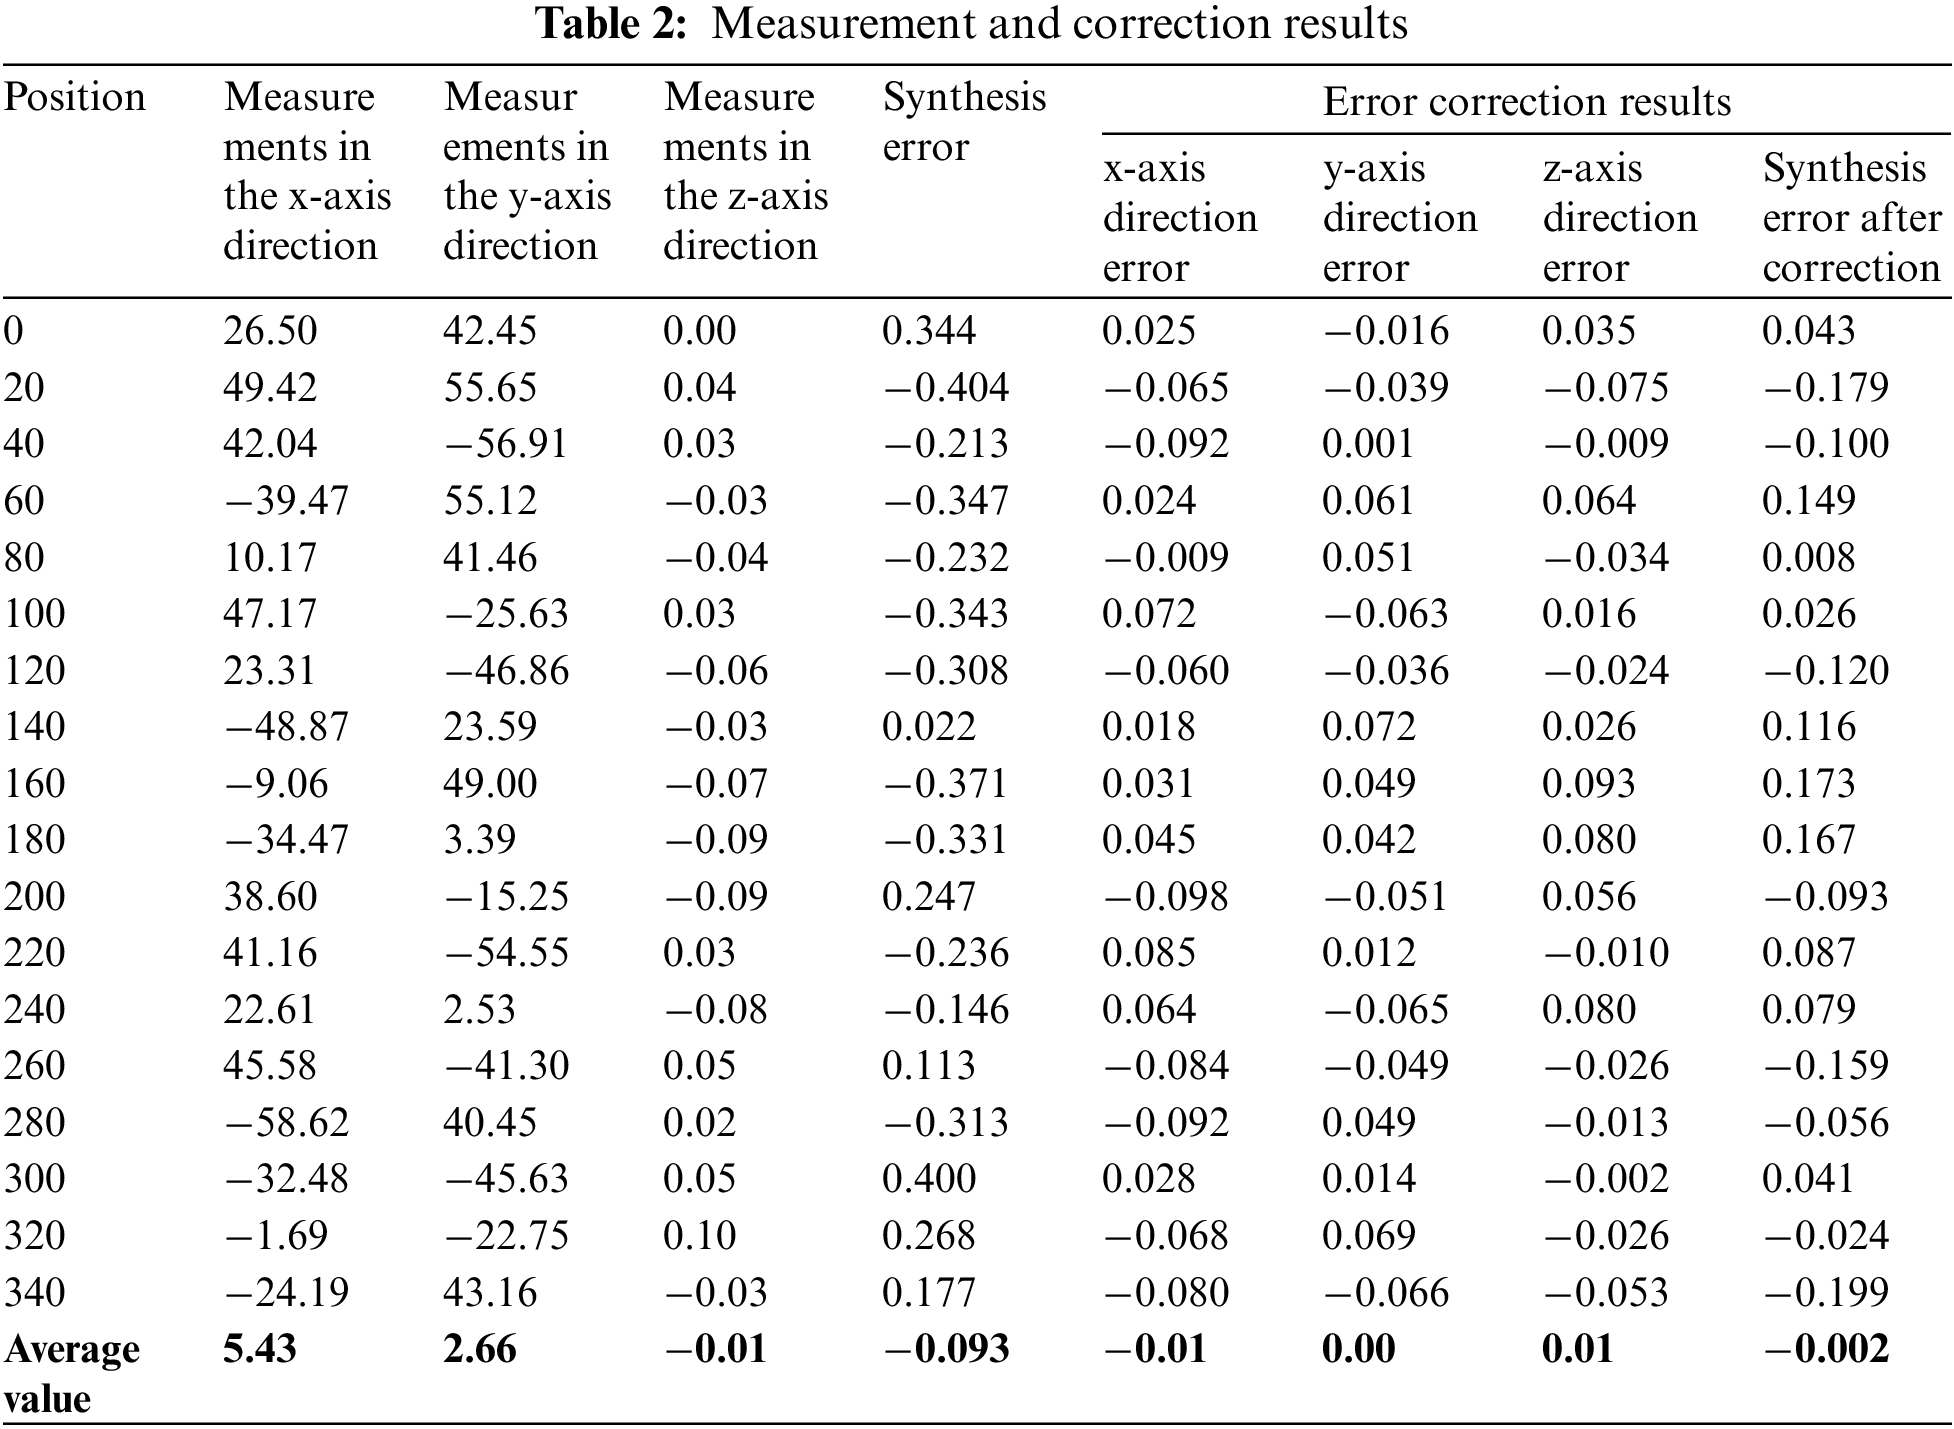
The tilt error of the rotating platform is 0.0068°, which is far lower than the precision requirement of 0.1°. The electronic level instrument used to measure the inclination perception end is a precision instrument for measuring the angular difference between two points on the same plane. It is composed of a level, a tripod, a bubble level, and a measuring head. The level has several leveling screws, which can be used to adjust the accuracy of the instrument. The measuring head can rotate 360°, and each angle is marked as a reference point. The bubble level is used to ensure that the instrument is always in a level state during measurement. The angle measured is the angle between the two reference points, and the accuracy of the angle measurement can reach 0.1°.
The measuring head is used to measure the angle between the reference point and the inclination perception end. The angle of the measured point is compared with the angle of the reference point. If the difference is greater than 0.1°, it means that the inclination perception end has an error. After the measurement is completed, the data is processed and analyzed statistically. The results of the error analysis are used to make corrections to the inclination perception end. Table 2 displays the measured and rectified outcomes.
4.2 Upper Pull Measurement of Tower Foundation Settlement
Horizontal bearing capacity calculation horizontal bearing capacity of a single pile. Due to the foundation applied to the transmission line needing to bear a large upper load, under the condition of meeting the upper load requirements, the design value of the horizontal bearing capacity of a single pile in the four foundations of the pole and tower can be calculated through the following Eqs. (16) and (17):
In the formula,
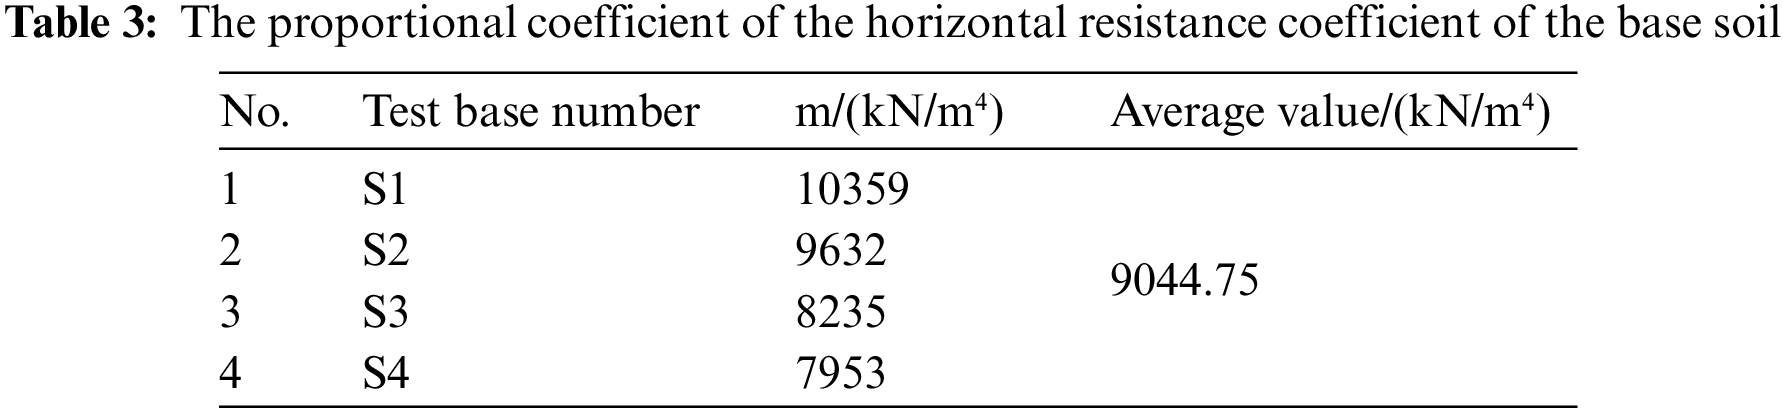
The water calm load test was conducted on 4 single piles in this test. The m value of the horizontal resistance coefficient of the base soil can be calculated through the horizontal test results through the following Eq. (18):
The horizontal force of H-acting on the top of the pile in the formula; Horizontal displacement of the horizontal force action point of
Although the cap was made in the single base test, the bottom of the cap was fragile, so the hinge constraint was calculated by the
The design value of horizontal bearing capacity of micropiles can be calculated from the base soil Eq. (17). Calculation of horizontal bearing capacity of group pile, the design value of micropile group pile can be calculated by the design value of a single pile and the effective coefficient of horizontal bearing capacity group pile, that is, Eq. (18). The load and displacement curves of single pillar tower 4 are shown in Fig. 5, and the load and displacement curves of each pillar pile are shown in Fig. 6.
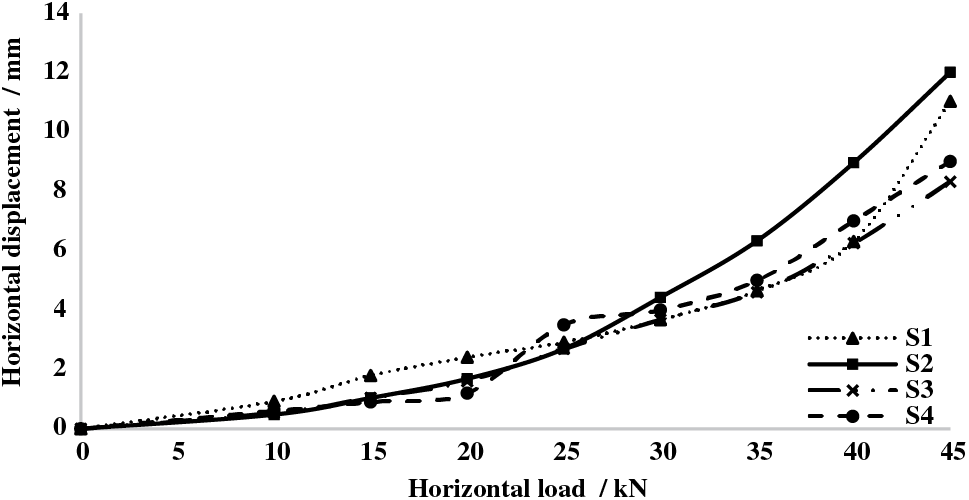
Figure 5: Horizontal load and displacement curve of single base tower 4
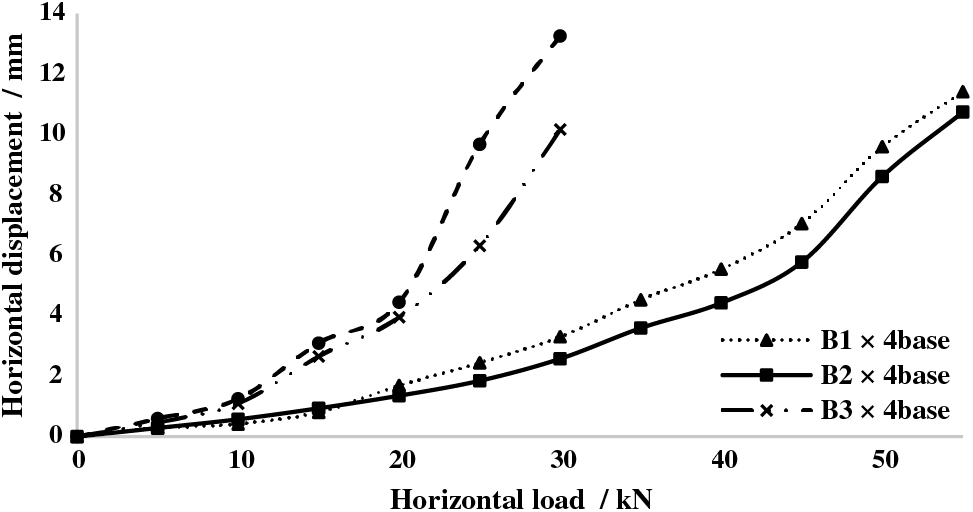
Figure 6: Horizontal load and displacement curve of each base tower pile under the joint action of multiple base towers
Four tower foundation placement sensors are designed to assess the strength and tilt of these towers. The settings of the four sensors can be calculated based on the force, load, bending moment, and soil bearing capacity of the designed tower. This design value can be used to determine the foundation structure of the iron tower, the foundation structure of the horizontal force, the safety factor of the iron tower, and the stability of the iron tower, it can be seen from Figs. 5 and 6 that the load-displacement curves of the piles of each foundation tower, when subject to the joint action of multiple foundation towers, are significantly more discrete than the load-displacement curves of the single foundation tower. This higher detection sensitivity makes it easier to determine the real tilt state of the tower from the results. The sensors at the foot of the four towers are also used to calculate wind loads, ice loads, earthquake loads, and other factors that may affect the tower, which is of great significance for the safe operation of transmission lines.
The paper introduces a power line tower tilt measurement system that comprises of acceleration and angular velocity sensors, a transmitting module, and a receiving module. The advantages of using average and complementary filters for power line tower tilt measurement was discussed, such as their capability to suppress high-frequency and low-frequency noise, respectively, resulting in a more accurate measurement with less power consumption. Field test data is provided to demonstrate the high accuracy of the measurement system. The optimization of multi-sensor cooperative detection and correction measured tilt angle yield a relative accuracy of 1.03%, making the system suitable for unattended and efficient calculation. After testing, with a fully charged battery, the calculation response time of the running terminal was 1.4 s, and the upload data time was 0.7 s when the 4G signal strength was −85 dBm. The total calculation and data communication time was approximately 2 s. The results demonstrate that better measurement accuracy can be achieved by adjusting the parameters.
Acknowledgement: This research was made possible benefited from a grant from the National Natural Science Foundation of China and Shanxi Scholarship Council of China.
Funding Statement: This work was supported by the National Natural Science Foundation of China (Nos. 62172242, 51901152), Industry University Cooperation Education Program of the Ministry of Education (No. 2020021680113) and Shanxi Scholarship Council of China.
Author Contributions: The authors confirm contribution to the paper as follows: study conception and design: Guangxin Zhang; data collection: Minghui Liu; analysis and interpretation of results: Shichao Cheng, Minzhen Wang; draft manuscript preparation: Changshun Zhao, Hongdan Zhao, Gaiming Zhong. All authors reviewed the results and approved the final version of the manuscript.
Availability of Data and Materials: The datasets used and/or analysed during the current study are available from the corresponding author on reasonable request.
Conflicts of Interest: The authors declare that they have no conflicts of interest to report regarding the present study.
References
1. Guo, L., Xie, Y., Yu, Q., You, Y., Wang, X. et al. (2016). Displacements of tower foundations in permafrost regions along the Qinghai–Tibet Power Transmission Line. Cold Regions Science and Technology, 121, 187–195. [Google Scholar]
2. Duan, X., Naterer, G. F. (2009). Heat conduction with seasonal freezing and thawing in an active layer near a tower foundation. International Journal of Heat and Mass Transfer, 52(7–8), 2068–2078. [Google Scholar]
3. Abd-Elaal, E. S., Mills, J. E., Ma, X. (2018). A review of transmission line systems under downburst wind loads. Journal of Wind Engineering and Industrial Aerodynamics, 179, 503–513. [Google Scholar]
4. Cao, S., Fan, Q., Yu, W. J., Wang, L. T., Ni, S. et al. (2022). Multi-sensor fusion and data analysis for operating conditions of low power transmission lines. Measurement, 190, 110586. [Google Scholar]
5. Li, C., Chen, X., Li, Z., Zhang, Y., Yue, K. et al. (2022). Comprehensive evaluation method of transmission line operating status based on improved combination weighting evaluation model. Energy Reports, 8, 387–397. [Google Scholar]
6. Ahmed, M. F., Mohanta, J. C., Sanyal, A., Yadav, P. S. (2023). Path planning of unmanned aerial systems for visual inspection of power transmission lines and towers. IETE Journal of Research, 1995, 1–21. [Google Scholar]
7. Peng, Y., Ma, Y., Huang, T., de Domenico, D. (2021). Reliability-based design optimization of adaptive sliding base isolation system for improving seismic performance of structures. Reliability Engineering & System Safety, 205, 107167. [Google Scholar]
8. Pelz, P. F., Leise, P., Meck, M. (2021). Sustainable aircraft design—A review on optimization methods for electric propulsion with derived optimal number of propulsors. Progress in Aerospace Sciences, 123, 100714. [Google Scholar]
9. El Hamshary, O., Abouhamad, M., Marzouk, M. (2022). Integrated maintenance planning approach to optimize budget allocation for subway operating systems. Tunnelling and Underground Space Technology, 121, 104322. [Google Scholar]
10. Liu, W., Zhu, J. (2021). A multistage decision-making method for multi-source information with Shapley optimization based on normal cloud models. Applied Soft Computing, 111, 107716. [Google Scholar]
11. Ahmed, M. F., Mohanta, J. C., Sanyal, A. (2022). Inspection and identification of transmission line insulator breakdown based on deep learning using aerial images. Electric Power Systems Research, 211, 108199. [Google Scholar]
12. Ahmed, M. F., Mohanta, J. C., Zafar, M. N. (2022). Development of smart quadcopter for autonomous overhead power transmission line inspections. Materials Today: Proceedings, 51, 261–268. [Google Scholar]
13. Premkumar, M., Jangir, P., Sowmya, R. (2021). MOGBO: A new multiobjective gradient-based optimizer for real-world structural optimization problems. Knowledge-Based Systems, 218, 106856. [Google Scholar]
14. Mridha, S., Maity, D. (2014). Experimental investigation on nonlinear dynamic response of concrete gravity dam-reservoir system. Engineering Structures, 80, 289–297. [Google Scholar]
15. Popoli, A., Sandrolini, L., Cristofolini, A. (2020). Inductive coupling on metallic pipelines: Effects of a nonuniform soil resistivity along a pipeline-power line corridor. Electric Power Systems Research, 189, 106621. [Google Scholar]
16. Gao, M., Zhao, Z. G., Li, Y. N. (2018). Monitoring and research on tilt of transmission line tower based on optical fiber sensing. Journal of Electronic Measurement and Instrumentation, 32(12), 51–59. [Google Scholar]
17. Hou, T., Fang, R., Yang, D., Zhang, W., Tang, J. (2022). Energy storage system optimization based on a multi-time scale decomposition-coordination algorithm for wind-ESS systems. Sustainable Energy Technologies and Assessments, 49, 101645. [Google Scholar]
18. Alotaibi, M. A., Salama, M. M. A. (2016). An efficient probabilistic-chronological matching modeling for DG planning and reliability assessment in power distribution systems. Renewable Energy, 99(3), 158–169. [Google Scholar]
19. Dong, X., Chisci, L., Cai, Y. (2021). An adaptive variational Bayesian filter for nonlinear multi-sensor systems with unknown noise statistics. Signal Processing, 179, 107837. [Google Scholar]
20. Robertson, S. C. J., van Daalen, C. E., du Preez, J. A. (2021). Efficient approximations of the multi-sensor labelled multi-Bernoulli filter. arXiv preprint arXiv:2103.10396. [Google Scholar]
21. Aly, H. H. (2022). A hybrid optimized model of adaptive neuro-fuzzy inference system, recurrent Kalman filter and neuro-wavelet for wind power forecasting driven by DFIG. Energy, 239, 122367. [Google Scholar]
22. Aly, H. H. (2020). Intelligent optimized deep learning hybrid models of neuro wavelet, fourier series and recurrent kalman filter for tidal currents constitutions forecasting. Ocean Engineering, 218, 108254. [Google Scholar]
23. Mazloomi, N., Gholipour, M., Zaretalab, A. (2022). Efficient configuration for multi-objective QoS optimization in wireless sensor network. Ad Hoc Networks, 125, 102730. [Google Scholar]
Cite This Article
 Copyright © 2024 The Author(s). Published by Tech Science Press.
This work is licensed under a Creative Commons Attribution 4.0 International License , which permits unrestricted use, distribution, and reproduction in any medium, provided the original work is properly cited.
 Downloads
 Citation Tools