
 Submit a Paper
 Propose a Special lssue
 Open Access
ARTICLE
Spatial and Temporal Distribution Characteristics of Solar Energy Resources in Tibet
1 Public Meteorological Service Center, China Meteorological Administration, Beijing, 100081, China
2 Center for Wind and Solar Energy Resources, China Meteorological Administration, Beijing, 100081, China
3 School of Applied Meteorology, Nanjing University of Information Science & Technology, Nanjing, 210044, China
4 School of Geographical Sciences, Nanjing University of Information Science & Technology, Nanjing, 210044, China
* Corresponding Author: Wenzheng Yu. Email:
Energy Engineering 2024, 121(1), 43-57. https://doi.org/10.32604/ee.2023.041921
Received 11 May 2023; Accepted 31 August 2023; Issue published 27 December 2023
 View Full Text
 Download PDF
Abstract
The Tibet Plateau is one of the regions with the richest solar energy resources in the world. In the process of achieving carbon neutrality in China, the development and utilization of solar energy resources in the region will play an important role. In this study, the gridded solar resource data with 1 km resolution in Tibet were obtained by spatial correction and downscaling of SMARTS model. On this basis, the spatial and temporal distribution characteristics of solar energy resources in the region in the past 30 years (1991–2020) are finely evaluated, and the annual global horizontal radiation resource is calculated. The results show that: 1) The average annual global horizontal radiation amount in Tibet is 1816 kWh/m2. More than 60% of the area belongs to the “Most abundant” ( ≥ 1750 kWh/m2) area of China’s solar energy resources category A, and nearly 40% belongs to the “Quite abundant” (1400 ≤ GHI < 1750) area of China’s solar energy resource category B. 2) In space, the solar energy resources in Tibet increased gradually from north to south and from east to west. Lhasa, Central and Eastern Shigatse, Shannan, and Southwestern Ali are the most abundant cities, with a maximum annual radiation level of 2189 kWh/m2. 3) In terms of time, the total horizontal radiation in Tibet was the highest in May and the lowest in December. 74% of the total area belongs to the “Very stable” ( ≥ 0.47) area of solar resource stability category A, and 26 % belongs to the “stable” (0.36 ≤ < 0.47) area of solar resource stability category B. Solar energy resources in the region show the characteristics of both strong and stable. Average solar energy resources in the region have shown a fluctuating downward trend over the past 30 years, with an average decline of about 12.86 (kWh/m2) per decade. 4) In terms of solar radiation resources reaching the earth’s surface, the theoretical total amount of annual horizontal radiation in Tibet is about 240.07 billion tons of standard coal or 222.91 billion kilowatts on average.Keywords
Tibet is located in the southwest Qinghai-Tibet Plateau. It is located between 26°50′–36°53′N and 78°25′–99°06′E [1]. With an average altitude of more than 4000 m, it is known as the “Roof of the World”. As one of the regions with the richest water, solar, and geothermal energy in China, the power supply of Tibet is dominated by clean energy such as hydropower, photovoltaic, and geothermal energy [2]. Among these clean energy sources, solar is the main contributor to the increase in the share of renewable [3]. The energy on the earth’s surface mainly comes from the sun. Solar energy has become an indispensable part of global power generation structure optimization and energy structure reform. China is rich in solar energy resources and the utilization of resources is developing rapidly [4]. By the end of 2020, the total installed capacity of power in the region is more than 4 million kW, and the proportion of clean energy is nearly 90% [5]. Among them, the installed capacity of photovoltaic power generation is about 137 million kW, accounting for more than 1/3 of the total installed capacity of power [6]. It is one of the provinces with the highest installed capacity of photovoltaic power generation, after Qinghai Province (about 39%). According to the recommendations of the government of Tibet on the formulation of the “14th Five-Year Plan” for national economic and social development and the vision of the year 2035, it will accelerate the large-scale development of clean energy during the “14th Five-Year Plan” [3]. To form a clean energy, oil and gas, and other new energy complementary integrated energy system. The national demonstration area of clean and renewable energy utilization will be built in 2025. Hydropower built and under construction capacity will exceed 15 million kW, and photovoltaic power installed capacity will exceed 10 million kW. “Photovoltaic + energy storage” research and pilot projects will also be accelerated. “Water, wind and solar complementary” will be vigorously promoted.
Clean energy development, utilization, and electrification will be promoted at the forefront of the country [7–9]. Solar energy is considered a renewable resource that plays an important role in reducing greenhouse gas emissions and preventing climate change, which is essential for protecting humans, animals and ecosystems [10]. Since the 1980s, many foreign scholars have studied the variation trend of global surface solar radiation by using global site data [11]. Then the long-term changes of solar radiation at the surface were studied around the world [12–14]. Fu et al. [15] conducted a pioneering study on solar radiation. Subsequently, several scholars have studied solar radiation distribution from the perspective of China as a whole [16–20]. To realize the sustainable development of photovoltaic ecology and economy, it is very important to evaluate the photovoltaic potential worldwide. Zhou et al. [21] evaluated the temporal and spatial characteristics of solar radiation resources in Northwest China based on the data from a large number of measuring stations in Northwest China. However, due to the sparse distribution of solar observation sites, solar radiation data from measuring stations are incomplete and not always accurate. Huang et al. [22] adopted different GHI (Global Horizontal Irradiance) values and slope ranges as exclusion criteria to calculate the corresponding national power generation potential and obtain the PV suitability diagram. Liao et al. [23] described the location of photovoltaic power generation, analyzed the temporal and spatial characteristics, and measured the carbon emission reduction potential of installed photovoltaic power generation in China by province. However, a detailed description of the spatial and temporal distribution characteristics of solar energy resources in Tibet and an estimation of the development potential of solar energy resources in the region based on this still needs to be discovered in existing research.
This study finely evaluates the solar energy resources in Tibet. Distribution map [24] and development potential of solar energy resource parameters in time and space are given. This study is to provide basic support for the large-scale development and utilization of solar resources in the region.
The measured data of meteorological stations in this study are from the National Meteorological Information Center, and the elements include sunshine hours and sunshine percentage for solar energy resources calculation. All meteorological factors are between 1991 and 2020. The spatial distribution of meteorological stations in Tibet is shown in Fig. 1.
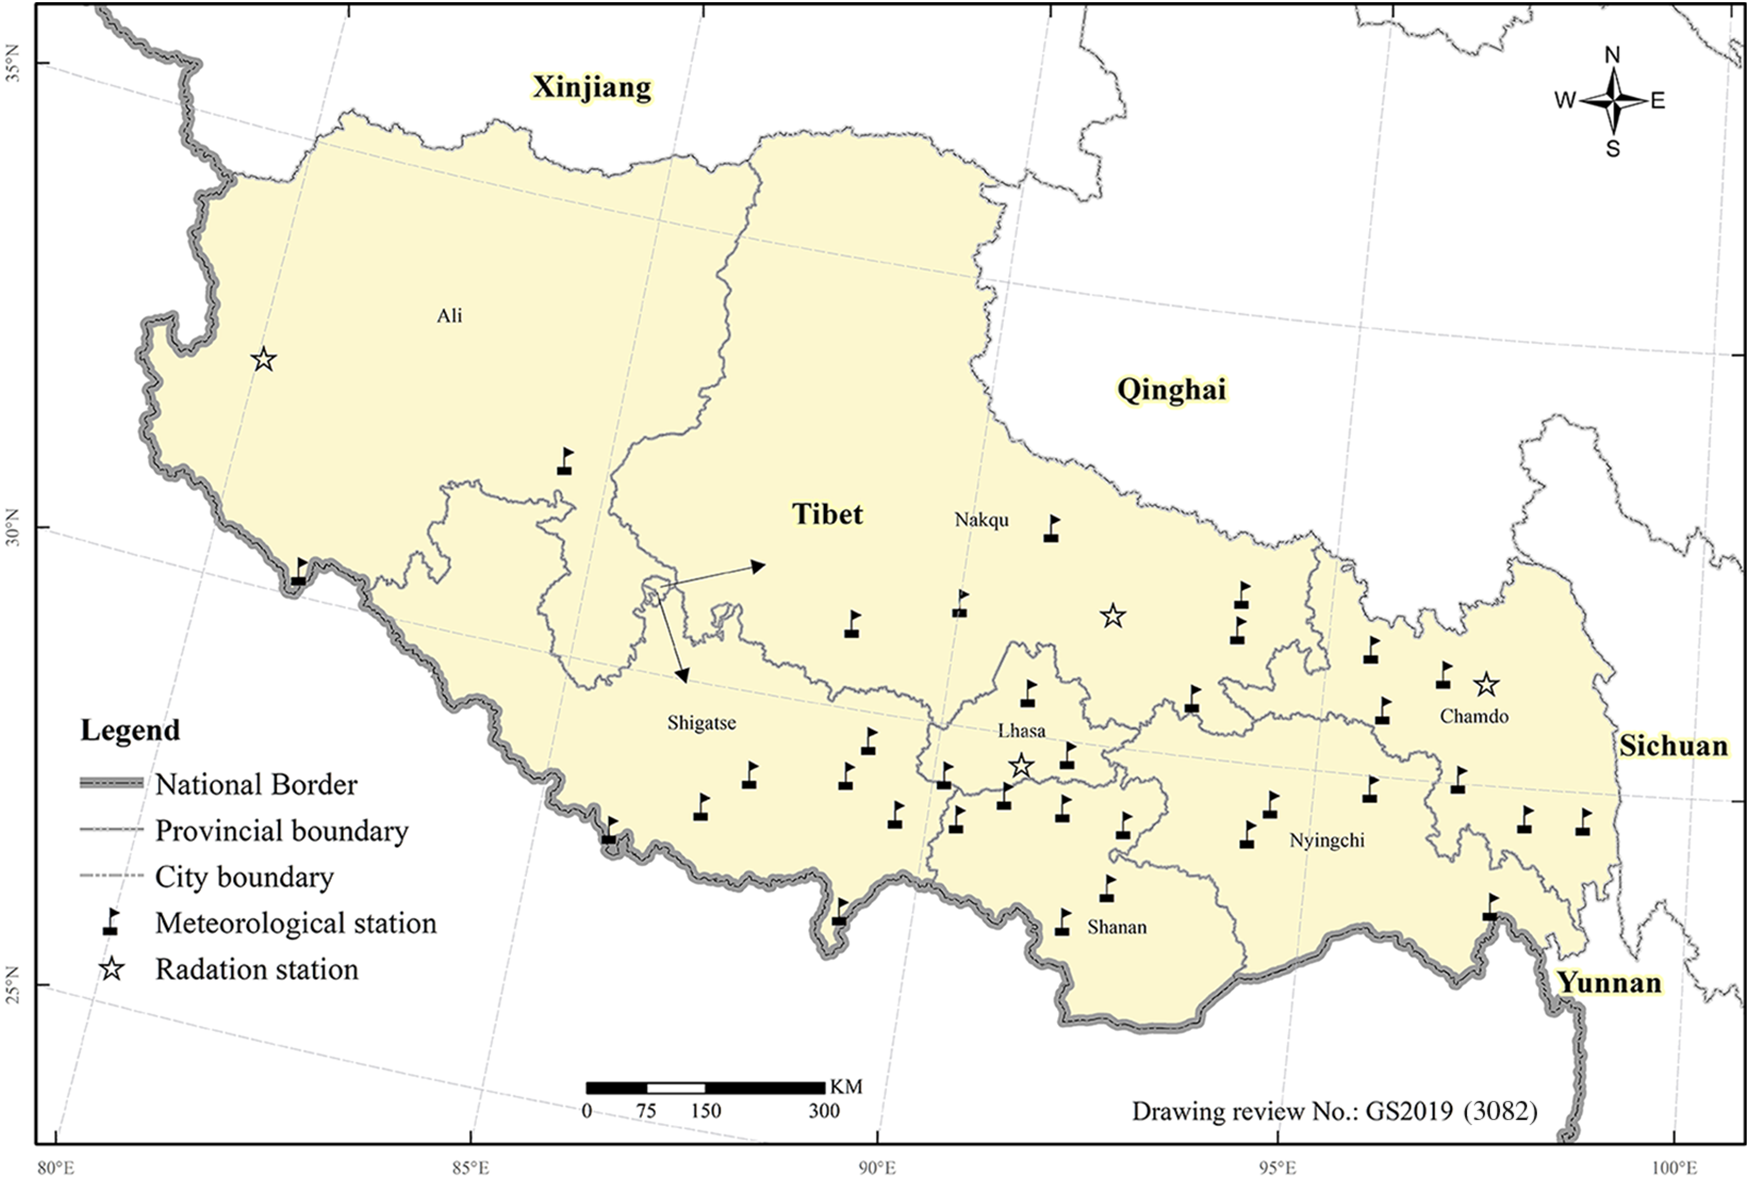
Figure 1: Spatial distribution of national meteorological stations in Tibet
Solar energy resources in this study refer to horizontal solar energy resources. Horizontal solar energy resource parameters include sunshine hours, sunshine percentage, global horizontal radiation, direct horizontal radiation, and horizontal scattering radiation. The sunshine hours and percentage are drawn based on the measured data of national meteorological stations in Tibet. The global horizontal radiation, direct horizontal radiation, and horizontal scattering radiation are calculated to obtain 1 km × 1 km resolution data. The calculation flowchart is shown in Fig. 2.
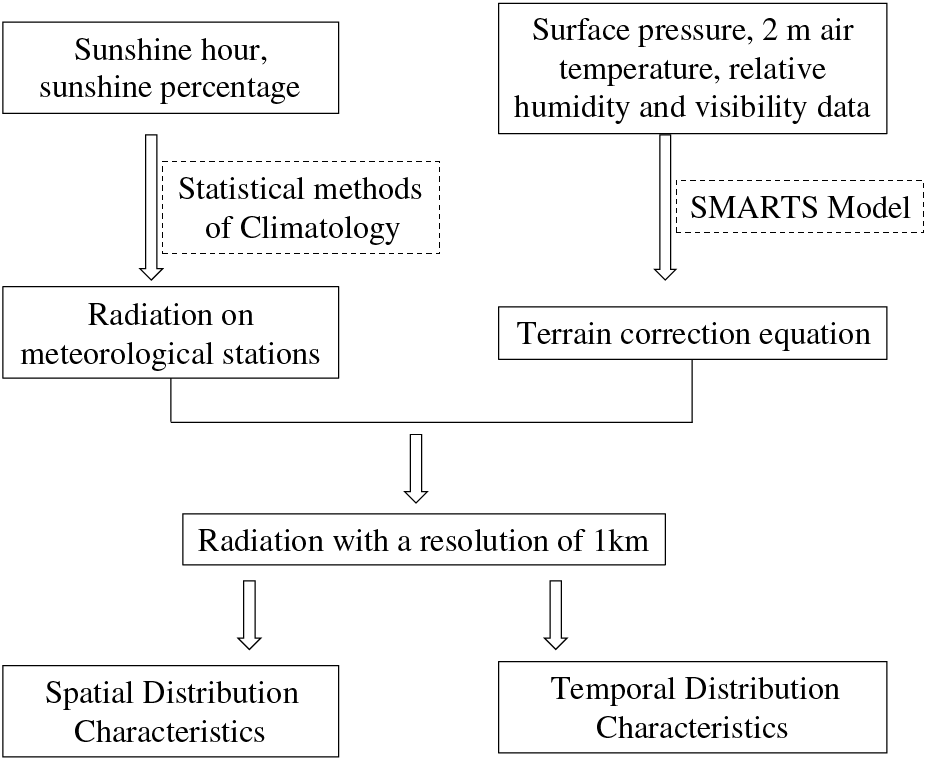
Figure 2: The calculation flowchart
According to the national standard solar energy resource assessment method (GB/T 37526-2019) [25], the global horizontal radiation, direct horizontal radiation and horizontal scattering radiation are calculated based on the climatic statistical method.
The calculation equation used in this study is as follows:
In the formula,
On this basis, the spectral radiative transfer model SMARTS (Simple Model for Atmospheric Transmission of Sunshine) of the National Renewable Energy Laboratory is used to revise and downscale the calculation results in space, and the gridded solar resource data with 1 km resolution are obtained [26]. The SMARTS model has many advantages on various influencing factors of solar radiation, such as a variety of options, the spectral range can be set, the slope calculation function, and the diversity of output parameters. At present, this model has been widely used in sunny solar radiation calculation in China [27]. In this work, the spectral range is set to 280–4000 nm, the entire layer of water vapor content is calculated from the water vapor pressure and pressure observed by the meteorological station, the atmospheric turbidity is reflected by the visibility observed by the meteorological station, and the atmospheric ozone content is obtained from the NASA website. Model input data mainly include station latitude and longitude, altitude, hourly surface pressure, 2 m air temperature, relative humidity and visibility data. Through the analysis of the simulated monthly global horizontal radiation and altitude, it is found that both have logarithmic changes in each month. The formula is as follows:
In the formula,
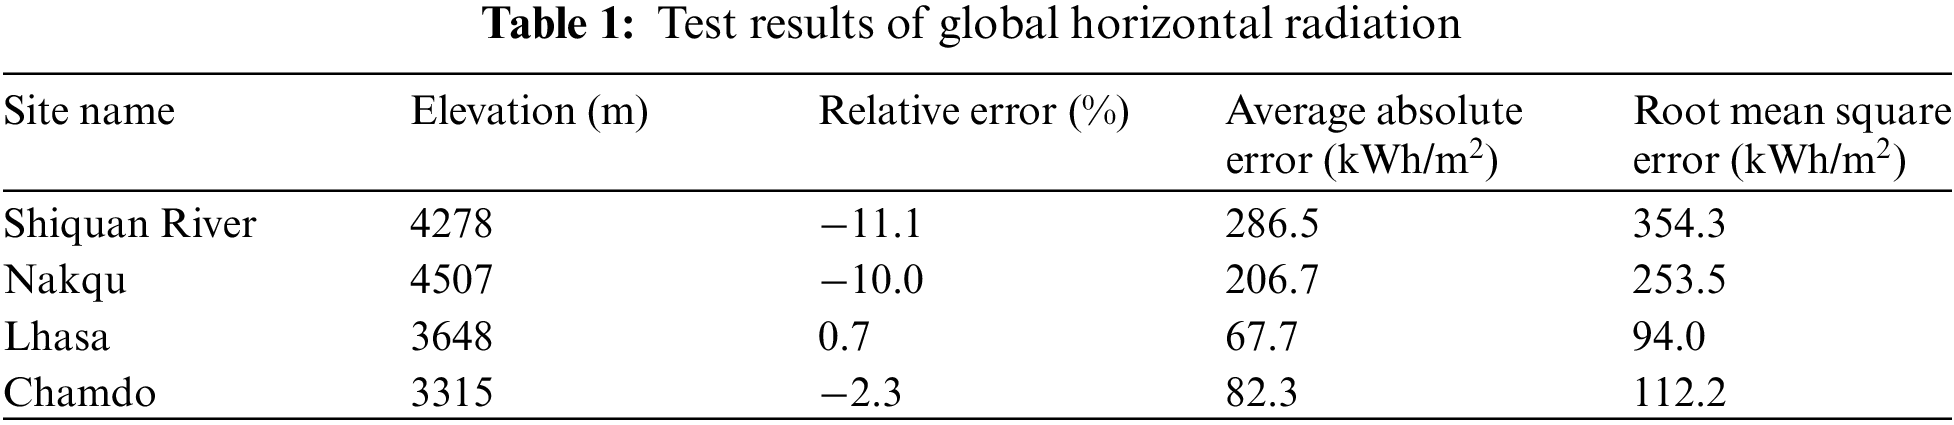
Using the measured data of four national radiation observation stations in Tibet, the calculated and revised annual global radiation levels are tested. Using the method of cross validation, one station is vacated each time, and the actual measurement data is not involved in the calculation. Based on Eqs. (1)–(4), the calculated value of the station is obtained, and then the error calculation is performed on the calculated value using the actual measurement data of the station. The results are shown in Table 1. It can be seen that the calculation results of Shiquan River and Nakqu sites with high altitudes are relatively low. However, the calculation results of two sites with low altitudes in Lhasa and Chamdo have high accuracy.
The annual irradiation amount of all grid points in the evaluation area is added. Multiply the result to the grid point area. The annual theoretical total amount of solar energy resources (
In the formula,
4 Fine Evaluation of Solar Energy Resources
4.1 Annual Global Horizontal Radiation Grade
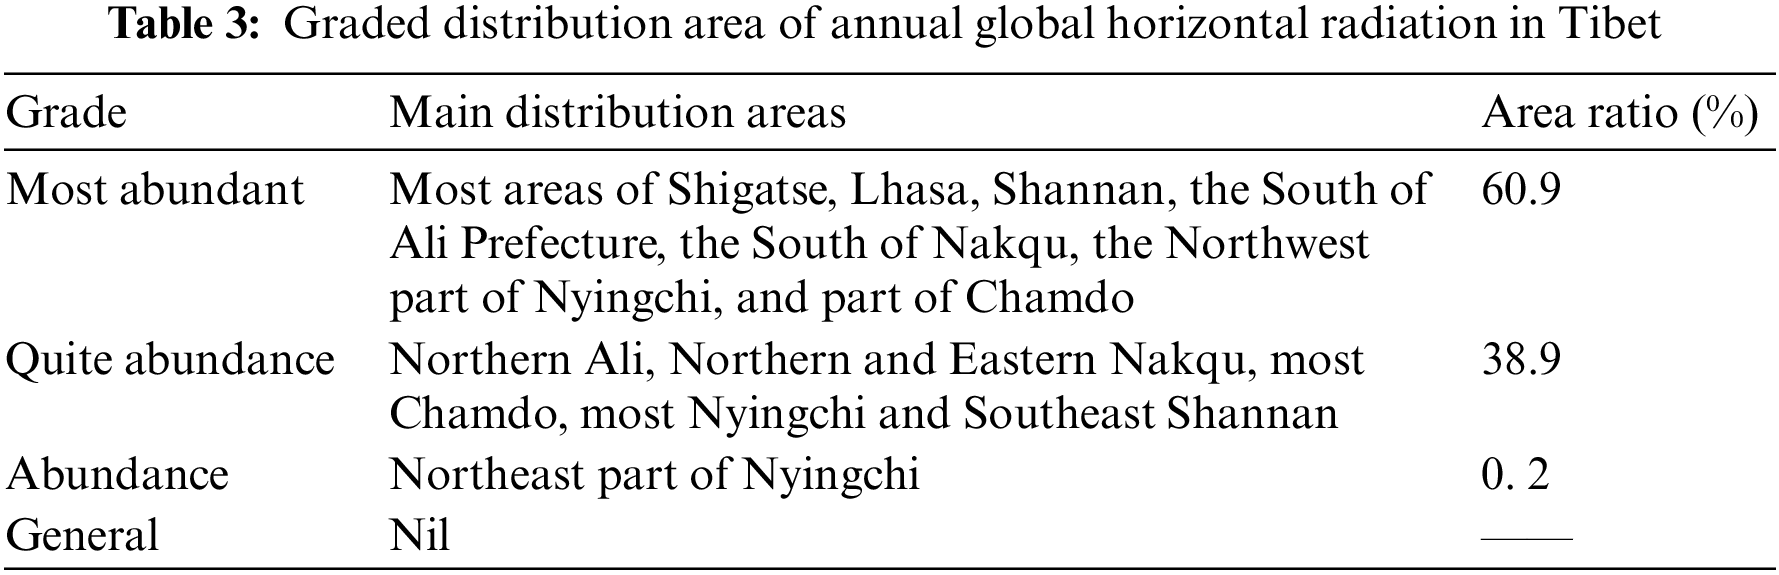
The amount of annual average horizontal radiation in a region reflects the abundance of solar energy resources. According to the national standard of Classification of solar energy resources–Global radiation (GB/T 31155-2014), the total amount of solar energy resources in China is divided into four grades. As shown in Table 2.
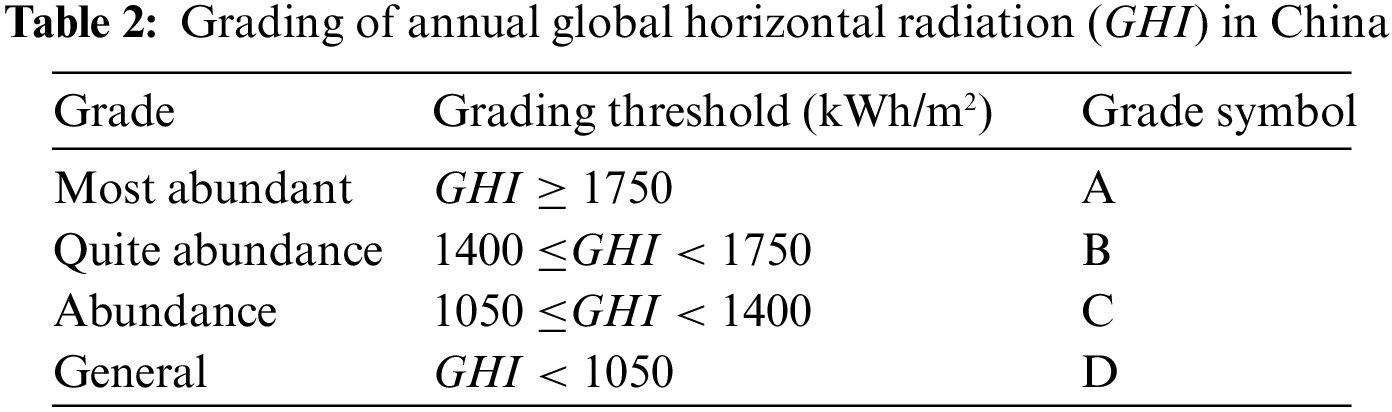
Fig. 3 shows the distribution areas of four aggregate levels in Tibet according to the above classification criteria. Table 3 is the corresponding geographical description and each level of land area of Tibet. It can be seen from the figure and table that there is no category D solar energy resource area in Tibet. Category A area accounts for 60.9% of the territory of the region. Category B area accounted for 38.9%. In terms of the abundance of solar energy resources, most regions of Tibet are suitable for the development and utilization of solar energy.
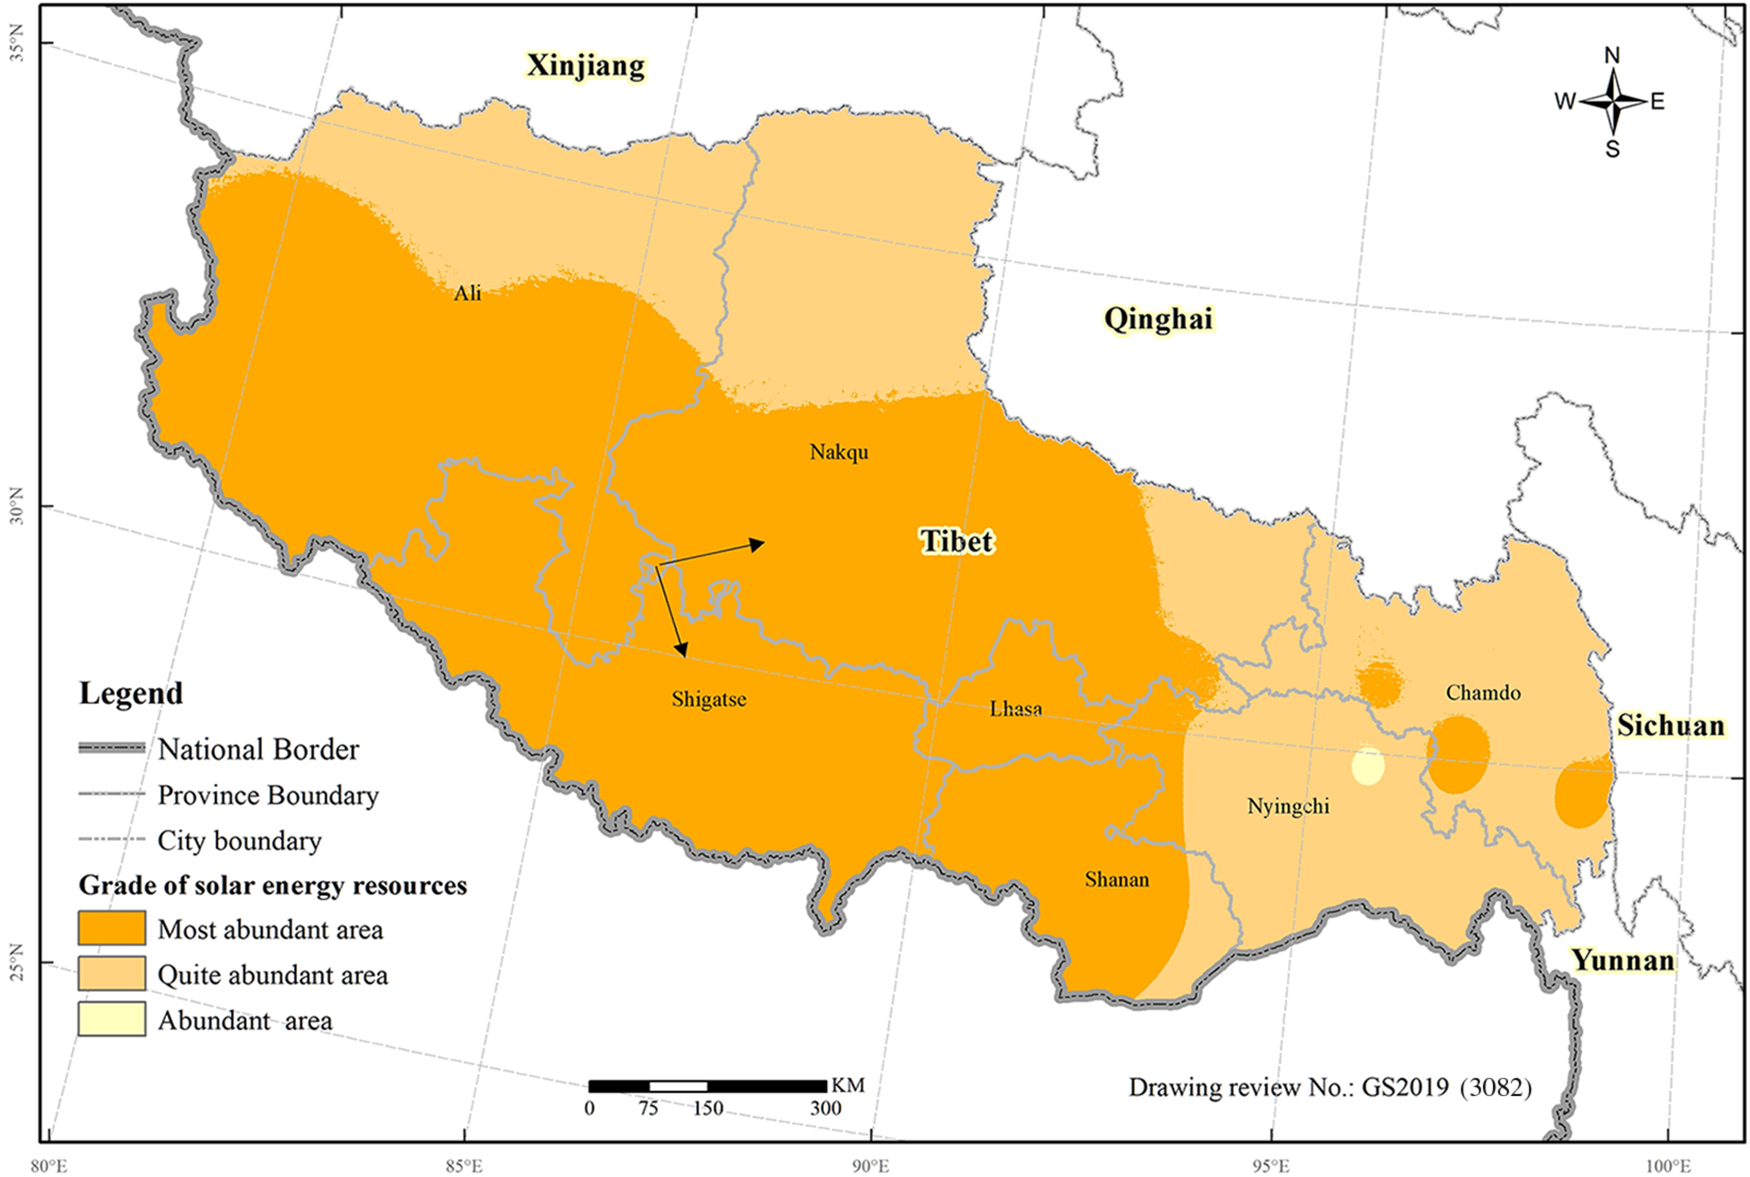
Figure 3: Grade distribution of annual global horizontal radiation in Tibet
The ratio of the minimum and maximum monthly total solar radiation in one year can characterize the stability of the annual variation of solar energy resources. In the actual atmosphere, its value changes in the (0,1] range; the closer to 1 more stable. The stability of solar energy resources in a region has an important influence on its development and utilization value. For solar power, the more stable the resource is, the more stable the output power is and the less impact on the grid. According to the national standard of Classification of solar energy resources–Global Radiation (GB/T 31155-2014) [28], the stability grade of solar energy resources in China is divided into four grades according to the ratio. As shown in Table 4.
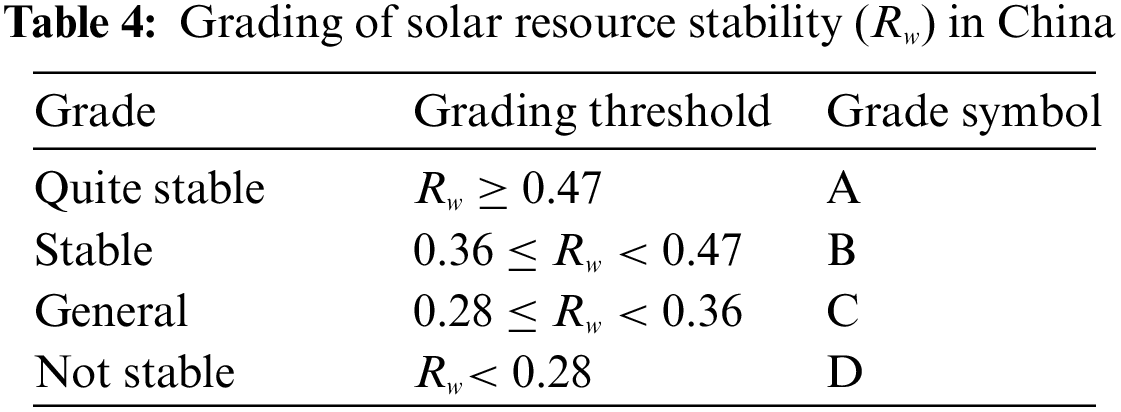
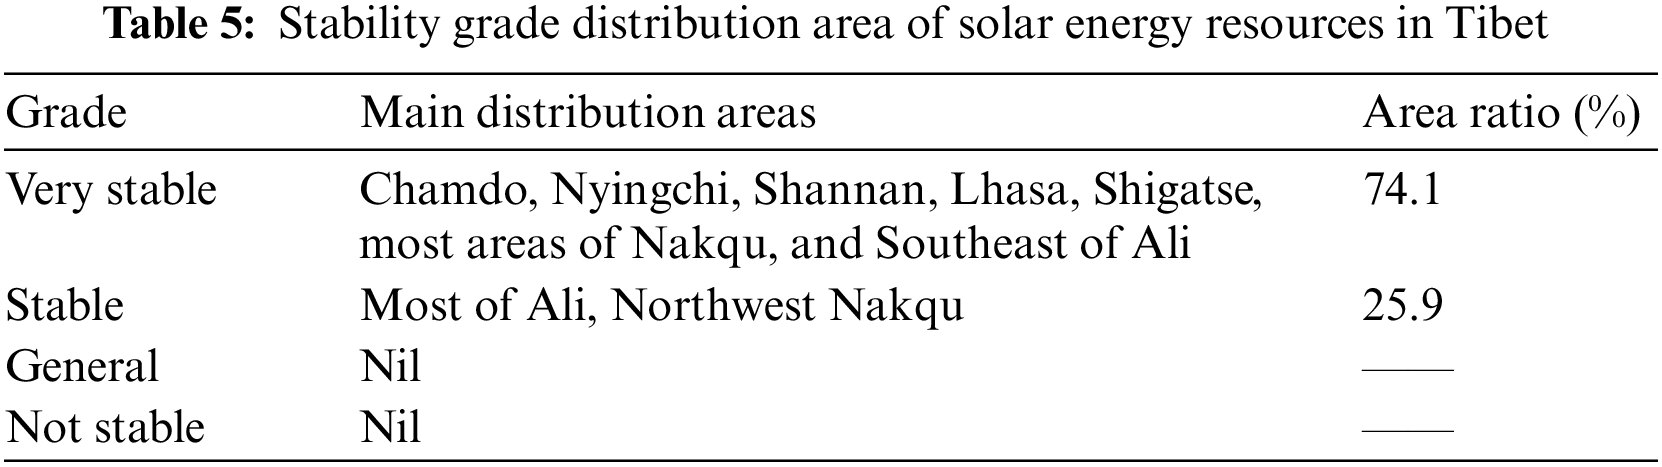
Fig. 4 shows the distribution area of four stability levels in Tibet according to the above classification criteria. Table 5 is the corresponding geographical description and each level of land area of Tibet. It can be seen from the figure and table that there is no Category C and Category D region in the stability grade distribution of solar energy resources in Tibet. Most areas of the region belong to category A area, accounting for about 74.1%. Category B area accounted for about 25.9%.
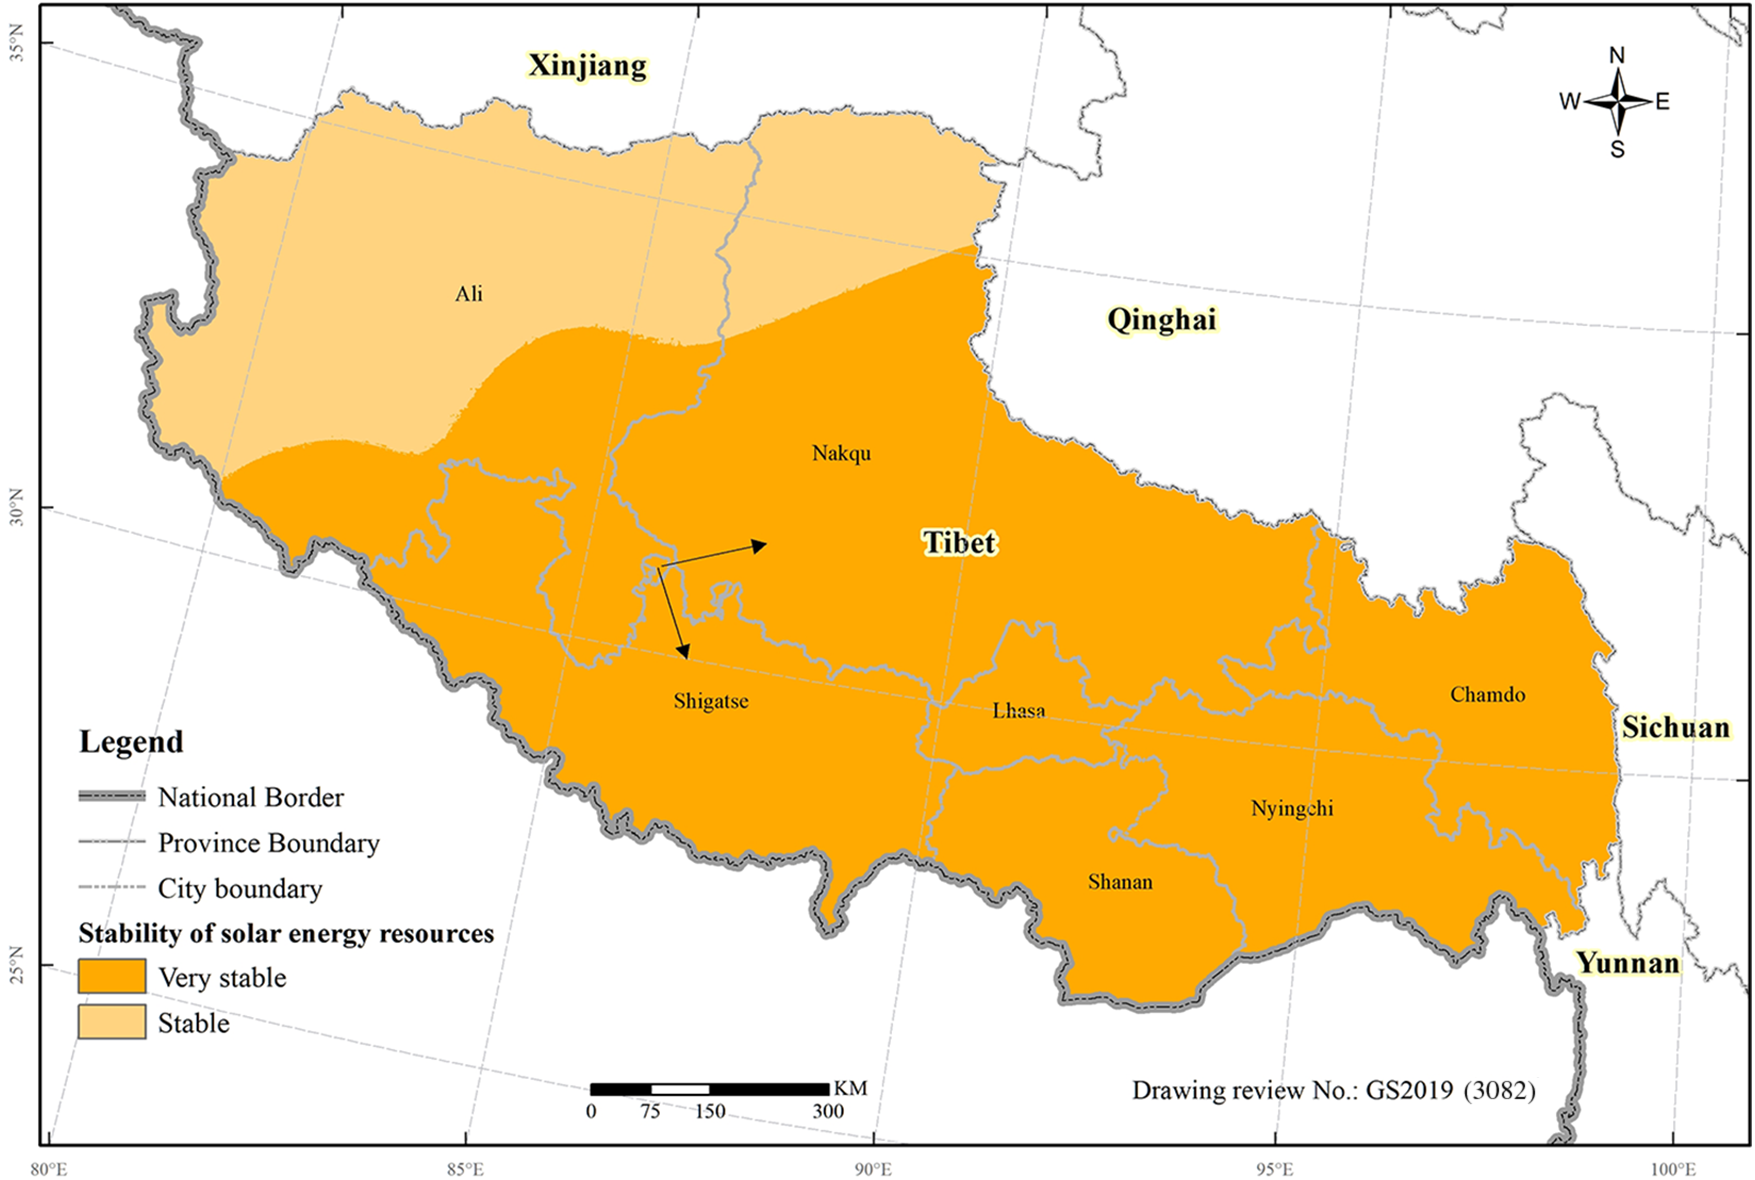
Figure 4: Grade distribution of solar energy resource stability in Tibet
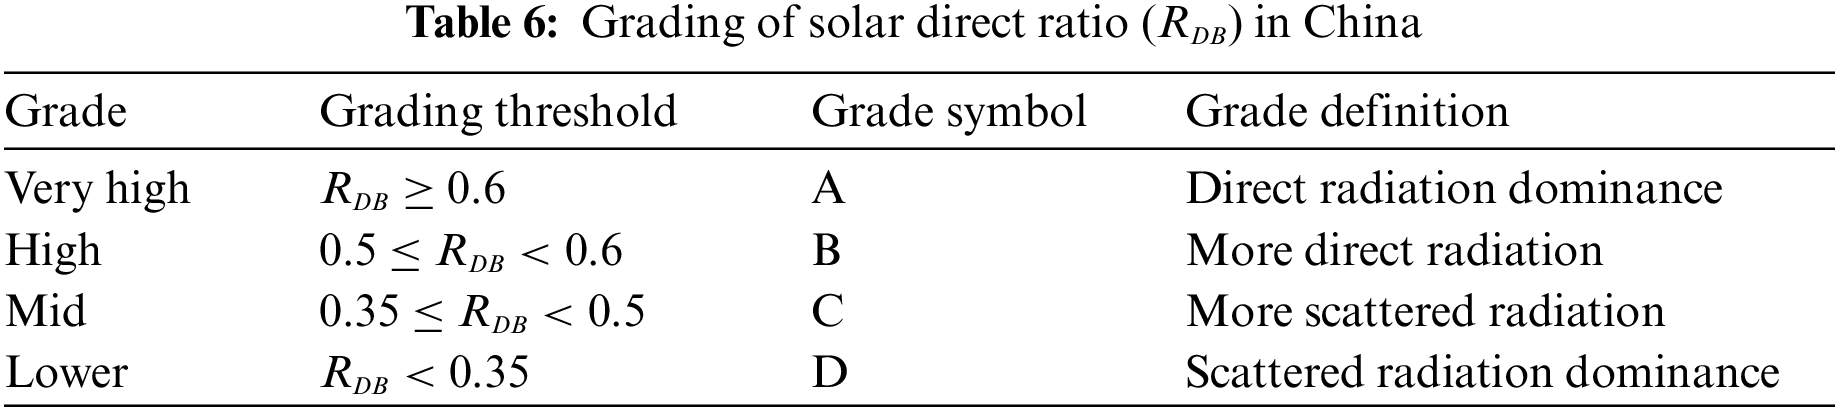
Horizontal total radiation consists of horizontal direct radiation and horizontal scattered radiation. The proportion of direct and diffuse radiation to total radiation varies significantly in different climate types. Different regions should develop and utilize according to the characteristics of main radiation forms. This study uses the direct ratio (the ratio of horizontal direct radiation to horizontal total radiation) to characterize this feature. In the actual atmosphere, the value of the direct ratio changes in the interval [0, 1). The closer it is to 1, the higher the proportion of direct radiation is. According to the national standard of Classification of solar energy resources–Global Radiation (GB/T 31155-2014), the direct ratio of solar energy resources in China is divided into four grades according to the ratio. As shown in Table 6.
According to the above classification criteria, Fig. 5 shows the distribution area of four direct ratio grades in Tibet. Table 7 is the corresponding geographical description and the area of Tibet occupied by each level. It can be seen from the figure and table that there is no area of type D in the hierarchical distribution of solar direct radiation ratio in Tibet. The proportion of Category A and Category B in the whole area reached more than 90%, of which Category A accounted for 47.7% and Category B accounted for 43.5%. Category C accounted for only 8.8%, mainly in the southeast of Nyingchi.
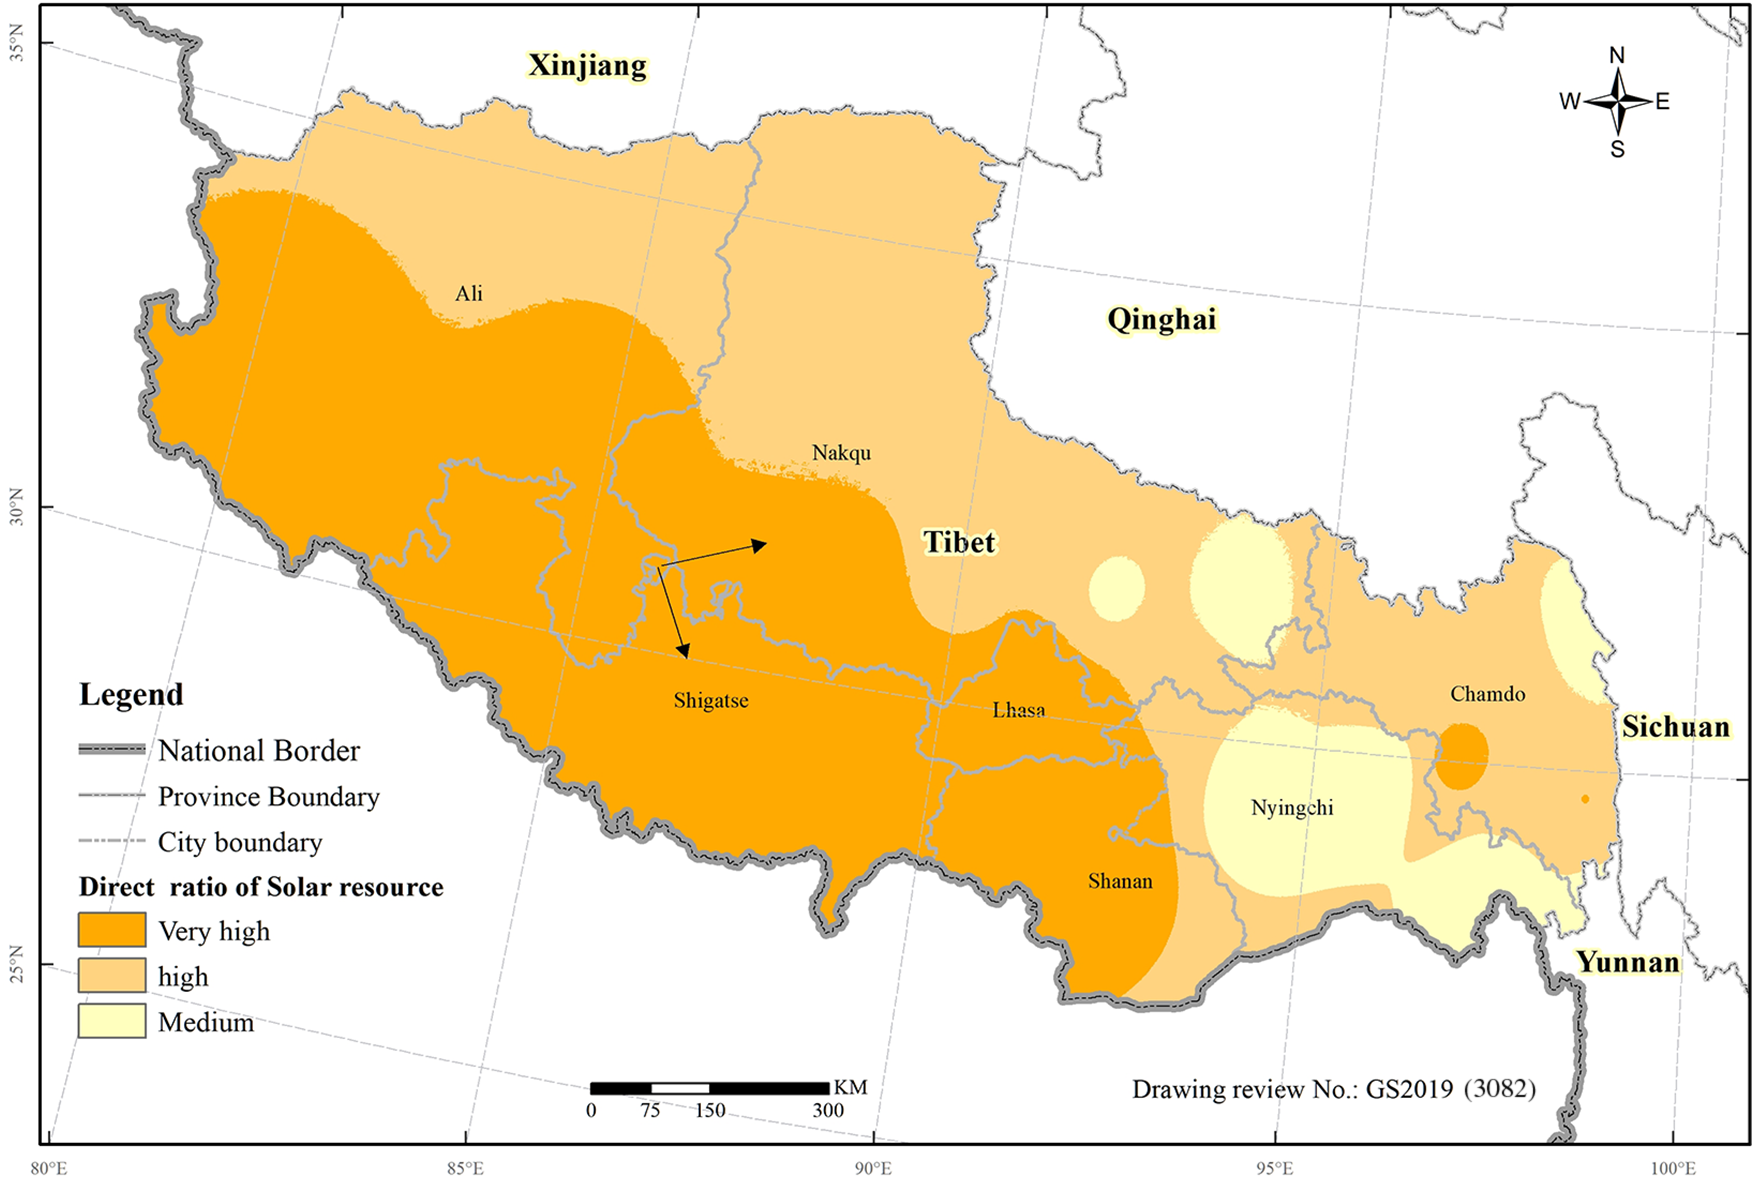
Figure 5: Grade distribution of solar direct ratio in Tibet
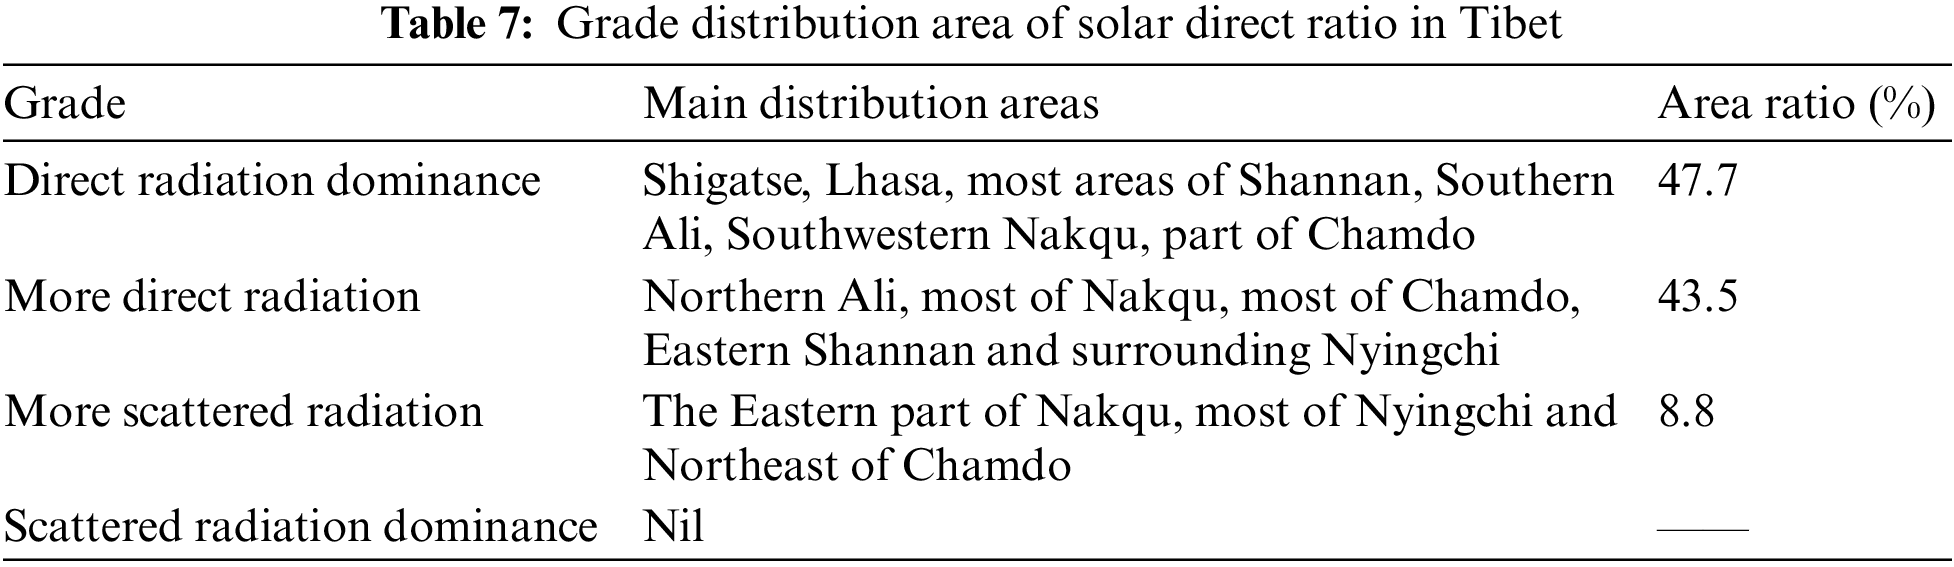
Table 8 shows the total theoretical statistics of horizontal solar energy resources in cities (regions) of Tibet. It can be seen from the table that:
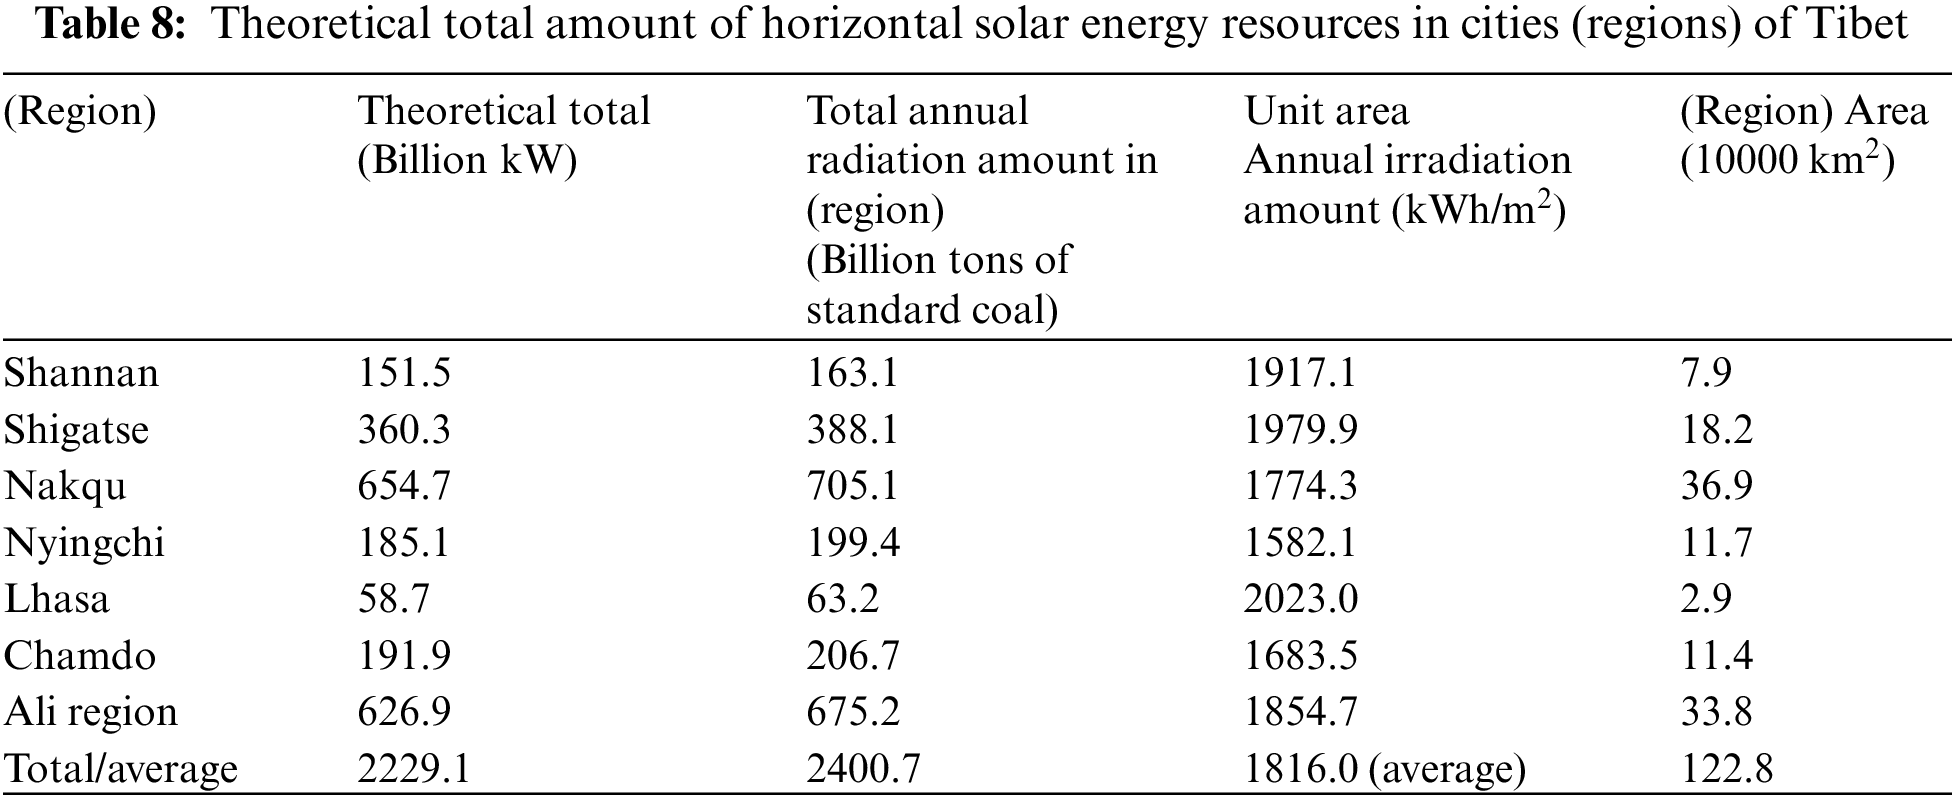
In terms of annual radiation per unit area, the average global horizontal radiation of the whole region is 1816 kWh/m2. Among them, Lhasa is the highest, and the global horizontal radiation is 2023.0 kWh/m2. Nyingchi is the lowest, and the global horizontal radiation is 1582.1 kWh/m2. In terms of the theoretical total amount within the regional area, the annual global horizontal radiation of the whole region is 240.07 billion tons of standard coal or 222.91 billion kW on average. Among them, Nakqu is the highest, and the annual global horizontal radiation is 70.51 billion tons of standard coal or 65.47 billion kW on average. Lhasa is the lowest, with an annual global horizontal radiation of 6.32 billion tons of standard coal or 5.87 billion kW on average.
4.5 Interannual Changes in Solar Energy Resources
This section evaluates the interannual changes in solar energy resources in the past 30 years (1991–2020). The grid data were used to evaluate and analyze the overall solar energy resources in Tibet. Apart from that, four national radiation observation stations were selected as typical stations, including Chamdo, Shiquanhe, Lhasa and Nakqu.
The sunshine hours vary fluctuating in the past 30 years. There’s an upward trend in Chamdo, Lhasa and Nakqu, while a downward trend in Tibet, Shiquan River (Fig. 6). Sunshine hours increased 54.25 h per decade in Chamdo Station, with a maximum of 2597.70 h in 2015 and a minimum of 2243.00 h in 1993. In Lhasa station, it increased in rate of 52.12 h per decade, with a maximum of 3245.20 h in 2009 and a minimum of 2672.90 h in 2000. The average increase of sunshine hours in Nakqu was 8.25 h per decade, the maximum was 2878.80 h in 2015, and the minimum was 2435.00 h in 2008. The average decrease in sunshine hours in Tibet hours was 40.21 h per decade, with a maximum of 2682.24 h in 1994 and a minimum of 2399.55 h in 2019. The average decrease in Shiquan River Station was 169.78 h per decade, with a maximum of 3739.80 h in 1991 and a minimum of 3015.70 h in 2019.
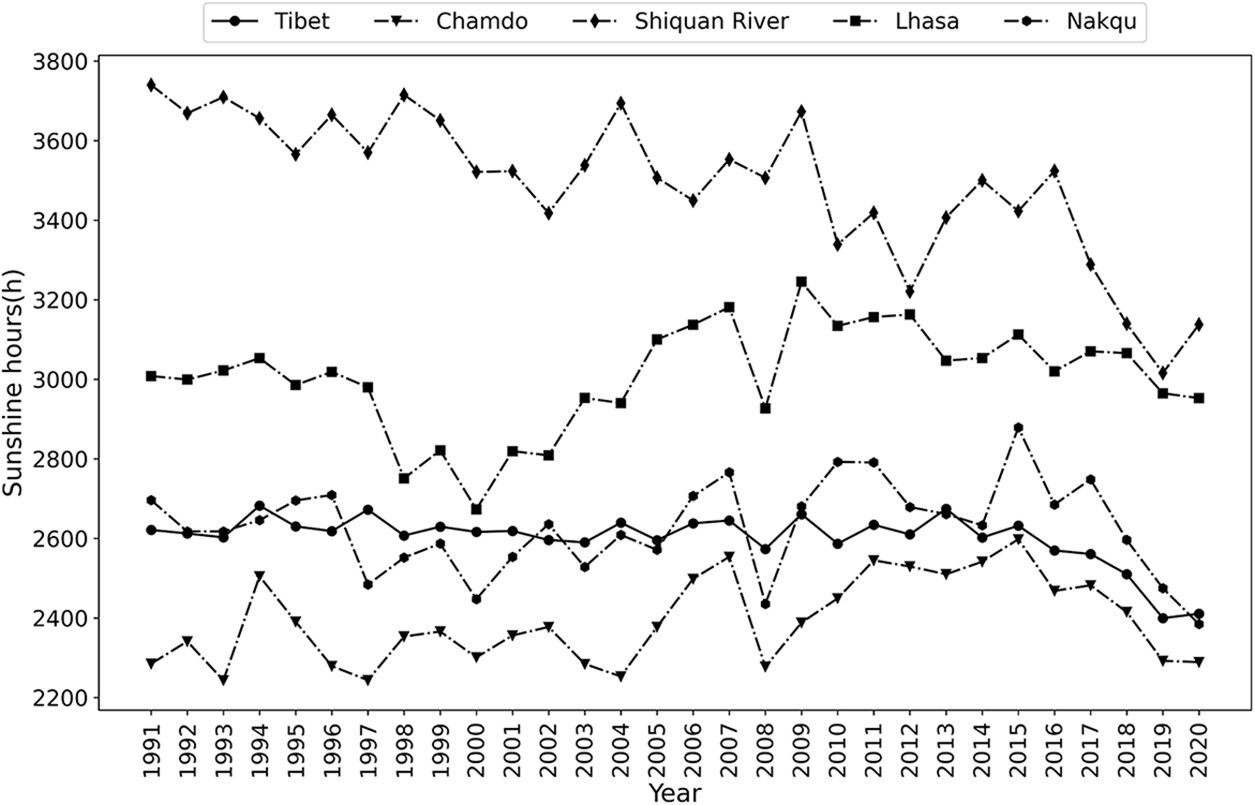
Figure 6: Variation curve of sunshine hours in recent 30 years (1991–2020)
The sunshine percentage performs the same trend with sunshine hours in the five areas during the past 30 years (Fig. 7). The average increase sunshine percentage in Chamdo was 0.43 per decade, with a maximum of 63 percent in 2015 and a minimum of 53 percent in 2019 and 2020. In Lhasa Station, the average increase in sunshine percentage was 0.86% per decade, with a maximum of 72% in 2009 and a minimum of 64% in 2000. The sunshine percentage of Nakqu was 1.63 per decade, with a maximum of 57 per cent in 2019 and a minimum of 45 percent in 2008. The average decrease of sunshine percentage in Tibet was 0.24% per decade, the maximum was 58% in 2013, and the minimum was 55% in 2018. The average decrease in Shiquan River was 1.8% per decade, the maximum was 78% in 1998, and the minimum was 67% in 2018.
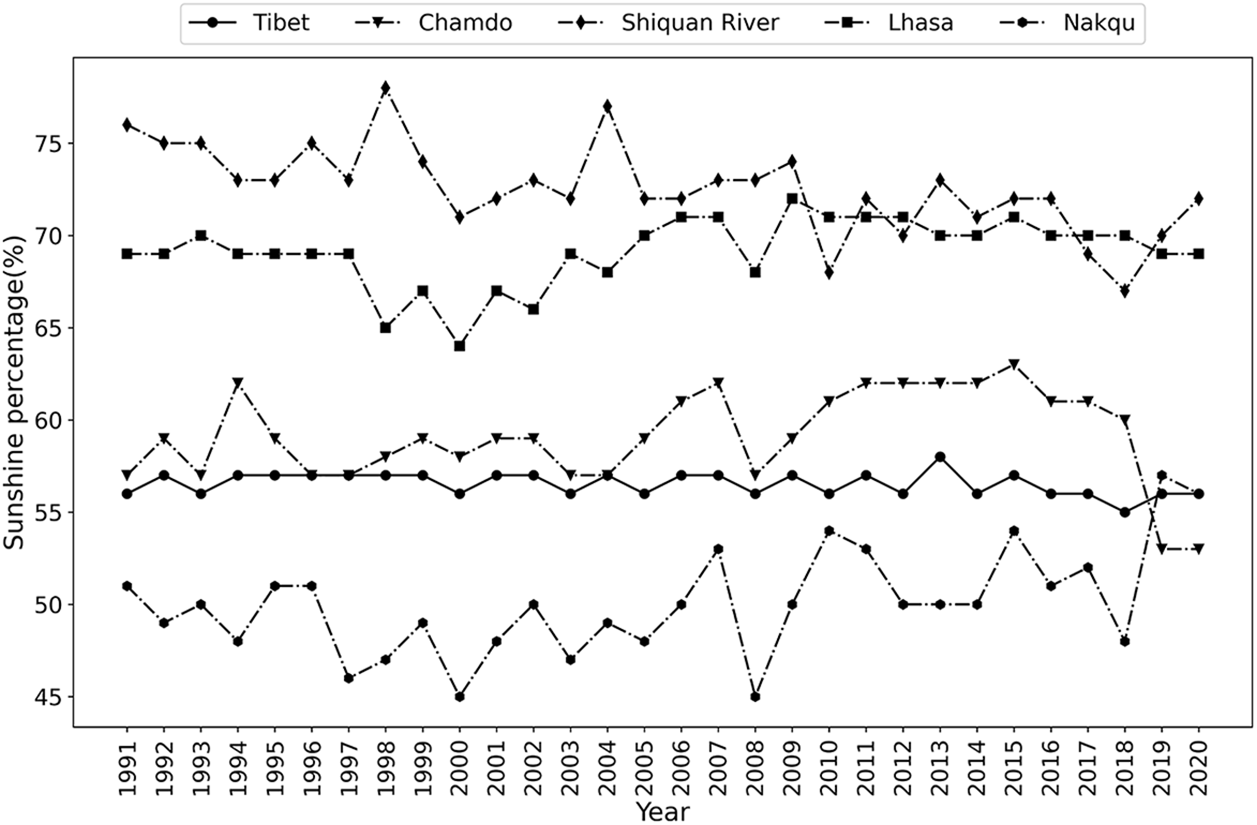
Figure 7: Sunshine percentage curve in recent 30 years (1991–2020)
4.5.3 Global Horizontal Radiation
The global horizontal radiation also performs the same with the sunshine hours and percentage during the past 30 years (Fig. 8). The average increase in global horizontal radiation of Chamdo was 21.78 (kWh/m2) per decade, with a maximum of 1807.29 kWh/m2 in 2015 and a minimum of 1655.83 kWh/m2 in 1993. In Lhasa station, the average increase in global horizontal radiation was 16.07 (kWh/m2) per decade, with a maximum of 2139.44 kWh/m2 in 2009 and a minimum of 1975.18 kWh/m2 in 2000. The increase of global horizontal radiation in Nakqu was 2.58 (kWh/m2) per decade, with a maximum of 1866.77 kWh/m2 in 2015 and a minimum of 1718.49 kWh/m2 in 2008. The average decrease in Tibet was 12.86 (kWh/m2) per decade, the maximum was 1770.74 kWh/m2 in 1994, and the minimum was 1672.36 kWh/m2 in 2019. The average decrease in Shiquan River was 63.55 (kWh/m2) per decade, with a maximum of 2237.99 kWh/m2 in 1991 and a minimum of 1977.48 kWh/m2 in 2019.
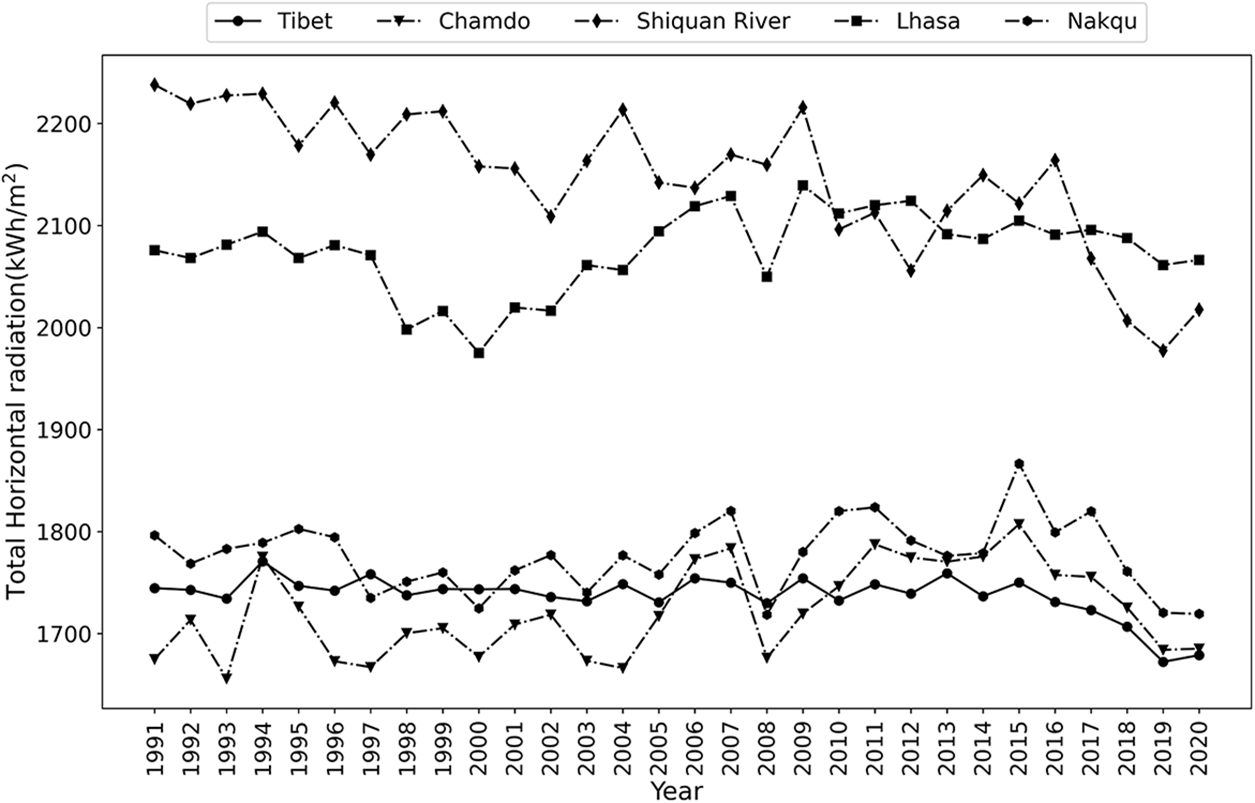
Figure 8: Annual GHI variation curve in recent 30 years (1991–2020)
Judging from the changes in the past 30 years, the solar energy resources in Tibet and even the whole country have shown a downward trend, which has had a certain impact on photovoltaic power generation in recent years. The study [29] was a high minimum period in the 1970s, and the total volume increased significantly in the 1980s and early 1990s, but declined again after the mid-1990s. The occurrence of the high-value period in the 1970s and the low-value period in the 1980s was closely related to the cloud and rain conditions in Tibet and major global volcanic eruption events [30]. However, from the perspective of long-term climate change, interannual and interdecadal fluctuations in solar radiation are one of its inherent features. The current downward trend is only a phase of change and will not last. In addition, with the strengthening of ecological protection and the continuous improvement of air quality in China, ground-based solar radiation is also likely to gradually increase. Therefore, fluctuations in solar energy resources may have a certain impact on photovoltaic power generation in the short term, but in the long term, this impact is relatively limited. It is suggested that the development trend of solar energy resources in the next few decades and its impact on photovoltaic power generation, as well as the impact of large-scale photovoltaic power plant construction on local climate and environmental ecology should be studied. Different studies have shown that the integrated development of solar, wind and hydropower can reduce the instability and volatility of single-resource power generation. The National Wind Energy Storage Demonstration project can reduce the high-frequency fluctuations of wind power and photovoltaic output amplitude, and improve the grid’s ability to absorb wind power and photovoltaic power by coordinating the power of wind power, photovoltaic and energy storage systems in real-time. Large-scale construction of photovoltaic power stations will have a certain impact on the natural environment, biodiversity and climate, and its impact exists in different life stages of photovoltaic power stations (construction, operation, scrapping). Zhai et al. [31] believed that the construction of PV stations in grassland areas will affect the local natural environment and plant community characteristics. Wang et al. [32] believed that the shading effect of photovoltaic panels is conducive to the growth of sprout-tolerant plants. The layout of photovoltaic white stations can also increase relative humidity, change wind direction, and reduce wind speed and soil temperature.
Tibet is well located in terms of solar potential, but lacks fossil energy sources. Therefore, it is wise to develop solar energy for sustainable development in Tibet. Tibet is sparsely populated and has a low density of national weather stations. At present, and Nali region only Lhasa, Qamdo, Naqu and Shiquanhe four ground solar radiation observation stations. Although the methods of climate statistics and topographic correction were used in this study to obtain the fine assessment results of solar energy resources in the whole region, there are large errors in the evaluation results in the area with fewer stations. Therefore, it is suggested to strengthen the calculation of solar energy resources in the process of developing and utilizing solar energy in Tibet, so as to provide a basis for further revising the fine evaluation results of solar energy resources in the whole region.
The average annual global horizontal radiation exposure in Tibet is 1816 kWh/m2. More than 60% of the area belongs to the “Most abundant” area of China’s solar energy resources category A, and nearly 40% belongs to the “Quite abundant” area of category B.
In space, the solar energy resources in Tibet increased gradually from north to south and from east to west. Lhasa, central and eastern Shigatse, Shannan, and Southwest Ali region are the richest. The maximum annual radiation amount of global horizontal radiation is 2189 kWh/m2. 74% of the area belongs to the “Quite stable” area of solar resource stability category A, and 26% of the area belongs to the “Stable” area of solar resource stability category B. The solar resources in the whole area show the characteristics of “strong and stable”. The average solar energy resources in the whole region have fluctuated and decreased in the past 30 years, with an average decrease of about 12.86 (kWh/m2) per decade.
In terms of time, the global horizontal radiation in Tibet was the highest in May and the lowest in December. As far as the solar radiation resources reaching the surface are concerned, the theoretical global annual horizontal radiation in Tibet is about 240.7 billion tons of standard coal or 222.91 billion kilowatts on average.
This article analyzes the spatial and temporal distribution characteristics of solar energy in Tibet from a macro level. In the future, we will further study the solar radiation characteristics in Tibet from a micro level, such as spectral and physical characteristics, and analyze the impact of these characteristics on photovoltaic power generation, providing scientific support for improving the efficiency of solar resource utilization in the region.
Acknowledgement: None.
Funding Statement: This work was supported by the Major Science and Technology Project of the Science and Technology Department of Tibet under Grant Number XZ202101ZD0015G, and the Second Tibet Plateau Scientific Expedition and Research Program (STEP) under Grant Number 2019QZKK0804.
Author Contributions: The authors confirm contribution to the paper as follows: study conception and design: Yanbo Shen, Wenzheng Yu; data collection: Yanbo Shen; analysis and interpretation of results: Yang Gao, Yueming Hu, Xin Yao; draft manuscript preparation: Yang Gao, Yueming Hu, Yubing Zhang. All authors reviewed the results and approved the final version of the manuscript.
Availability of Data and Materials: Data supporting this study are included within the article.
Conflicts of Interest: The authors declare that they have no conflicts of interest to report regarding the present study.
References
1. Zhao, W. N., Ciren, N. M., Wang, Y. R., Xuan, Y. J. (2022). Temporal variation of surface radiation in Yangbajing, Xizang. Plateau Scientific Research, 6(4), 42–49. [Google Scholar]
2. Han, M. Y., Jiao, X., Liu, W. D. (2022). Spatio-temporal distribution, competitive development and emission reduction of China’s photovoltaic power generation. Journal of Natural Resources, 37(5), 1338–1351. [Google Scholar]
3. Eliza, M. M., Azlan, I., Erica, A., Yan, A. F., Adzrie, R. et al. (2022). A preliminary assessment of load consumption and solar power potential at Kota Belud, Sabah. Energy Engineering, 119(4), 1361–1377. [Google Scholar]
4. Yao, Y. B., Zheng, S. Z., Yang, Y., Zhang, M., Zhao, J. F. et al. (2022). Research progress and prospect of solar energy resources evaluation and utilization efficiency in China. Journal of Solar Energy, 43(10), 524–535. [Google Scholar]
5. Lin, A., Lu, M., Sun, P. (2018). The influence of local environmental, economic and social variables on the spatial distribution of photovoltaic applications across China’s urban areas. Energies, 11(8), 1986. [Google Scholar]
6. Zhang, L. F., He, Z. Q., Zhang, J. Z. (2022). Anti-strong magnetic interference technology of intelligent miniature circuit breaker. Electric Power, 51(11), 111–116. [Google Scholar]
7. Jin, Y. J., Ma, M., Zhu, S. Z., Li, N. (2022). Renewable energy development and multi-energy complementation, taking Qinghai as an example. Journal of Tsinghua University (Natural Science Edition), 62(8), 1357–1365. [Google Scholar]
8. Zhang, Y. X., Yao, B., Wang, P. (2019). The application of photovoltaic water pumping technology in sprinkler irrigation of grassland in Tibet Plateau-Taking Ali Area as an example. China Rural and Hydropower, 37(7), 26–34. [Google Scholar]
9. Ma, J. Y., Luo, Y., Shen, Y. B., Lang, H., Li, S. K. (2013). Regional long-term trend of ground solar radiation in China over the past 50 years. Science China Earth Sciences, 56(7), 1242–1253. [Google Scholar]
10. Lin, X., Bimenyimana, S., Wang, C., Norense Osarumwensa, A., Paula Ihirwe, G. et al. (2023). Modelling and optimization of clean and affordable electricity solution for small-scale savings and credit cooperatives (SACCOs). Energy Engineering, 120(4), 791–810. [Google Scholar]
11. Stanhill, G., Cohen, S. Z. (1997). Recent changes in solar irradiance in Antarctica. Journal of Climate, 10, 2078–2086. [Google Scholar]
12. Wild, M., Ohmura, A., Schär, C. M., Müller, G. F., Sanchez, L. A. (2017). The global energy balance archive (GEBA) version 2017: A database for worldwide measured surface energy fluxes. Earth System Science Data, 9, 601–613. [Google Scholar]
13. Russak, V. (1990). Trends of solar radiation, cloudiness and atmospheric transparency during recent decades in Estonia. Tellus, 42(2), 206–210. [Google Scholar]
14. Ohmura, A., Gilgen, H. (1991). Global Energy Balance Archive (GEBA) Report 2: GEBA Database: Interactive application to retrieve data. https://geba.ethz.ch/publications/descriptions-of-geba.html [Google Scholar]
15. Fu, B. F., Yu, J. M., Lu, Q. X. (1996). Mountain climate resources and development and utilization. China: Nanjing University Press. [Google Scholar]
16. Li, X. W., Li, W. L., Zhou, X. J. (1998). Analysis of the solar radiation variation of China in recent 30 years. Quarterly Journal of Applied Meteorology, 9(1), 24–31. [Google Scholar]
17. Lyu, N., Liu, R. G., Liu, J. Y. (2009). The spatiotemporal variation of downward shortwave radiation over China from 1998 to 2002. Journal of GeoInformation Science, 11(5), 5623–5630. [Google Scholar]
18. Wang, Y. J., Huang, Y., Zhang, W. (2009). Changes in surface solar radiation in mainland China over the period from 1961 to 2003. Climatic and Environmental Research, 14(4), 405–413. [Google Scholar]
19. Wu, Q. Z., Wang, Z. F., Cui, Y. L. (2010). Evaluating the solar radiation resources of China in recent 20 years by meteorological model. Journal of Applied Meteorological Science, 21(3), 343–351. [Google Scholar]
20. Ma, J. Y., Luo, Y., Liang, H., Li, S. (2012). Spatial and temporal variation of total solar radiation in China in recent 50 years. Journal of Natural Resources, 27(2), 268–280. [Google Scholar]
21. Zhou, Y., Wu, W. Y., Hu, Y., Liu, G. X. (2010). Spatial distribution characteristics and resource potential assessment of solar energy resources in Northwest China. Journal of Natural Resources, 25(10), 1738–1749. [Google Scholar]
22. Huang, T., Wang, S., Yang, Q., Li, J. (2018). A GIS-based assessment of large-scale PV potential in China. Energy Procedia, 52(12), 1079–1084. [Google Scholar]
23. Liao, M. L., Zhang, Z., Jia, J., Xiong, J., Han, M. (2022). Mapping China’s photovoltaic power geographies: Spatial-temporal evolution, provincial competition and low-carbon transition. Renewable Energy, 191(1), 251–260. [Google Scholar]
24. Russak, V. (1990). Trends of solar radiation, cloudiness and atmospheric transparency during recent decades in Estonia. Tellus B: Chemical and Physical Meteorology, 42(2), 206–210. [Google Scholar]
25. China Meteorological Administration (2019). Assessment method for solar energy resource. https://www.cma.gov.cn/zfxxgk/gknr/flfgbz/bz/202209/t20220921_5099221.html [Google Scholar]
26. Gueymard, C. A. (2001). Parameterized transmittance model for direct beam and circumsolar spectral irradiance. Solar Energy, 71(5), 325–346. [Google Scholar]
27. Shen, Y. B., Wang, B. Z. (2022). Simulation of temporal and spatial variation characteristics of ultraviolet radiation multi-parameters and their influence factors based on SMARTS. Journal of Solar Energy, 43(4), 2022. [Google Scholar]
28. China Meteorological Administration (2014). Categoryification of solar energy resources. https://www.cma.gov.cn/zfxxgk/gknr/flfgbz/bz/202209/t20220921_5098064.html [Google Scholar]
29. Cheng, F., Ma, Y. Y., Li, W. Q. (2005). Temporal and spatial distribution of solar radiation over Qinghai Plateau. Meteorological Science and Technology, 3, 231–234. [Google Scholar]
30. Wen, X. H., Shang, K. Z., Wang, S. G., Yang, D., Fan, W. (2008). A preliminary study on regional characteristics of solar radiation in China during 1961–2000. Chinese Desert, 28(3), 554–561. [Google Scholar]
31. Zhai, B., Gao, Y. D., Dang, X. H., Chen, B., Liu, J. X. et al. (2022). Effects of photovoltaic panels on community characteristics and diversity of Leymus chinensis. Journal of Ecology, 37(8), 2237–2243. [Google Scholar]
32. Wang, T., Wang, D. X., Guo, D., Zhang, T. T., Zhao, S. X. et al. (2016). Effects of photovoltaic power plant construction on soil and vegetation. Soil and Water Conservation Research, 23(3), 90–94. [Google Scholar]
Cite This Article
 Copyright © 2024 The Author(s). Published by Tech Science Press.
This work is licensed under a Creative Commons Attribution 4.0 International License , which permits unrestricted use, distribution, and reproduction in any medium, provided the original work is properly cited.
 Downloads
 Citation Tools