
 Submit a Paper
 Propose a Special lssue
 Open Access
ARTICLE
Dispersed Wind Power Planning Method Considering Network Loss Correction with Cold Weather
1 Hulunbeier Power Supply Company, State Grid Inner Mongolia East Power Co., Ltd., Hulunbeier, 021100, China
2 College of Electrical and Electronic Engineering, North China Electric Power University, Beijing, 102206, China
* Corresponding Author: Yihong Jiao. Email:
Energy Engineering 2024, 121(4), 1027-1048. https://doi.org/10.32604/ee.2023.045358
Received 24 August 2023; Accepted 28 November 2023; Issue published 26 March 2024
 View Full Text
 Download PDF
Abstract
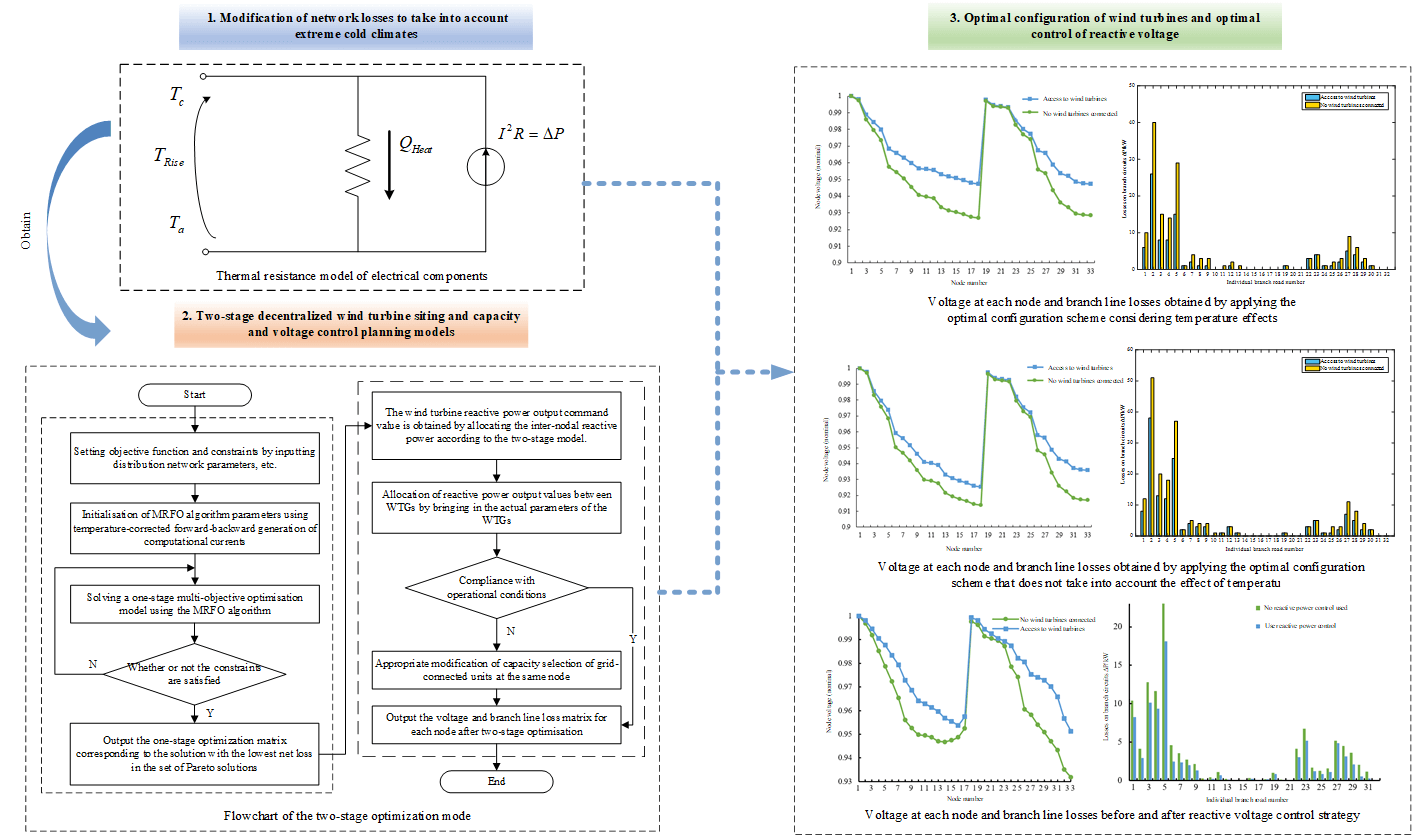
In order to play a positive role of decentralised wind power on-grid for voltage stability improvement and loss reduction of distribution network, a multi-objective two-stage decentralised wind power planning method is proposed in the paper, which takes into account the network loss correction for the extreme cold region. Firstly, an electro-thermal model is introduced to reflect the effect of temperature on conductor resistance and to correct the results of active network loss calculation; secondly, a two-stage multi-objective two-stage decentralised wind power siting and capacity allocation and reactive voltage optimisation control model is constructed to take account of the network loss correction, and the multi-objective multi-planning model is established in the first stage to consider the whole-life cycle investment cost of WTGs, the system operating cost and the voltage quality of power supply, and the multi-objective planning model is established in the second stage. planning model, and the second stage further develops the reactive voltage control strategy of WTGs on this basis, and obtains the distribution network loss reduction method based on WTG siting and capacity allocation and reactive power control strategy. Finally, the optimal configuration scheme is solved by the manta ray foraging optimisation (MRFO) algorithm, and the loss of each branch line and bus loss of the distribution network before and after the adoption of this loss reduction method is calculated by taking the IEEE33 distribution system as an example, which verifies the practicability and validity of the proposed method, and provides a reference introduction for decision-making for the distributed energy planning of the distribution network.
Graphic Abstract
Keywords
At present, wind power as a new energy green energy using distributed power grid-connected has been widely used, the increase in the penetration rate of wind turbines, the voltage quality of the distribution network, and other reliability issues bring many impacts [1–3], and wind turbines access to the distribution network will affect the line loss and operational stability [4,5], and the degree of its impact with the wind turbines in the distribution network access location and access capacity related [6]. In addition, with the in-depth study of the optimal allocation problem of WTGs, the considerations are more comprehensive, and it gradually develops towards the direction of a multi-objective optimization problem [7–9].
As the problem of optimal allocation of distributed power supply heats up in the academic world, more efficient mathematical models and optimization algorithms are gradually applied in engineering calculations [10]. Reference [11] modeled the distribution network’s own load as well as the distributed power output with the objective of minimum operating cost and minimum network loss and used an improved particle swarm algorithm to solve the problem effectively. Reference [12] based on bacterial foraging optimization algorithm, to minimize network loss and economic cost of installing a distributed power supply in the distribution network, reduces the power loss and investment cost by optimizing the site selection and capacity size of distributed power supply. Reference [13] established a multi-objective two-layer optimization model for the optimal capacity and location optimization problem of distributed power supply, the upper model selects the grid-connected location, the lower model adjusts the capacity of distributed power supply, and the multi-objective model is transformed by using the multi-weight method, which not only simplifies the problem but also improves the power supply reliability of the distribution network. Reference [14] used a particle swarm algorithm to solve the Pareto non-inferior solution set of the wind turbine grid-connected optimization problem to obtain the ideal solution. For some of the theories involved in the multi-objective model described in the paper, Reference [15] proposed an input cost model for power supply equipment based on the whole life cycle theory, in which the variable investment cost, operation and maintenance cost, failure cost, and abandonment cost are taken into account to improve the economics of the siting and capacity planning problem. Reference [16] established an expression for the electro-thermal link between temperature and resistance based on the foundation of electro-thermal coordination theory. Reference [17] showed that the ambient temperature has a large effect on the line resistance, which can cause some errors in the calculation of grid parameters. The above studies provide guidance for the model construction and optimization algorithm selection in this paper, but the objective function consideration is one-sided, and it does not optimize the configuration from the investment cost, operation cost power supply voltage quality, etc. In addition, the above algorithms do not have strong convergence, and the computational efficiency and accuracy still need to be optimized.
Considering the application of different optimization algorithms to the problem of wind turbine siting and capacity allocation can reasonably plan the access to wind turbines to reduce the distribution network line losses, based on which the use of reactive power control methods can to a certain extent solve the problem of the random volatility of the wind speed, but also be able to further enhance the node voltage and reduce line losses [18–21]. Combining the research results with the impact of extremely cold weather on the calculation of network losses is an important guide for the field implementation of research on the topic of decentralized wind power grid integration. Based on the above analysis, this method aims to optimize the planning of decentralized wind power siting and capacity set in extremely cold areas to minimize network loss, considering the effect of temperature on the conductor resistance value to improve the calculation accuracy of active network loss in the distribution network, and introducing the theory of full life cycle to calculate the investment cost of wind turbines to fit the actual operation and maintenance situation and to respond to the national goal of “double carbon”, and to establish a multi-objective planning model for the siting and capacity setting of decentralized wind power in conjunction with the quality of the power supply voltage. In this paper, the manta ray foraging optimization (MRFO) algorithm is used to obtain the Pareto solution set, which has an advanced optimization mechanism to avoid falling into the local optimum and improve the optimization accuracy. By selecting the solution with the lowest total network loss in the Pareto solution set and formulating the reactive voltage control strategy for wind turbines on this basis, a grid-connection optimization method based on decentralized wind turbines is finally obtained.
2 Modification of Network Losses to Take into Account Extreme Cold Climates
The temperature has a non-negligible impact on the properties of the conductor in the power grid, for some climatic conditions more stringent areas, there will be a lower average temperature and the phenomenon of a large temperature difference between day and night, Figs. 1 and 2 are respectively the average monthly temperature curve in Hulunbuir City in 2022 and the average daily temperature curve on behalf of August, from the figure can be seen in the city of Hulunbuir, the average annual maximum temperature of 5.75°C, the minimum temperature −4.42°C, the overall average temperature of only 0.67°C throughout the year, far from the reference ambient temperature of 20°C, which is commonly used resistance value. The overall average temperature throughout the year is only 0.67°C, and the conductor commonly used resistance value of the reference ambient temperature of 20°C is far away. At the same time, the single-day maximum temperature difference in August reaches 17°C and the minimum temperature is 6°C, which is a large temperature difference. When carrying out transmission line parameter calculations, the conductor resistance is often regarded as a constant value, ignoring the effect of temperature on the conductor properties. Electrothermal-related theory shows [22,23] that the ambient temperature has a certain effect on the line resistance, if the effect is ignored in the actual calculation, it will lead to a large deviation between the final line loss accumulation calculation results and the actual deviation.
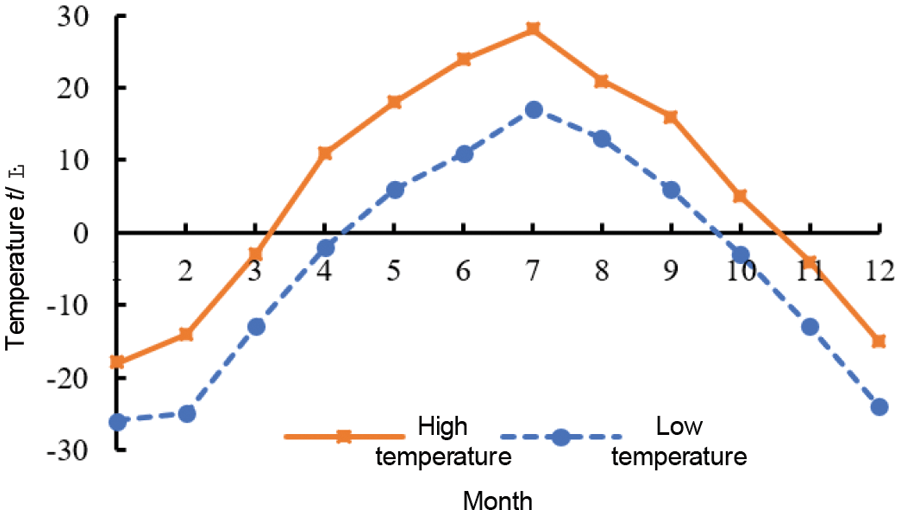
Figure 1: Monthly mean temperature profile for Hulunbeier City 2022
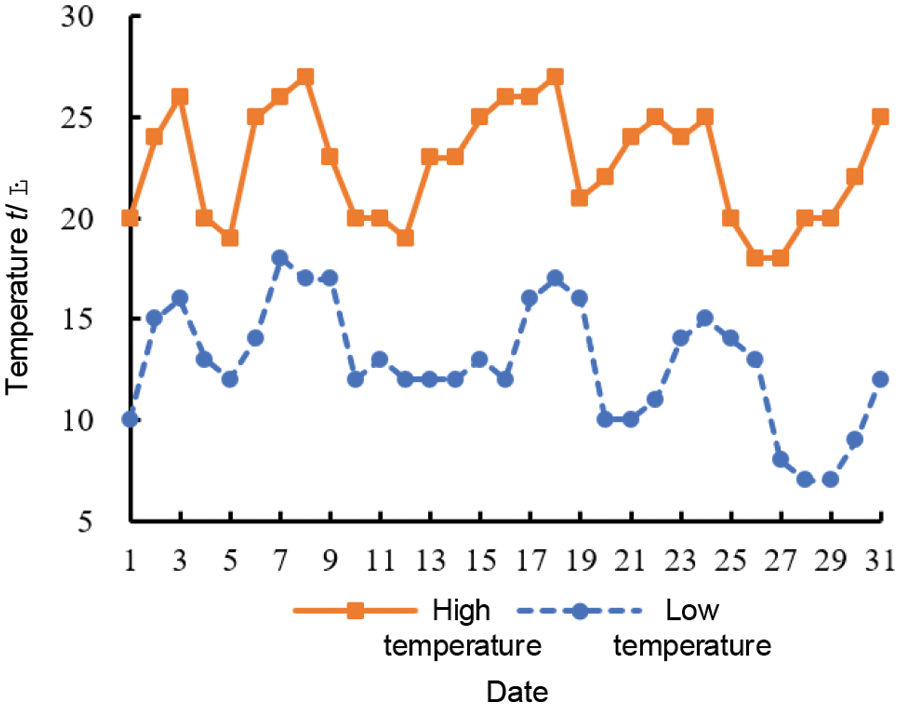
Figure 2: Average daily temperature profile for August in Hulunbeier City
Based on the above analyses, the network loss correction problem needs to be considered when studying the distribution network operation problems in extremely cold regions. The power system electro-thermal model noting the influence of temperature factors can describe the relationship between conductor resistance and temperature as follows:
where:
In the electro-thermal modeling, the thermal resistance model of the electrical components is shown in Fig. 3.
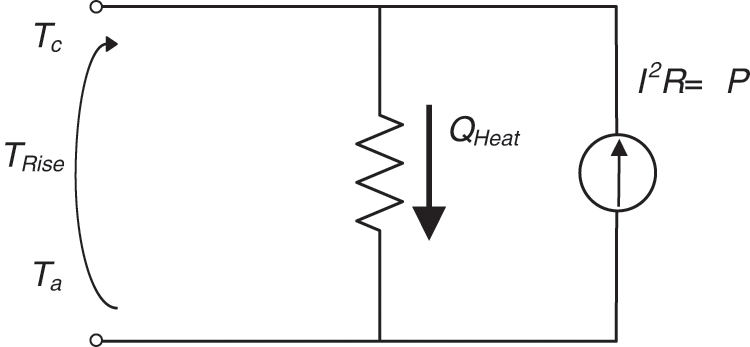
Figure 3: Thermal resistance model of electrical components
The model in Fig. 3 simulates the thermal response of power equipment and reflects the relationship between conductor temperature and ambient temperature. For transmission lines, the ratio of temperature rise to loss at steady state is defined as the resistance temperature coefficient
Obviously, the
Combining Eqs. (1) and (3), the corrected active loss for a single transmission line considering the temperature factor can be derived as shown in Eq. (4):
Since the temperature parameters of the conductor are difficult to measure directly in practical engineering, in this paper, the Nether-McGrath formula [24] for the thermal limit as shown in Eq. (5) is used to define
where:
3 Two-Stage Decentralised Wind Power Planning Model
Considering the limitations of the traditional model, this paper proposes a two-stage planning model for decentralized wind turbine siting, capacity setting, and voltage control, which firstly solves the optimal solution of the multi-objective optimization problem through mathematical algorithms, and then further applies the reactive voltage control method to optimize the allocation of turbine capacity between nodes, to achieve the optimal results of the planning of the decentralized wind turbine grid-connection to the distribution network to lower the loss and raise the voltage, and the specific process is shown in Fig. 4.
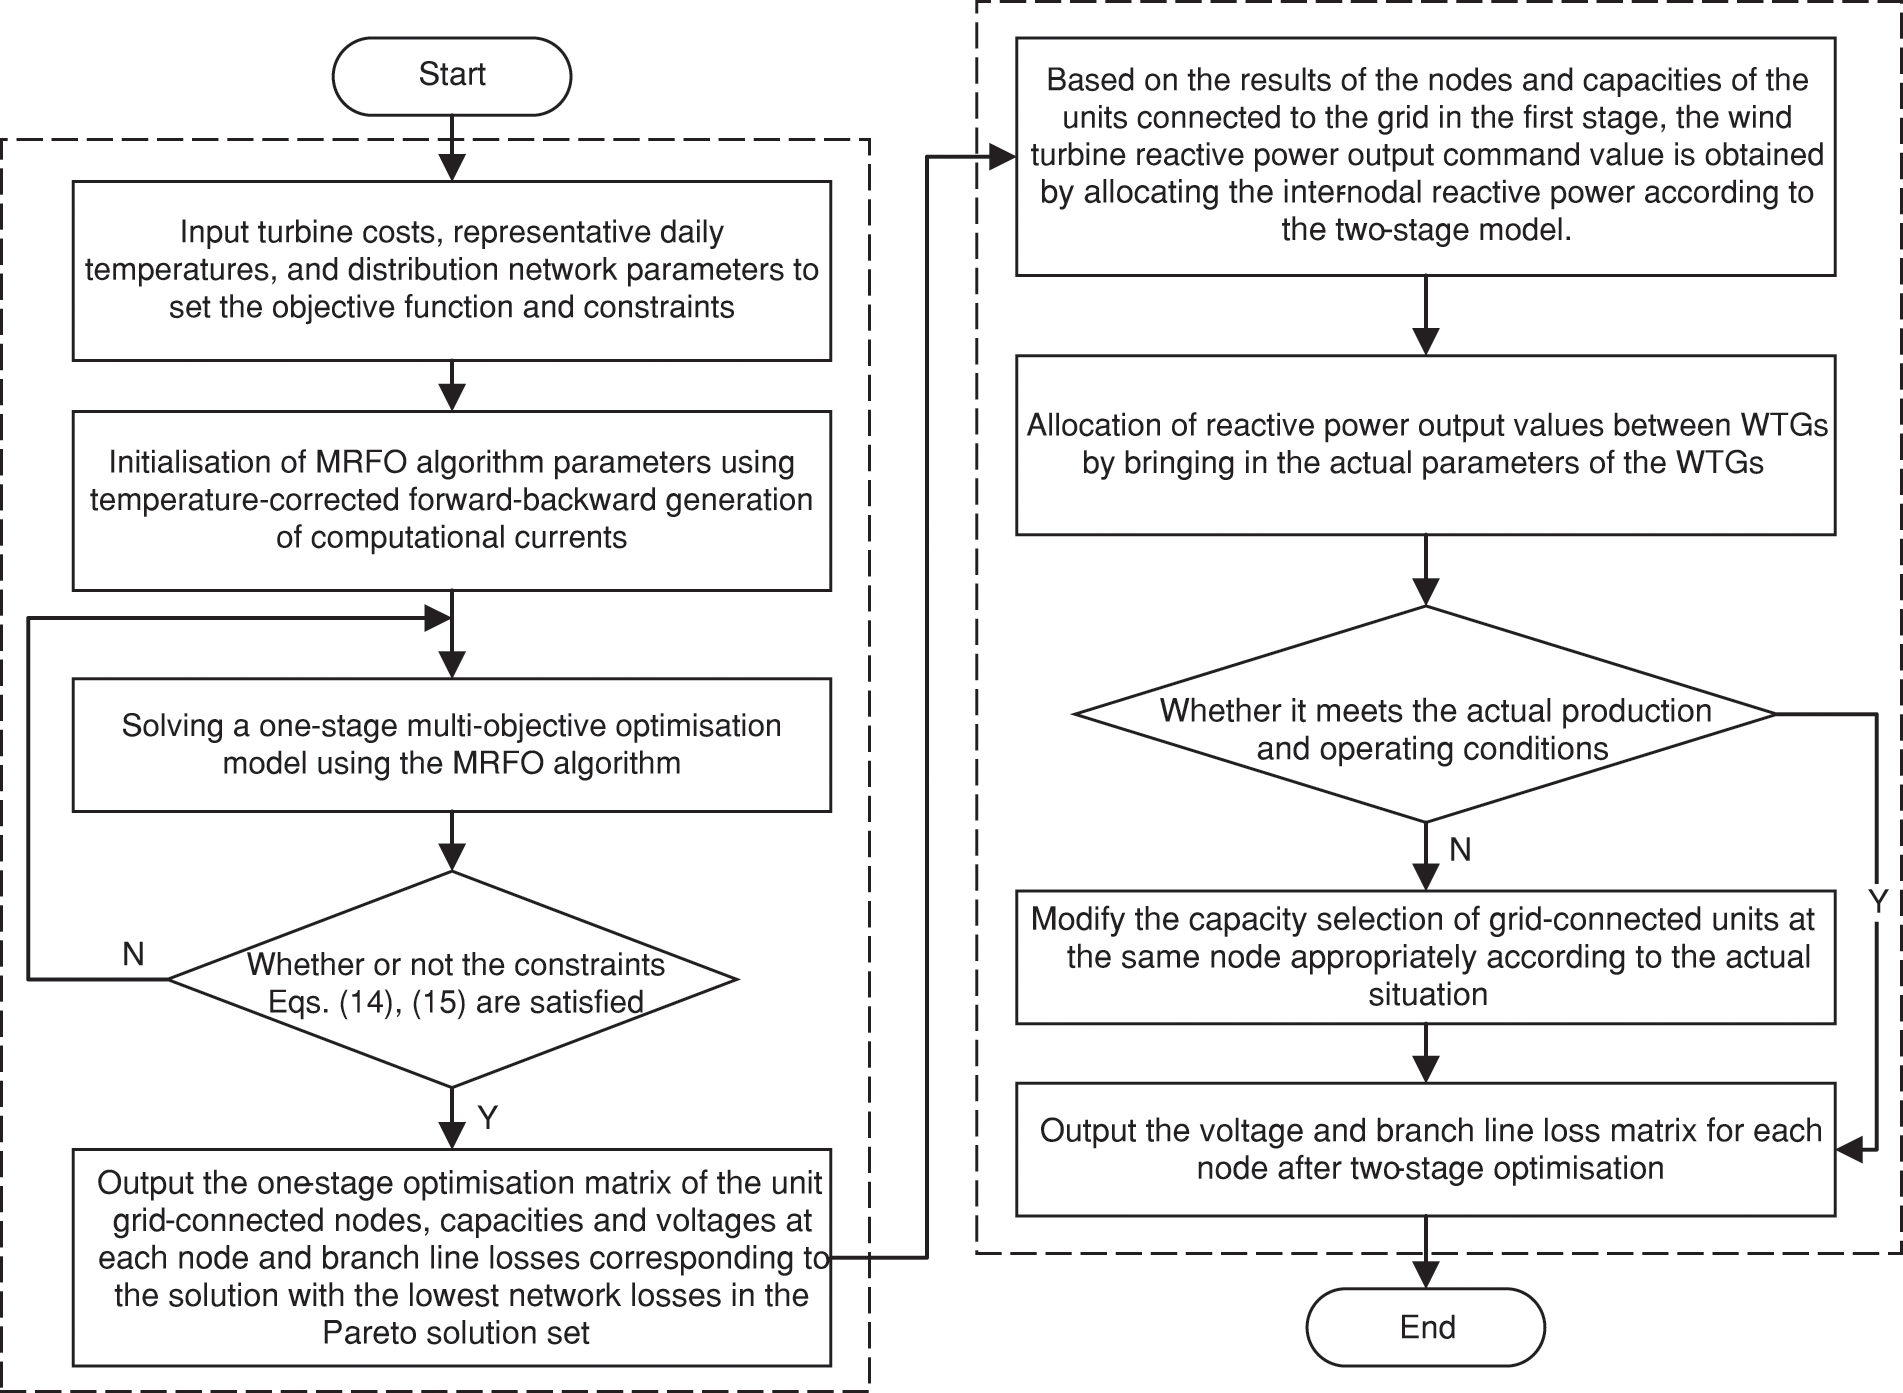
Figure 4: Flowchart of the two-stage optimization model
3.1 First-Stage Wind Turbine Siting and Capacity Modelling
3.1.1 Dynamic Multi-Objective Function Based on Full Life Cycle
The construction of a decentralized wind power siting and capacity search model needs to consider the economic, quality, and environmental protection of distribution network operation, in which the economic issues include the investment cost of the unit and the overall network operating costs. In the traditional investment cost objective function construction process, often ignoring the unit into operation after the maintenance, depreciation, and decommissioning costs, resulting in the calculation of the optimal solution being high and the actual implementation of the loss. Applying the whole life cycle management method to the economic model calculation of decentralized wind power includes all the costs of the wind turbine in the whole life cycle into consideration, and the expression is as follows:
where:
In the actual calculation, taking into account the fluctuation of the economic efficiency of the present value of the expected future investment income for a limited period and the inevitable mechanical aging depreciation phenomenon in the operation of the wind turbine, using the economic constraints based on the whole life cycle by adding the discount rate coefficient constitutes a dynamic expression of the whole life-cycle objective function, which will be divided into four phases of the unit’s operation: the construction period, the trial period, the stabilization period, and the aging period, as shown in Eq. (7):
where:
For the penalty cost
where:
For the operating cost
where:
Finally, considering the benefits of decentralized wind power grid integration on voltage quality improvement, the geometrical distance between the measured node voltages and the rated voltage is used to represent the voltage offset as a way of describing the voltage quality of the power supplied by the distribution network, as shown in Eq. (12):
where:
In summary, through the optimal configuration of the distribution of reactive current to effectively reduce the distribution network losses while maximizing the turbine to meet the economy of operation and take into account the power quality, the comprehensive objective function to meet the system constraints, the minimum optimization of the above three objective functions, the expression is as follows:
Eq. (14) indicates that the active and reactive power supplied by the original distribution network with the newly connected WTGs should still be normally consumed by the loads.
where:
In addition to the current equation constraints, the access of WTGs should ensure the stability of the original system operation, and the voltage fluctuation of each node is between the minimum and the maximum value; for the node access to the WTGs themselves, the active capacity provided should meet the lower limit of the turbine’s grid-connected capacity and at the same time does not exceed the maximum value of the active power that can be emitted; moreover, to ensure the safety of the system operation, the current flowing in each branch does not exceed the maximum value of the regulations, and the expression is as follows:
where:
3.2 Two-Stage Wind Turbine Reactive Power Control Strategy Modelling
Based on selecting the WTG nodes and total demand capacity according to the optimal configuration scheme, combined with the independent parameters of each WTG, the loss reduction and voltage boosting effect of the distribution network can be further improved by the fine control of its reactive power output [26–28]. Therefore, a wind turbine reactive power control strategy is proposed, and its flow chart is shown in Fig. 5.
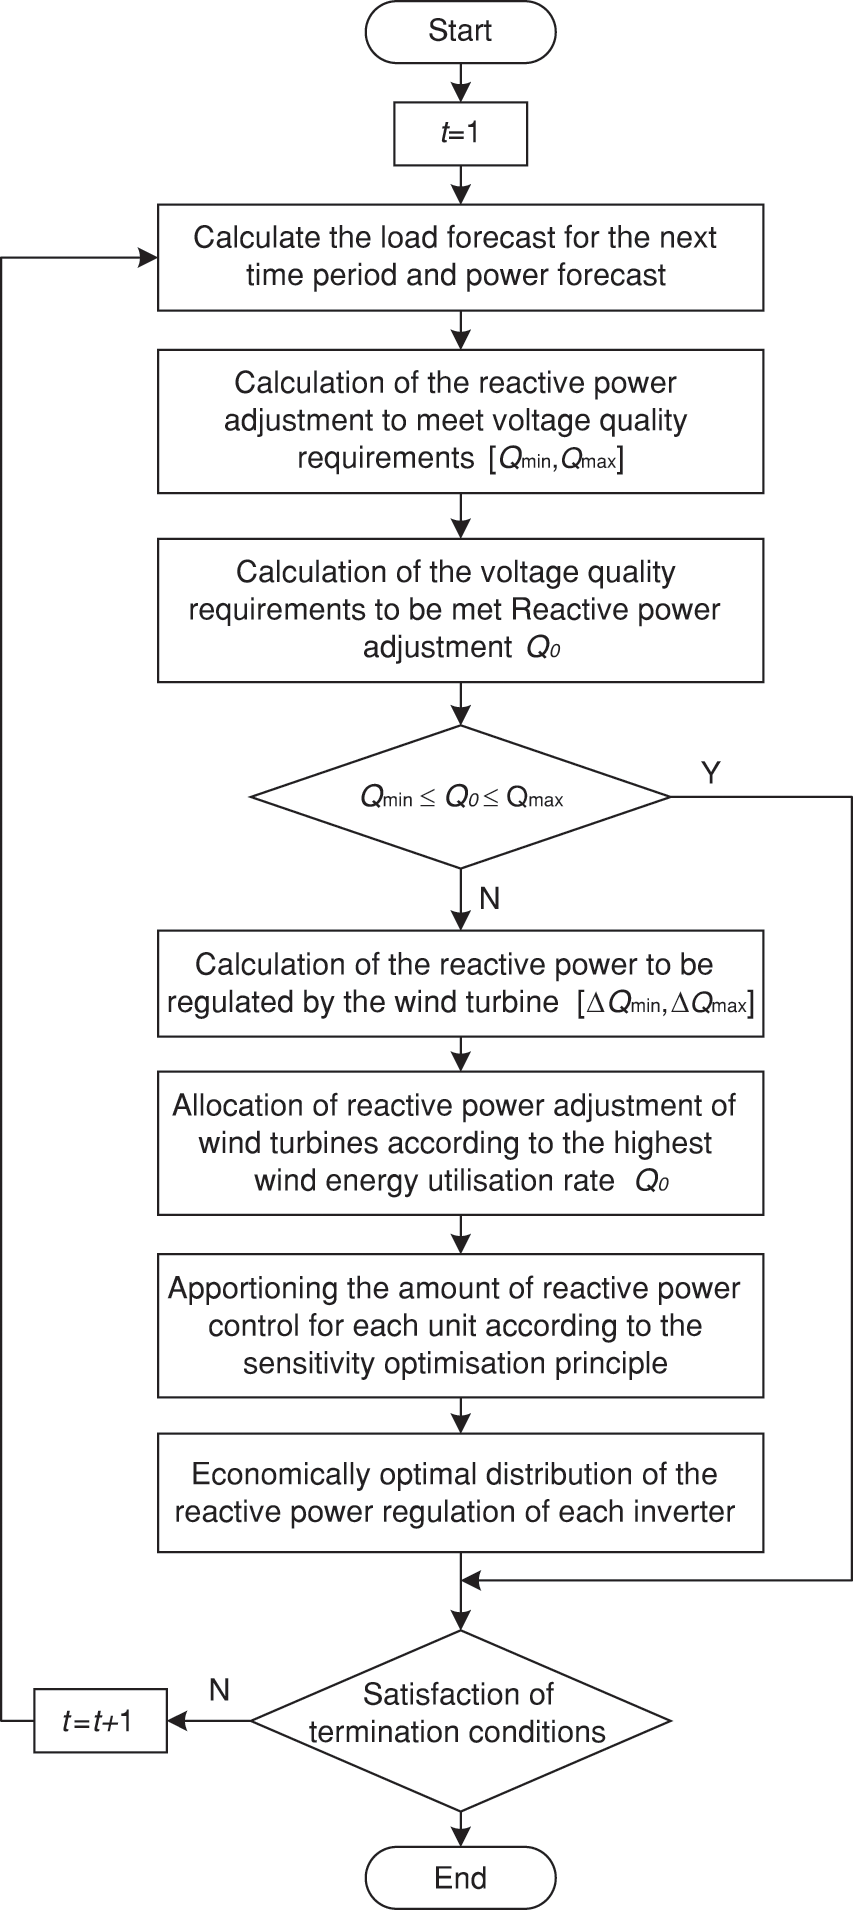
Figure 5: Flow chart of reactive power control strategy
3.2.1 Wind Turbine Reactive Power Regulation Characteristics
In wind power generation, a doubly-fed wind turbine exchanges energy with the grid through the stator and rotor, and the rotor is connected to the grid by an inverter, and the active and reactive output can be adjusted by controlling the inverter [29–31]. The reactive power output from the stator-side and grid-side converter of a doubly-fed wind turbine is adjustable, in which the reactive power from the stator-side has less influence on the rotor-side active power and does not cause large fluctuations in the DC bus voltage, while the reactive power output from the grid-side converter has a larger influence on the rotor-side active power.
The expressions for the grid-side reactive power regulation range
where:
According to Eqs. (16) and (17), the expression of the reactive power regulation range
3.2.2 Reactive Power Control Strategy
For the optimal control of reactive power in wind turbines, the traditional control modes such as the constant voltage control mode will reduce the voltage quality and wind energy utilization, and it is more difficult to control [32], the strategy proposed in the paper can effectively solve the above problems.
Firstly, according to the system load prediction and unit power prediction of the next period, ensure that the voltage quality of the control point is within the normal range, calculate the interval value of the reactive power adjustment quantity, and take the part that does not satisfy the adjustment of the reactive power compensation device as the interval value of the reactive power output change. According to the result, the reactive power control quantity is allocated to each wind turbine according to the sensitivity optimization principle, so that the wind energy utilization rate can reach the highest.
If the total reactive power output change interval of the WTGs keeping the system control point voltage in the qualified range
where:
4 Manta Ray Foraging Optimisation Algorithm
The manta ray foraging optimization (MRFO) algorithm mainly includes three optimization methods: chain foraging, spiral foraging, and tumbling foraging, which have the advantages of fast convergence speed and strong optimization capability. For the multi-objective mathematical planning problem involved in the paper, the manta ray foraging optimization algorithm is used to find the optimal solution to obtain a set of Pareto solutions, and the solution with the smallest bus loss in the Pareto solution set is selected as the optimal configuration of wind turbines.
During foraging, the manta ray population forms a foraging chain in which manta rays move towards the target tract. That is, during the iterative process, each individual is updated according to the existing optimal solution as well as the position of the previous individual, with the following expression:
where:
The manta ray population spirals towards the target when it finds a quality target, and the population position is further updated with the following expression:
where:
To enhance the global search capability of the MRFO algorithm, a random position can be used as an extended search space with the following position update expression:
where:
In this process, the manta ray uses the target position as a pivot point and rolls around the pivot point to a new position, thus searching between the original position and the new position with the following position update expression:
where:
The IEEE33 node distribution network system is selected for simulation, and the model structure is shown in Fig. 6. Using MATLAB R2019a simulation, the effectiveness, and reliability of the method proposed in this paper are verified by calculating and comparing the loss of each branch line and the distribution network bus loss before and after using this loss reduction method.
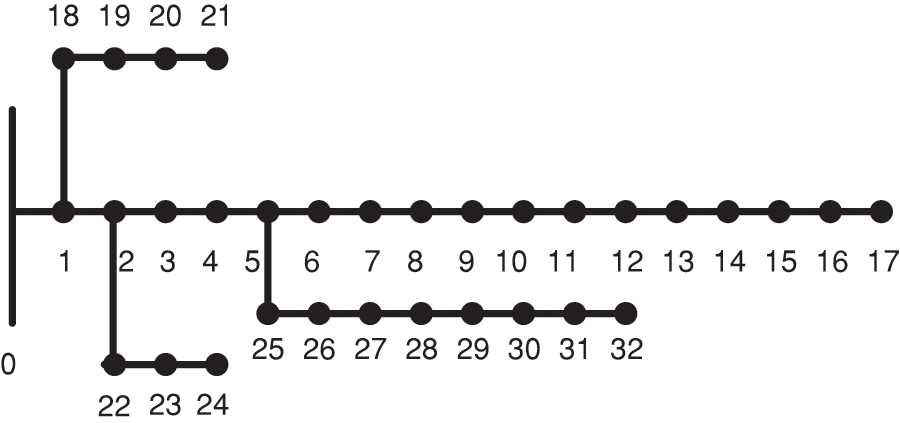
Figure 6: Topology of IEEE33 distribution network
5.1 Optimal Configuration of Wind Turbines
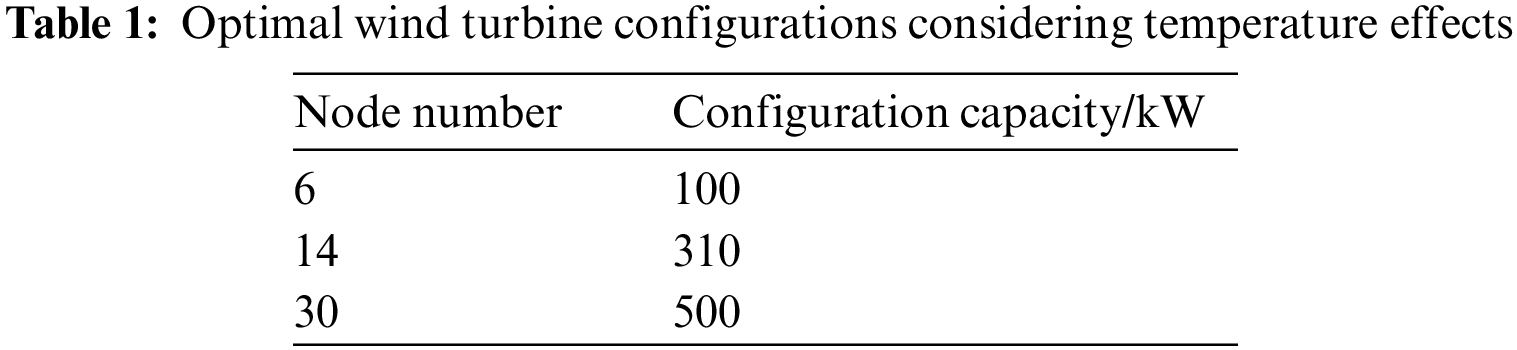
The manta ray foraging optimization algorithm is used to solve the multi-objective optimization problem of wind turbine siting and capacity setting, and after considering the temperature effect, multiple Pareto solution sets are obtained, as shown in Fig. 7. From the figure, if the minimum investment cost is the main objective, the corresponding total voltage deviation and total network loss of grid-connection optimization are larger, then the total voltage deviation and network loss results of grid-connection optimization are not satisfactory; if the minimum value of the total network loss is the main objective, then the obtained results of the total network loss and the investment cost are better than the results obtained by taking the minimum value of the total voltage deviation as the objective. Therefore, priority is given to the stability and economy of distribution network operation after grid connection, and the solution with the smallest bus loss value output from the centralized Pareto solution is selected as the optimal configuration scheme for wind turbines, at which time the corresponding wind turbine grid-connected configuration nodes and the corresponding capacity are shown in Table 1.
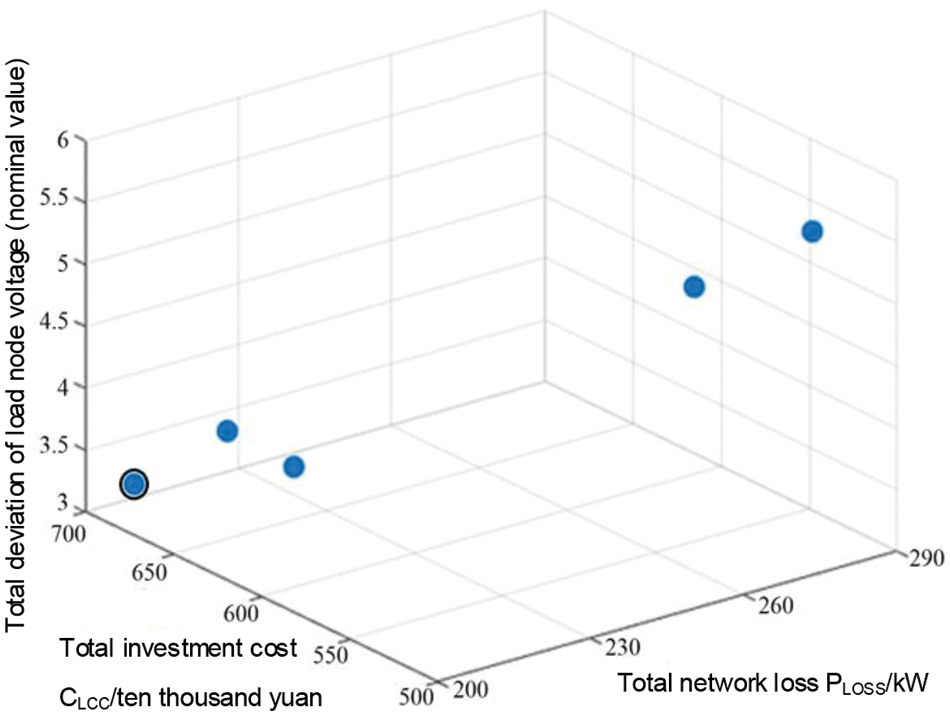
Figure 7: Schematic of the Pareto solution set considering the effect of temperature
Without considering the effect of temperature, the solution yields multiple sets of Pareto solution sets, as shown in Fig. 8, whose corresponding grid-connected turbine configuration schemes are shown in Table 2. A comparison of the results in Figs. 7 and 8 and Tables 1 and 2 shows that the temperature factor affects the configuration and scheduling of WTGs, and after considering the temperature effect, a WTG configuration scheme with a smaller value of total network loss can be obtained.
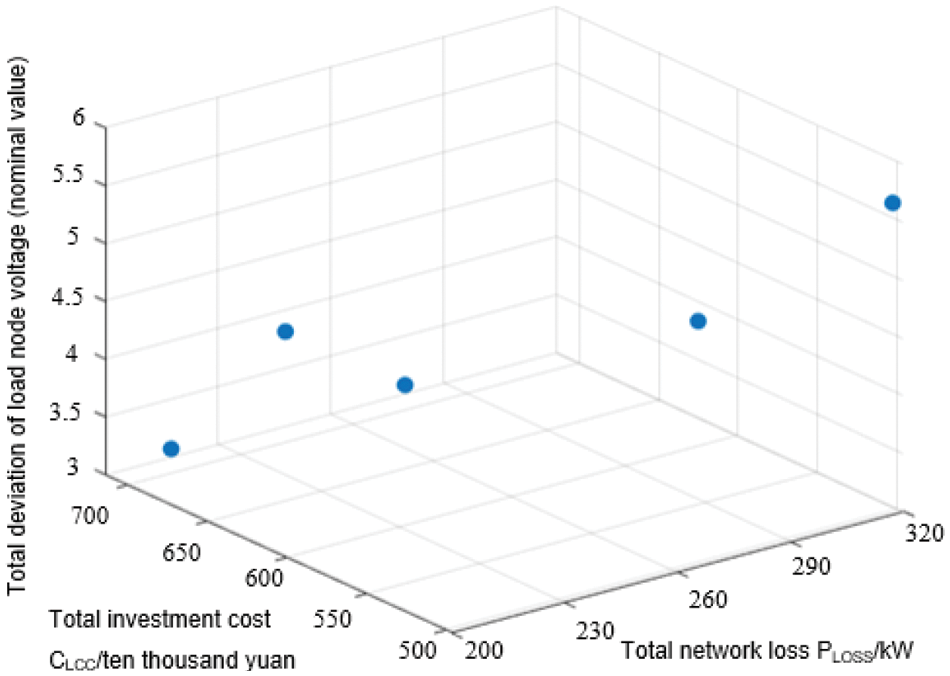
Figure 8: Schematic of the Pareto solution set without considering the effect of temperature
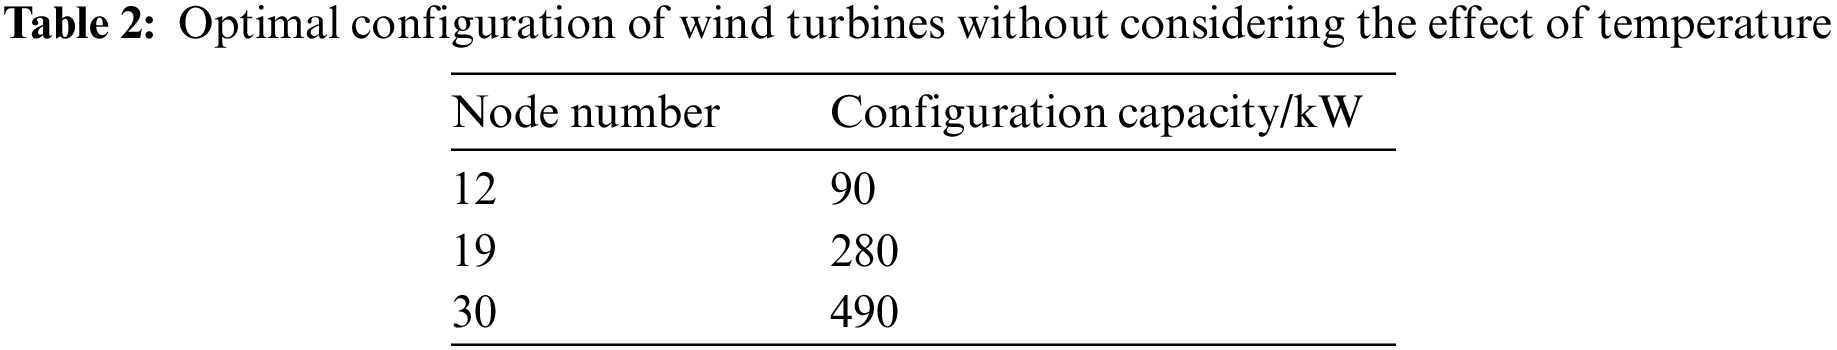
Fig. 9 shows the convergence curve of the model solution, in which the adaptation value is the algorithm convergence adaptation value, and the adaptation value refers to the value of the objective function. The objective function in this paper is the minimum optimization of the three objective functions of the entire cost of the wind turbine in the whole life cycle, the overall line loss of the distribution network, and the offset of the voltage, so the smaller the value of the algorithm’s convergence fitness is the better. From Fig. 9, it can be seen that the algorithm in this paper converges quickly within 10 iterations and stabilizes at 120 iterations. This shows that the solution algorithm used in this paper has good convergence, and also verifies the feasibility of the method.
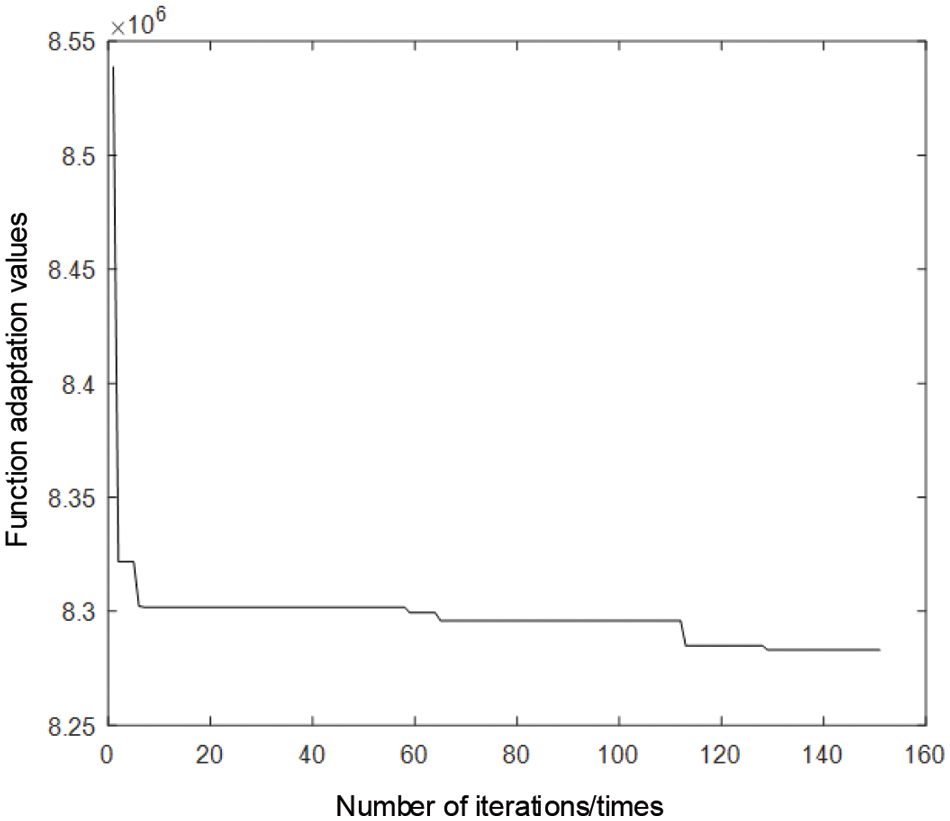
Figure 9: Convergence diagram
After the WTGs are connected to the grid according to the optimal configuration scheme under the consideration of the temperature effect, the voltage of each node and the loss of branch lines are compared with the original distribution grid, as shown in Figs. 10 and 11. The comparison shows that the node voltage is improved after accessing the optimally configured WTGs, which proves that the method can improve the stability of distribution network operation. At the same time, some of the high-loss branches compared to the original line loss decreased significantly, the total network loss is only 102 kW, proving that the access of wind turbines has played a certain degree of loss reduction effect.
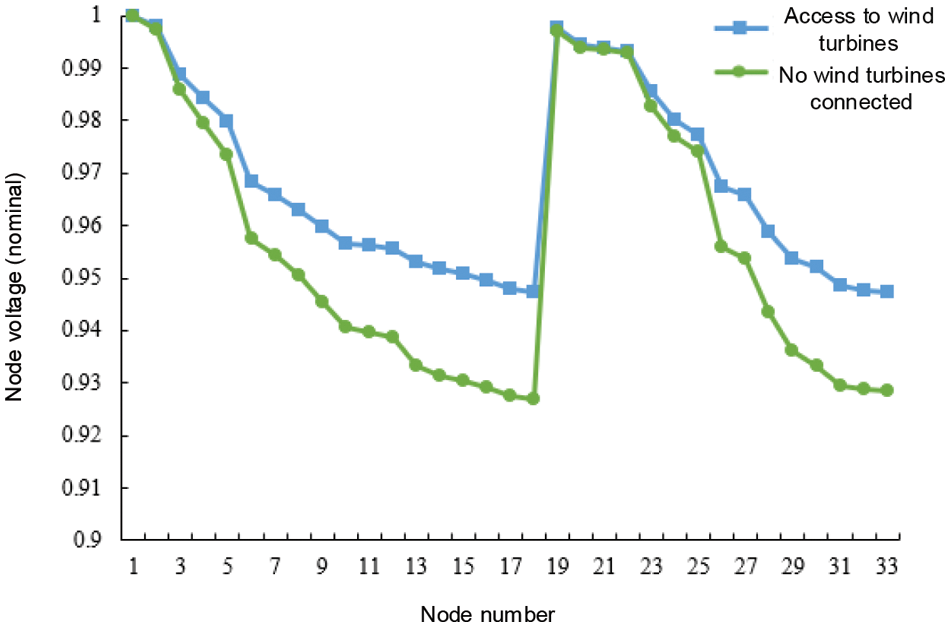
Figure 10: Voltage at each node obtained by applying the optimal configuration scheme considering the effect of temperature
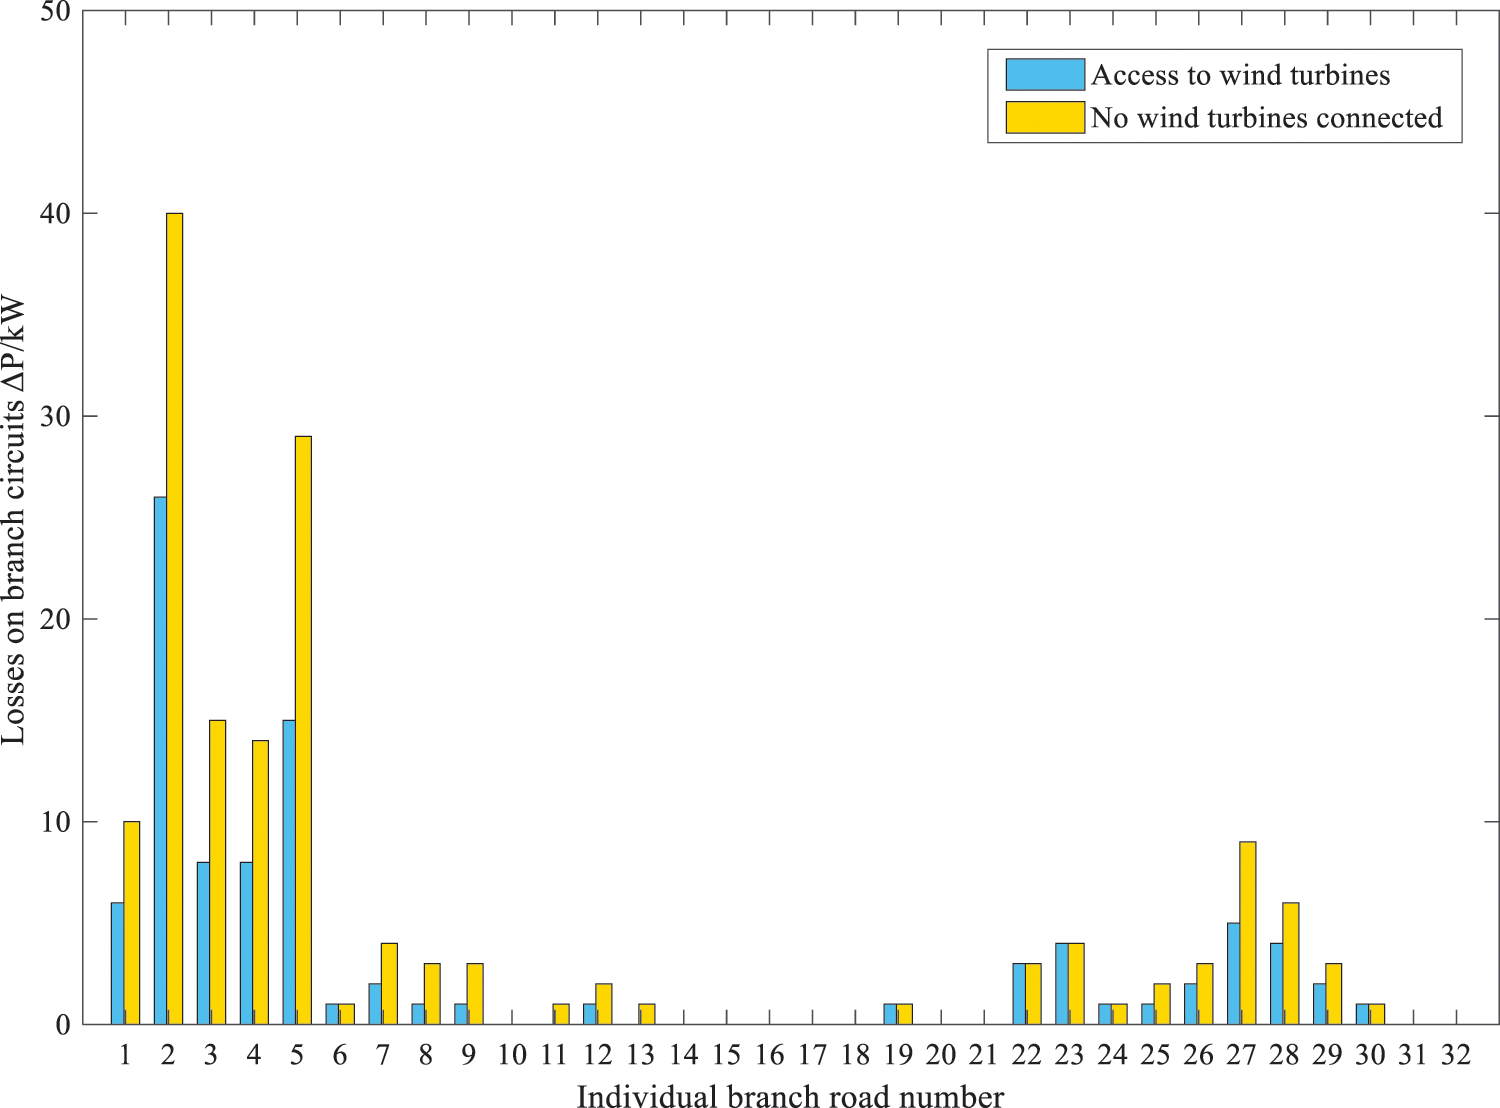
Figure 11: Losses in each branch line obtained by applying the optimal configuration scheme that takes into account the effect of temperature
Without considering the influence of temperature, after the WTGs are connected to the grid according to the optimal configuration scheme, the voltage of each node and the branch line loss are compared with the original distribution grid results, as shown in Figs. 12 and 13. As shown by the comparison of Figs. 10 and 12, the voltage of each node affected by temperature is higher than that without considering the effect of temperature, therefore, considering the effect of temperature can improve the stability and reliability of distribution network operation. As shown by the comparison of Figs. 11 and 13, the branch line losses are relatively low in the case of temperature influence, therefore, considering the temperature influence can reduce the line losses of the distribution network, which is beneficial to the operation of the distribution network.
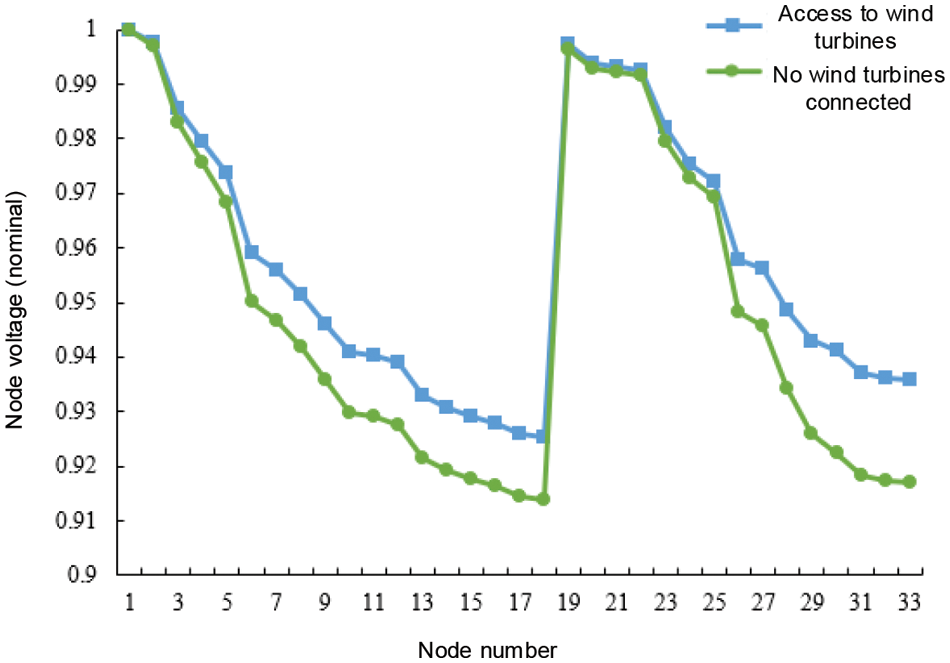
Figure 12: Voltage at each node obtained by applying the optimal configuration scheme that does not take into account the effect of temperature
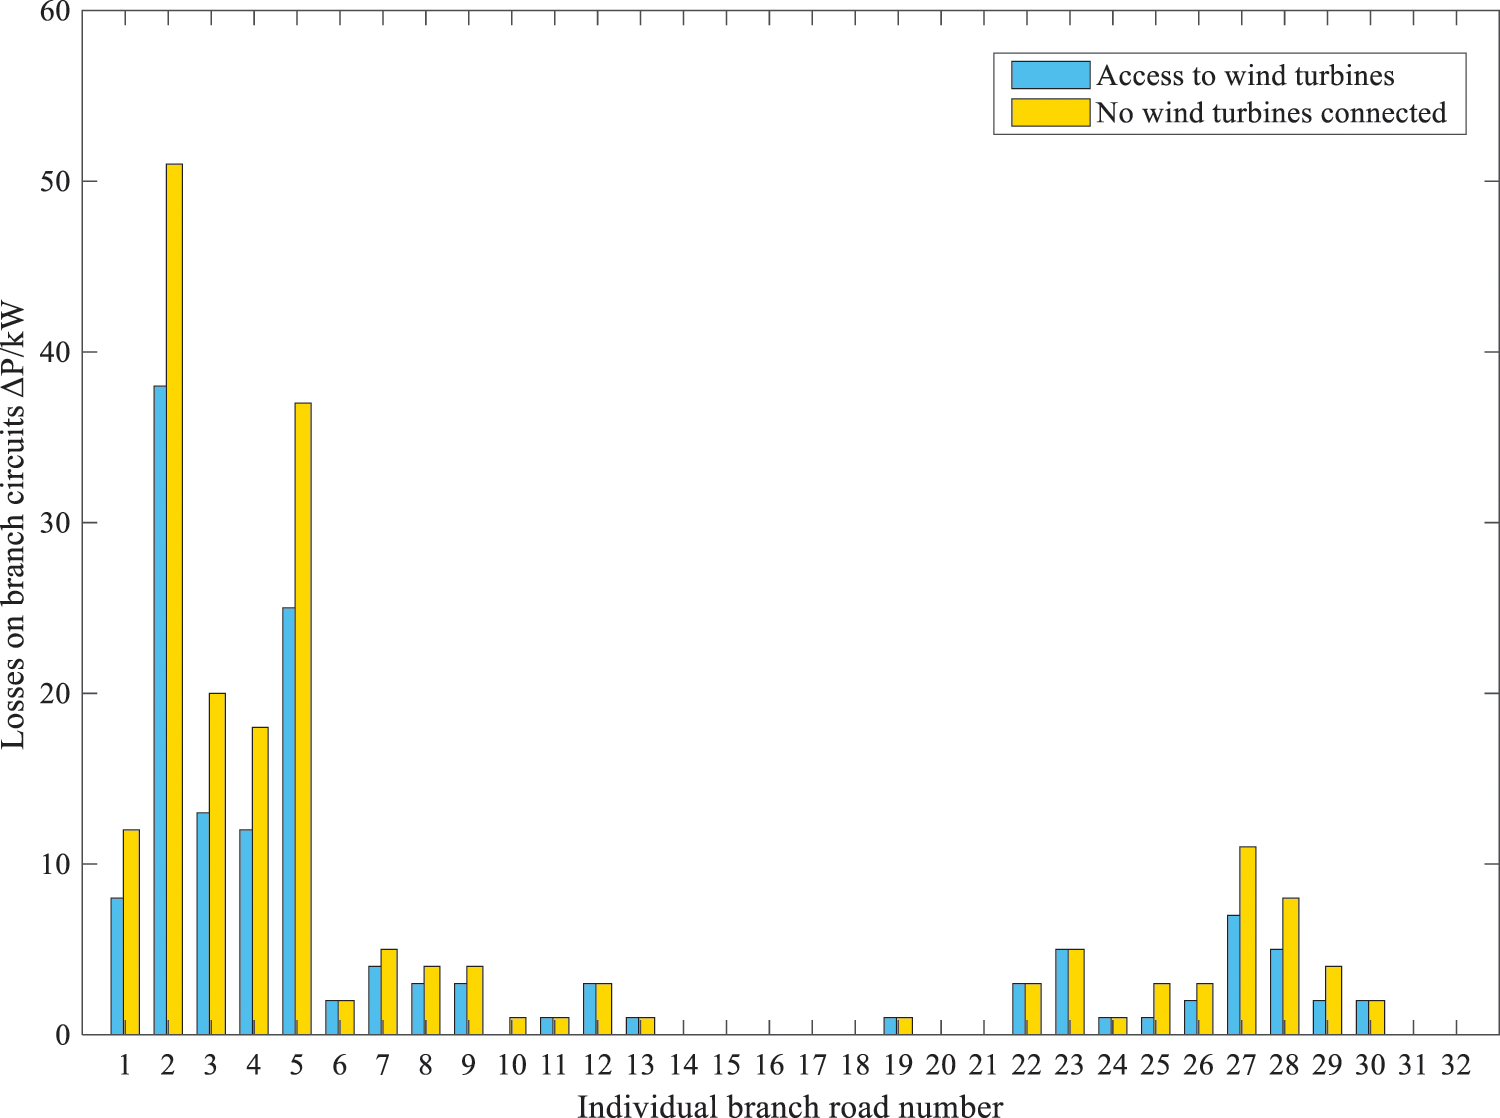
Figure 13: Losses in each branch line obtained by applying the optimal configuration scheme that does not take into account the effect of temperature
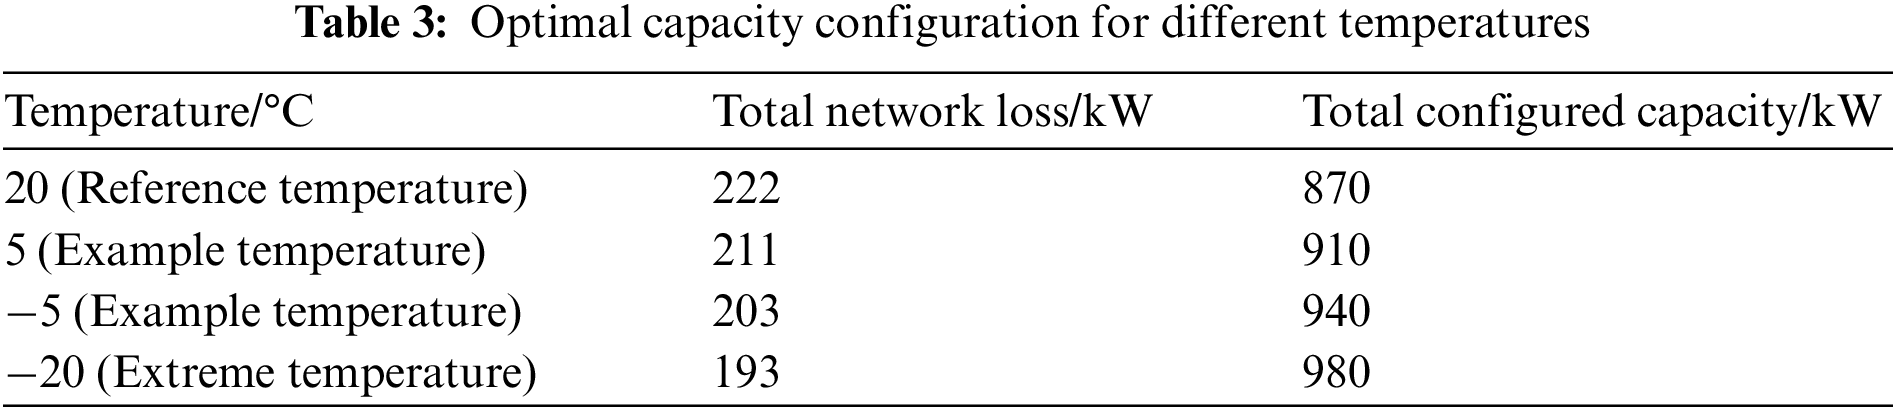
Considering the extremely cold weather conditions, the operating temperature of the distribution network is set to −20°C, then the results of the optimal configuration of decentralized wind power under different temperatures are shown in Table 3. From the table, it can be seen that the total network loss of the distribution network is 222 kW and the total configured capacity is 870 kW in the case not affected by the temperature; after temperature correction, the network loss is 211 kW and the total configured capacity is 910 kW in the case of 5°C; 203 kW and the total configured capacity is 940 kW in the case of −5°C; and in the case of the limiting temperature of −20°C, the total network loss is 193 kW and the configured capacity is 980 kW. Therefore, the total distribution network loss without considering the effect of temperature has a difference of 5% and the total configuration capacity has a difference of 4% compared to the temperature-corrected network loss. As the temperature decreases, the corrected total distribution network loss gradually decreases and the total allocation capacity gradually increases, proving that the temperature factor affects the allocation and dispatch to some extent. As the distribution network operating in extremely cold temperature conditions has a smaller calculated network loss, the distribution network can be consumed by the abandoned wind power is also larger, allowing a larger capacity of wind turbines connected to the grid to play a more reactive power allocation role, which explains the necessity of decentralized clean energy in the northwest and northeast of China, such as vigorously pursued.
5.2 Optimal Control of Reactive Voltage
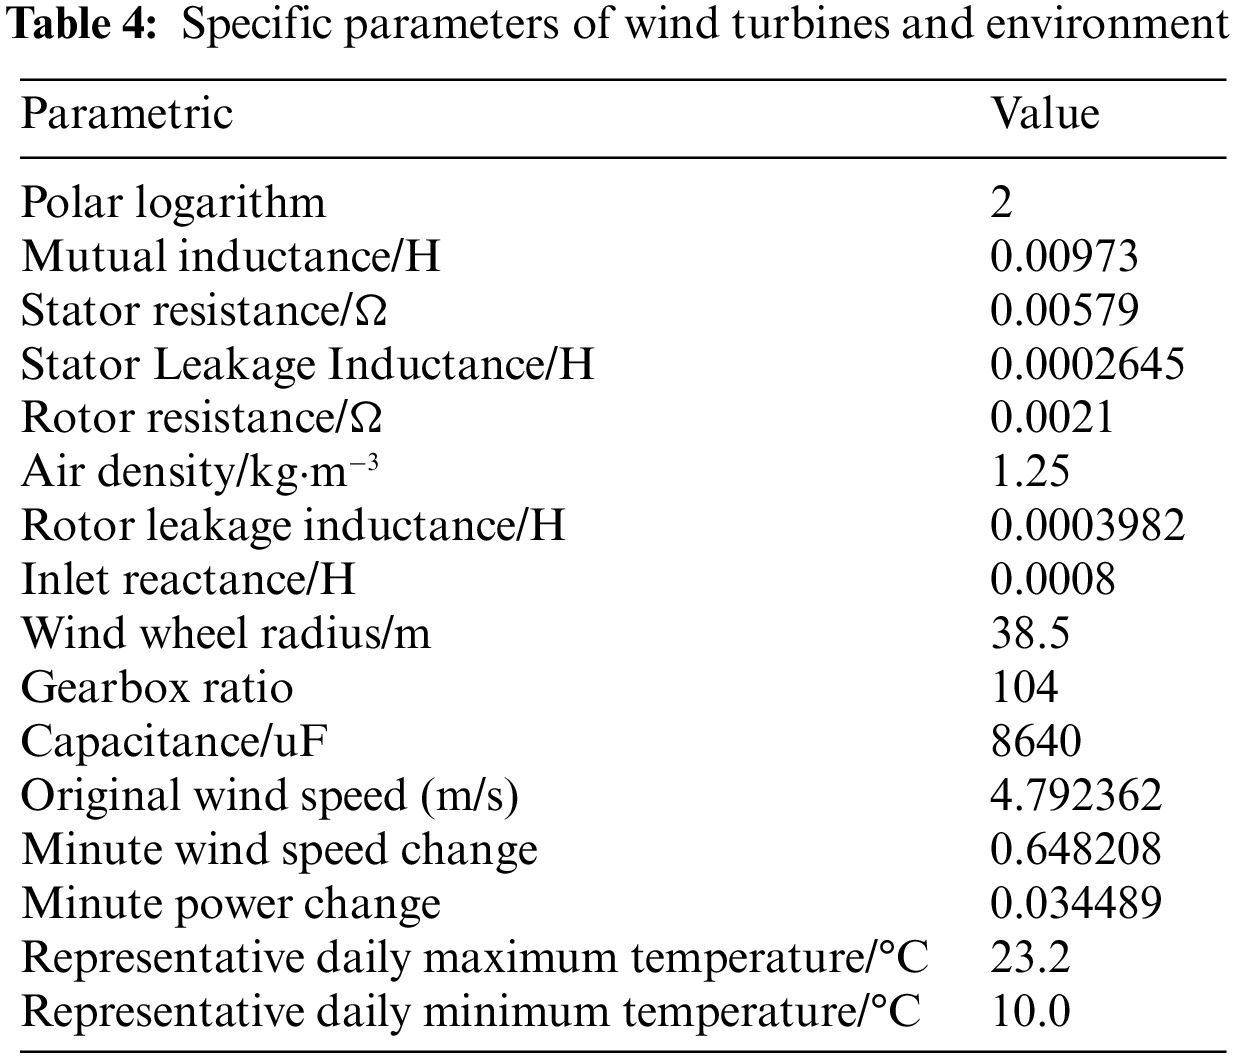
After considering the effect of temperature on network losses in extremely cold regions, the optimized optimal configuration capacity of WTGs is obtained. Under this capacity configuration, the reactive voltage control strategy for WTGs is formulated. Through calculations, node 6 accesses a WTG with a rated capacity of 100 kW, and node 30 accesses five WTGs with a rated capacity of 100 kW. Combined with the reality of the production conditions, there is no extremely close wind turbine capacity, and there is a security risk when the turbine accessed by the same node operates with too large a gap in capacity, therefore, the demand for 10 kW is ignored at node 14, and only three WTGs with a rated capacity of 100 kW, the specific parameters of the wind turbine and the operating environment are shown in Table 4.
Before and after the adoption of wind turbine reactive voltage control strategy of the node voltage and the branch line loss, as shown in Figs. 14 and 15. The node voltage value without the reactive voltage control strategy is significantly lower than the result of adopting the reactive control strategy, and the loss value of each branch line without the control strategy is significantly higher than the result of adopting the reactive control strategy. The use of a reactive voltage control strategy can reach the optimization goal of minimum line loss. Wind turbines connected through decentralized capacity can further increase the nodal voltage and improve the stability of distribution network operation. This simulation result verifies the effectiveness of the multi-objective two-stage decentralized wind turbine siting and capacity allocation and reactive voltage optimization control method considering the network loss correction in extremely cold regions.
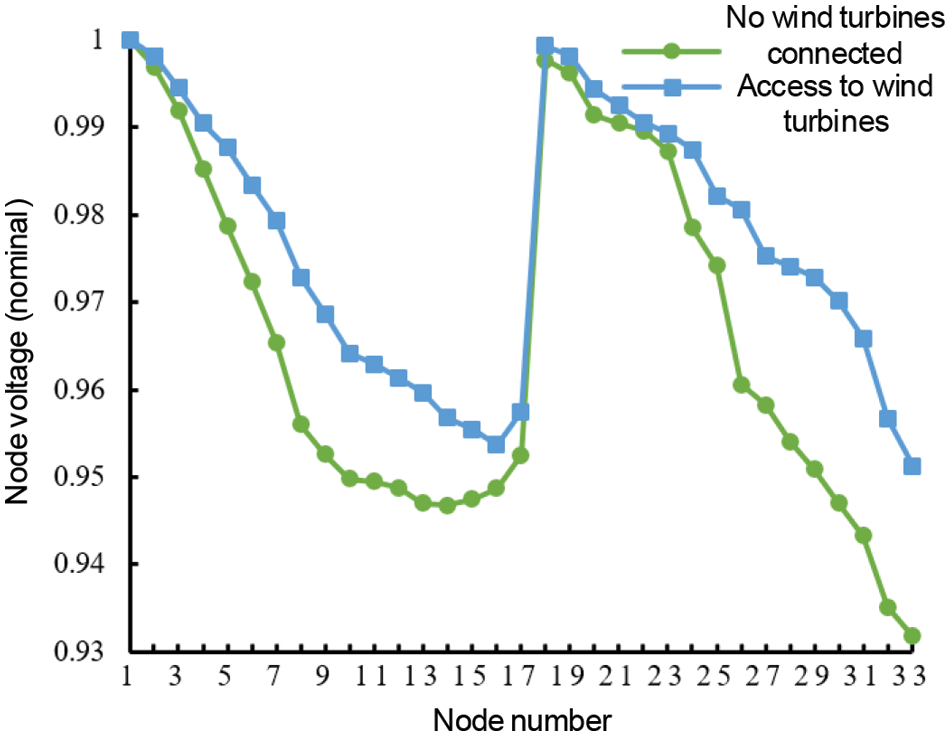
Figure 14: The voltage curve after applying the reactive power control strategy
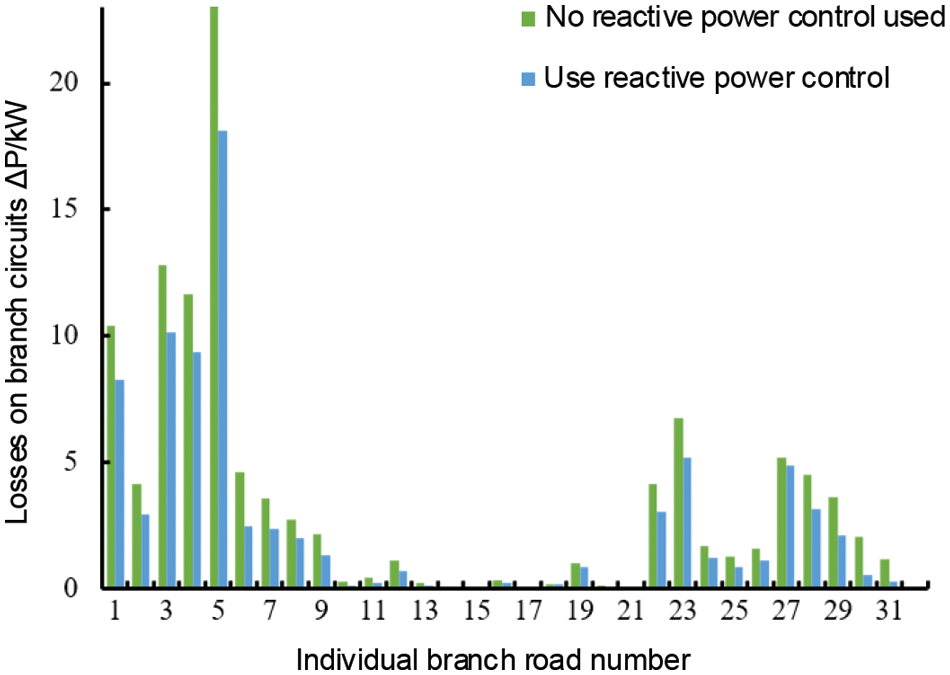
Figure 15: The line loss curve after applying the reactive power control strategy
In this paper, a two-stage decentralized WTG planning method considering temperature-corrected distribution network losses, WTG life cycle investment costs, and supply voltage quality is proposed based on the distribution network topology, an optimal allocation scheme for WTG siting and capacity determination in the distribution network is obtained by solving the problem using the MRFO algorithm, and a reactive voltage control strategy for decentralized integration of WTGs into the network is formulated, as shown in the simulation results:
(1) Decentralised wind power as a distributed power grid connection can improve the overall voltage level of the distribution network through reasonable planning, and promote the reliability and security of distribution network operation.
(2) The reactive power issued by the wind turbine as reactive power compensation can effectively reduce the line loss of each branch of the distribution network, reasonable distribution of access to the location and capacity of the wind turbine, not only to meet the power demand of the load to enhance the distribution network scheduling capacity but also to promote the distribution network operation economy, in response to the national energy-saving emission reduction call.
(3) Areas with sufficient clean energy such as wind and light are often accompanied by extreme weather factors that need to be accounted for, such as large temperature differences between day and night, and in the case of lower temperatures, the low-temperature environment in cold regions can reduce the total system network loss, thus enhancing the configurable capacity of local wind turbines. As the temperature decreases, the corrected network loss of the distribution network gradually decreases and the total allocated capacity of wind turbines gradually increases, the amount of wind power generation that can be consumed by the distribution network is greater, allowing larger capacity WTGs to be connected to the grid to play more of a reactive power allocation role. The method described in the paper provides an effective solution to the problem of voltage uplift and loss reduction in the operation of distribution networks in extremely cold areas, which is of guiding significance for the future planning of distribution networks in China.
Acknowledgement: The authors gratefully acknowledge the financial support provided by the National Natural Science Foundation of China (NSFC) program: Disaster-causing Mechanisms and Risk Assessment of Extreme Space Weather on Large-Scale Power Grids in China.
Funding Statement: This work was supported by the National Natural Science Foundation of China (52177081).
Author Contributions: The authors confirm their contribution to the paper as follows: study conception and design: Y.J. and C.L.; data collection: Y.J. and C.L.; analysis and interpretation of results: Y.J., C.L. and H.K.; draft manuscript preparation: Y.J. and C.L. All of the authors reviewed the results and approved the final version of the manuscript.
Availability of Data and Materials: The data provided in this article can be used as a reference for research.
Conflicts of Interest: The authors declare that they have no conflicts of interest to report regarding the present study.
References
1. Li, X. P., Zhao, W. Z., Lu, Z. G. (2023). Hierarchical optimal reactive power dispatch for active distribution network with multi-microgrids. Journal of Electrical Engineering & Technology, 18(3), 1705–1718.
2. Yu, P., Wan, C., Sun, M. Y., Zhou, Y. Z., Song, Y. H. (2022). Distributed voltage control of active distribution networks with global sensitivity. IEEE Transactions on Power Systems, 37(6), 4214–4228.
3. Yang, T. S., Guo, Y., Deng, L. R., Sun, H. B., Wu, W. C. (2021). A linear branch flow model for radial distribution networks and its application to reactive power optimization and network reconfiguration. IEEE Transactions on Smart Grid, 12(3), 2027–2036.
4. Wu, H. Y., Dong, P., Liu, M. B. (2018). Random fuzzy power flow of distribution network with uncertain wind turbine, PV generation, and load based on random fuzzy theory. IET Renewable Power Generation, 12(10), 1180–1188.
5. Meng, L., Yang, S. B., Hu, X. K., Yang, X., Zhou, W. et al. (2020). The influence of high permeability distributed photovoltaic access on power grid. 2020 4th International Conference on HVDC, pp. 449–453. Xi’an, China.
6. Ma, C., Duan, Q., Wang, H., Mu, Y. (2022). Multi-objective dynamic network reconstruction method for active distribution network including distributed generation and electric vehicles. 2022 5th International Conference on Energy, Electrical and Power Engineering, pp. 612–617. Chongqing, China.
7. Taha, H. A., Alham, M. H., Youssef, H. K. M. (2022). Multi-objective optimization for optimal allocation and coordination of wind and solar DGs, BESSs and capacitors in presence of demand response. IEEE Access, 10, 16225–16241.
8. Kryonidis, G. C., Malamaki, K. N. D., Gkavanoudis, S. I., Oureilidis, K. O., Kontis, E. O. et al. (2021). Distributed reactive power control scheme for the voltage regulation of unbalanced LV grids. IEEE Transactions on Sustainable Energy, 12(2), 1301–1310.
9. Sallam, M. E., Attia, M. A., Abdelaziz, A. Y., Sameh, M. A., Yakout, A. H. (2022). Optimal sizing of different energy sources in an isolated hybrid microgrid using turbulent flow water-based optimization algorithm. IEEE Access, 10, 61922–61936.
10. Li, S. B., Kang, Z. T. (2022). Capacity optimization of clean renewable energy in power grid considering low temperature environment constraint. IEEE Access, 10, 2740–2752.
11. Yang, X. Y., Yang, J. W., Deng, J. L. (2018). Locating and sizing of distributed generation based on optics inspired optimization. Distribution & Utilization, 35(11), 66–71.
12. Mohamed, I. A., Kowsalya, M. (2014). Optimal size and siting of multiple distributed generators in distribution system using bacterial foraging optimization. Swarm & Evolutionary Computation, 15, 58–65.
13. Yang, L., Fan, C. J., Tai, N. L., Huang, W. T. (2015). Energy storage station locating and sizing based on relay protection and improved algorithm. Transactions of China Electrotechnical Society, 30(3), 53–60.
14. Song, X. K., Xin, P. Z., Li, S., Yang, N. (2019). Robust planning method of distributed generation considering multiple uncertainties. Smart Power, 47(6), 56–63.
15. Zhang, J. P., Zhu, Z. L., Liu, L., Tian, S. X., Zhang, L. B. et al. (2014). Transmission network value planning considering large-scale wind power automation of electric power systems integration. Automation of Electric Power Systems, 38(19), 47–51.
16. Gao, Q., Wei, Z. N., Sun, G. Q., Sun, Y. T., Chen, H. T. et al. (2015). Temperature-dependent power system optimal power flow. Automation of Electric Power Systems, 39(16), 76–80.
17. Banakar, H., Alguacil, N., Galiana, F. D. (2005). Electrothermal coordination part I: Theory and implementation schemes. IEEE Transactions on Power Systems, 20(2), 798–805.
18. Li, Z. N., Su, S., Zhao, Y. M., Jin, X. L., Chen, H. H. et al. (2020). Energy management strategy of active distribution network with integrated distributed wind power and smart buildings. IET Renewable Power Generation, 14(12), 2255–2267.
19. Kuang, H., Mu, X. X., Qin, R. S. (2020). Dynamic reactive power optimization model for a wind farms and energy Storage combined system. 2020 IEEE 20th International Conference on Communication Technology, pp. 1625–1629. Nanning, China.
20. Ai, Y., Du, M., Pan, Z., Li, G. (2021). The optimization of reactive power for distribution network with PV generation based on NSGA-III. CPSS Transactions on Power Electronics and Applications, 6(3), 193–200.
21. Amiri, H. (2023). Analysis and comparison of reactive power optimization using improved genetic algorithm and improved quantum particle swarm algorithm in an active distribution network. 2023 8th International Conference on Technology and Energy Management, pp. 1–4. Mazandaran, Iran.
22. Alguacil, N., Banakar, M. H., Galiana, F. D. (2005). Electrothermal coordination part II: Case studies. IEEE Transactions on Power Systems, 20(4), 1738–1745.
23. Nyam, J., Sergelen, B., Narayanan, K. (2023). Study on weakening the effect of air density changes for increased power capture of individual wind energy conversion system. 2023 5th International Conference on Energy, Power and Environment, pp. 1–5. Shillong, India.
24. Yu, X. L., Zhang, H. X., Wang, M. X. (2018). An algorithm for power system state estimation considering line temperature. Proceedings of the CSEE, 38(9), 2561–2570+2824 (In Chinese).
25. Zhang, X. H., Yan, K. K., Lu, Z. G., Zhong, J. Q. (2014). Scenario probability based multi-objective optimized low-carbon economic dispatching for power grid integrated with wind farms. Power System Technology, 38(7), 1835–1841.
26. Hou, J. X., Wang, X. H., Tao, X. Y., Qi, J., Zhang, S. et al. (2015). Parameter identification method of double-fed wind power electromechanical transient simulation model based on measured data. Electric Power Construction, 36(12), 48–56.
27. Nagano, K., Collins, T., Chen, C. A. (2016). Massively parallel inverse rendering using multi-objective particle swarm optimization. Journal of Visualization, 20(2), 1–10.
28. Yi, J. H., Cherkaoui, R., Paolone, M. (2021). Optimal allocation of ESSs in active distribution networks to achieve their dispatchability. IEEE Transactions on Power Systems, 36(3), 2068–2081.
29. Huang, S., Wu, Q., Guo, Y., Chen, X., Zhou, B. et al. (2020). Distributed voltage control based on ADMM for large-scale wind farm cluster connected to VSC-HVDC. IEEE Transactions on Sustainable Energy, 11(2), 584–594.
30. Sun, J. L., Liu, H. L. (2022). Research on reactive power active control strategy of wind farm considering voltage quality. Computing Technology and Automation, 41(2), 46–50.
31. Nguyen, T. T., Kim, H. M. (2020). Leader-following diffusion-based reactive power coordination and voltage control of offshore wind farm. IEEE Access, 8, 149555–149568.
32. Xie, Z., Liu, K., Zhang, X., Yang, S. Y. (2015). Optimal reactive power control of doubly-fed wind turbine under asymmetric grid voltage surge. Chinese Journal of Electrical Engineering, 35(13), 3211–3220 (In Chinese).
Cite This Article
 Copyright © 2024 The Author(s). Published by Tech Science Press.
This work is licensed under a Creative Commons Attribution 4.0 International License , which permits unrestricted use, distribution, and reproduction in any medium, provided the original work is properly cited.
 Downloads
 Citation Tools