
 Submit a Paper
 Propose a Special lssue
 Open Access
ARTICLE

Identifying Suitable Sites for CSP Plants Using AHP, Fuzzy AHP, and Full Consistency Method: A Case Study of CHAD
1 Efficiency and Energetic Systems Research Group, Physics Department, Alioune Diop University, Bambey, BP 30, Senegal
2 Water, Energy, Environment and Industrial Processes Laboratory, Polytechnic School, Cheikh Anta Diop University, Dakar, BP 5085, Senegal
* Corresponding Author: Bernard Bayangbe. Email:
(This article belongs to the Special Issue: Solar and Thermal Energy Systems)
Energy Engineering 2025, 122(3), 943-969. https://doi.org/10.32604/ee.2025.060273
Received 28 October 2024; Accepted 20 January 2025; Issue published 07 March 2025
 View Full Text
 Download PDF
Abstract
Concentrating Solar Power (CSP) is one of the most promising solar technologies for sustainable power generation in countries with high solar potential, like Chad. Identifying suitable sites is of great importance for deploying solar power plants. This work focuses on the identification of potential sites for the installation of solar power plants in Chad as well as a comparative analysis using the Analytical Hierarchy Process (AHP), Fuzzy Analytical Hierarchy Process (FAHP), and Full Consistency Method (FUCOM). The results show that 35% of the Chadian territory, i.e., an area of 449,400 km2, is compatible with the implementation of Concentrating Solar Power. The North, North, East, Southeast, and East zones are the most suitable. The main criteria for influence are direct normal irradiation, the soil slope, and the water resource. FUCOM gave a weight of 41.9% for Direct Normal Irradiation (DNI) compared to 32.71% and 31.81% for AHP and FAHP. This method can be applied to other renewable energy technologies such as photovoltaics, wind power, and biomass. Combining its different analyses will be a valuable tool for planning any renewable energy project in Chad. This work should also facilitate the techno-economic analysis of future CSP plants in Chad.Keywords
Today, over three-quarters of the world’s population lacks access to electricity and over a third lack access to clean cooking fuels and/or technologies in Africa. Nearly 60% of Africa’s population lives in rural areas [1]. Sub-Saharan Africa has the highest population growth rate at around 2.6% annually [2]. Population growth and increasing urbanization are leading to an increase in energy consumption. Currently, per capita energy consumption in sub-Saharan Africa is about 0.4 toe/capita [3]. Total energy demand and consumption by sector in sub-Saharan Africa differ from country to country. They depend on the level of socio-economic development, the area, the population size, and the availability of energy resources. In Chad, the energy sector is very underdeveloped. Despite this, energy consumption has increased over the past decade, from 1.3 ktoe/capita in 1990 to 2.5 ktoe/year in 2020 [4]. This energy consumption is largely dominated by the traditional use of wood fuels, 82% of which have harmful consequences for forest cover, the population’s health, and the environment. Access to electricity is very low, estimated at 6.4%.
Generators, especially in large cities, dominate the generation fleet. Lack of access to modern energy services such as clean cooking and lighting contributes to the maintenance and increase of poverty in Chad, especially in rural areas. However, Chad has a significant technical potential for concentrated solar power, estimated at 10,284 TWh/year [5]. This potential does not consider constraints related to water resources and geographical position.
Solar power generation is an opportunity for Chad. It should enable it to achieve sustainable development goals such as access to reliable, sustainable, and modern energy services at an affordable cost and poverty eradication. Two solar technologies are used for electricity generation: solar photovoltaic (PV) and CSP. CSPs cover all the techniques of concentrating and transforming DNI into heat at high temperatures, then converting this heat into mechanical and electrical energy using a thermodynamic cycle engine coupled to an alternator. They comprise three main subsystems: a solar collector field, a solar receiver, and an energy conversion system [6]. CSP technologies can store thermal energy and can be hybridized by a fossil or biomass source [7–9]. Despite these advantages, despite their significant solar potential, CSPs are not present in sub-Saharan countries. The lack of information on the identification of sites favorable to the installation of CSPs is one of the obstacles to the deployment of CSPs in Chad.
Identifying potential sites is a complex exercise. Indeed, beyond the resource estimate, other criteria are considered, such as compatibility, land use, economic and energy yield, and negative impacts on the environment and the population.
Numerous research studies have been conducted in different countries worldwide to identify suitable sites for establishing CSPs. This work is distinguished by the Multi-Criteria Decision-Making (MCDM) methods, the evaluation criteria, and the particularities of the study areas. This work mainly used decision support tools such as Analytical Network Process (ANP), Elimination and Choice Translating Reality (ELECTRE), Technique for Order of Preference by Similarity to an Ideal Solution (TOPSIS), AHP, FAHP, in combination with Geographic Information System (GIS). Of the methods mentioned above, the AHP method is the most widely applicable to various types of problems and remains the most successful and popular among the methods MCDM. In addition, it has been widely used for evaluating and selecting renewable energy sites [10]. However, this method suffers from subjectivity because individuals establish the comparison matrices from the AHP method. Therefore, it becomes necessary to consult with experts before aggregating their scores.
Ruiz et al. [11] used a GIS-AHP multi-criteria decision analysis approach to identify the optimal location of solar power plants in Indonesia. Their study focused on the province of West Kalimantan. Significant challenges due to the wide variety of protected areas must be considered, especially in landmarks requiring high-resolution imagery of the global horizontal irradiance (GHI) at 4° of the equators. Although the province has a relatively high GHI value across its entire area, it has been found that only 34% of the area is available for the deployment of solar power plants when protected areas are considered. Ahmed et al. [12] investigated the spatial suitability of large-scale solar power installations in Tanzania. They used GIS analysis combined with MCDM methods. They identified six exclusion criteria to hide unsuitable areas. The AHP was used to determine the weights for seven identified classification criteria. The study identifies four specific locations recommended for CSPs and four for PVs. Levosada et al. [13] used a GIS and an AHP to map suitable sites for concentrated solar power plants in the Philippines. The suitable sites were ranked according to seven ranking factors: direct normal irradiation, slope, typhoon frequency, capacity of the nearest network line, distance to the nearest network line, distance to the nearest road, and distance to the closest body of water. Suitable sites have been found in the following provinces: Ilocos Sur, Pampanga, Mindoro, Masbate, and Maguindanao. These areas have a total area of 27.9 km2 and a total planned capacity of 733 MW. In Eastern Morocco, Alami-Merrouni et al. [14] used the AHP-GIS to choose the most suitable CSP implantation sites considering two CSP cooling modes. Four criteria and eight sub-criteria were selected. Their weights were calculated, and suitability maps were created for CSP plants with dry and wet cooling techniques. The results showed that eastern Morocco can be considered a perfect place for hosting CSP plants. Regarding damp cooling systems, sites highly suitable for hosting CSP plants account for 11.7% of the total area, while 5.5% is the proportion of sites highly suitable for CSP plants with dry cooling systems. Haddad et al. [15] used the AHP GIS to select the appropriate areas for establishing CSPs in Algeria. Their work has made it possible to identify the regions that meet the criteria for establishing CSPs in Algeria. Their results showed that more than 51% of the country’s territory is incompatible with implementing CSPs, mainly due to criteria related to topographical aspects, water availability, and distance from the electricity grid.
Other researchers have chosen FAHP because it reduces subjectivity and is more accurate than AHP. Ouafae et al. have evaluated the technical potential of CSPs in Morocco. Reference [16] a comparative study of AHP and FAHP has been carried out. The results highlighted Morocco’s significant potential, which reaches 21,100.32 TWh/year. As far as distribution is concerned, most regions are appropriate, especially those in the south. It also appears from this study that the FAHP corrects inaccuracies in experts’ ratings.
This article’s novelty lies in its use of the FUCOM multi-criteria analysis model to identify sites favorable to establishing CSP plants and in its comparative study of the AHP, FAHP, and FUCOM methods. To our knowledge, FUCOM has not yet been used for the site selection of CSP plants.
This work aims to identify potential sites for establishing CSPs in Chad by combining multi-criteria analysis tools such as AHP, FAHP, FUCOM, and GIS.
The rest of the document is structured as follows: Section 2 is dedicated to the methodology and presents the study’s framework, restricted areas, MCDM techniques adopted, and criteria used to assess the suitability of CSPs in Chad. Section 3 presents the results obtained, and a discussion is conducted. In Section 4, a conclusion of the work is proposed.
Chad is located between 7th and 24th degrees North latitude and 13th and 24th degrees East longitude. It covers an area of 1,284,000 km2 with an estimated population of 16 million. According to the last administrative division, Chad has 23 regions. Chadian territory presents significant geographical contrasts. The northern third, occupied by the Sahara Desert, is sparsely populated (about 1% of the population). Fig. 1 shows the study area.

Figure 1: Study area
2.2 Approach to Identifying CSP Sites
Identifying sites with high power generation potential is essential for any renewable energy project. The approach (Fig. 2) of this process of identifying areas with greater potential for the installation of CSP plants is structured in two steps:

Figure 2: Methodology
1. Map the areas to be excluded
2. Evaluate the map of suitable areas
2.3 Exclusion of Unsuitable Areas
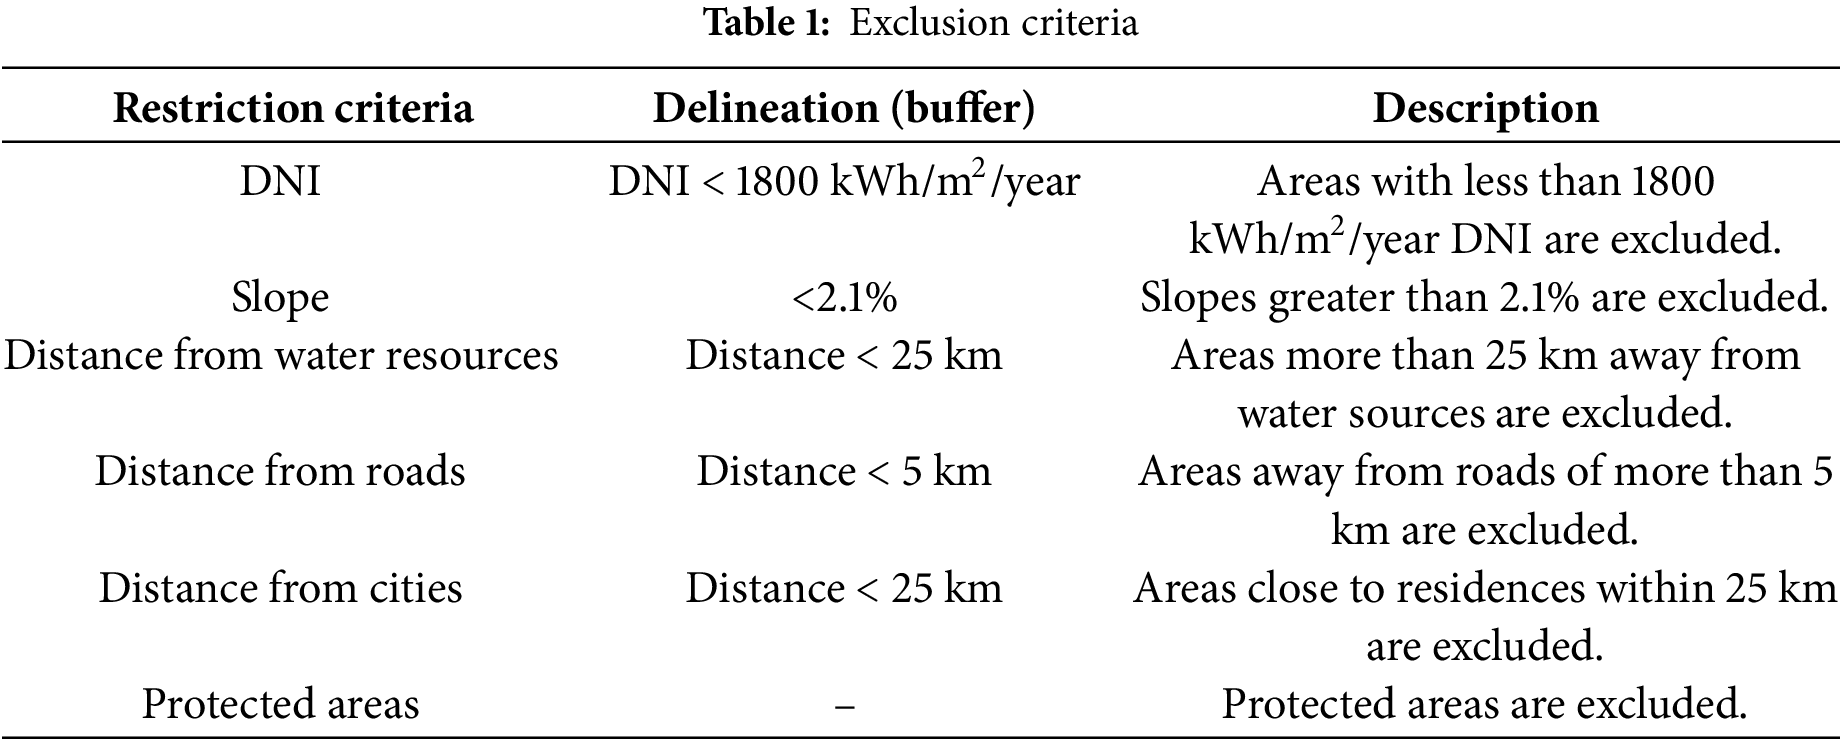
To carry out the multi-criteria analysis, protected areas such as animal parks, protected forests, and tourist sites must be excluded from areas subject to assessment. Chad has 23 protected sites with a total area of 267,716 km2, which corresponds to nearly 20.97% of the territory’s total area. Protected areas are mapped as shown in Fig. 3. To install a CSP plant, the DNI must be at least 1800 kWh/m2/year. Table 1 presents the exclusion criteria used in this study.

Figure 3: Protected areas
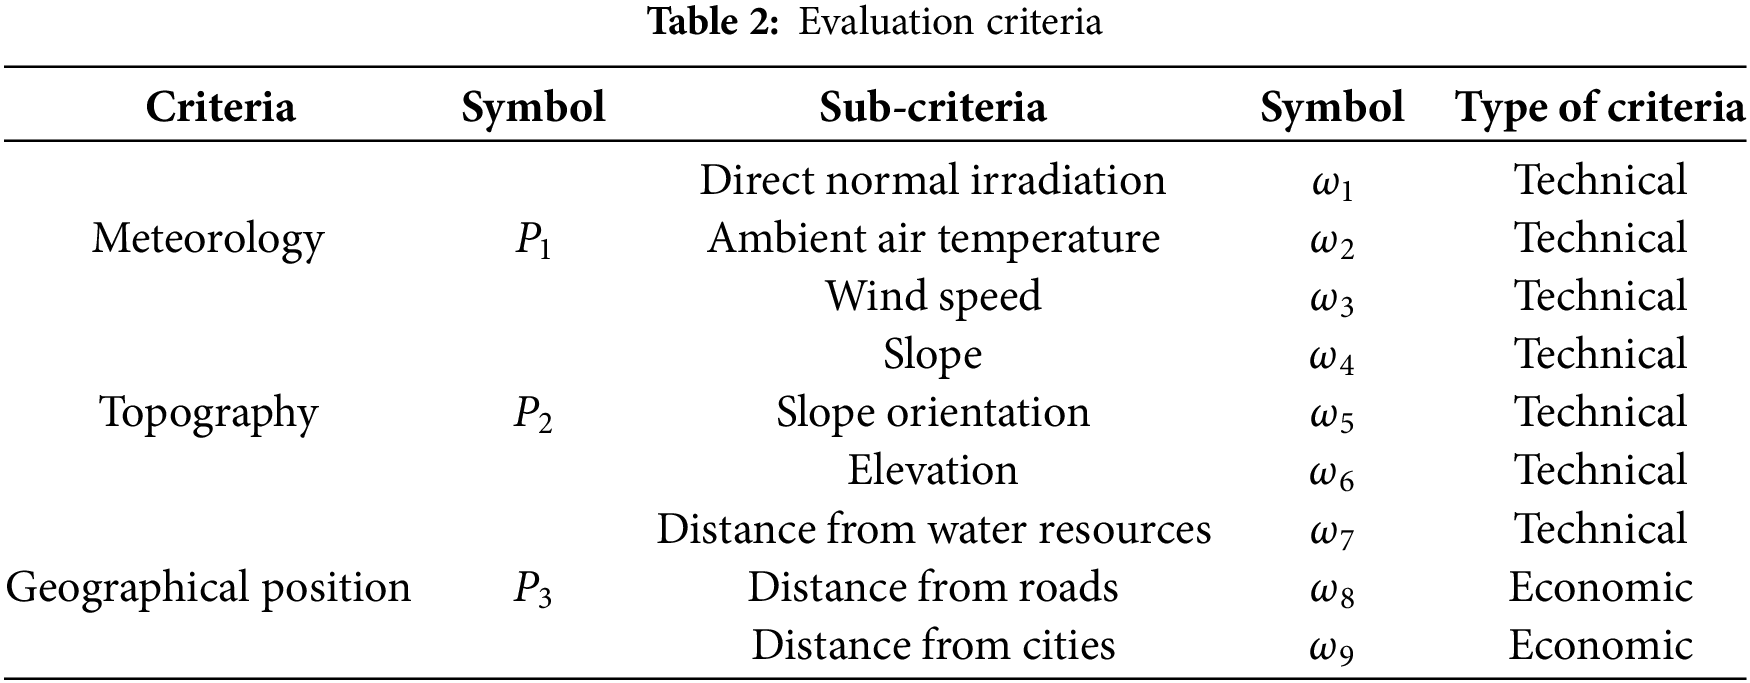
After identifying incompatible areas, compatible areas should be evaluated and prioritized based on their suitability for CSP implementation. The evaluation criteria can be technical, economic, environmental, or social. They are chosen to ensure maximum productivity and minimize the costs associated with on-site installation. Table 2 presents the endpoints selected in this study.
2.5.1 Direct Normal Irradiation
The average annual solar irradiation on the site is the first selection criterion. DNI is a parameter that varies greatly in time and space. Indeed, the yearly DNI can vary by up to 30% from one year to the next [17]. It takes at least 5 years (or 10 years) of measurements to be sure of less than 10 (or 5%) error on its long-term average.
The local ambient air temperature significantly influences the efficiency of a concentrated solar system. It affects the efficiency of the solar receiver and storage system mainly due to convection losses with air that occur either by wind (forced convection) or by gravity (free or natural convection).
Typhoons or hurricane zones are unsuitable for installing concentrated solar power plants. Very high wind speeds disturb the monitoring installations of solar collectors, such as the heliostats in a tower solar power plant [18].
2.6 Water Availability and Proximity to Water Sources
Distance from water resources
Water is crucial for many solar thermal power plants [19]. Fresnel linear reflectors and parabolic collectors can consume 3000 L/MWh, and solar towers 2000 L/MWh.
2.7 Geographical Position of the Site
Knowing the distances from urban areas ensures we are not encroaching on land reserved for dwellings. At the same time, it allows us to know which locality closest to the site meets the needs of the energy produced by the plant. The electricity produced by the CSP plant is intended for consumption, so the site must be located near a residential area.
Roads play an important role in choosing the location of solar thermal power plants. A site far from roads can result in significant installation costs. Road distances were estimated using the ArcMap 10.8 georeferencing software to ensure that potential sites would not be too far from the roads.
The slope of the ground must be considered when choosing sites to install CSP. A higher slope can lead to significant costs related to sun monitoring and affect the plant’s performance [20]. The nature of the land also influences the type of civil engineering work, including earthworks and foundations.
The site’s altitude influences its energy performance by reducing the solar radiation it receives [21]. A higher altitude results in a cleaner sky and, therefore, higher solar fluxes on a clear day, which may lead to the choice of a higher design nominal DNI.
CSP plant sites should face south in the northern hemisphere and northward in the southern hemisphere. In the case of Chad in the northern hemisphere, the best orientations are south, southwest, southeast, east, and west.
The data required for site assessment are diversified and varied. Satellite data are the most widely used for assessing the potential of renewable energies. Average annual solar irradiation at the site is the first selection criterion. Other meteorological parameters, such as ambient temperature and wind speed, can also play an important role. Influenced by many factors, solar resource data varies annually, seasonally, monthly, weekly, daily, and on time scales of up to a few seconds. Solar resource measurements are generally scarce and unavailable, so we were forced to use satellite data. Satellite approaches to estimating solar radiation are essentially based on quantifying the influence of clouds, but they generally require information on atmospheric components to calculate clear-sky transmission. Consequently, although satellite-based methods can provide information on solar irradiance at almost any location on Earth, they cannot always model certain local effects or site-specific characteristics. DNI is a highly variable quantity in time and space. Indeed, the annual DNI can vary by up to 30% from one year to the next. At least 5 years (resp. 10 years) of measurements are needed to be sure of having less than a 10% (resp. 5%) error on its long-term mean [22]. For our project, DNI data for Chad were collected on the Global Solar Atlas site from 1994 to 2018, i.e., 24 years with a resolution of 250 m on the ground. Wind speed data were collected on the Global Wind Atlas at a height of 100 m. Ambient air temperature data were also obtained on the Global Solar Atlas site. Digital Elevation Model data were collected on the European Space Agency site through Copernicus Services with a ground resolution of 30 m. Slope and slope orientation data were derived from the digital elevation model and slope using ArcMap 10.8 tools. Data on administrative boundaries, i.e., towns, roads, and water resources, were obtained from sites diva-gis and geofabrik. These data were initially vector data and were converted to raster data using ArcMap 10.8 software. Data on protected areas have been downloaded for March 2024 from ProtectedPlanet.net.
The original data were in the World Geodetic System (WGS) 1984 global geographic coordinate system. They were then projected into the Universal Transverse Mercator (UTM) 34 N geographic coordinate system corresponding to the case of Chad. Data reclassification or normalization is applied to rank the alternatives regarding grades, intensities, or criteria scores. These ratings can be excellent, very good, good, average, below average, poor, and very poor. Some data were reclassified using the reclassify tool in ArcMap 10.8. Fig. 4a–j presents the different data used for the site assessment.
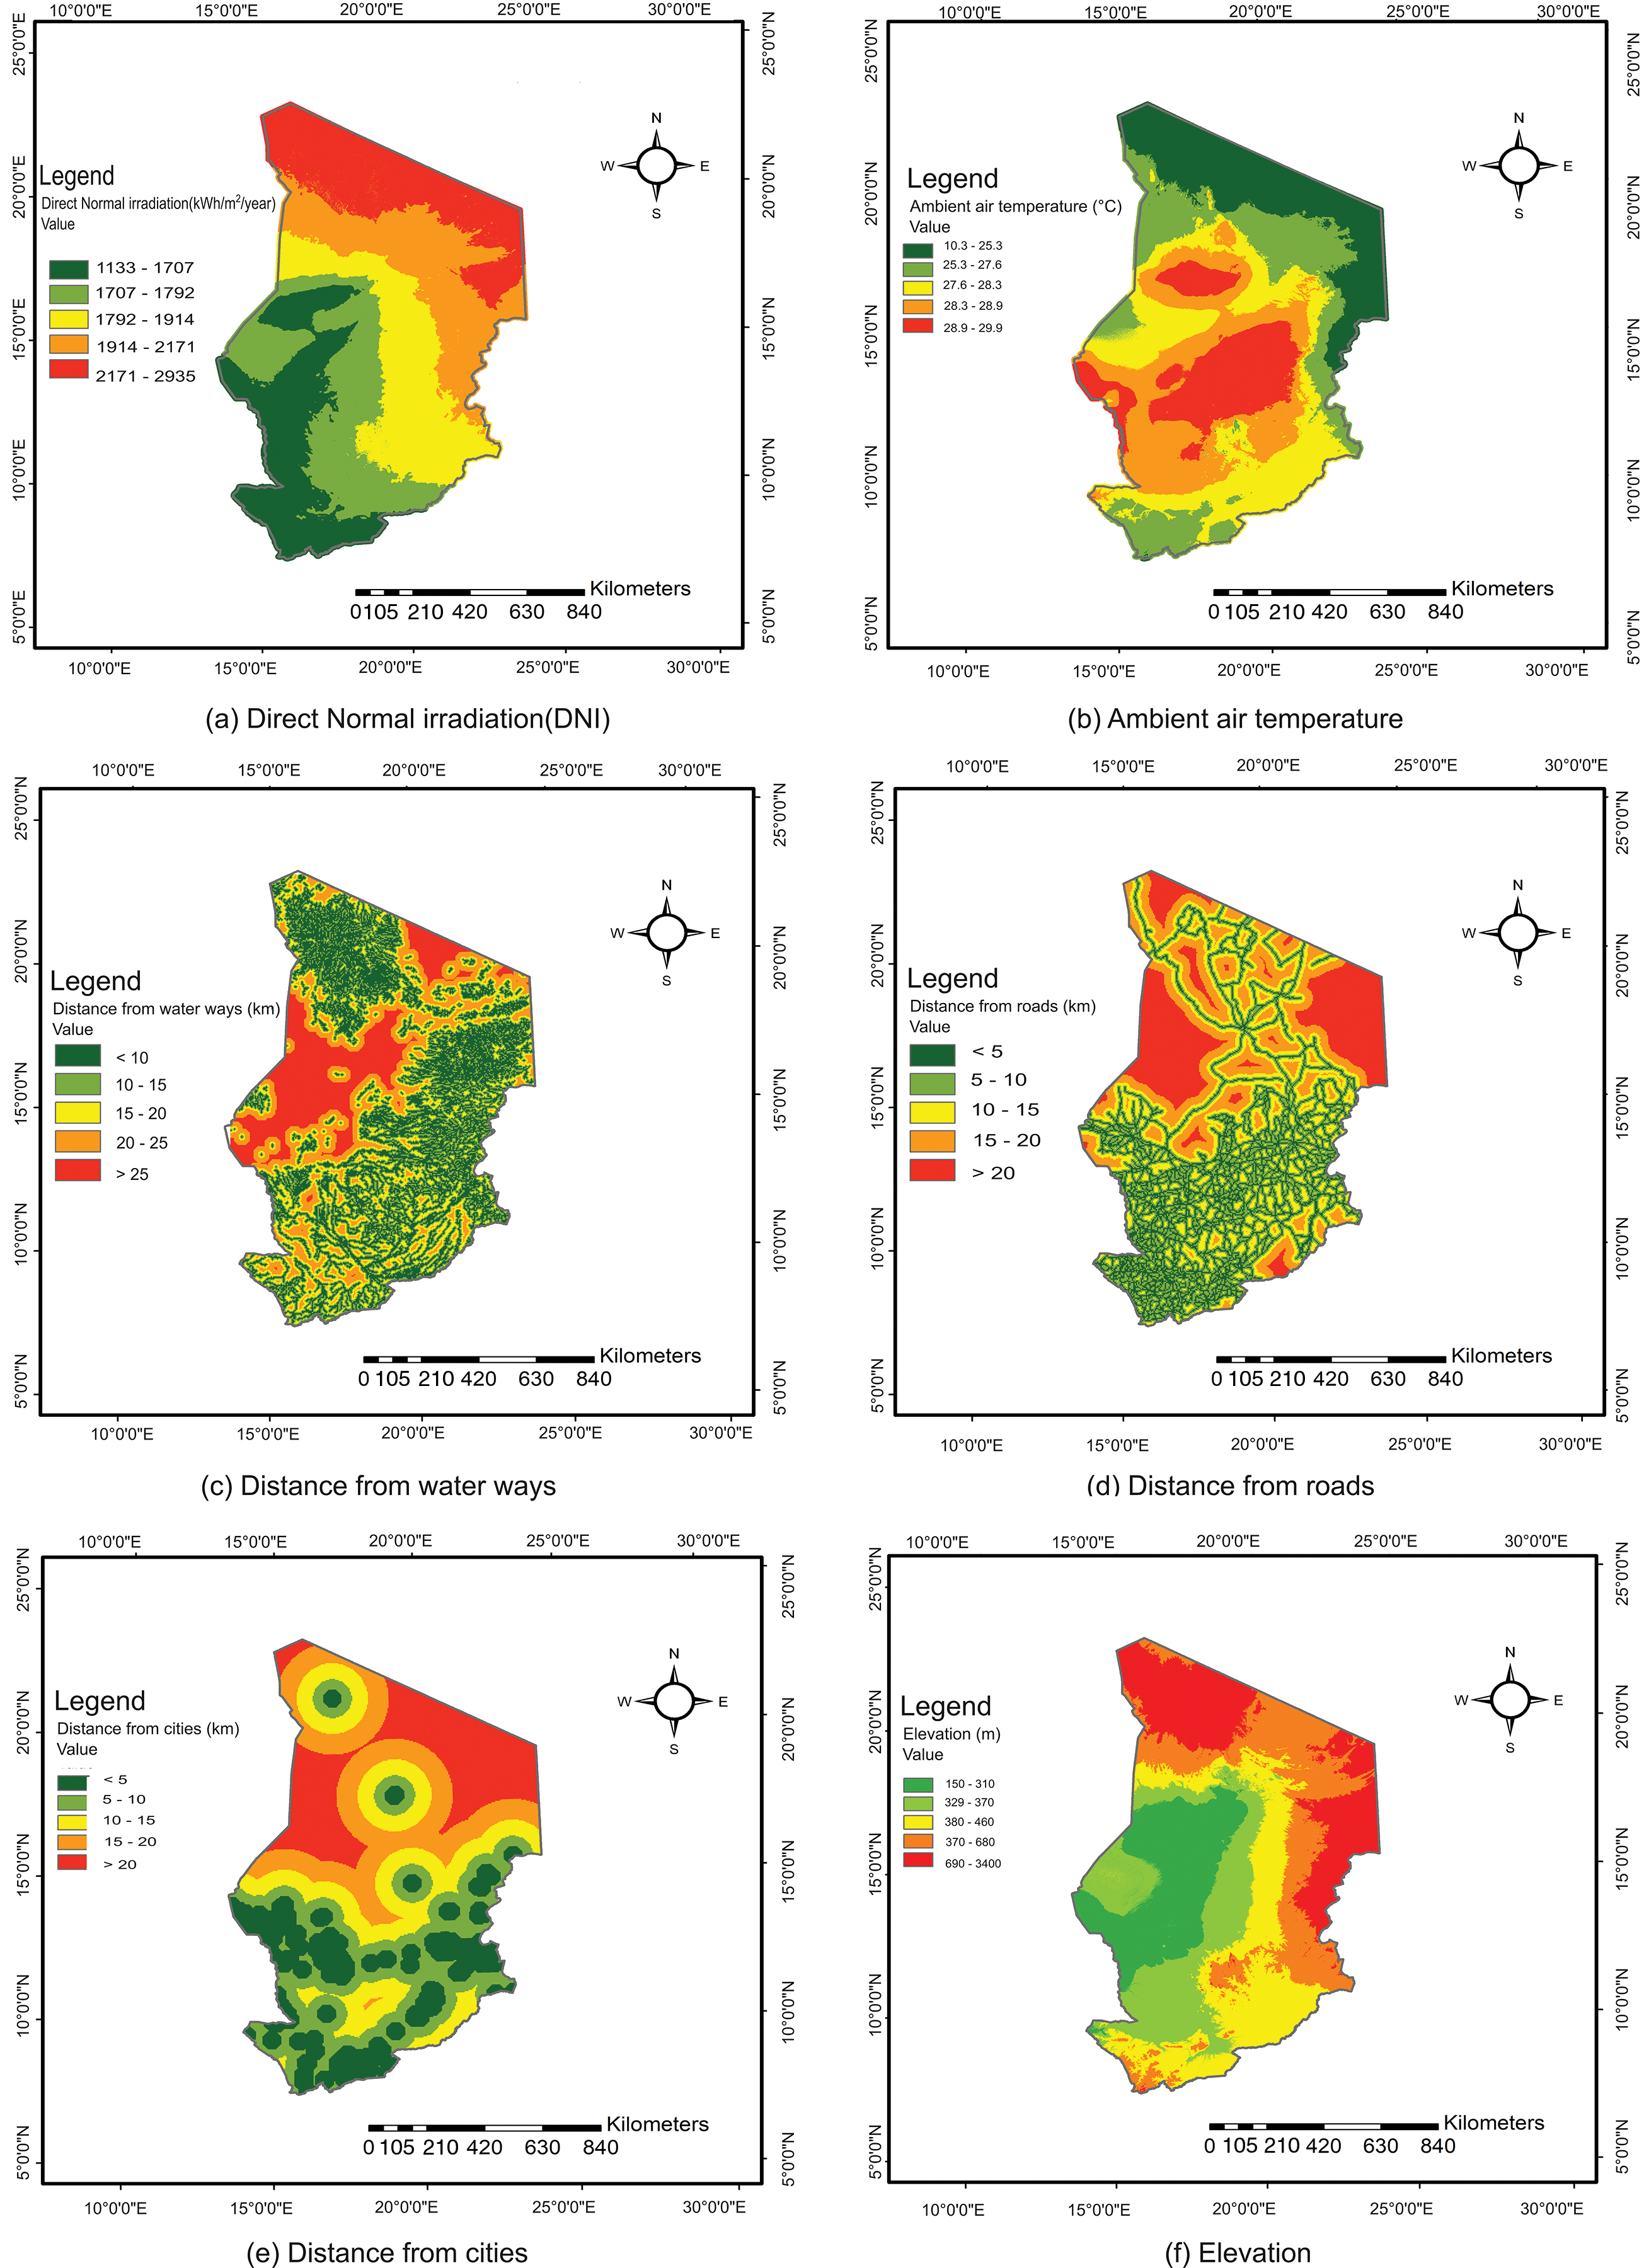
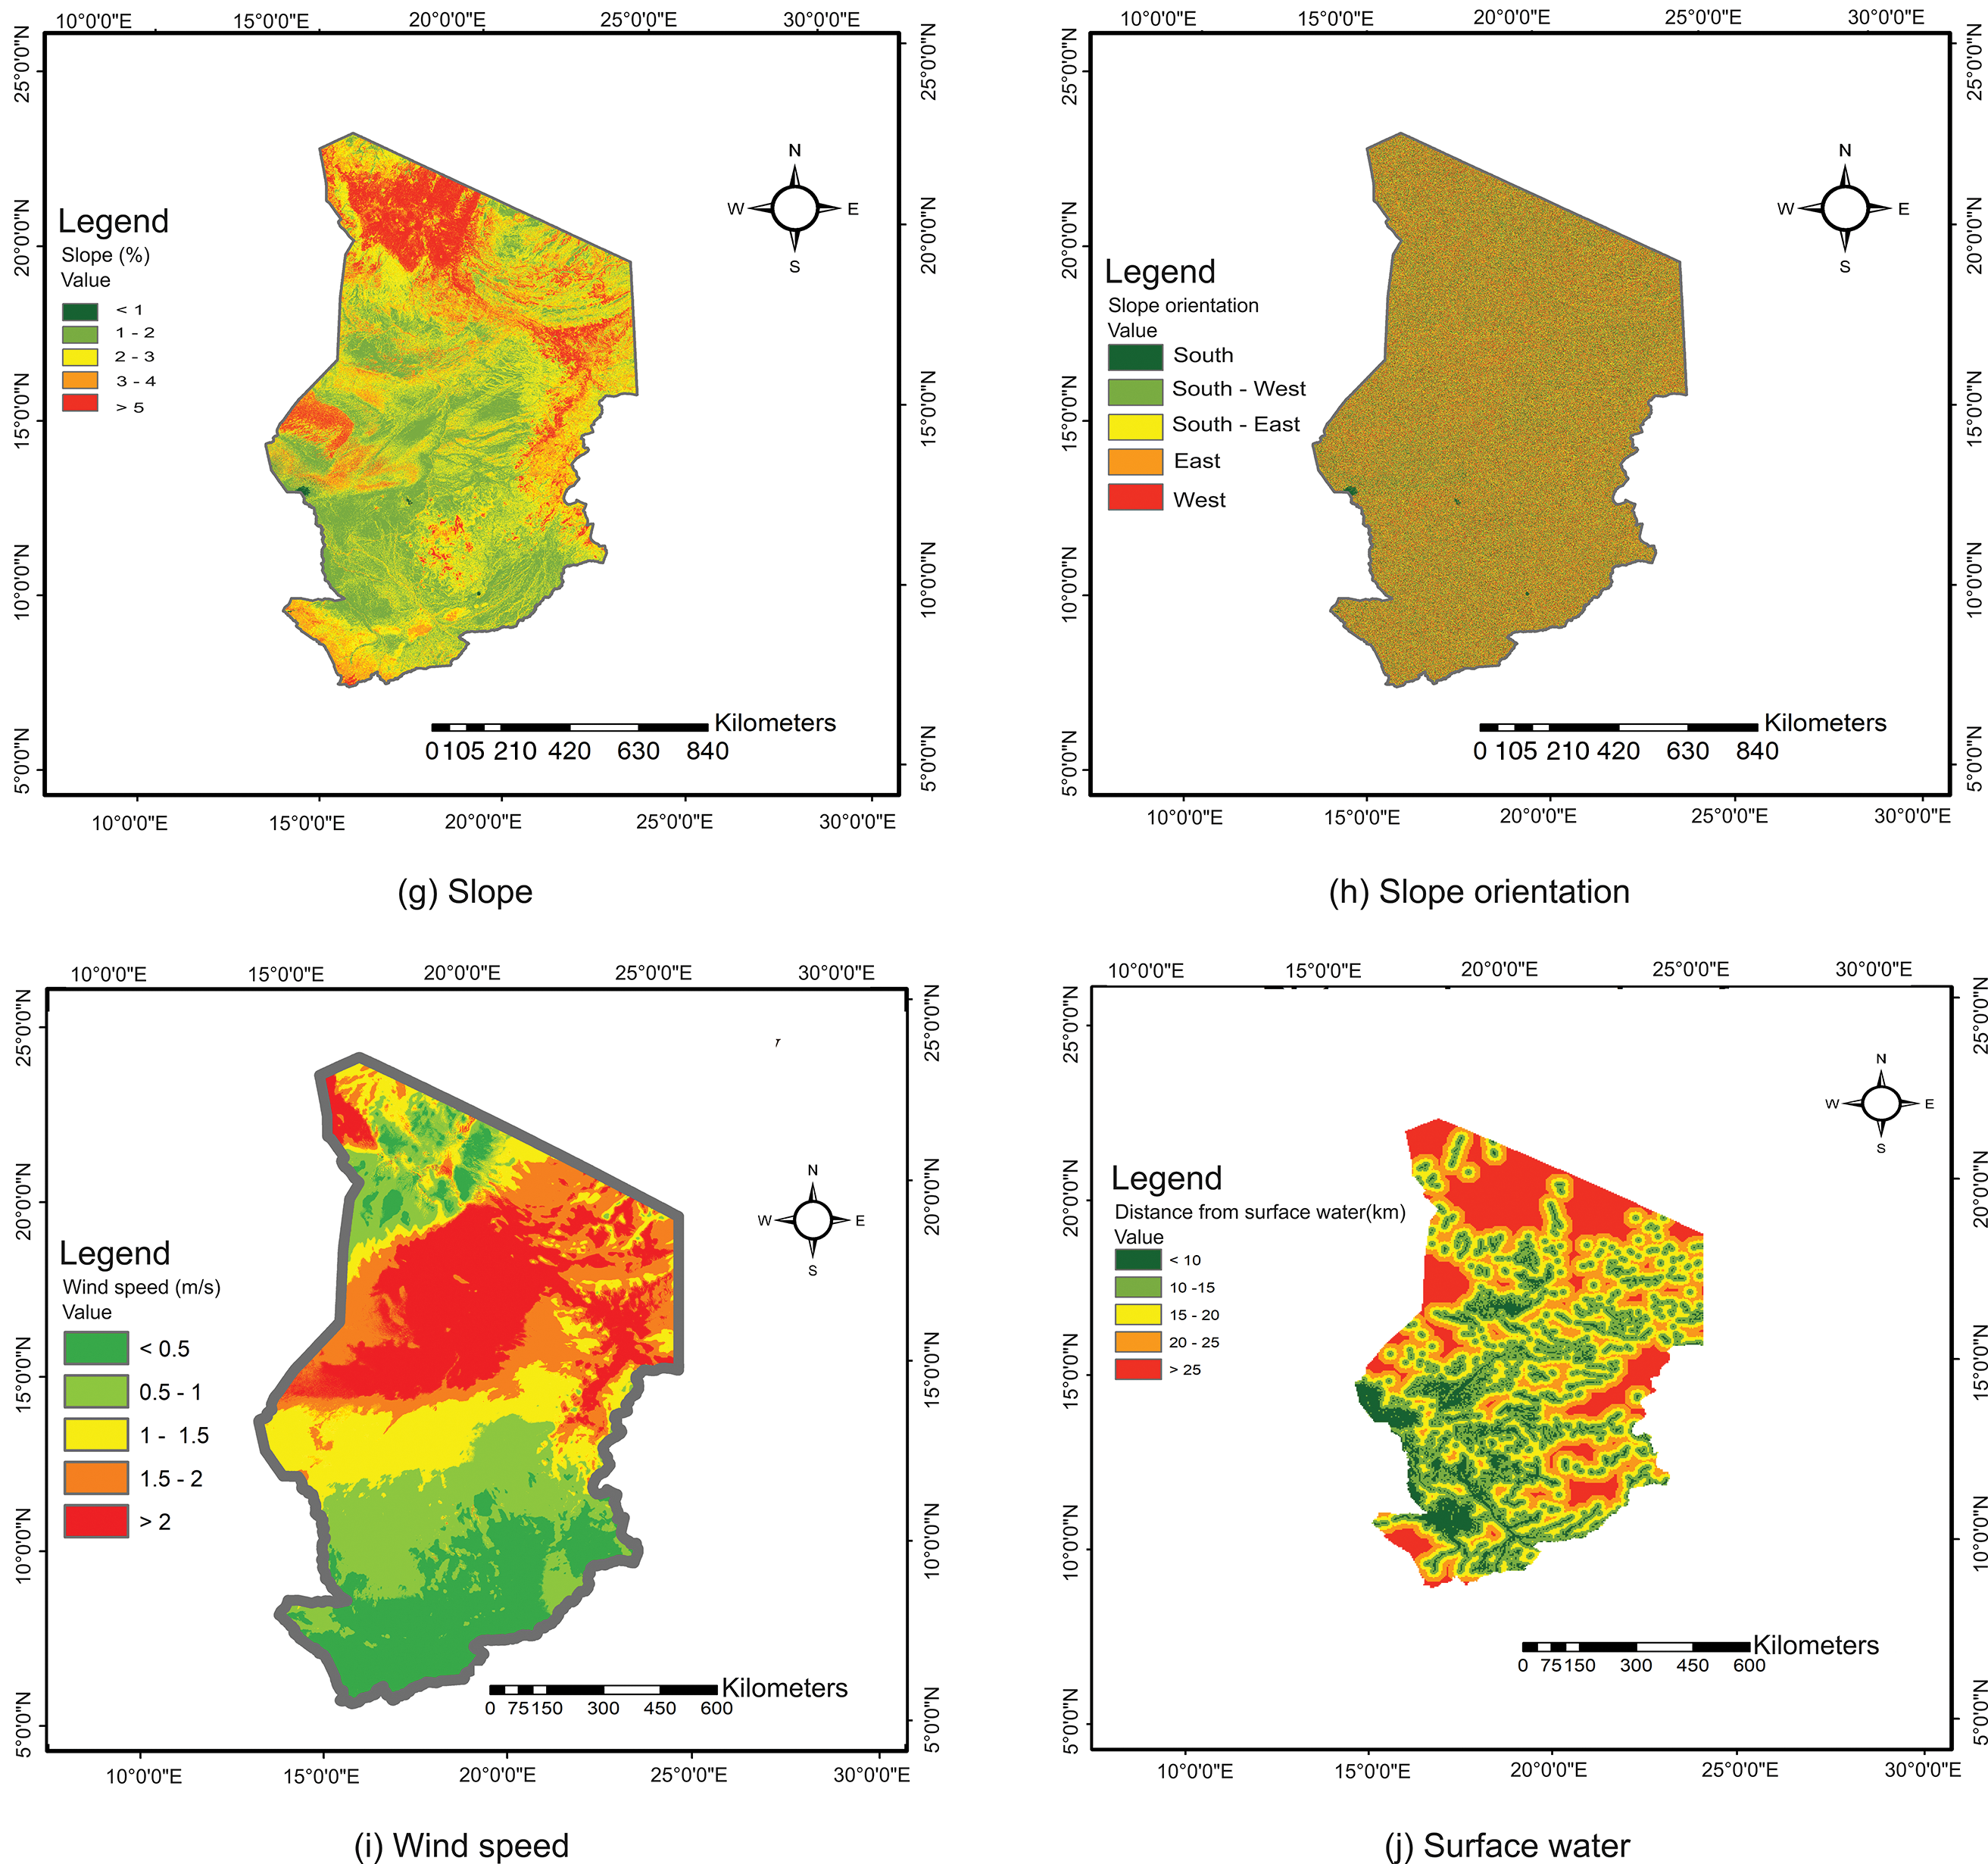
Figure 4: Evaluation criteria: (a) Direct Normal Irradiation; (b) Ambient air temperature; (c) Distance from waterways; (d) Distance from roads; (e) Distance from cities; (f) Elevation; (g) Slope; (h) Slope orientation; (i) Wind speed; (j) Distance from surface water
2.10 MCDM Methods: Analytical Hierarchy Process (AHP), Fuzzy Analytical Hierarchy Process (FAHP), and Full Consistency Method (FUCOM)
2.10.1 Analytical Hierarchy Process
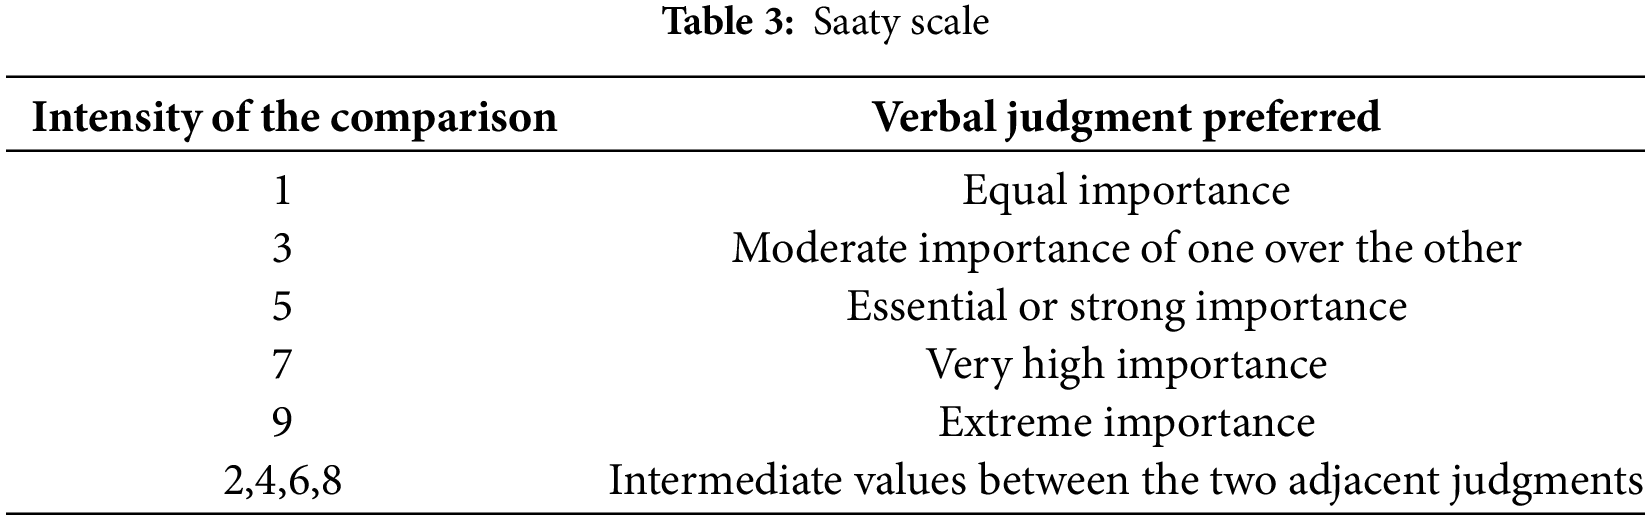
AHP is a method that is adapted to multi-criteria decision problems, i.e., problems that include several solutions that satisfy several criteria [23]. The AHP method consists of pairwise comparison and weighted linear combination. The first step establishes a matrix based on expert judgment on the relative importance of each criterion at a given level, which is scored on a numerical scale of 1 to 9 points, called the Saaty scale, and is recommended for comparisons. The materiality or weight of the criteria is determined after consultation with the experts. Table 3 shows the Thomas Saaty numerical rating scale. The second step is calculating the weights according to the judgment matrix and performing consistency.
The formula for calculating the consistency index is given in Eq. (1):
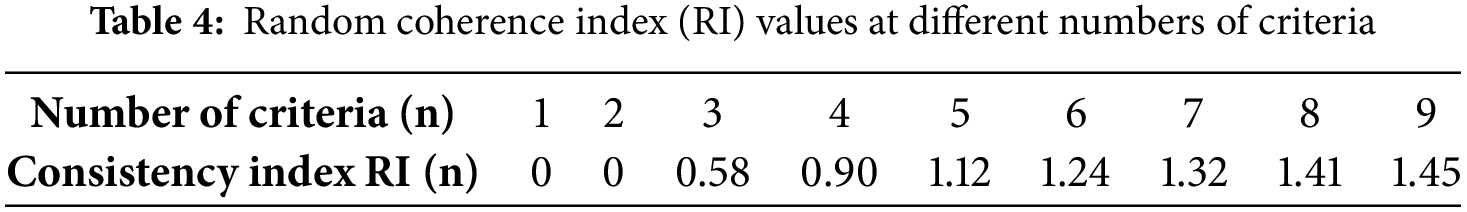
RI is the random coherence index, and CI is the coherence index. The random coherence index (RI) values for the different number of criteria are given in Table 4. The evaluation is considered consistent if the consistency ratio is less than or equal to 10%.
2.10.2 Fuzzy Analytical Hierarchy Process
AHP is one of the subjective MCDM methods that has been widely used in renewable plant site selection problems. The modified fuzzy AHP method considers imprecision in the decision-making process. FAHP is a fuzzified form of AHP developed by Saaty (1980) [24]. FAHP was used for several advantages: It is easy to use, scalable, has a hierarchical structure that can be adapted to different problem sizes, and is not data-intensive [25]. It has been implemented in many fields of renewable energy, such as photovoltaics [26], selection of potential sites for wind power plants [27], and potential site assessment for CSPs [28] It is an MCDM that allows for the prioritization of different important criteria in a particular domain. Fuzzy numbers are used to represent human judgments, and these are organized in fuzzy matrices to facilitate comparisons of different attributes. Weights are derived from these fuzzy comparison matrices using various algorithms, including Logarithmic Least Squares, Fuzzy Extent Analysis, Fuzzy Row Sum, Fuzzy Column Sum Inverse, Geometric Mean, and Arithmetic Mean [29]. The fuzzy set theory was defined by Zadeh (1965) [30] to represent the imprecision of decision-making parameters. A fuzzy set

Figure 5: Fuzzy triangular number
Essential arithmetic operations such as addition, multiplication, and scalar multiplication on TFNs
Buckley’s fuzzy AHP:
In this study, we used the approach described by Buckley (1985) [31]. Because it is better than other algorithms, Buckley’s Fuzzy AHP in five is adapted from it, as pictured below. In addition, the consistency ratio was estimated at step 3.
Step 1: create a structured hierarchy for the target
First, the purpose of FAHP needs to be clearly defined. The next step is to list the main criteria and their sub-criteria contributing to achieving the objective. For this purpose, a theoretical basis and the opinions of experts are required.
Step 2: compare the decision-maker’s scores
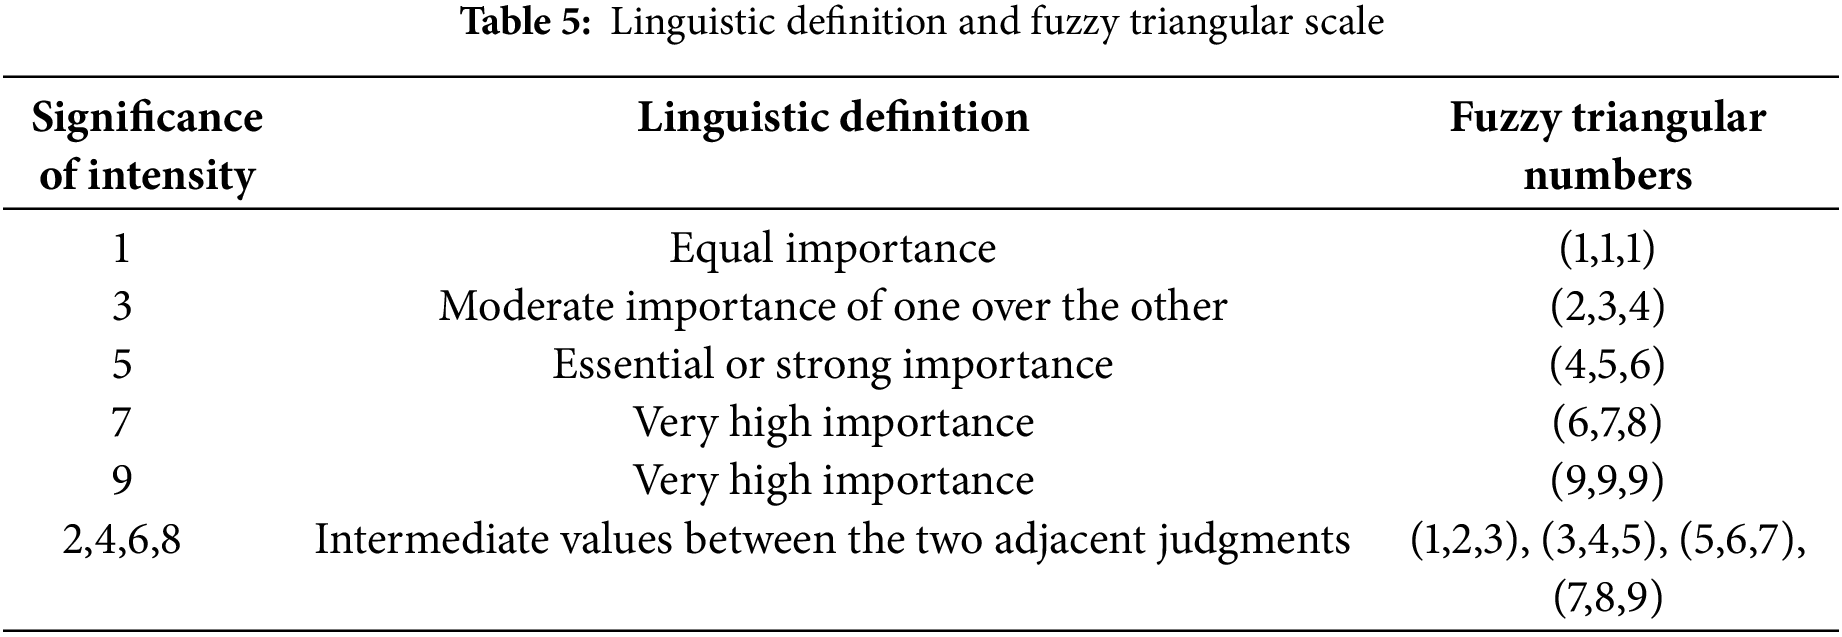
Table 5 This shows the linguistic definition for comparing the main criteria and the sub-criteria. If a Decision-Maker (DM) considers the first attribute to be more important than the second, then the first attribute will get a (4,5,6), and the second attribute will get a (1/6,1/5,1/4).
The result is a pairwise comparison matrix, as shown in Eq. (7) where
Step 3: consistency in the comparison matrix
Saaty (1980) used a coherence index (CI) to measure consistency in DM verdicts in the comparison matrix.
To begin, the TFNs calculated in Eq. (9) need to be converted into net numbers using Eq. (10). This conversion will result in a net comparison matrix, referred to as matrix A. The normalized principal vector, denoted as W, represents the relative weights of the criteria and can be derived from matrix A using Eq. (10). This vector reflects the online average value of a column-normalized matrix generated from A. Next, the matrix X in Eq. (12) can be derived using the weighted sum criteria as shown in Eq. (11). The maximum value can be computed from Eq. (13), which is based on the theorem AW = λW.
Finally, the CI and the coherence ratio (CR) can be calculated from Eqs. (14) and (15), respectively. The random coherence index (RI) for size n can be taken from Table 4. For the decision-maker’s judgments to be considered acceptable, the CR value must be less than 0.1.
for all TFN
Step 4: the fuzzy geometric mean matrix is defined for the attributes using Eq. (16). The fuzzy weights of each criterion are calculated using Eq. (17).
Here,
Step 5: the fuzz number for FTNs is calculated using the center of surface method using Eq. (18) and normalized using Eq. (19).
2.10.3 Full Consistency Method
FUCOM is a new technique [32], belonging to the same class as subjective MCDMs, which require only
where k represents the rank of the criteria observed.
Step 2: After that, the comparative priority
Decision-makers assign priority
Step 3: In this step, the criteria weights
The ratio of weights corresponds to their relative priority, as in Eq. (22):
The weights must adhere to the principle of mathematical transitivity as in Eq. (23):
To maximize consistency, the deviation from complete consistency (
Each criterion and sub-criterion are processed through all three steps for every decision-maker. The weights for each decision-maker can then be aggregated by calculating their average.
2.11 Application of the Fuzzy Analytical Hierarchy Process and the Full Consistency Method
This research prioritizes the criteria for identifying suitable sites for concentrated solar power plants in Chad. The hierarchical structure of the defined goal was created based on literature review and expert opinions. Fig. 6 illustrates the hierarchical organization of the criteria. The following sections demonstrate the implementation of FAHP and FUCOM.

Figure 6: Multi-criteria decision-making model for CSPs
2.11.1 Fuzzy Analytical Hierarchy Process Application
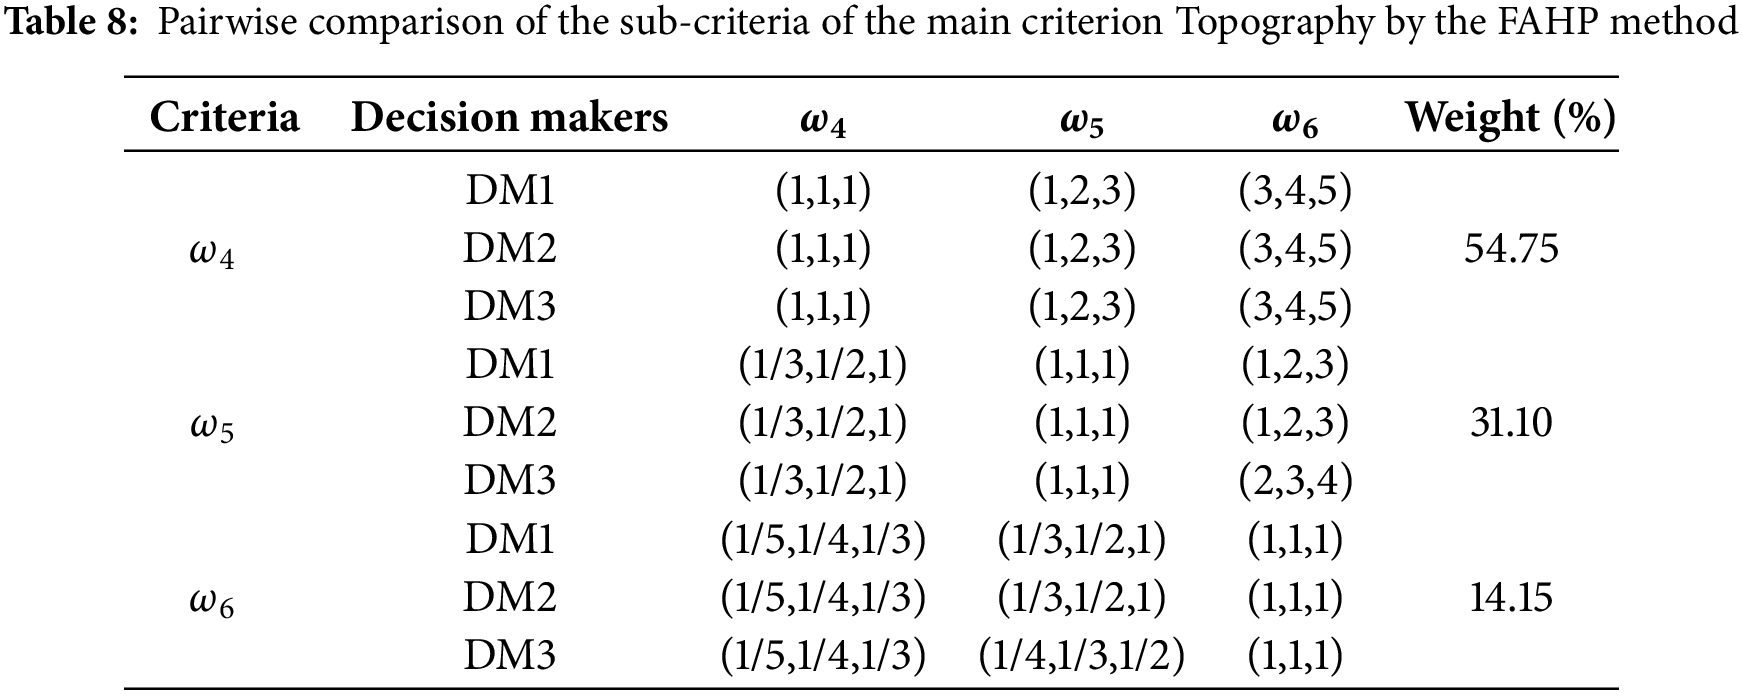
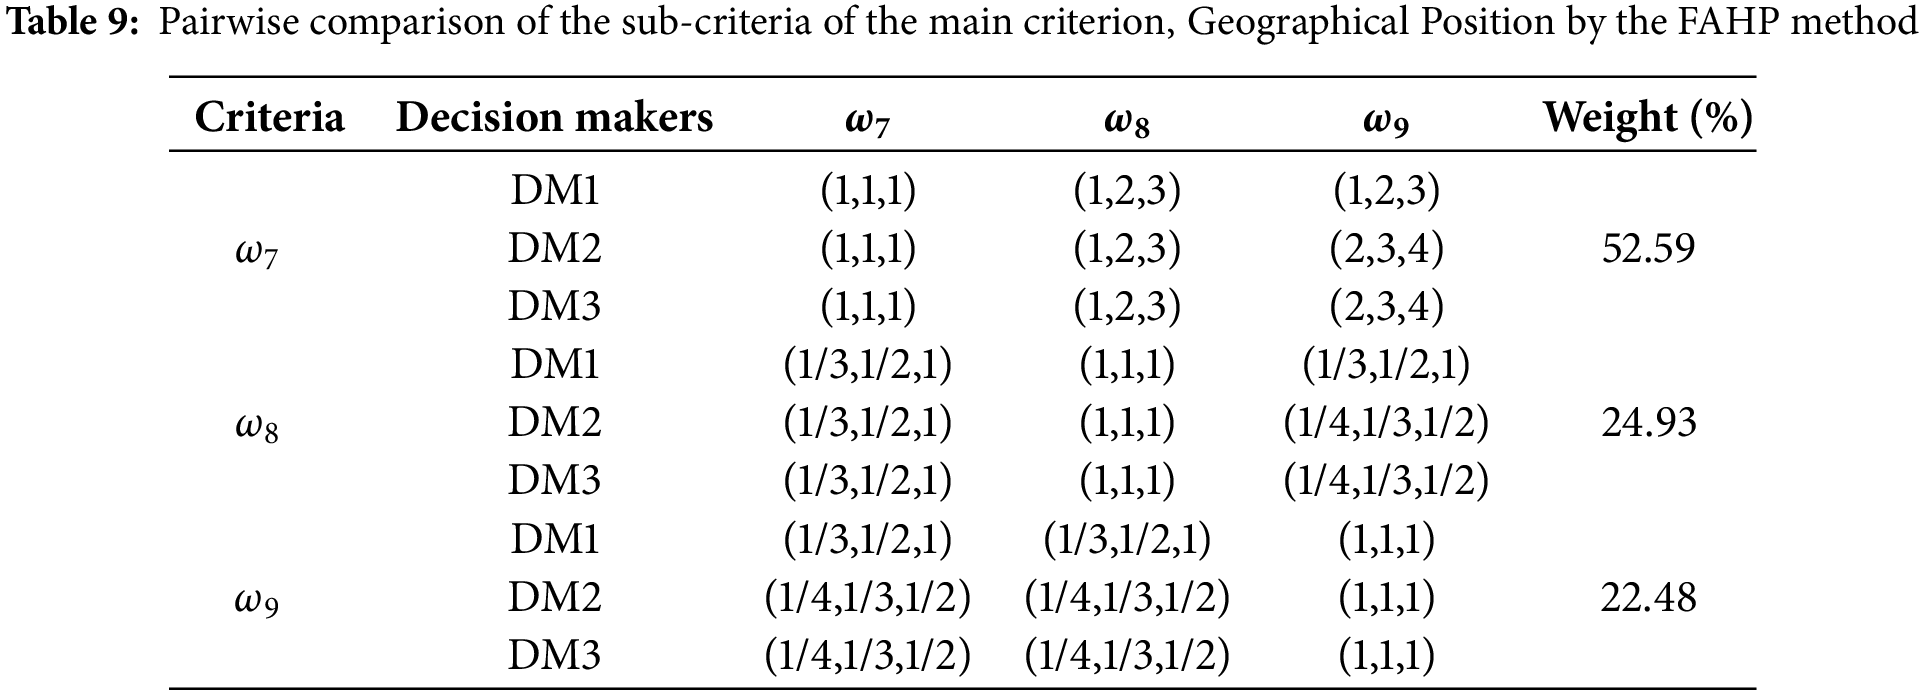
Step 1 requires developing the hierarchical structure of the objective as given in Fig. 6 and described above. In step 2, three decision-makers, DM1, DM2, and DM3, performed a pairwise comparison for four variables: the main criteria and the sub-criteria. Decision-makers used the language definition and corresponding TNFs given in Table 5, and the results of the comparison are presented in Tables 6–9. Subsequently, the remaining calculations are represented by Eqs. (3)–(20) at steps 2 to 5. The simulations were conducted using Microsoft Excel. Also, Tables 6–9 contain the weights obtained for the main criteria and their sub-criteria. The consistency ratios for all four variables are below 0.1, indicating acceptable consistency in the judgments of the decision-makers (Table 10). Finally, the overall weight of each sub-criterion is estimated by multiplying its local weight and the weight of the main criterion to which it belongs (Table 11).


2.11.2 Full Consistency Method Application
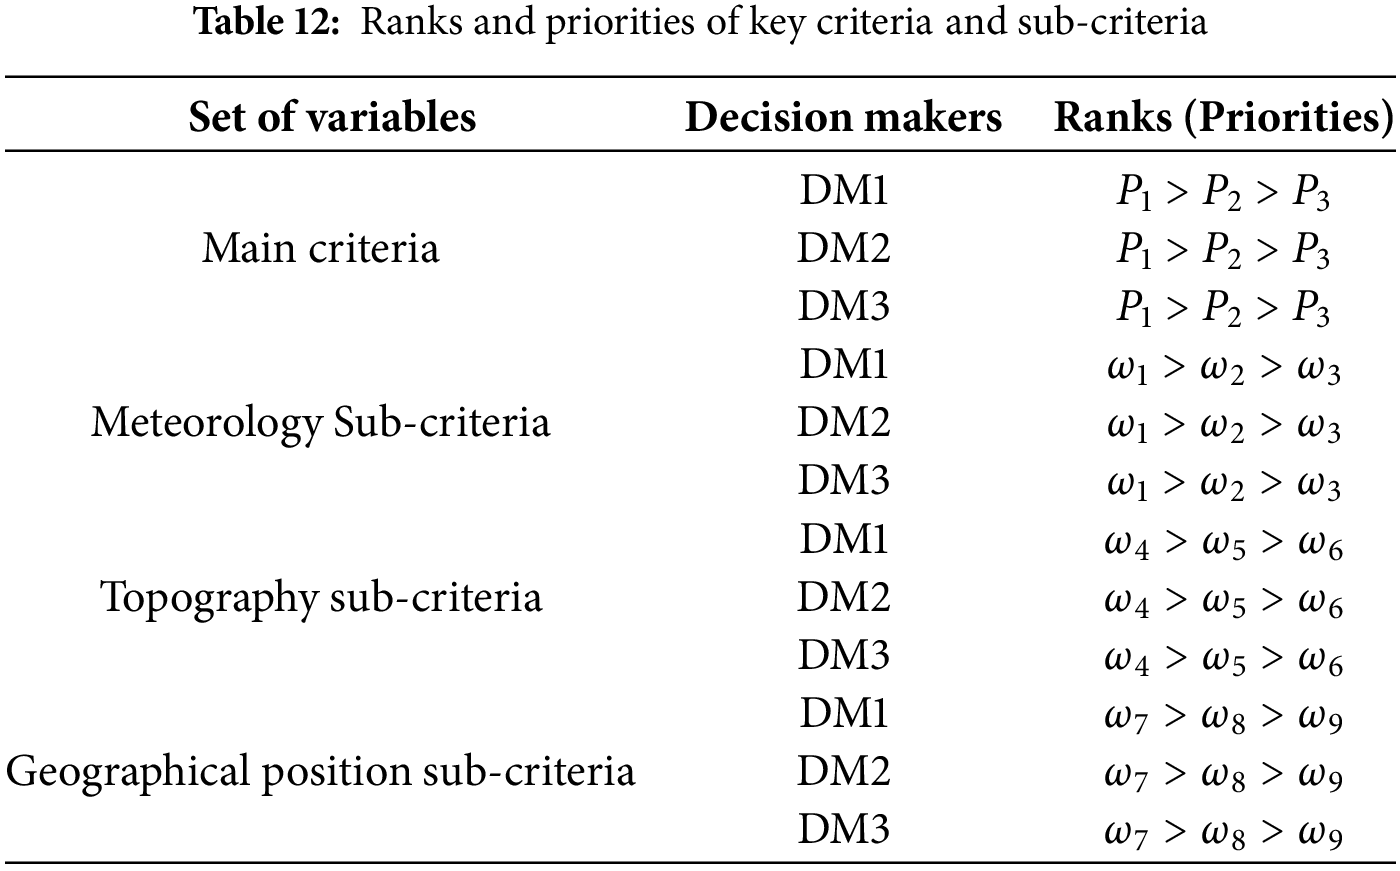
We have maintained the same structure in Fig. 6 to apply it to the FUCOM method. Initially, decision-makers rank the main criteria and sub-criteria in the expected order based on their weights during the site selection process (Table 12). Likewise, the priorities Φ for the criteria and sub-criteria were determined based on the contributions of the sub-criteria (Table 12). In the next step, the comparative priorities of the criteria and sub-criteria are determined based on the priorities of the main criteria and sub-criteria. In the third step, the weights are calculated according to the conditions outlined in Eqs. (23) and (24). This ensures that the ratio of the weights corresponds to the comparative priorities, while also satisfying the principle of mathematical transitivity. These optimization problem models were solved using Python, particularly by using the minimized function of the scipy.optimize tool. The resulting weights and DFCs are presented in Tables 13–16.


Sensitivity analysis was conducted for the Fuzzy AHP and FUCOM methods by adjusting the weights of the main criteria while preserving their order

Figure 7: Sensitivity analysis for the rankings of the criteria and the results of seven experiments using FAHP
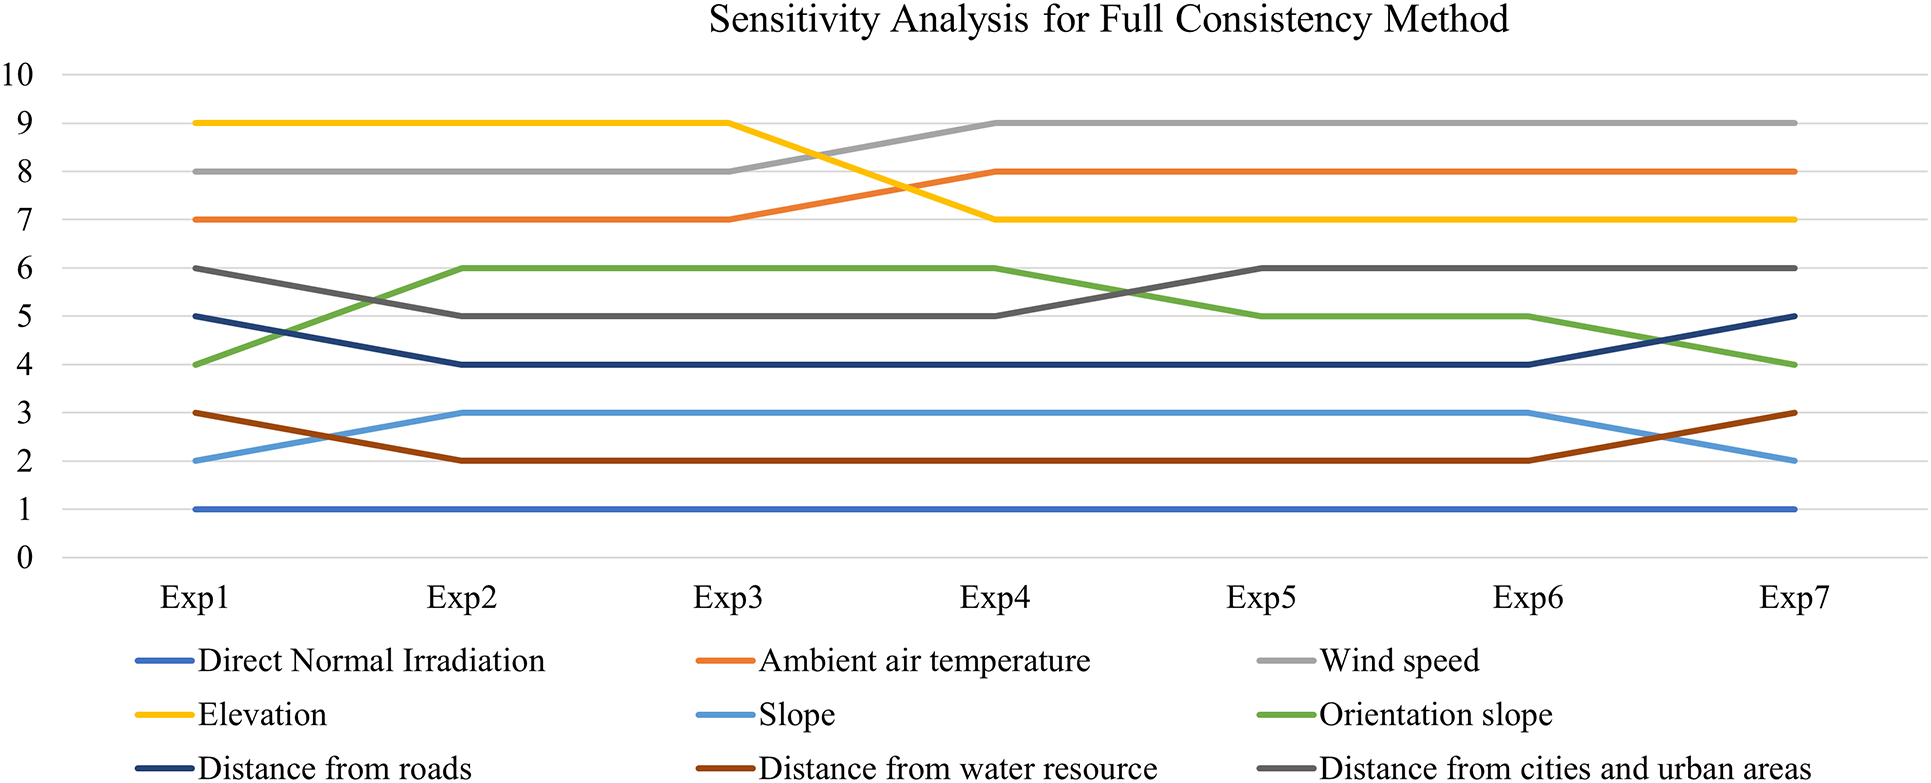
Figure 8: Sensitivity analysis for the rankings of the criteria and the results of seven experiments using FUCOM
As with any site search, some areas are unsuitable, either because of the regulations in force in the search area or because of the project’s technical feasibility. All these criteria have been grouped together in Table 17. Fig. 9 shows the map of areas that are incompatible with the implementation of CSPs with respect to the exclusion criteria listed in Table 17. These areas represent 65% of the territory, i.e., an area of 826,848 km2, as shown on Fig. 10. On the map of excluded areas, protected areas represent 20.97% of the total area, i.e., an area of 267,716 km2. DNI alone excludes more than 40% of the territory due to the requirement imposed by CSP power plants, namely that its annual value must be greater than or equal to 1800 kWh/m2/year. The topography of the relief also plays an important role. A gradient of more than 2.1° is not desired for CSP plants, which is why part of the territory has also been excluded due to these topographical requirements. Buffer zones have been established to ensure proximity to water resources, roads, and towns.


Figure 9: Map of excluded areas

Figure 10: Proportion of areas
3.2 Performance Tables of Three Methods
In fact, the most influential factor is meteorology, represented by DNI, which reflects its importance on a site. In second place is the topography, represented by the slope, which is also very important from a techno-economic point of view, as discussed above. In third place is the distance to water resources due to its importance for the operation and maintenance of the CSP. Finally, there is the infrastructure location, as proximity to water resources was prioritized to ensure the reliable operation of the CSP plant.
3.2.1 Performance of Analytical Hierarchy Process
Table 18 establishes the performance matrix of the criteria taken in pairs according to the AHP method. The weight of each criterion is thus obtained according to the approach described above. The AHP method has shown 32.7% for DNI, 19.9% for the slope, 8.50% for the distance from residential areas, 13.9% for the distances from waterways, 9% for the distance from roads, and 4.7% for slope orientation, 4.8% for ambient air temperature and 3.8% for elevation. The coherence coefficient of the matrix CR = 0.016, which is much less than 0.1 as recommended by the AHP method.

3.2.2 Performance of Fuzzy Analytical Hierarchy Process
FAHP gave weights of 31.81% for DNI, 13.94% for slope, 5.72% for distance from residential areas, 13.39% for distances from waterways, 6.35% for distance from roads, 7.92% for slope orientation, 8.93% for ambient air temperature, and 3.6% for elevation.
3.2.3 Performance of Full Consistency Method
FUCOM has shown weights of 40.91% for DNI, 13.94% for the slope, 5.11% for the distance from residential areas, 13.26% for the distances from waterways, 6.63% for the distance from roads, and 7.14% for slope orientation, 4.54% for ambient air temperature and 3.57% for elevation. The performance criteria highlight through the weight of the requirements that the DNI remains the most decisive technical criterion in selecting the CSP site. In Fig. 11a–b, we can see the ranks occupied by the criteria and the comparison of the weights for the three methods.

Figure 11: Ranks occupied by the criteria and the comparison of the weights for the three methods: (a) Rank of criteria for the three methods; (b) Overall weights of the criteria for the three methods
Once the criteria weights have been obtained by the three AHP, FAH, and FUCOM tools, they are applied to the data using the ArcMap 10.8 Overlay tool. Fig. 12a–c shows the maps of the adapted areas according to the weights of the criteria obtained by the three methods. These results could potentially change if other criteria are added or removed in this evaluation process. But this change would depend on their importance in this process. Technical criteria, particularly DNI, are essential in searching for potential sites to implant CSPs.


Figure 12: Map of appropriate areas for CSPs: (a) according to the AHP method; (b) according to the FAHP method; (c) according to the FUCOM method
In three scenarios, the results show that the North, South-East, and East parts of the country are the areas of the territory that best respond to the installation of thermodynamic solar power plants. This result is partly explained by the DNI requirement for the CSP, which must be at least 1800 kWh/m2/year.
Efforts have been made to utilize the best available free geospatial information for our assessments. However, the nature of global geospatial data introduces certain uncertainties. Despite this, the three models have provided a valuable estimate of the potential for installing CSP plants in Chad. It’s important to note that any multi-criteria analysis is also subject to uncertainty. The results may be biased, as the AHP, FAHP, and FUCOM methodologies rely on decision-makers input.
In addition, the selection of the criteria and weights, which should be adapted to the study area where regulations need to be considered, should be based on the opinion of local decision-makers and industry and sector experts. The usefulness of this tool will then be in helping planners and private investors to identify areas for focus and resource allocation. These areas should be the subject of further analysis. Other variables, which are costly and difficult to obtain for large areas, should be further investigated. The indicator and associated methodology provide first-hand information for other researchers and policymakers as a first step toward more comprehensive assessments.
This study’s objective was to evaluate potential sites for installing thermodynamic solar power plants in Chad using the AHP, FAHP, and FOCUM decision support tools combined with a Geographic Information System. Identifying CSP plant installation sites is an essential and complex step for any renewable energy system deployment project. It includes many criteria, most of which may differ from the desired objective.
The first step is to exclude areas of the territory that do not meet the criteria for installing CSPs. Areas protected by the country’s regulations are systematically excluded.
The next step was to assess the compatible areas according to well-chosen evaluation criteria. As they do not have the same weight in the evaluation process, the multi-criteria analysis tools AHP, FAHP, and FOCUM were used to weight the different criteria. A slight difference was observed between AHP and FAHP in the most critical endpoint, i.e., direct normal radiation. Once the weights were obtained, using the ArcMap 10.8 georeferencing software made applying the criteria weights to the various associated data possible.
The study showed that 35% of Chad’s territory is compatible with CSPs. DNI is the most essential criterion in the site assessment process. The requirements for the DNI have contributed to the exclusion of a large part of the territory for implementing CSP technologies. It is, therefore, the criterion with the most weight in the selection process in all three methods. The topography of relief is the second most important, followed by water resources. The North, North-East, South-East, and East zones of the country are the areas that have the best skills for the establishment of CSPs. This method can be applied to other renewable energy technologies such as photovoltaics, wind power, and biomass. Combining its different analyses will be a valuable tool for planning any renewable energy project in Chad. This work should also facilitate the techno-economic analysis of future CSP power plants in Chad.
Acknowledgement: The authors thank the Alioune Diop University of Bambey and Polytechnic School of Dakar for their support.
Funding Statement: The authors received no specific funding for this study.
Author Contributions: The authors confirm their contribution to the paper as follows: study conception and design: Bernard Bayangbe; data collection: Bernard Bayangbe; analysis and interpretation of results: Ababacar Thiam; draft manuscript preparation: Kory Faye and El hadji I. Cissé. All authors reviewed the results and approved the final version of the manuscript.
Availability of Data and Materials: Data supporting this study is included within the article.
Ethics Approval: Not applicable.
Conflicts of Interest: The authors declare no conflicts of interest to report regarding the present study.
References
1. International Energy Agency. Africa energy outlook 2022 [Internet]. [cited 2025 Jan 19]. Available from: www.iea.org/weo. [Google Scholar]
2. United Nations Department of Economic and Social Affairs, Population Division. Global population growth and sustainable development, population division [Internet]. 2021 [cited 2023 Jul 11]. Available from: https://www.un.org/development/desa/pd/content/global-population-growth. [Google Scholar]
3. Birol DF. World energy outlook 2022 [Internet]. Int Energy Agency; [cited 2025 Jan 19]. Available from: www.iea.org/weo. [Google Scholar]
4. Chad energy market report | energy market research in chad [Internet]. [cited 2024 Oct 6]. Available from: https://www.enerdata.net/estore/country-profiles/chad.html. [Google Scholar]
5. Sebastian H, Asami M, Nicolas F. Estimating the renewable energy potential in Africa: a GIS-based approach. Int Renew Energy Agency; 2014 [cited 2025 Jan 19]. Available from: https://www.irena.org/publications/2014/Aug/Estimating-the-Renewable-Energy-Potential-in-Africa-A-GIS-based-approach. [Google Scholar]
6. International Energy Agency. Technology roadmap: concentrating solar power [Internet]. OECD Publishing; 2010 [cited 2023 Aug 30]. Available from: https://www.oecd-ilibrary.org/energy/technology-roadmap-concentrating-solar-power_9789264088139-en. [Google Scholar]
7. Al Nahdi WA, Hassan Ali MI. Feasibility study for water-electricity cogeneration using integrated system of concentrated solar power and biofuel as renewable energy sources. J Sustain Dev Energy Water Environ Syst. 2021;9(3):1–17. doi:10.13044/j.sdewes.d8.0372. [Google Scholar] [CrossRef]
8. Quoilin S, Orosz M. Rural electrification through decentralized concentrating solar power: technological and socio-economic aspects. J Sustain Dev Energy Water Environ Syst. 2013;1(3):199–212. doi:10.13044/j.sdewes.2013.01.0015. [Google Scholar] [CrossRef]
9. Ntaghry K, Thiam A, Habib SMS, Faye K, Faye M. Evaluation of suitable sites for concentrated solar power desalination systems: case study of Mauritania. Environ Res Commun. 2024;6(8):085020. doi:10.1088/2515-7620/ad6f73. [Google Scholar] [CrossRef]
10. Shao M, Han Z, Sun J, Xiao C, Zhang S, Zhao Y. A review of multi-criteria decision making applications for renewable energy site selection. Renew Energy. 2020;157:377–403. doi:10.1016/j.renene.2020.04.137. [Google Scholar] [CrossRef]
11. Ruiz HS, Sunarso A, Ibrahim-Bathis K, Murti SA, Budiarto I. GIS-AHP multi criteria decision analysis for the optimal location of solar energy plants at Indonesia. Energy Rep. 2020;6(6):3249–63. doi:10.1016/j.egyr.2020.11.198. [Google Scholar] [CrossRef]
12. Ahmed A, Steen Solvang J, Anders Branth P. Solar power potential of Tanzania: identifying CSP and PV hot spots through a GIS multicriteria decision making analysis. Renew Energy. 2017;113(1):159–75. doi:10.1016/j.renene.2017.05.077. [Google Scholar] [CrossRef]
13. Levosada ATA, Ogena RPT, Santos JRV, Danao LAM. Mapping of suitable sites for concentrated solar power plants in the Philippines using geographic information system and analytic hierarchy process. Sustainability. 2022;14(19):12260. doi:10.3390/su141912260. [Google Scholar] [CrossRef]
14. Alami Merrouni A, Elwali Elalaoui F, Ghennioui A, Mezrhab A, Mezrhab A. A GIS-AHP combination for the sites assessment of large-scale CSP plants with dry and wet cooling systems. Case study: Eastern Morocco. Sol Energy. 2018;166:2–12. doi:10.1016/j.solener.2018.03.038. [Google Scholar] [CrossRef]
15. Haddad B, Díaz-Cuevas P, Ferreira P, Djebli A, Pérez JP. Mapping concentrated solar power site suitability in Algeria. Renew Energy. 2021;168(2):838–53. doi:10.1016/j.renene.2020.12.081. [Google Scholar] [CrossRef]
16. Ouafae J, Fatima-Zahra O, Abdellatif G, Mohammed F, Mohamed C. Technical potential appraisal and optimal site screening comparing AHP and fuzzy AHP methods for large-scale CSP plants: a GIS-MCDM approach in Morocco. Sustain Energy Technol Assess. 2024;68:103877. doi:10.1016/j.seta.2024.103877. [Google Scholar] [CrossRef]
17. Lohmann S, Schillings C, Mayer B, Meyer R. Long-term variability of solar direct and global radiation derived from ISCCP data and comparison with reanalysis data. Sol Energy. 2006;80(11):1390–401. doi:10.1016/j.solener.2006.03.004. [Google Scholar] [CrossRef]
18. Wolmarans JR, Craig KJ. One-way fluid-structure interaction of a medium-sized heliostat using scale-resolving CFD simulation. Sol Energy. 2019;191(2):84–99. doi:10.1016/j.solener.2019.08.068. [Google Scholar] [CrossRef]
19. Moser M, Trieb F, Fichter T. Potential of concentrating solar power plants for the combined production of water and electricity in MENA countries. J Sustain Dev Energy Water Environ Syst. 2013;1(2):122–40. doi:10.13044/j.sdewes.2013.01.0009. [Google Scholar] [CrossRef]
20. Navarro A, Santigosa L, Domínguez P, Blanco M, Polo J, Zarza E. Review and validation of Solar Thermal Electricity potential methodologies. Energy Convers Manag. 2016;126:42–50. doi:10.1016/j.enconman.2016.07.070. [Google Scholar] [CrossRef]
21. Antonanzas-Torres F, Martinez-de-Pison FJ, Antonanzas J, Alia-Martinez M, Urraca R. Impact of atmospheric components on solar clear-sky models at different elevation: case study Canary Islands. Energy Convers Manag. 2016;109(8):122–9. doi:10.1016/j.enconman.2015.11.067. [Google Scholar] [CrossRef]
22. Meyer R, Hoyer-Klick C, Diedrich E, Schillings C, Lohmann S, Schroedter-Homscheidt M, et al. Solar energy mining: a high-quality satellite-based service to provide direct solar radiation for Europe, Brazil, Africa and Asia. In: 12th SolarPACES Symposium Oaxaca; Oberpfaffenhofen, Germany; 2004. [Google Scholar]
23. Saaty TL. How to make a decision: the analytic hierarchy process. Eur J Oper Res. 1990;48(1):9–26. doi:10.1016/0377-2217(90)90057-I. [Google Scholar] [CrossRef]
24. Mu E, Pereyra-Rojas M. Understanding the analytic hierarchy process. In: Mu E, Pereyra-Rojas M, editors. Practical decision making: an introduction to the analytic hierarchy process (AHP) using super decisions V2. Cham: Springer International Publishing; 2017. p. 7–22. [Google Scholar]
25. Velasquez M, Hester P. An analysis of multi-criteria decision making methods. Int J Oper Res. 2013;10:56–66. [Google Scholar]
26. Abdullah A, Gregory P, Thamer A, Soundar K. Site suitability analysis for implementing solar PV power plants using GIS and fuzzy MCDM based approach. Sol Energy. 2023;249(3):642–50. doi:10.1016/j.solener.2022.11.046. [Google Scholar] [CrossRef]
27. Demir G, Riaz M, Deveci M. Wind farm site selection using geographic information system and fuzzy decision making model. Expert Syst Appl. 2024;255(5):124772. doi:10.1016/j.eswa.2024.124772. [Google Scholar] [CrossRef]
28. Farsi H, Dizene R, Flamant G, Notton G. Multi-criteria decision making methods for suitable site selection of concentrating solar power plants. Sustainability. 2024;16(17):7673. doi:10.3390/su16177673. [Google Scholar] [CrossRef]
29. Faran A, Kemal K. Fuzzy analytic hierarchy process: a performance analysis of various algorithms. Fuzzy Sets Syst. 2019;362(1):110–28. doi:10.1016/j.fss.2018.08.009. [Google Scholar] [CrossRef]
30. Zadeh LA. Fuzzy sets. In: Fuzzy sets, fuzzy logic, and fuzzy systems [Internet]. World Scientific; 1996 [cited 2024 Oct 7]. p. 19–34. Available from: https://www.worldscientific.com/doi/abs/10.1142/9789814261302_0001. [Google Scholar]
31. Buckley JJ. Fuzzy hierarchical analysis. Fuzzy Sets Syst. 1985;17(3):233–47. doi:10.1016/0165-0114(85)90090-9. [Google Scholar] [CrossRef]
32. Pamučar D, Stević Ž, Sremac S. A new model for determining weight coefficients of criteria in MCDM models: full consistency method (FUCOM). Symmetry. 2018;10(9):393. doi:10.3390/sym10090393. [Google Scholar] [CrossRef]
Cite This Article
 Copyright © 2025 The Author(s). Published by Tech Science Press.
This work is licensed under a Creative Commons Attribution 4.0 International License , which permits unrestricted use, distribution, and reproduction in any medium, provided the original work is properly cited.
 Downloads
 Citation Tools