
 Submit a Paper
 Propose a Special lssue
 Open Access
ARTICLE

Evaluation Model for Energy Efficiency of Factory Workshop Based on DSR and Fuzzy Borda
1 HDHL Electrical and Information Technology, Co., Ltd., Changsha, 410205, China
2 College of Computer Science, Hunan University of Technology and Business, Changsha, 410205, China
3 College of Electrical and Information Engineering, Hunan University, Changsha, 410082, China
* Corresponding Author: Zijian Zhu. Email:
Energy Engineering 2025, 122(3), 1073-1092. https://doi.org/10.32604/ee.2025.060293
Received 29 October 2024; Accepted 20 January 2025; Issue published 07 March 2025
 View Full Text
 Download PDF
Abstract
In the context of advancing towards dual carbon goals, numerous factories are actively engaging in energy efficiency upgrades and transformations. To accurately pinpoint energy efficiency bottlenecks within factories and prioritize renovation sequences, it is crucial to conduct comprehensive evaluations of the energy performance across various workshops. Therefore, this paper proposes an evaluation model for workshop energy efficiency based on the drive-state-response (DSR) framework combined with the fuzzy BORDA method. Firstly, an in-depth analysis of the relationships between different energy efficiency indicators was conducted. Based on the DSR model, evaluation criteria were selected from three dimensions—drive factors, state characteristics, and response measures—to establish a robust energy efficiency indicator system. Secondly, three distinct assessment techniques were selected: Grey Relational Analysis (GRA), Entropy Weight Method (EWM), and Technique for Order Preference by Similarity to Ideal Solution (TOPSIS) forming a diversified set of evaluation methods. Subsequently, by introducing the fuzzy BORDA method, a comprehensive energy efficiency evaluation model was developed, aimed at quantitatively ranking the energy performance status of each workshop. Using a real-world factory as a case study, applying our proposed evaluation model yielded detailed scores and rankings for each workshop. Furthermore, post hoc testing was performed using the Spearman correlation coefficient, revealing a statistic value of 10.209, which validates the effectiveness and reliability of the proposed evaluation model. This model not only assists in identifying underperforming workshops within the factory but also provides solid data support and a decision-making basis for future energy efficiency optimization strategies.Keywords
Nomenclature
| DSR | Driver-state-response |
| GRA | Grey relation analysis |
| EWM | Entropy weight method |
| IES | Integrated energy system |
| AHP | Analytic hierarchy process |
With the popularisation of the concept of green and energy-saving development, guiding users to improve their electricity consumption habits, reduce the cost of electricity, and reduce pollution emissions has become an important development goal in electricity consumption [1]. In recent years, countries around the world have been actively promoting industrial energy efficiency, steadily achieving the goals of energy conservation, carbon reduction, and green development in the industrial sector [2,3]. The energy efficiency assessment work can accurately reflect the energy efficiency level of enterprises, help enterprises find the direction of energy efficiency optimisation, and promote enterprises to adjust their energy use methods according to the evaluation results [4,5]. Therefore, the implementation of energy efficiency assessment is of great significance in promoting sustainable energy development and environmental protection.
The number of energy-using enterprises in the industrial sector in various countries is extensive. Each enterprise has a large number of energy-consuming equipment, high energy consumption, and complex energy use, with a huge potential for energy conservation and carbon reduction [6–8]. Before implementing energy saving and optimisation, factories need to carry out accurate and effective energy efficiency assessment work. This is used to find the key aspects that affect the plant’s energy use and to provide a guiding route for energy-saving renovation work. Scholars in various countries have conducted more in-depth studies on the issue of energy efficiency assessment.
In terms of energy efficiency evaluation systems, Literature [9] addresses the limitation that current energy consumption evaluation indicators of public institutions cannot quantify energy efficiency and energy-saving potential by proposing a public institution energy-environmental efficiency evaluation model based on SBM-DEA. Literature [10] defines new energy efficiency coefficients for the energy-using characteristics of air-conditioning equipment and determines the optimal operation mode by comparing the energy efficiency coefficients. Literature [11] establishes an evaluation index system for energy efficiency of integrated energy systems concerning the characteristics of energy supply and demand of integrated energy systems, combined with the laws of thermodynamics, and considering the use of renewable energy. Literature [12] constructed a system of IES evaluation indexes considering multiple factors and used the super-efficiency CCR model and the cross-super-efficiency CCR model for comprehensive efficiency evaluation of IES. The above literature proposes a corresponding evaluation system for energy efficiency assessment, but the selection of evaluation indicators ignores the logical relationship between indicators and fails to establish an indicator system from multiple dimensions.
In terms of the use of energy efficiency evaluation methods, Literature [13] evaluates office buildings, and to avoid single subjective and objective problems, AHP-EWM is used to determine the weights of the indicators, and weighted grey correlation is used to replace the Euclidean distance, which makes its application wider. Literature [14], for the forging industry, combined with the complex forging process, defined a new energy index, and combined with the system energy consumption data, proposed a comprehensive energy efficiency evaluation method. Literature [15] takes the wastewater treatment plant as the research object adopts the efficiency analysis tree method and combines machine learning and linear programming techniques to scientifically and comprehensively assess the energy efficiency level of the wastewater treatment process. Based on the total factor energy efficiency framework [16], the DDF-DEA model was used to calculate the total factor energy efficiency, and the internal and external differences of the total factor energy efficiency were further analyzed. Literature [17] proposes a method for evaluating the energy-saving efficiency of urban integrated energy systems based on data envelopment analysis, which is used to identify the weak links of the energy efficiency of the integrated energy systems under different scenarios, and lays the foundation for the integrated energy systems to achieve efficient carbon reduction and accurate efficiency improvement. Literature [18], for the oil industry, combined with big data analysis methods, using GA-BP neural network to establish a prediction model of energy efficiency indicators of crude oil gathering and transmission system. The energy efficiency evaluation system of crude oil gathering and transmission system was constructed based on game theory combined with the weighting method and TOPSIS method, which was used to identify the energy efficiency gap of the evaluation object. Although the aforementioned literature has proposed corresponding evaluation models for energy efficiency assessment issues in different industries, there are relatively few methods for energy efficiency evaluation at the workshop level in factories, and the existing methods often lack a complete and systematic evaluation process.
Addressing the limitations of the existing literature, this paper establishes a comprehensive evaluation indicator system by selecting energy efficiency indicators from three dimensions. Furthermore, it employs the Fuzzy BORDA method to quantify and rank the energy efficiency of workshops. The key contributions are summarized as follows:
1) This research develops a multi-dimensional framework for evaluating energy efficiency based on the operational characteristics of manufacturing facilities and the fundamental principles of the DSR model. The proposed system is designed to comprehensively capture and reflect the holistic state of energy efficiency within factory workshops, thereby offering a detailed and accurate viewpoint for the management of energy efficiency.
2) Fully considering the variability in results from different evaluation methods during the assessment process, this study introduces an energy efficiency evaluation model for factory workshops grounded in the fuzzy Borda approach. The proposed model integrates both evaluation scores and ranking results to ensure a comprehensive assessment. Additionally, it utilizes Kendall’s W coefficient for a priori consistency checks, thus ensuring the scientific robustness and rigor of the evaluation process.
3) By employing the assessment model proposed in this paper, factories can accurately identify workshops with low energy efficiency, thereby providing a scientific basis for management to implement targeted energy-saving measures. This not only directly reduces energy costs and the unnecessary expenditures associated with energy waste but also enhances the profitability of the enterprise. Furthermore, enterprises that efficiently utilize resources are more likely to obtain government subsidies and tax incentives, gaining a competitive edge in the market. The combined effect of these factors can lead to significant indirect economic benefits for the enterprise.
The structure of this paper is as follows. Section 2 elaborates on the methodology for establishing a scientifically robust and practical energy efficiency evaluation index system. Section 3 concentrates on the construction of an energy efficiency index system based on the DSR model. Section 4 introduces the energy efficiency evaluation model grounded in the fuzzy Borda method. Section 5 offers a case study to illustrate the practical application of the proposed model. Section 6 summarizes the paper and outlines the principal conclusions. The energy efficiency evaluation model developed in this study enables enterprises to precisely pinpoint key areas impacting energy consumption, facilitating the formulation of more targeted energy-saving strategies. This contributes significantly to achieving carbon reduction objectives.
2 Indicator System Construction Principles and Evaluation Process
The establishment of an energy efficiency assessment indicator system is the first task of the assessment work, which aims to comprehensively reveal the core features and attributes of the assessed objects. The scientific rationality of the construction of the indicator system directly determines the accuracy of the assessment results. Therefore, the following principles need to be followed when establishing an energy efficiency assessment index system for the factory floor [19].
1) Scientific and practical. The indicator system should be able to scientifically and objectively reflect the energy efficiency status of the workshop, and the objectives should be clear and applicable to a wide range.
2) Measurability and comparability. Selected evaluation indicators should be easily accessible and comparable with each other.
3) Comprehensiveness and simplicity. The indicator system should be able to comprehensively reveal the energy efficiency status of electricity consumption in workshops, and at the same time have a clear structure and concise expression.
4) Operationality and independence. The indicator system should be easy to operate and process, while at the same time keeping the indicators as independent as possible and avoiding cross-meaning and duplication between indicators.
To comprehensively understand the energy usage situation of a factory workshop, the conventional process for assessing energy efficiency levels mainly covers the following three key steps:
1) Establishing an Energy Efficiency Indicator System: Based on the specific energy consumption characteristics of the workshop, select appropriate evaluation indicators to establish a scientific and practical energy efficiency indicator system. This system is designed to accurately and objectively reflect the energy efficiency status of the workshop, ensuring that the assessment objectives are clear and the application scope is broad.
2) Data Collection and Preprocessing: After determining the evaluation indicators, the next crucial step is to collect relevant data and carry out necessary preprocessing work. This process requires ensuring the quality and accuracy of the data so that subsequent analysis can proceed smoothly. The accessibility and comparability of the data are the main focuses at this stage.
3) Calculation, Analysis, and Evaluation: Using the established energy efficiency assessment model, conduct an in-depth analysis of the collected data to evaluate the energy efficiency level of the entire workshop and its various subsystems. This phase not only provides a comprehensive evaluation of the overall energy efficiency condition but also offers improvement suggestions for specific areas or equipment, helping to achieve more efficient energy management.
Through these steps, it is possible to effectively assess and optimize the energy efficiency performance of the factory workshop, promote the rational use of resources, reduce production costs, and also contribute to environmental protection.
3 Energy Efficiency Indicator System Based on DSR Modelling
The DSR model is an extensively applied framework in environmental management and policy analysis, designed to evaluate environmental issues and policy outcomes by examining the interactions among drivers, states, and responses within a system. In the context of this study, which focuses on electricity consumption, the DSR model has been chosen to comprehensively capture and reflect the holistic energy efficiency status of factory workshops. This encompasses external driving factors that influence energy efficiency, internal states reflecting current conditions, and response measures taken to improve efficiency. The multi-dimensional analytical framework provided by the DSR model facilitates a more comprehensive and systematic understanding and assessment of energy efficiency levels within factory workshops.
This paper combines the DSR model with the electric power industry to construct the energy efficiency evaluation index system of factory workshops and divides it into three levels. The first layer is the target layer, which is the highest layer of the index system and represents the general objective of the evaluation system of the plant workshop. The second layer is the influence factor layer, which consists of three dimensions: driving force, state, and response. The third layer is the indicator layer, which mainly refers to the basic indicators of energy efficiency evaluation of factory workshops, and is the basic component unit of the indicator system. The specific system framework is shown in Fig. 1.
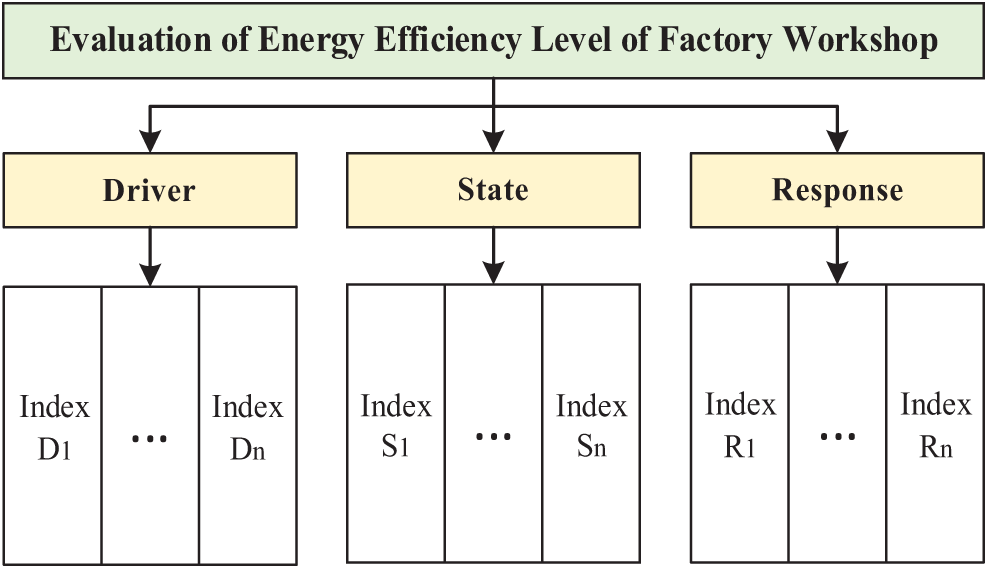
Figure 1: Factory workshop energy efficiency evaluation index system framework
3.2 Selection of Energy Efficiency Evaluation Indicators
1) Driving force subsystem: Driving force refers to the driving factor that directly or indirectly triggers a change in energy efficiency. The total annual power consumption and annual production value in a factory are the most basic and direct driving factors that lead to changes in energy efficiency. Therefore, annual power consumption D1 and annual production value D2 can be used as driving force indicators in the energy efficiency assessment system [20].
2) State subsystem: state refers to the specific performance of workshop energy efficiency under the influence of driving force. It can accurately reflect the influence of workshop power quality on energy efficiency levels. Combined with the characteristics of workshop energy use, the following four indicators can be used as state indicators [21].
Voltage pass rate S1 is the percentage of hours in a year that the voltage at the monitoring point is within the pass range.
The current unbalance rate S2 refers to the degree of asymmetry of the transformer’s three-phase currents and is expressed as:
where,
The average load factor S3, is the average output apparent power as a percentage of the rated capacity and is expressed as:
where,
The power factor S4, which reflects the operational efficiency of the transformer, is expressed as:
where, P denotes active power; Q denotes reactive power.
3) Response subsystem: the response indicators reflect that the factory floor improves the resource utilization efficiency reduces the energy cost by changing the existing conditions, and presents different degrees of response results. Therefore, the proportion of high energy consumption transformers R1 and the energy efficiency class of important energy consumption equipment R2 can be used as response indicators.
4 Energy Efficiency Assessment Model Based on Fuzzy Borda Method
Since the evaluation indicators include cost indicators and benefit indicators, the correlation between the two and the energy efficiency level is the opposite. Therefore, before using the evaluation model to assess the energy efficiency of the factory floor, the raw data should be unified in type and de-scaled for the convenience of calculation.
Firstly, the raw data are used to establish the evaluation matrix L. Let m be the number of workshops to be evaluated. n be the number of energy efficiency evaluation indexes. lij denotes the raw data of workshop i corresponding to the jth evaluation index.
The indicator types are then harmonised. The data remain unchanged when the original indicator is in the benefit category. When the raw indicator falls under a cost category, the conversion formula is as follows:
where,
Finally, the data for each indicator were standardised to avoid the impact of different scales on the results:
where, gij is the standardised indicator value.
4.2 Single Evaluation Methodology Set
In the selection of evaluation methods, this study adopts the GRA, EWM, and TOPSIS as a set of individual evaluation methods. Each method has its advantages, allowing for the assessment of energy efficiency from different perspectives. The grey relational analysis is suitable for systems with incomplete data and uncertain information; the entropy weight method can objectively determine the weights of indicators, reducing subjectivity; and the TOPSIS method ranks the evaluation objects based on their proximity to the ideal solution, intuitively reflecting the performance differences among the evaluated entities.
The grey correlation method first determines the ideal optimal objective based on the actual situation. The degree of correlation is then determined by comparing the geometric curves and their shapes with the optimal goal. If the curves and their shapes change in a consistent trend, the degree of correlation between the two is high; on the contrary, it is low. Finally, according to the degree of correlation of each objective, it is ranked and the advantages and disadvantages of each objective are judged. The specific evaluation process is as follows:
1) The preprocessed data are noted as
where,
2) The correlation between the
3) Rank the energy efficiency level of each workshop according to the size of
The concept of entropy first originated in thermodynamics, which is used to describe the degree of disorder or chaos of a system and quantitatively evaluated through statistical mechanics. The entropy weight method can determine the weight of each index according to the information contained in each original data, which can avoid subjective arbitrariness to a certain extent and is an objective evaluation method. It is widely used due to its easy calculation and reliable results. The specific steps of entropy weight method evaluation are as follows:
1) Standardising the raw data so that both benefit and cost indicators have larger values as they become more energy efficient, as described in Section 3.1.
2) Calculate the information entropy of each indicator
3) Calculation of the weights of the indicators
where,
4) Find the value
The TOPSIS method ranks the different evaluation objectives according to their proximity to positive and negative ideal solutions, which allows objective evaluation of the objectives. The steps of energy efficiency evaluation of plant floor based on the TOPSIS method are as follows:
1) A matrix of weighted criteria is formed. The formula for calculating the weights of the indicators is shown below:
where,
Determine the weighted normalised decision matrix as shown below:
2) Calculate the closeness. It may be assumed that the positive ideal solution
The distance of the evaluation object to the positive and negative ideal solutions is then calculated. The distances
Find the proximity of each workshop assessment indicator
3) The final ranking of the energy efficiency level of each workshop is based on the size of
4.3 Fuzzy Borda Method of Portfolio Evaluation
4.3.1 Evaluation of the Fuzzy Borda Method
The fuzzy Borda method is a multi-criteria decision-making approach based on fuzzy logic, which conducts comprehensive evaluations by considering the scores and rankings of each evaluation object across different evaluation methods. Energy efficiency assessment in factory workshops involves multiple complex factors, often characterized by uncertainty and fuzziness. The fuzzy Borda method can effectively handle the uncertainties and ambiguities in evaluation indicators, especially when dealing with multiple evaluation methods and criteria, providing a comprehensive and objective evaluation result. Additionally, the fuzzy Borda method has advantages in ensuring the consistency and reliability of evaluation results. Calculating the fuzzy Borda scores for each evaluation object reduces biases that may arise from individual evaluation methods, enhancing the stability and credibility of the evaluation results.
The fuzzy Borda method takes into account both the scores and ordinal values of each single evaluation method when performing the combined evaluation. If y is the total number of single evaluation methods used and
1) Calculation of affiliation
2) Calculate the fuzzy frequency
In the formula, if the workshop
3) The conversion score
4) The fuzzy Borda score
5) The energy efficiency level of each workshop is sorted according to the size of
1) Kendall-W prior consistency test. Different single evaluation methods will have different evaluation results, through the consistency test, the decision maker can be clear about which methods have consistent evaluation results and can be evaluated in combination. The Kendall-W coefficient is tested for consistency by constructing a statistic,
where,
The method mainly performs consistency testing by determining whether
2) Spearman post hoc consistency test. After obtaining the combined evaluation results, the Spearman rank correlation coefficient method is usually used to test the validity of the results. The Spearman rank correlation coefficient between the results of each single evaluation method and the results of the combined method is calculated, denoted as rq, and the test statistic is calculated as:
where,
When the statistic is greater than a critical value, it means that it passes the post hoc test for portfolio evaluation, indicating a strong link between the portfolio evaluation method and the single evaluation method.
4.4 Energy Efficiency Assessment Modelling
The solution flow of the proposed energy efficiency evaluation model for factory workshops based on the fuzzy Borda method is shown in Fig. 2. Firstly, according to the characteristics of energy use in the factory, the evaluation index system based on DSR is established. Then a single evaluation method is selected to evaluate the workshop. Subsequently, the evaluation results are compared. If the results are inconsistent, a consistency test is carried out, and after the test is passed, the fuzzy Borda method is selected to carry out a combined evaluation of the results obtained from a single evaluation method, and then a post hoc consistency test is carried out on the test results. If the test passes, the optimal evaluation result of the energy efficiency level of the plant is obtained.
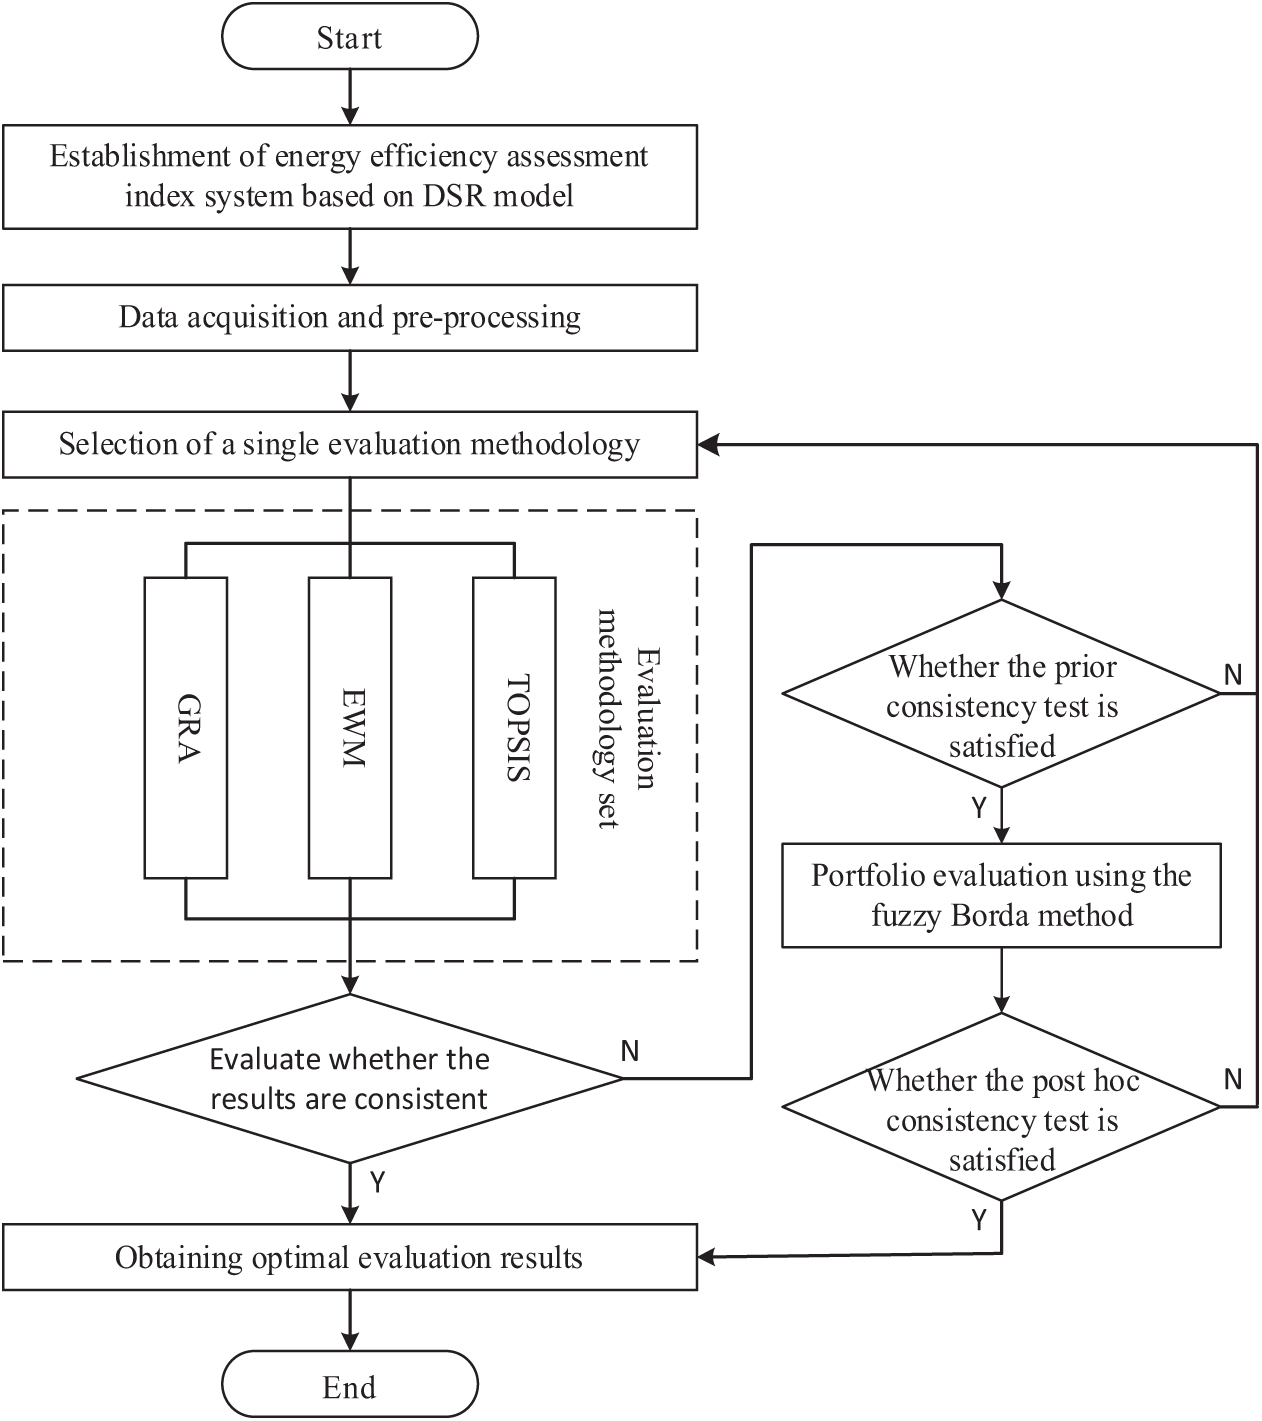
Figure 2: Flow chart of portfolio evaluation model based on fuzzy Borda method
5.1 Energy Efficiency Assessment System Established
To verify the validity of the assessment model proposed in this paper, 10 workshops in a factory were selected for energy efficiency assessment analysis. Firstly, based on the DSR selection of evaluation indicators to establish a factory floor energy efficiency assessment system, the system-specific indicators and types of indicators as shown in Fig. 3.
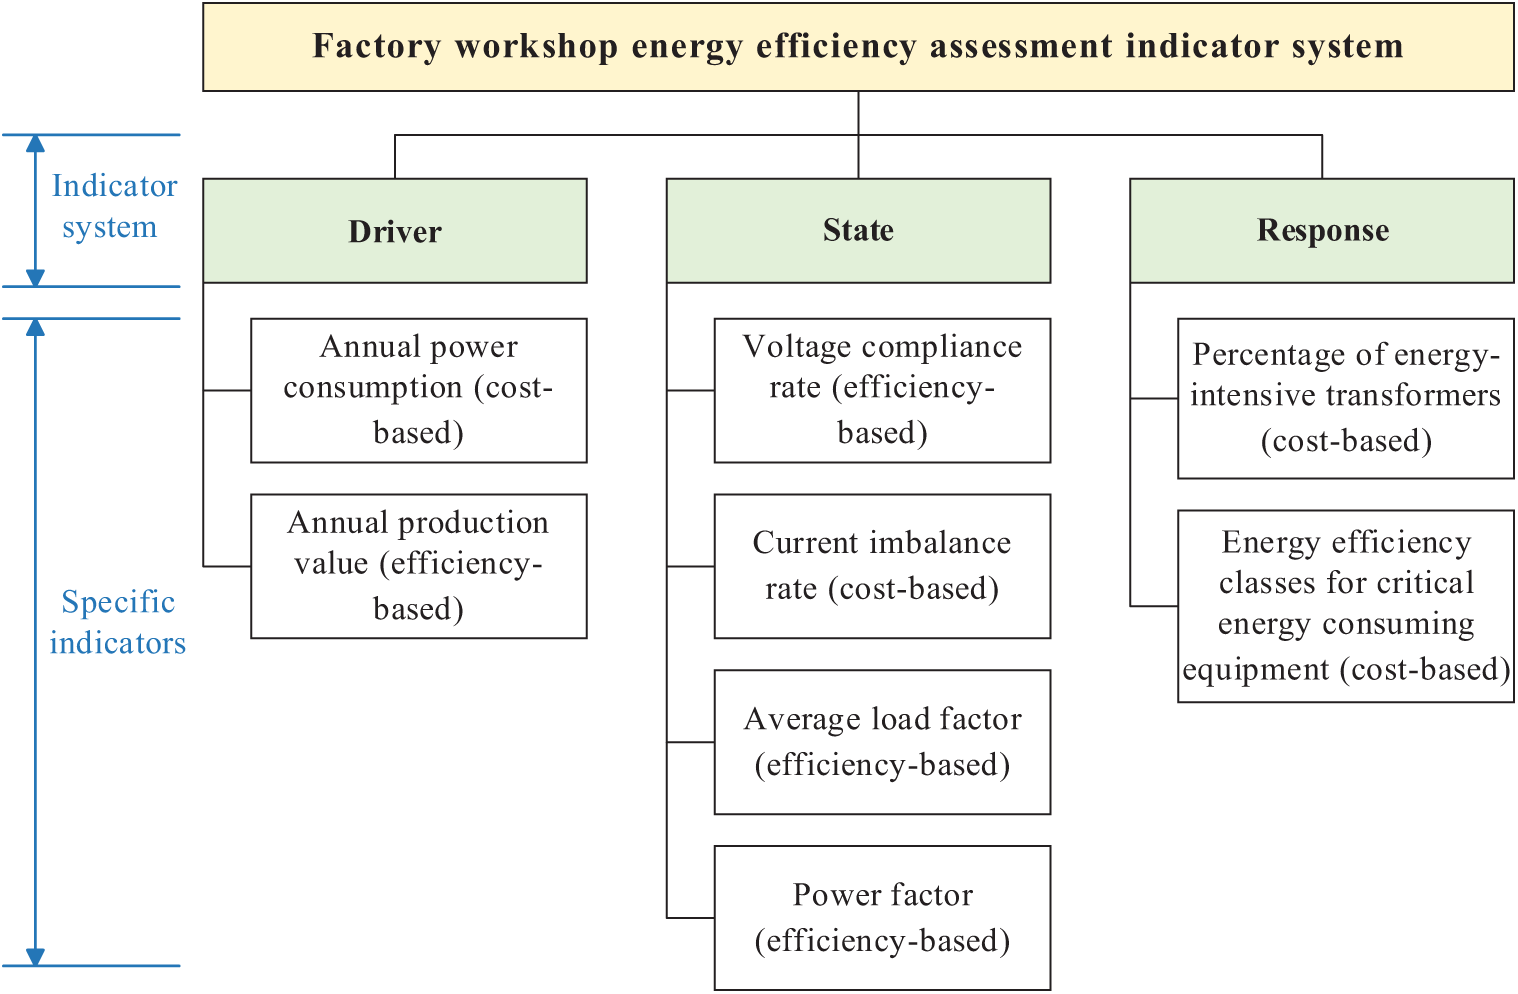
Figure 3: Factory workshop energy efficiency assessment indicator system
Then the corresponding raw indicator data were collected according to the selected indicators. Type unification and de-quantification were also carried out to obtain standardised energy efficiency indicator data, as shown in Table 1.

5.2 Single Evaluation Method Scoring and Ranking
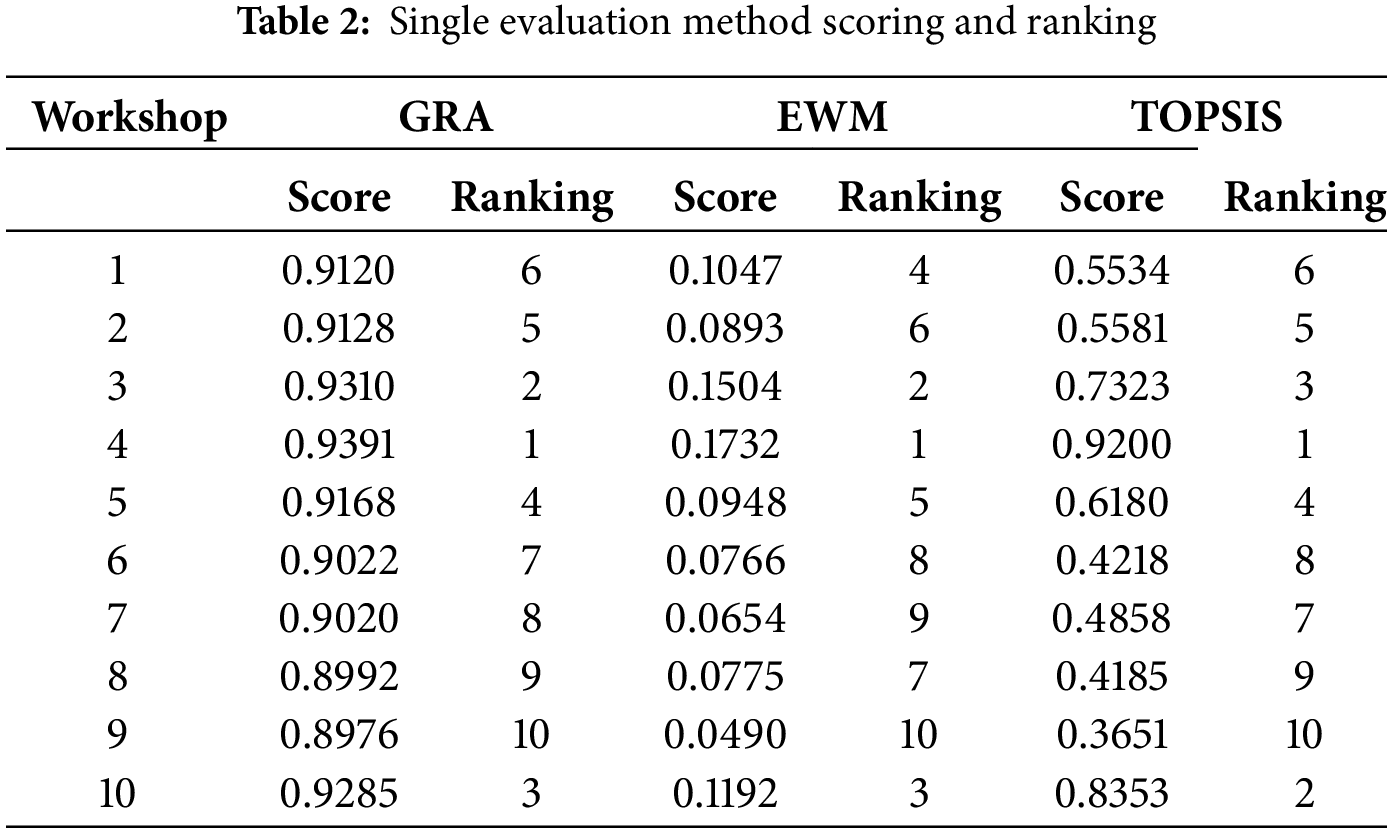
Three single evaluation methods, GRA, EWM, and TOPSIS methods, were used to evaluate the energy efficiency level of the factory workshop, respectively, and the scoring and ranking results are shown in Table 2.
The scores obtained from each of the three single evaluation methods were normalised and the results obtained are shown in Fig. 4.
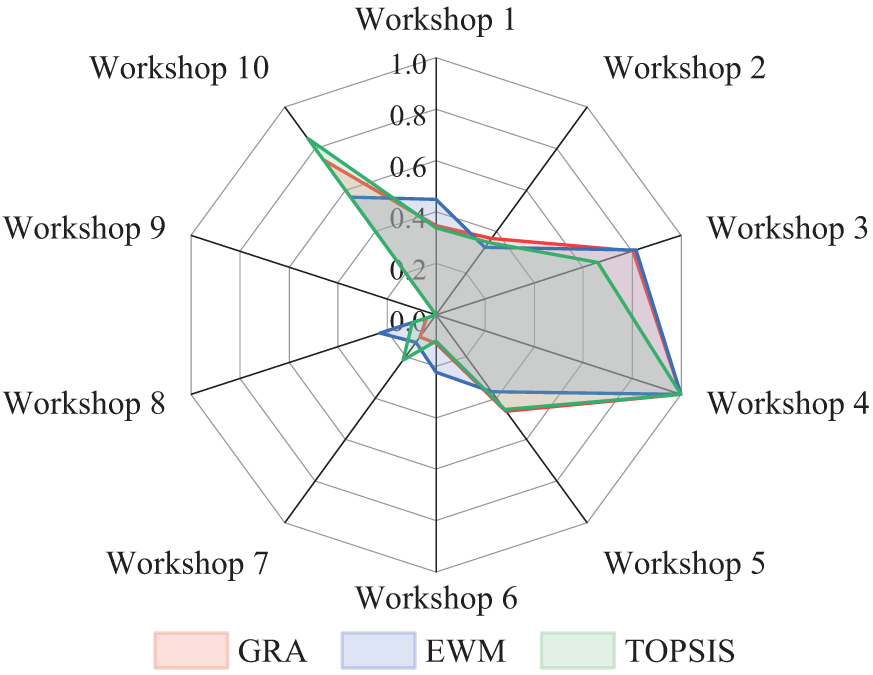
Figure 4: Comparison chart of scores of different evaluation methods
As can be seen from Table 2 and Fig. 4, there are slight differences in the results obtained by the different single evaluation methods in ranking the energy efficiency levels of workshops due to the different main ideas of each method. Workshop 4 and Workshop 9 have the same ranking under the three single evaluation methods, which are 1st and 10th, respectively. This indicates that Workshop 4 has the best level of energy efficiency under all three evaluation methods, while Workshop 9 has the worst level of energy efficiency. The other 8 workshops have different rankings under different evaluation methods.
5.3 Fuzzy Borda Portfolio Evaluation
Due to the differences in the results obtained by a single evaluation method, the evaluation results of the three methods were combined using the fuzzy Borda method. Based on the comparison of the calculated fuzzy Borda numbers of each workshop, the final ranking of the workshop’s energy efficiency level can be determined.
Before performing the combined evaluation, the compatibility of the single evaluation methods needs to be tested. Kendall correlation coefficient was first calculated for the ordinal values of the three evaluation methods to reveal the intrinsic correlation between them. The results are shown in Fig. 5.
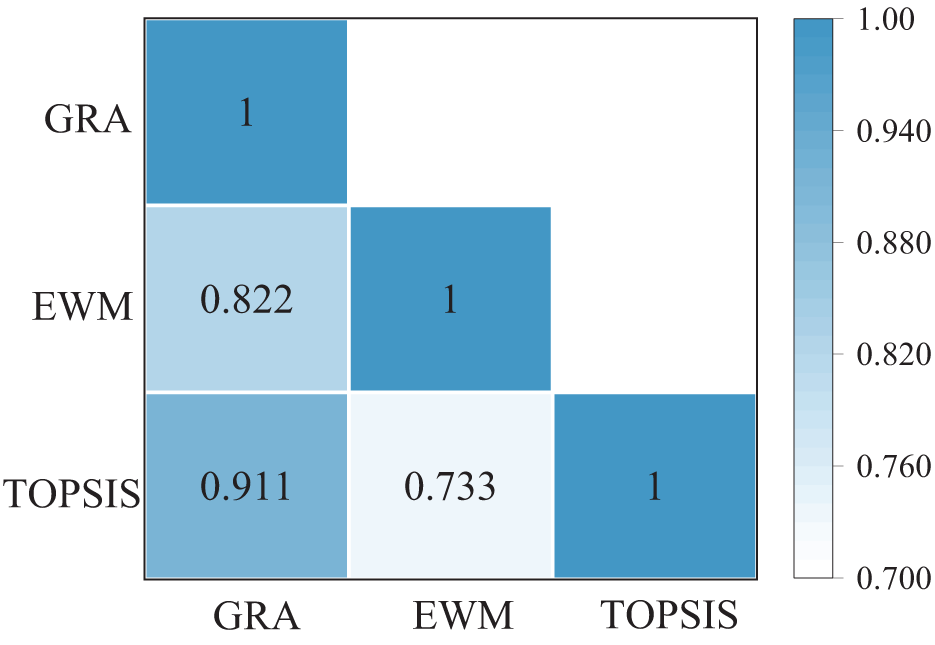
Figure 5: Kendall’s correlation coefficient chart
As can be seen in Fig. 5, the correlation coefficients between the results obtained from each single evaluation method and the results of the other 2 single methods range from 0.733 to 0.911, which indicates that there is a certain degree of correlation between the 3 evaluation methods. Then the Kendall-W coefficient consistency test was performed on the ordinal values of the three single evaluation methods, and the Kendall-W coefficient of synergy
After the successful completion of the consistency test, the results obtained from the above three single evaluation methods were assessed in combination using the fuzzy Borda combination evaluation method. Firstly, based on Eq. (23), the affiliation degrees corresponding to each of the 10 workshops under the three evaluation systems were calculated. The specific values are shown in Table 3.

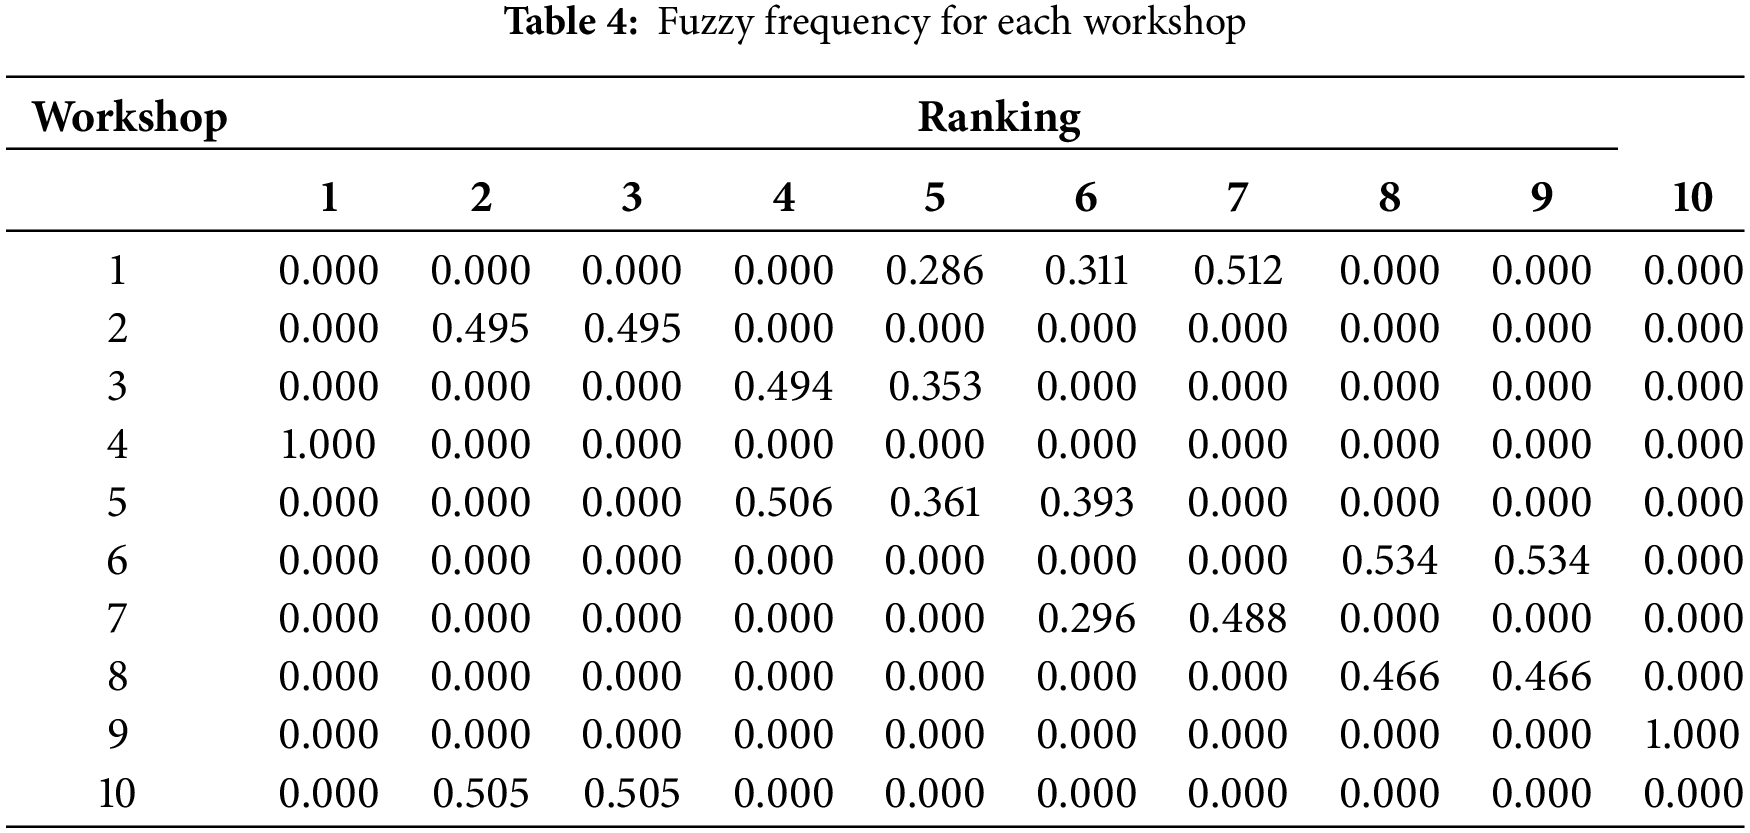
Substituting the affiliation degree calculated in the above table into Eqs. (24) and (25) can calculate the fuzzy frequency of the ith workshop located in the hth (1 ≤ h ≤ 10th) place and its value is shown in Table 4.
According to Eq. (26), the conversion score of “rank” h (1 ≤ h ≤ 10) is calculated, and its value is shown in Table 5.

By substituting the fuzzy frequencies and conversion scores of each workshop into Eq. (27), the fuzzy Borda numbers of the 10 workshops can be calculated. Based on these values, the workshops were ranked according to their scores from highest to lowest, and the results are shown in Table 6. The higher the score, the higher the ranking of the workshops.
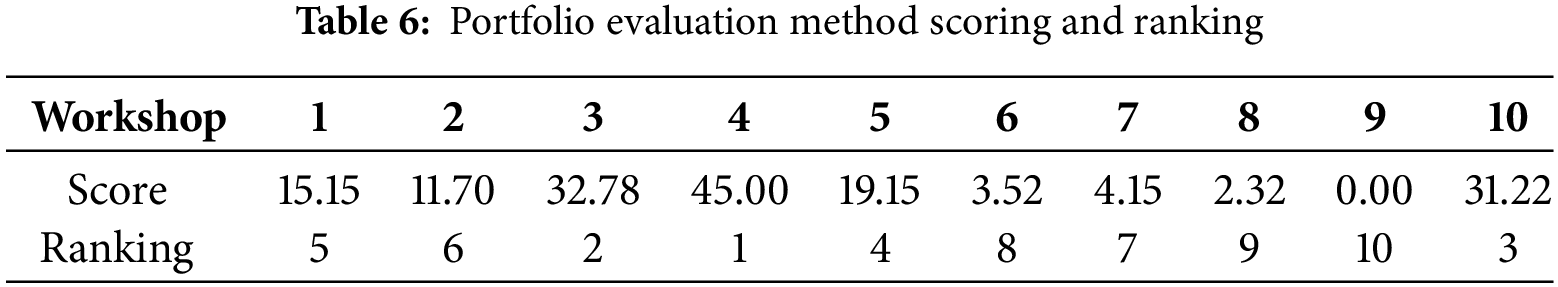
In Table 5, it is evident that Workshop 4 exhibits the highest composite score of 45.00, signifying its superior energy efficiency and securing the top rank among the evaluated workshops. Conversely, Workshop 9 is identified with the lowest combined score, placing it at the 10th position and indicating the poorest energy efficiency. The hierarchical order of energy efficiency for the 10 workshops, as determined by the integrated assessment, is presented in descending order as follows: 4 > 3 > 10 > 5 > 1 > 2 > 7 > 6 > 8 > 9. This ranking underscores the relative performance of each workshop in terms of energy efficiency, with Workshop 4 demonstrating the most optimized energy use and Workshop 9 requiring the most significant improvements.
A comparison of the overall workshop rankings obtained from the three single evaluation methods and the combined evaluation model is shown in Fig. 6.
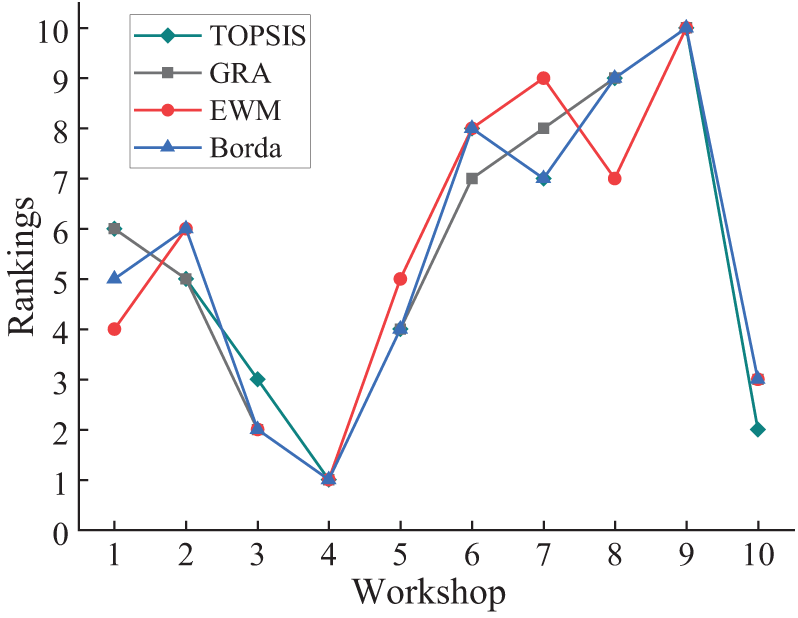
Figure 6: Ranking chart of different evaluation methods
As can be seen in Fig. 6, Workshops #3, #4, and #10 ranked high under both single and combined evaluations, and Workshops #6, #7, #8, and #9 ranked low under both single and combined evaluations. The ranking of the evaluation results of the fuzzy Borda method based on the combination idea differs less from the ranking of the results of the three single evaluation methods. However, it is impossible to judge whether the combined evaluation results are closely related to the results of the single evaluation methods only from the data. Therefore, Spearman’s post hoc test was conducted on the evaluation results of the combination evaluation model, and the specific results are shown in Fig. 7.
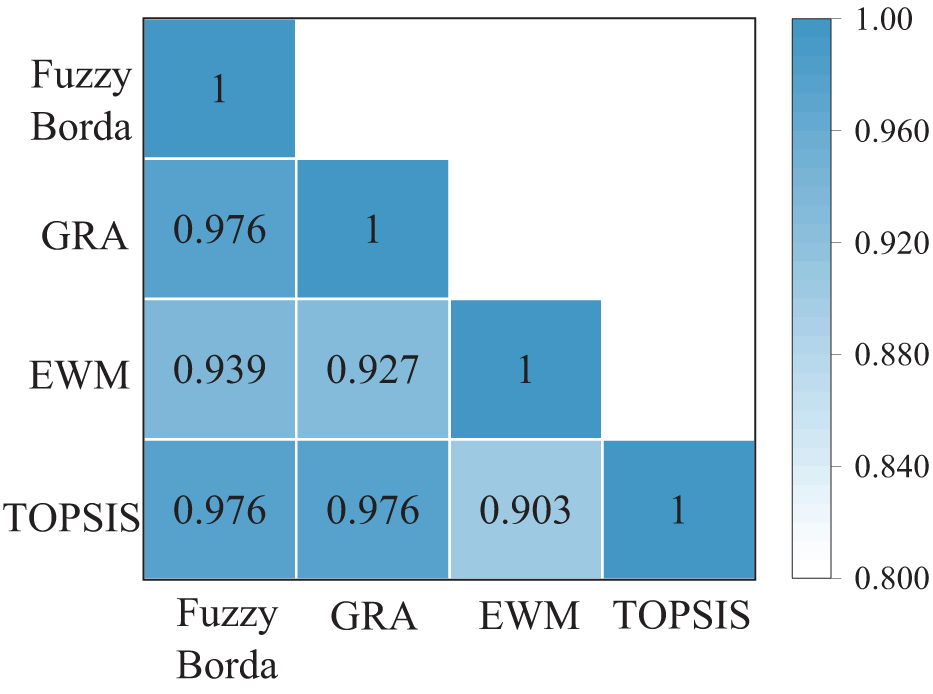
Figure 7: Spearman’s correlation coefficient chart
As illustrated in Fig. 7, the correlation coefficients between the fuzzy Borda method and single evaluation methods—GRA, EWM, and TOPSIS—have achieved high values of 0.976, 0.939, and 0.976, respectively. Given that the sample size of the evaluated objects is 10, the results of the computed test statistic
This high degree of consistency not only validates the effectiveness of the combined evaluation model but also provides an essential decision-support tool for workshop management in factories. In practical applications, factory management can leverage this method to fully utilize the synergistic advantages of the three individual evaluation methods, thus enabling a more comprehensive and rational assessment of energy usage within workshops. This facilitates the identification of workshops that excel in energy utilization (such as Workshops #3, #4, and #10) and those that require improvement (such as Workshops #6, #7, #8, and #9). As a result, management can develop targeted energy-saving measures to enhance overall energy efficiency and promote the achievement of sustainability goals. Furthermore, through continuous application of this evaluation model, factories can monitor long-term trends, and adjust strategies to address evolving production demands and technological advancements, ensuring optimal allocation and utilization of resources.
This paper develops a set of energy efficiency evaluation indicators tailored for factory workshops and, based on this indicator system, establishes an energy efficiency evaluation model for workshops using the fuzzy Borda method. This model appropriately assesses the energy efficiency levels of various workshops within the factory. The primary contributions and innovations of this paper are as follows:
1) Drawing on the production and operational characteristics of the factory and integrating the core principles of the DSR model, a multi-dimensional energy efficiency assessment system has been constructed. This system takes into account the three key dimensions of driving forces, status, and response, and conducts an in-depth refinement of the assessment indicators under each dimension. This ensures that the assessment system can comprehensively capture and reflect the overall energy efficiency status of the factory workshops, providing a comprehensive and precise perspective for energy efficiency management.
2) Taking into full account the differences in results from various evaluation methods during the assessment process, a factory workshop energy efficiency evaluation model based on the fuzzy Borda method has been proposed. This model not only integrates evaluation values and ranking results to ensure the comprehensiveness of the assessment but also employs Kendall’s coefficient of concordance for a priori consistency testing, thereby ensuring the scientific and rigorous nature of the evaluation process. It not only accurately identifies workshops with superior energy efficiency performance but also clearly highlights those that require improvement. The application of the evaluation results facilitates the precise identification of weak points in energy management within workshops, providing robust data support and a theoretical foundation for subsequent improvements in energy efficiency. Moreover, this promotes the formulation and implementation of targeted measures, thereby effectively enhancing overall energy efficiency levels.
While the method proposed in this paper holds significant practical value, it is accompanied by certain limitations. Specifically, the energy efficiency evaluation index system employed in this study, though encompassing key dimensions, could benefit from further expansion and optimization. Moreover, the current model is primarily geared towards assessing energy efficiency performance over past periods and lacks the capability for real-time evaluation. Therefore, in future research, it is recommended to broaden the scope of energy efficiency evaluation indices to achieve a more comprehensive and accurate assessment of workshop energy efficiency levels. Additionally, the integration of real-time data collection and analytical technologies could be considered to develop an energy efficiency monitoring system with real-time assessment capabilities.
Acknowledgement: The authors acknowledge the support and cooperation of their respective institutions.
Funding Statement: This research was funded by the National Social Science Fund of China (Grant No. 23BGL234).
Author Contributions: The authors confirm contribution to the paper as follows: Study conception and design: Shengjie Yang, Zijian Zhu; data collection: Zijian Zhu, Xu Ouyang; analysis and interpretation of results: Shengjie Yang, Zijian Zhu, Xu Ouyang; draft manuscript preparation: Zijian Zhu, Xu Ouyang. All authors reviewed the results and approved the final version of the manuscript.
Availability of Data and Materials: Due to the nature of this research, participants of this study did not agree for their data to be shared publicly, so supporting data is not available.
Ethics Approval: Not applicable.
Conflicts of Interest: The authors declare no conflicts of interest to report regarding the present study.
References
1. Mushafiq M, Arisar MMK, Tariq H, Czapp S. Energy efficiency and economic policy: comprehensive theoretical, empirical, and policy review. Energies. 2023;16(5):2381. doi:10.3390/en16052381. [Google Scholar] [CrossRef]
2. Zhu H, Zhang D, Goh HH, Wang S, Ahmad T, Mao D, et al. Future data center energy-conservation and emission-reduction technologies in the context of smart and low-carbon city construction. Sustain Cities Soc. 2023;89:104322. doi:10.1016/j.scs.2022.104322. [Google Scholar] [CrossRef]
3. Wang J, Wang W, Wu H, Liu Y. Exploring the effects of manufacturing servitization on enterprise energy conservation and emissions reduction moderated by digital transformation. Energy Econ. 2023;122(3):106706. doi:10.1016/j.eneco.2023.106706. [Google Scholar] [CrossRef]
4. Xue B, Lu F, Guo J, Wang Z, Zhang Z, Lu Y. Research on energy efficiency evaluation model of substation building based on AHP and fuzzy comprehensive theory. Sustainability. 2023;15(19):14493. doi:10.3390/su151914493. [Google Scholar] [CrossRef]
5. Zare Banadkouki MR. Selection of strategies to improve energy efficiency in industry: a hybrid approach using entropy weight method and fuzzy TOPSIS. Energy. 2023;279(3):128070. doi:10.1016/j.energy.2023.128070. [Google Scholar] [CrossRef]
6. Es-sakali N, Zoubir Z, Idrissi Kaitouni S, Mghazli MO, Cherkaoui M, Pfafferott J. Advanced predictive maintenance and fault diagnosis strategy for enhanced HVAC efficiency in buildings. Appl Therm Eng. 2024;254(6):123910. doi:10.1016/j.applthermaleng.2024.123910. [Google Scholar] [CrossRef]
7. Shah WUH, Hao G, Yan H, Yasmeen R, Lu Y. Energy efficiency evaluation, changing trends and determinants of energy productivity growth across South Asian countries: SBM-DEA and Malmquist approach. Environ Sci Pollut Res Int. 2023;30(8):19890–906. doi:10.1007/s11356-022-23484-w. [Google Scholar] [CrossRef]
8. Hu Y, Man Y. Energy consumption and carbon emissions forecasting for industrial processes: status, challenges and perspectives. Renew Sustain Energy Rev. 2023;182:113405. doi:10.1016/j.rser.2023.113405. [Google Scholar] [CrossRef]
9. Yan J, Zeng C, Zhou X, Wang X. Evaluation and comparative analysis of urban public institutions energy-environmental efficiency from the perspective of dual carbon. J Clean Prod. 2023;414(15):137732. doi:10.1016/j.jclepro.2023.137732. [Google Scholar] [CrossRef]
10. Yang Z, Du C, Xiao H, Li B, Shi W, Wang B. A novel integrated index for simultaneous evaluation of the thermal comfort and energy efficiency of air-conditioning systems. J Build Eng. 2022;57:104885. doi:10.1016/j.jobe.2022.104885. [Google Scholar] [CrossRef]
11. Tian L, Cheng L, Li R, Sun S, Shi C, Gao W. A multi-scenario energy efficiency evaluation method for district multi-energy systems based on weighted directed graph. Proc CSEE. 2019;39(22):6471–83 (In Chinese). doi:10.13334/j.0258-8013.pcsee.181552. [Google Scholar] [CrossRef]
12. Li J, Liu H, Wang R, Yan S, Cui L. Comprehensive efficiency evaluation of integrated energy system based on cross-super-efficiency CCR model. Automati Elect Power Syst. 2020;44(11):78–86 (In Chinese). [Google Scholar]
13. Jiang Y, Fu J, Li Z, Zhang Y, Yin J, Yao J. A comprehensive evaluation model of buildings based on improved TOPSIS. J Shanghai Jiaotong Univ. 2023;57(7):868–77 (In Chinese). [Google Scholar]
14. Zhang H, Li L, Li L, Cai W, Liu J, Sutherland JW. An integrated energy efficiency evaluation method for forging workshop based on IoT and data-driven. J Manuf Syst. 2022;65(5):510–27. doi:10.1016/j.jmsy.2022.10.010. [Google Scholar] [CrossRef]
15. Maziotis A, Sala-Garrido R, Mocholi-Arce M, Molinos-Senante M. A comprehensive assessment of energy efficiency of wastewater treatment plants: an efficiency analysis tree approach. Sci Total Environ. 2023;885(2):163539. doi:10.1016/j.scitotenv.2023.163539. [Google Scholar] [CrossRef]
16. Gong W, Qi X, Wang C, Li W, Xu Y. Influencing factors of total factor energy efficiency in Bohai rim region based on DEA-Tobit model. Energy Eng. 2022;119(4):1663–79. doi:10.32604/ee.2022.018886. [Google Scholar] [CrossRef]
17. Zhao L, Wang L, Wan C, Wu M, Yuan K, Song Y. Segmented energy efficiency evaluation of urban integrated energy system based on data envelopment analysis method. Automat Elect Power Syst. 2022;46(17):132–41 (In Chinese). [Google Scholar]
18. Zhang XQ, Cheng QL, Sun W, Zhao Y, Li ZM. Research on a TOPSIS energy efficiency evaluation system for crude oil gathering and transportation systems based on a GA-BP neural network. Petrol Sci. 2024;21(1):621–40. doi:10.1016/j.petsci.2023.08.020. [Google Scholar] [CrossRef]
19. Zhao H, Li B, Lu H, Wang X, Li H, Guo S, et al. Economy-environment-energy performance evaluation of CCHP microgrid system: a hybrid multi-criteria decision-making method. Energy. 2022;240(4):122830. doi:10.1016/j.energy.2021.122830. [Google Scholar] [CrossRef]
20. Cai W, Wang L, Li L, Xie J, Jia S, Zhang X, et al. A review on methods of energy performance improvement towards sustainable manufacturing from perspectives of energy monitoring, evaluation, optimization and benchmarking. Renew Sustain Energy Rev. 2022;159:112227. doi:10.1016/j.rser.2022.112227. [Google Scholar] [CrossRef]
21. Zhao H, Li J. Energy efficiency evaluation model of park customers based on PSR and improved grey TOPSIS. Elect Power. 2022;55(3):203–12 (In Chinese). [Google Scholar]
Cite This Article
 Copyright © 2025 The Author(s). Published by Tech Science Press.
This work is licensed under a Creative Commons Attribution 4.0 International License , which permits unrestricted use, distribution, and reproduction in any medium, provided the original work is properly cited.
 Downloads
 Citation Tools