
 Submit a Paper
 Propose a Special lssue
 Open Access
ARTICLE

Research on Energy Mutual Assistance Control Strategy between Low-Voltage Stations Using Micro-Pumped Storage System with Common Reservoir Mode
1 Power Distribution Department, China Electric Power Research Institute, Beijing, 100192, China
2 Electric Power Research Institute, State Grid Henan Electric Power Co., Ltd., Zhengzhou, 450052, China
3 School of Electrical and Control Engineering, North China University of Technology, Shijingshan District, Beijing, 100144, China
* Corresponding Author: Yingjie Zhou. Email:
(This article belongs to the Special Issue: Innovative Approaches in Clean Energy Systems: Integration, Sustainability, and Policy Impact of Renewable Energy)
Energy Engineering 2025, 122(3), 1093-1112. https://doi.org/10.32604/ee.2025.060349
Received 30 October 2024; Accepted 20 January 2025; Issue published 07 March 2025
 View Full Text
 Download PDF
Abstract
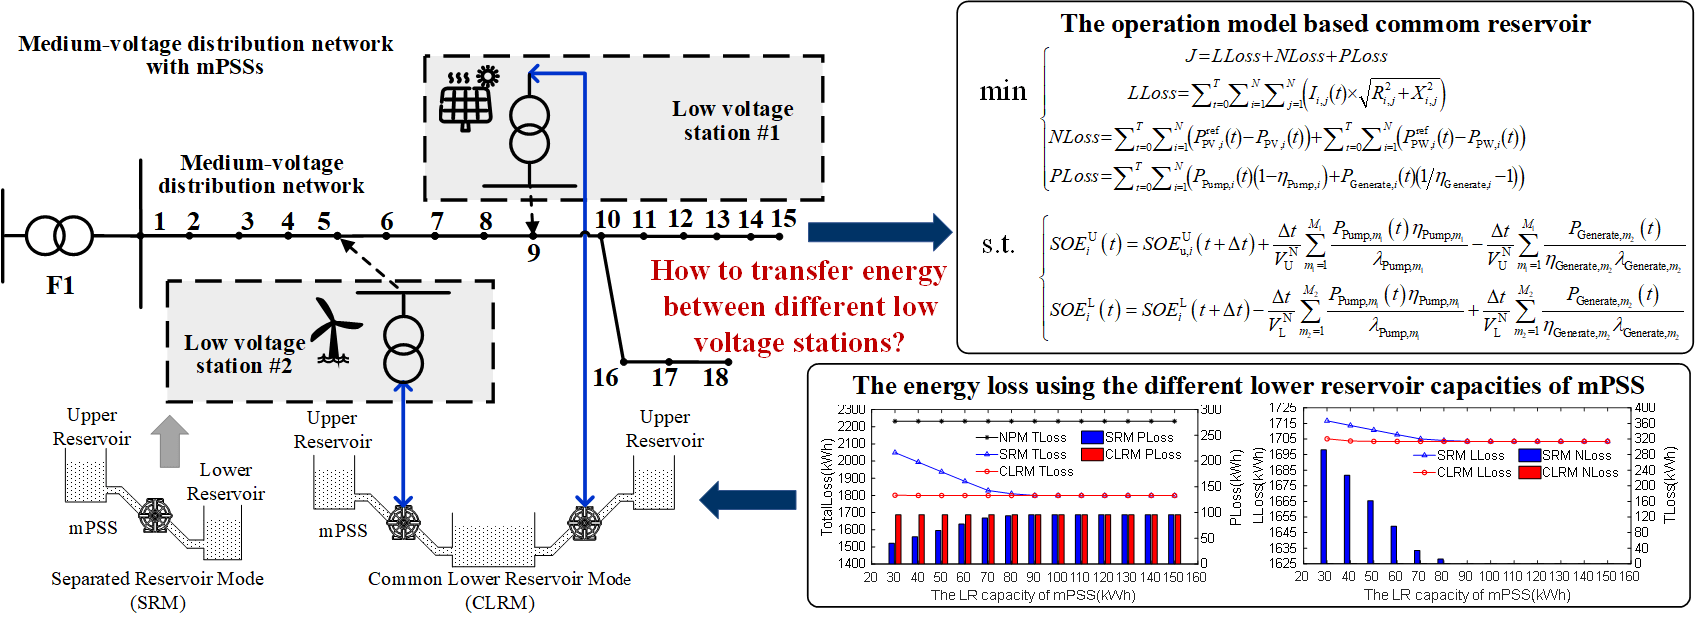
To enhance energy interaction among low-voltage stations (LVSs) and reduce the line loss of the distribution network, a novel operation mode of the micro-pumped storage system (mPSS) has been proposed based on the common reservoir. First, some operation modes of mPSS are analyzed, which include the separated reservoir mode (SRM) and common reservoir mode (CRM). Then, based on the SRM, and CRM, an energy mutual assistance control model between LVSs has been built to optimize energy loss. Finally, in the simulation, compared to the model without pumped storage in the LVS, the SRM and CLRM can decrease the total energy loss by 294.377 and 432.578 kWh, respectively. The configuration of mPSS can improve the utilization rate of the new energy source generation system, and relieve the pressure of transformer capacity in the LVS. Compared with the SRM, the proposed CRM has reduced the total energy loss by 138.201 kWh, increased the new energy consumption by 161.642 kWh, and decreased the line loss by 7.271 kWh. With the efficiency of the mPSS improving, the total energy loss reduction of CRM will be 3.5 times that of SRM. Further, the CRM can significantly reduce the reservoir capacity construction of mPSS and is more suitable for scenarios where the capacity configuration of mPSS is limited.Graphic Abstract
Keywords
Nomenclature
| LVS | Low-voltage station |
| mPSS | Micro-pumped storage system |
| PSS | Pumped storage system |
| PVGs | Photovoltaic generation system |
| WTGs | Wind turbine generation system |
| NPM | None pumped storage mode |
| SRM | Separated reservoir mode |
| CRM | Common reservoir mode |
| CLRM | Common lower reservoir mode |
| UR | Upper reservoir |
| LR | Lower reservoir |
| LLOSS | Energy loss of lines |
| NLOSS | New energy source abandoned |
| PLOSS | Operation energy loss of mPSS |
| TLOSS | Total energy loss |
| SOE | The state of energy |
| PG,i, QG,i | Active and reactive power injected into the medium-voltage network |
| PPump,i, PGenerate,i | Active power pumped and generated by the mPSS |
| PL,i, QL,i | Active and reactive power of load |
| Pi,j, Qi,j, Ii,j | Active power, reactive power and square of current between j-th and i-th node |
| Ri,j, Xi,j | Resistance and reactance between i-th and j-th node |
| Umini, Umaxi | The minimum and maximum square voltage |
| PPV,i, PrefPV,i | Actual and maximum power of the PVGS |
| PPW,i, PrefPW,i | Actual and maximum power of the WTGS |
| uc,i, ud,i | Variables of pump and generation state of mPSS |
| PmaxPump,i, PmaxGenerate,i | Maximum pump and generation power of mPSS |
| SOEU,mini, SOEU,maxi | Minimum and maximum SOE of the UR |
| SOEL,mini, SOEL,maxi | Minimum and maximum SOE of the LR |
| SOEU,initi, SOEL,initi | Initial SOE of the UR and LR |
| λPump,i, λGenerate,i | Ratio of operating power to the water flow |
| ηPump,i, ηGenerate,i | Pump and generation efficiency of mPSS |
| VNU, VNL | Volume of the UR and LR |
As an essential component of the power system, the distribution low-voltage station (LVS) mainly adopts the form of a single transformer and single-line power supply, resulting in an independent power supply in the LVS and a lack of unified control [1]. With the proportion of new energy source generation systems in the LVS constantly increasing, a challenge has been posed to the aggregation and regulation of distributed resources among LVSs [2]. As an effective way to balance the contradiction between new energy source generation and load electricity consumption in the LVS, based on some cascade hydropower systems [3], small hydropower systems [4], and abandoned mines [5], the micro-pumped storage system (mPSS) has been widely concerned.
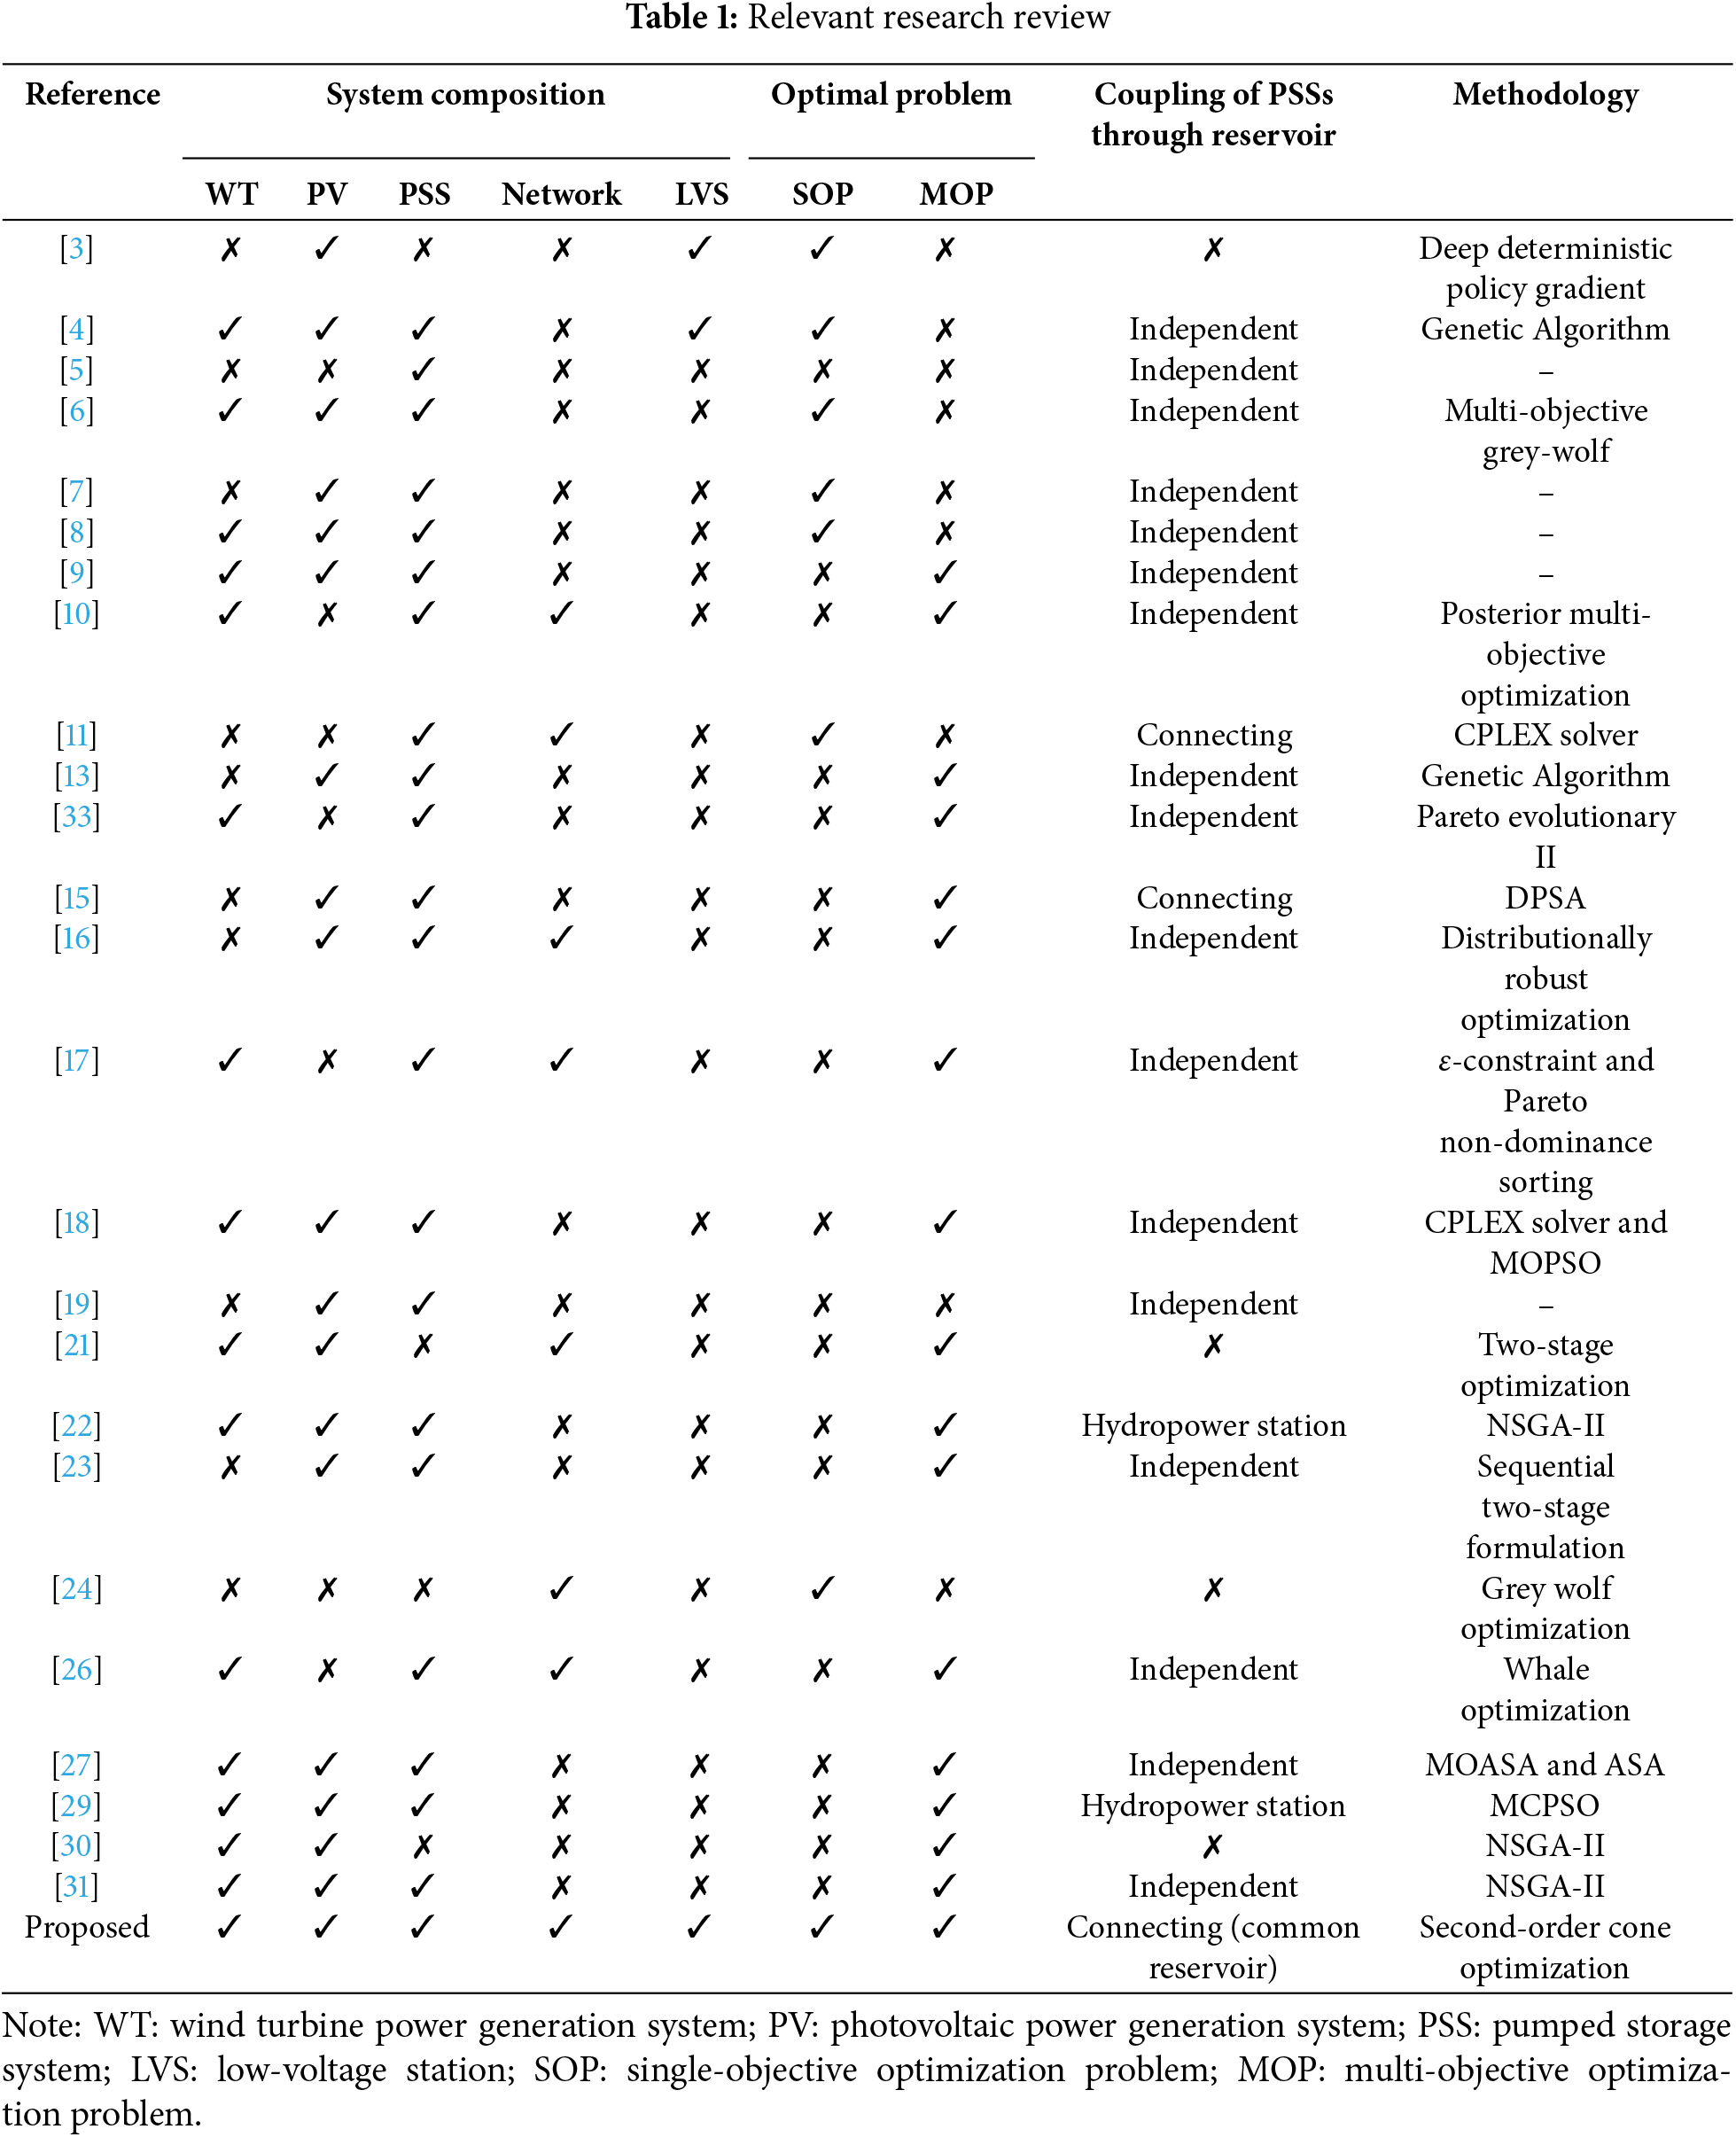
Experts from various countries have studied the economics [6], control strategies [7], and capacity configuration [8] of mPSS. In a wind-solar-pumped storage hybrid system, a multi-objective capacity optimization model is proposed to improve the utilization rate of new energy source generation. Then, the capacity optimization results are obtained by adjusting the weight coefficients of the weighted factors method [9]. To address grid reconstruction costs due to transmission grid issues and maximize wind energy utilization, a joint operation scheme of pumped storage system (PSS) and wind turbine generation system (WTGS) is investigated [10]. Then, an optimization model for PSS is developed. It coordinated power and water distribution to satisfy demand and reduce costs [11]. Based on abandoned coal mines, the feasibility of a PSS is discussed. It states that construction investment and reservoir capacity are essential for this application [12]. Regarding the operational issues of PSS, a temporary-periodic runoff discharge concept is introduced. Compared to existing hydropower stations’ single-source power generation method, the proposed method has increased by more than 53% [13]. An economic evaluation system is established for a wind-PV-pumped storage hybrid system. This study demonstrates the nonlinear correlation between economic benefits and the installed capacity of the hybrid system [14]. Then, a collaborative algorithm is proposed to optimize the capacity of a wind-pumped storage hybrid system. And, the complementarity of wind power and pumped storage is verified. A combined weighting method is used to find the best capacity of the PSS to fulfill various economic goals. This method would improve the hybrid system’s overall financial benefits. A seasonal joint operation method of hybrid pumped storage hydropower system (HPSH) is developed by considering the long-term energy storage of pumping stations. And HPSH can effectively reduce energy curtailment and increase power generation benefits [15]. A cascade hydro-photovoltaic system is analyzed in [16]. The dual role of cascade hydropower in supporting the complementary coordination between the power grid and photovoltaics has been clarified. The establishment of a short-term optimization scheduling model for the system has improved its overall consumption level. A two-stage optimization strategy is adopted to address a day-ahead and hourly forecast scheduling of a wind turbine power system with PSS based on the ε-constraint and an improved differential evolution method [17]. An optimal scheduling scheme for pumped storage-wind-solar-fire energy sources is created. The PSS can reduce operating expenses, decrease carbon emissions, enhance the stability of thermal power, and improve the system’s capability to absorb additional energy [18]. A novel variable speed solar micro-pumped storage (VSSMPS) system operates in Hengbung, Manipur. Based on the mPSS, the VSSMPS can utilize solar energy and export excess power to the grid. Then, the grid stability is improved [19].
With the PSS combined with other new energy generation exploring [20], the optimal scheduling of the energy storage system [21] and cascade hydro–wind–solar–thermal hybrid generation system [22] is mainly manifested in a multi-objective optimization problem. The uncertainty of grid demand, stochastic failures of PSS, and maintenance of pumping units are focused on. The two-stage optimization sequential method is proposed for considering service-related multi-objective functions [23]. In [24], a case-driven stochastic scheme for coordinated hub’s energy management is presented. A grey wolf optimization algorithm is used to solve the proposed optimization problem. The results indicate that the coordinated hub’s energy management is efficient in a day-ahead market. The normalized constraint algorithm is used to convert the scheduling problem of the three optimization objective functions of fuel consumption, air pollutant emission, and power purchase cost into a series of single-objective optimization problems [25]. In [26], the problems of multi-regional dynamic operation cost and water consumption are considered in the interconnected region of the wind turbine generation system and PSS, and the whale optimization algorithm is adopted to provide an effective tool for this complex multi-objective optimization problem. An improved residential micro-energy grid is proposed, which integrates the combined cooling and thermal power supply, photovoltaic, wind power, PSS, heat storage, and cold storage systems through the multi-objective artificial sheep algorithm to reduce the operating costs and emissions of residential micro-energy grid [27]. The multi-objective particle swarm optimization method [28] and improved cross particle swarm optimization algorithm [29] are used to realize the optimal control of PSS, considering multiple objective functions such as economy, emission, and power supply reliability of the integrated energy system, respectively. In the hydropower-wind-photovoltaic complementary system, a non-dominated sorting genetic algorithm II (NSGA II) is adopted to solve generation scheduling methods under multiple optimization objective functions, such as economic benefit, stable power transmission [30], and carbon emission [31]. The results show that the hybrid wind-PV-PSS plays a vital role in promoting the safe, economic, and efficient grid connection of renewable energy sources. A two-phase congestion management model is established in a virtual power plant application scenario with cascaded hydroelectric-PV-PSS hybrid generators and uses the improved hybrid non-dominated sorting genetic algorithm II (HNSGA-II) to solve [32]. The results show that the participation of virtual power plants in congestion management has some economic value to the power system. The studies of mPSS are summarized in Table 1.
At present, the above relevant literature pays more attention to the control strategy and economy of mPSS under multi-objective optimization conditions. However, they pay insufficient attention to the operation mode of mPSS. Insufficient consideration has been given to the joint role of multiple mPSSs between LVSs. The application of the mPSS to achieve mutual energy benefits between LVSs has also been neglected. Therefore, this paper proposes a novel operation mode in which the mPSSs of multiple LVSs share a common reservoir. Then, the advantages of the proposed operation mode are discussed. The main contributions of this paper are summarized as follows:
(1) This paper proposes, for the first time, a common reservoir mode (CRM) of mPSS for energy sharing among different LVSs. Based on this model, the concept and implementation method of energy mutual benefit in multiple LVSs are established.
(2) Compared with the traditional separated reservoir mode (SRM) of mPSS in each LVS, the proposed CRM can further improve the internal consumption of new energy sources in the LVS, achieve energy mutual benefit between LVSs, and reduce the line loss of medium-voltage distribution network.
(3) As the efficiency of the mPSS increases, in the reduction of total energy loss, CRM is much greater than SRM. The higher efficiency of the mPSS has a more obvious improvement in the application of the proposed model.
(4) Under the same energy loss degree, the CRM can greatly reduce the reservoir capacity of mPSS. And it is more suitable for some scenarios where the capacity of mPSS is limited.
The paper is structured as follows. Section 2 shows the structure and operation modes of a medium-voltage distribution network with multiple LVSs; Section 3 establishes the mathematical model of energy interconnection between LVSs based on mPSS; In Section 4, the simulation example analyses the control effect of mPSS using different operation modes; Section 5 discusses the effects of mPSS’s parameters. Finally, conclusions and future research are summarized in Section 6.
2 Structure and Operation Mode of Micro-Pumped Storage Systems for Low-Voltage Stations within the Medium-Voltage Distribution Network System
2.1 Distribution System Structure with Micro-Pumped Storage System
The structure of a medium-voltage distribution network containing multiple LVSs is illustrated in Fig. 1. There are multiple LVSs containing the photovoltaic generation system (PVGS), wind turbine generation system (WTGS), mPSS, and electrical load. The mPSS can balance the power relationship between the new energy source and the LVS.
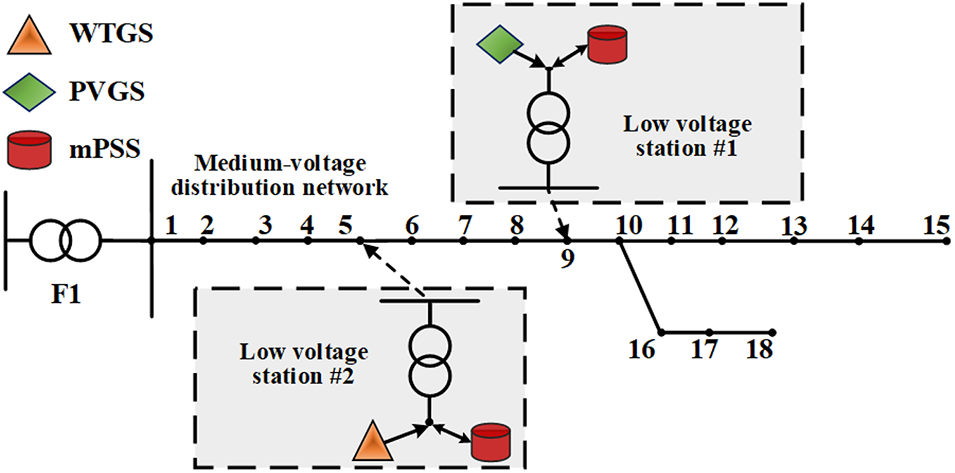
Figure 1: System structure of the medium-voltage distribution network with mPSS
In Fig. 1, there are a PVGS and a mPSS in LVS #1, and a WTGS and a mPSS are located in LVS #2. The types of new energy sources are different in the two LVSs. Then, PVGS and WTGS are concentrated in the daytime and the nighttime, respectively. In LVS #1, to prevent LVSs from transferring energy back to the medium-voltage distribution network, the mPSS stores the surplus energy of PVGS by pumping in the daytime. Then, the mPSS supplies power to the loads at night. But in LVS #2, this process is reversed. The mPSS supports the loads by releasing energy in the daytime and stores the surplus energy from WTGS at night. Based on the energy characteristics of the above two LVSs and the reversed operation process of the mPSS, this paper investigates the energy mutualization mode between the LVSs. Then, a novel control strategy of mPSS is proposed based on the common reservoir model, to achieve the purpose of reducing the system energy and the capacity of the mPSS.
2.2 Two Operation Modes of Micro-Pumped Storage System between Low-Voltage Stations
In the mPSS, there is an upper reservoir (UR), a lower reservoir (LR), a generator system, a pump system, and other equipment. In Fig. 2a, each of the two LVSs is equipped with an independent mPSS. There is no coupling between the reservoirs of the two mPSSs. In this paper, this conventional operation mode of the mPSS is defined as the separated reservoir mode (SRM). The two mPSSs act on their LVSs, respectively. Then, the energy interaction between the LVSs needs to be done through the station transformers and the medium-voltage distribution network. This model will result in energy losses and occupy the capacity of the line’s transmission and transformers.
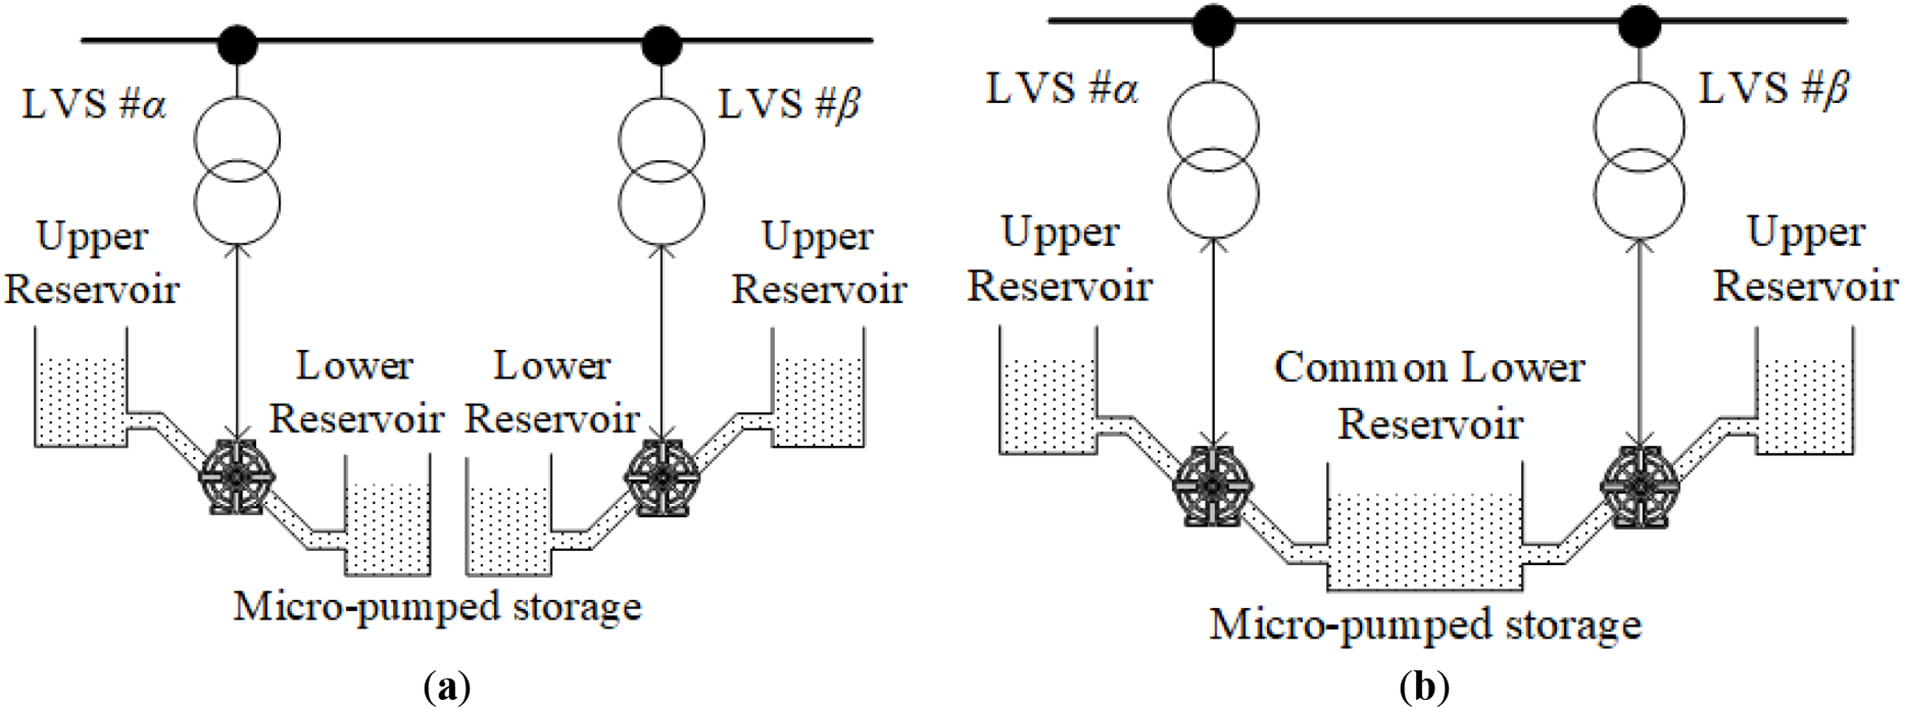
Figure 2: Two operation modes of mPSS in different LVSs. (a) SRM; (b) CLRM
To address the above problem, a novel operation mode of mPSSs in multiple LVSs is proposed based on a common reservoir mode (CRM). In CRM, the reservoirs of two mPSSs in the different LVSs are merged and the energy exchange between the LVSs is realized by passing through the waterway. The common LR mode (CLRM) is shown in Fig. 2b. Then, CLRM is applied in the following contents of the paper.
In Fig. 2b, compared with the SRM, the mPSSs in the two LVSs include a total of three reservoirs in the CLRM. It means that two separated URs and a common LR. Based on the CLRM, the energy interaction between LVS #α and LVS #β can be achieved in two ways. One is the electrical energy path based on the power line, and the other is the water-energy path based on the water pipeline. It means that the power of new energy source generation and load between two LVSs can be transferred by water. It can alleviate the blockage of the medium-voltage distribution network, the need to transform power lines and increase the capacity of transformers. And it can reduce energy loss.
3 Mathematical Model of Energy Mutual Assistance Control between Low-Voltage Stations Based on Micro-Pumped Storage System
During the operation of the system described in Section 2.1, a number of constraints need to be satisfied, such as power, current and voltage constraints between power nodes in the medium-voltage distribution network, the power range of new energy source and mPSS [33]. The specific constraints are summarized as follows:
(1) The power balance constraints of medium-voltage distribution network
Eq. (1) represents the power relationship of all nodes in the medium-voltage distribution network [21]. It constrains the operating power of each node at any time. Where PG,i(t), PPV,i(t), PPW,i(t), PPump,i(t), PGenerate,i(t), PL,i(t) and
Then, the power of the i-th LVS interacting with the medium-voltage distribution network is the sum of powers between the i-th node and other nodes [11], shown in Eq. (2). Where Pi,j(t), Qi,j(t), and Ii,j(t) represent the active power, reactive power, and the square of current from the j-th node to the i-th node, respectively. Ri,j and Xi,j denote the resistance and reactance between the i-th and j-th nodes, respectively.
(2) The capacity constraints of the transformer in the LVS
The active and reactive power of each node is governed by the transformer capacity as shown in Eq. (3). Where
(3) The power, voltage, and current constraints of medium-voltage distribution network
In addition to the above power balance constraints, node voltages and branch currents of the medium-voltage distribution network need to satisfy some constraints [16,33]. Eq. (4) demonstrates the relationship between the voltage of the node and branch currents. Eqs. (5) and (6) represent the operating power, voltage, and branch current ranges of each node. Where Ui(t) denotes the squared value of the voltage at the i-th node;
(4) The active power constraints of new energy source
A new energy source generation system and mPSS are constructed within the LVS on each node. Due to time-varying environmental factors such as irradiation and wind speed, the actual output power of PVGS and WTGS is less than or equal to their maximum output powers at time t [2,8], as shown in Eq. (7). Where PPV,i(t) and
(5) The operation power and capacity constraints of mPSS
The pumping and generating power should be limited as Eq. (8). The mPSS cannot operate in both pumping and generating states at the same time [13,34]. Furthermore, the pumping and generating power are less than or equal to the maximum value, respectively. Where PPump,i(t) and
In addition, the energy of a mPSS is terminated [13,34]. Then, in this paper, the state of energy (SOE) of a mPSS is constrained, as shown in Eqs. (9) and (10). Where
3.2 The Different Operating Constraints of Micro-Pumped Storage System
Section 3.1 shows the generic constraints for SRM and CLRM. Then, this section lists the specific constraints of each operation mode. As described in Section 2.2, the difference between SRM and CLRM is the energy state of the mPSS. The specific constraints are as follows:
(1) The operation constraints of SRM
In the SRM, the mPSSs are separated from each other. Therefore, the energy state of the UR and LR in each mPSS depends only on its pumping and generating power [9,34], as shown in Eq. (11). ηPump,i and ηGenerate,i are the pumping and generating efficiency of the mPSS, respectively. Then, λPump,i, and λGenerate,i represent the ratio of the operating power to the water flow, respectively.
(2) The operation constraints of CLRM
In the CLRM, the LR is shared among mPSSs. Therefore, the energy state of UR in a mPSS is still determined by the operating power of this mPSS. However, the energy state of common LR will be determined by the operating power of the mPSSs in all LVSs connected to this reservoir. Eq. (12) describes the process of energy change in the UR and LR using this model.
In Eq. (12), the energy of the common LR will be affected by the operating power of mPSSs within multiple LVSs. Therefore, the interaction energy of multiple LVSs is achieved through the common LR. Referring to the expression for common LR using CLRM, the general expression for common UR and LR in multiple LVSs is shown in Eq. (13). Where m1 denotes the number of systems accessing the UR of the mPSS within the i-th LVS (common UR), and m2 denotes the number of systems accessing the LR of the mPSS within the i-th LVS (common LR). This paper does not discuss this complex common reservoir model in detail and focuses on analyzing the differences and linkages between the SRM and CLRM.
The energy transfer process between different LVSs is different using two operation modes. In the SRM, the energy transfer between multiple LVSs must rely on power lines and is constrained by the transformer and transmission line capacity. In contrast, in the CLRM, the energy transfer between multiple LVSs can be accomplished by common LR between LVSs. Therefore, this paper compares the operating effects of SRM and CLRM with the energy loss as a single optimization objective function. It is shown in Eq. (14). In this paper, the energy discarded by the new energy source generation is used as the energy loss of the LVS. The reason is that new energy source generation abandoned is limited by the transformer and transmission line capacity and should be considered as a kind of energy loss.
where LLOSS, NLOSS, and PLOSS denote the energy loss of transmission lines, the amount of new energy source generation abandoned, and the operation energy loss of mPSS, respectively. Based on the above mathematical model, the energy mutualization control between LVSs is a mixed integer programming problem with a single optimization objective function. It can be solved directly using the CPLEX optimization toolbox developed by IBM.
4.1 System Structure and Parameters
The structure of the IEEE 33-node medium-voltage distribution network is illustrated in Fig. 3. node #1 is connected to the medium-voltage distribution grid, and LVSs containing WTGS, PVGS, and mPSS are deployed at nodes #17 and #18, respectively. In Fig. 3, the mPSSs of two LVSs operate in CLRM operation mode. Table 2 lists the relevant simulation parameters for the calculations. Fig. 4 shows the power profiles of the PVGS, the WTGS, and the loads for a day with a time interval of 1 h.
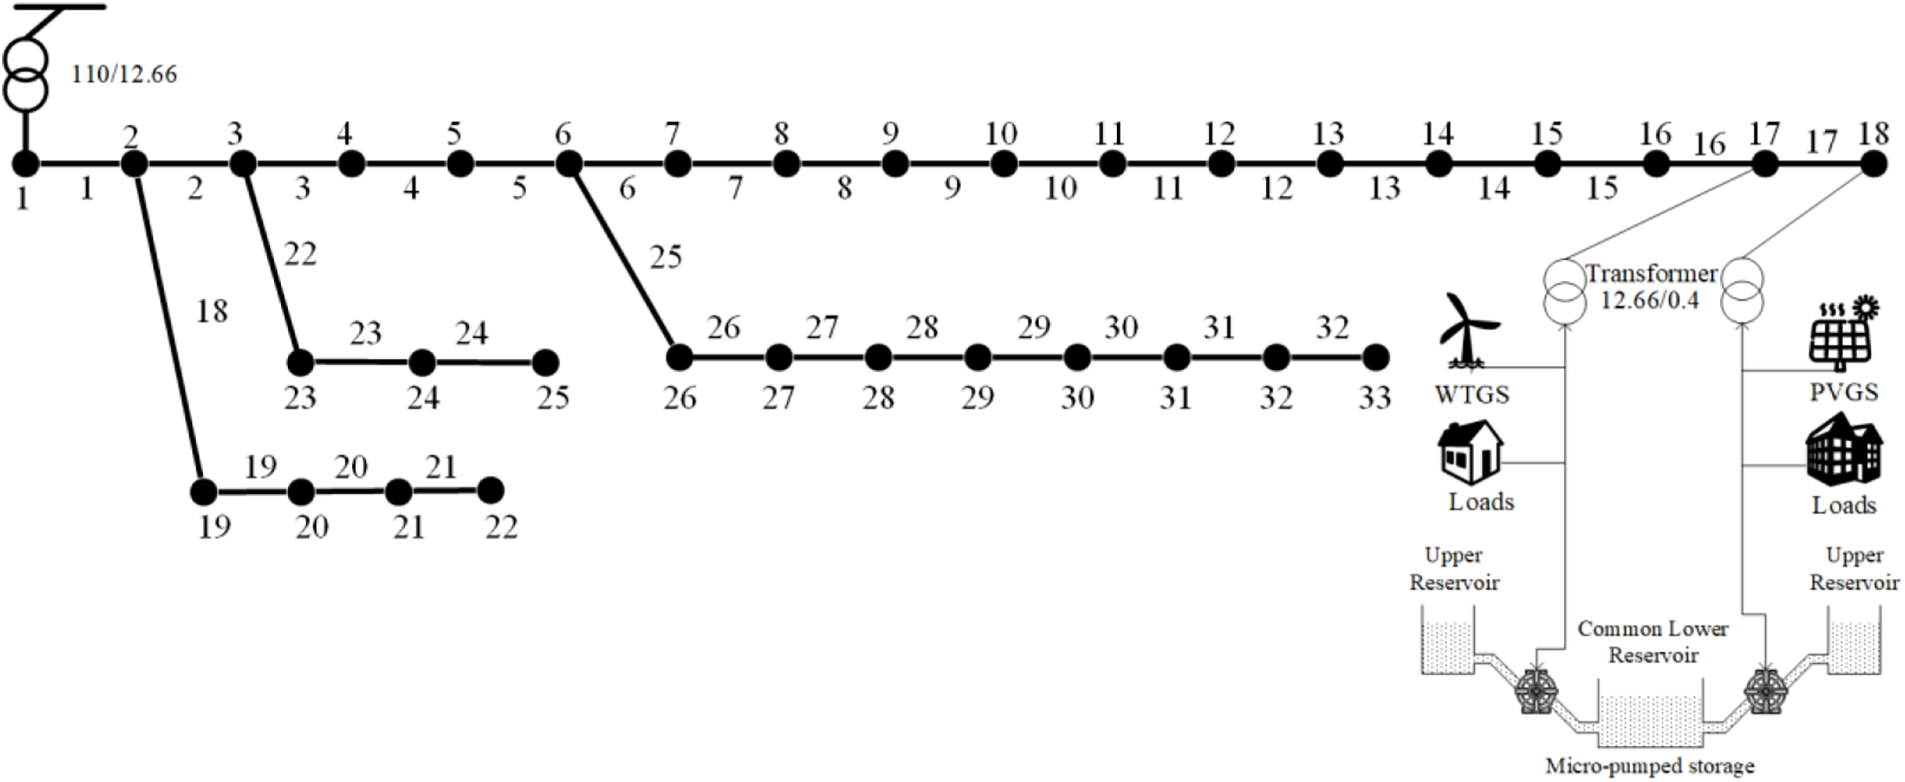
Figure 3: The structure of the IEEE 33-node medium-voltage distribution network using CLRM
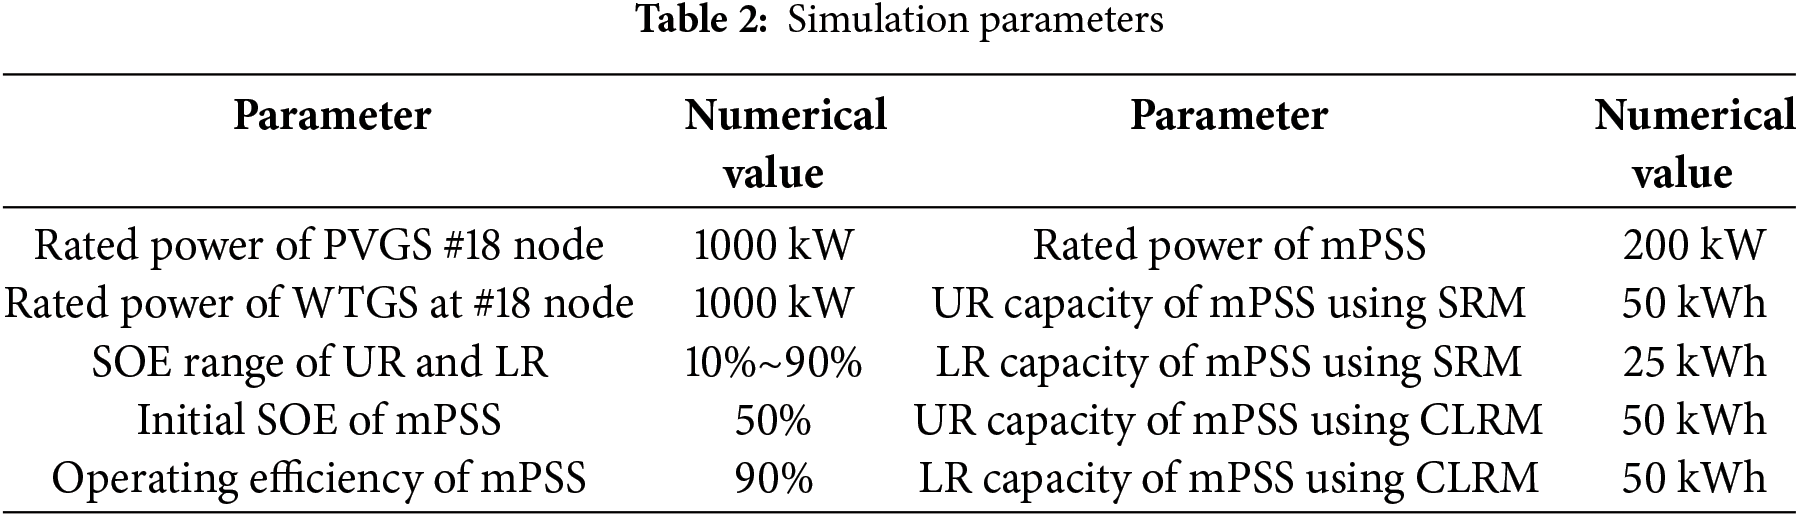
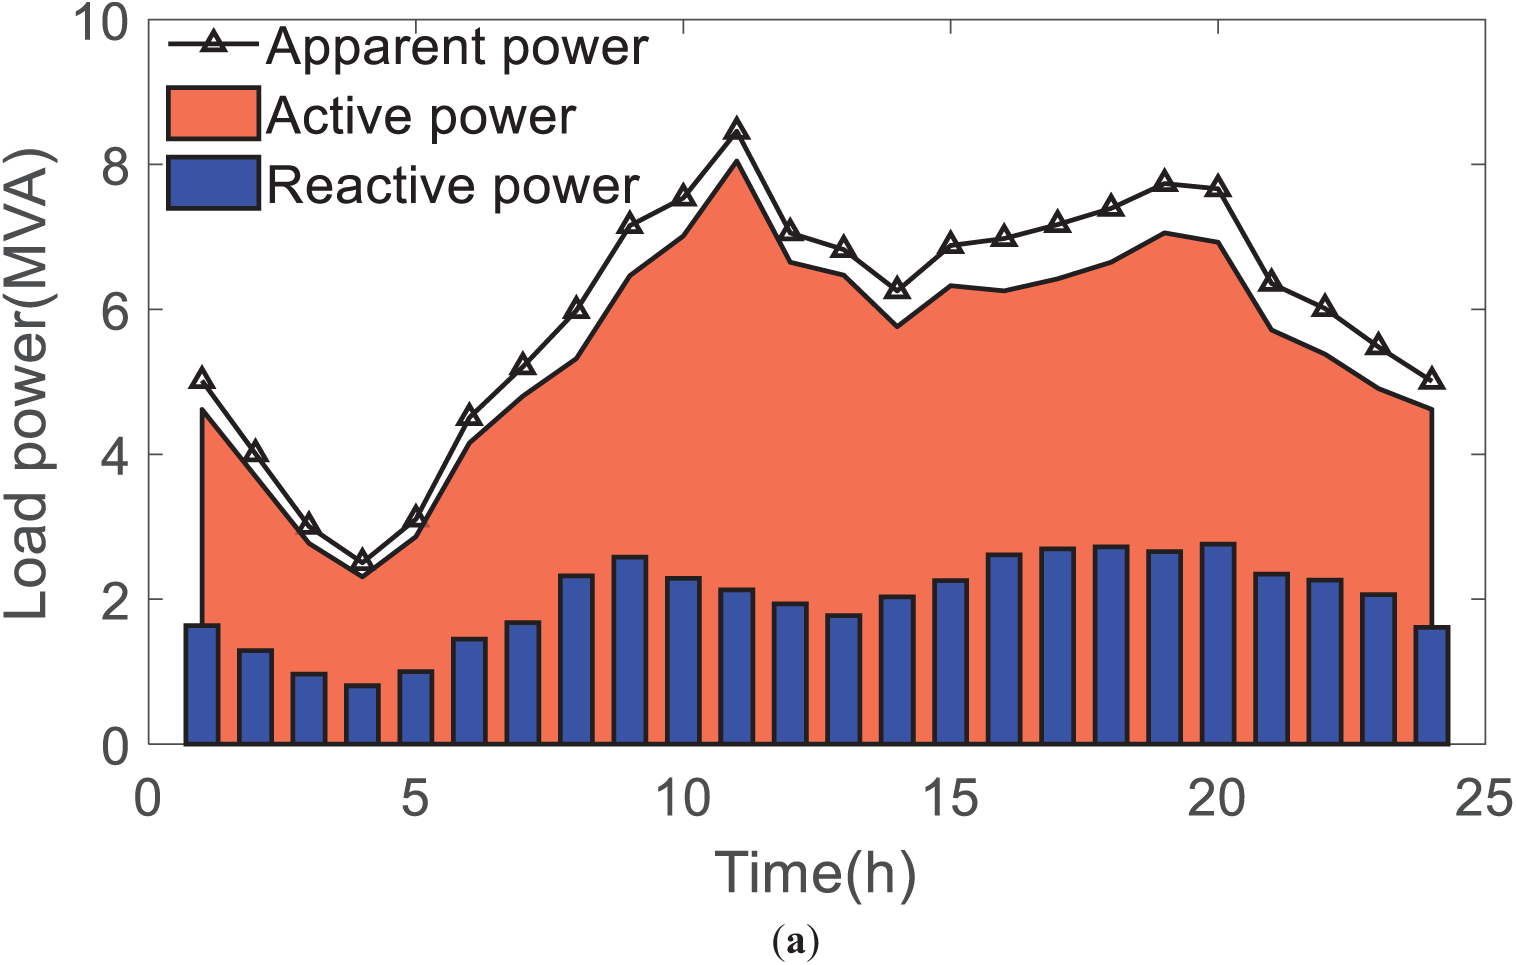
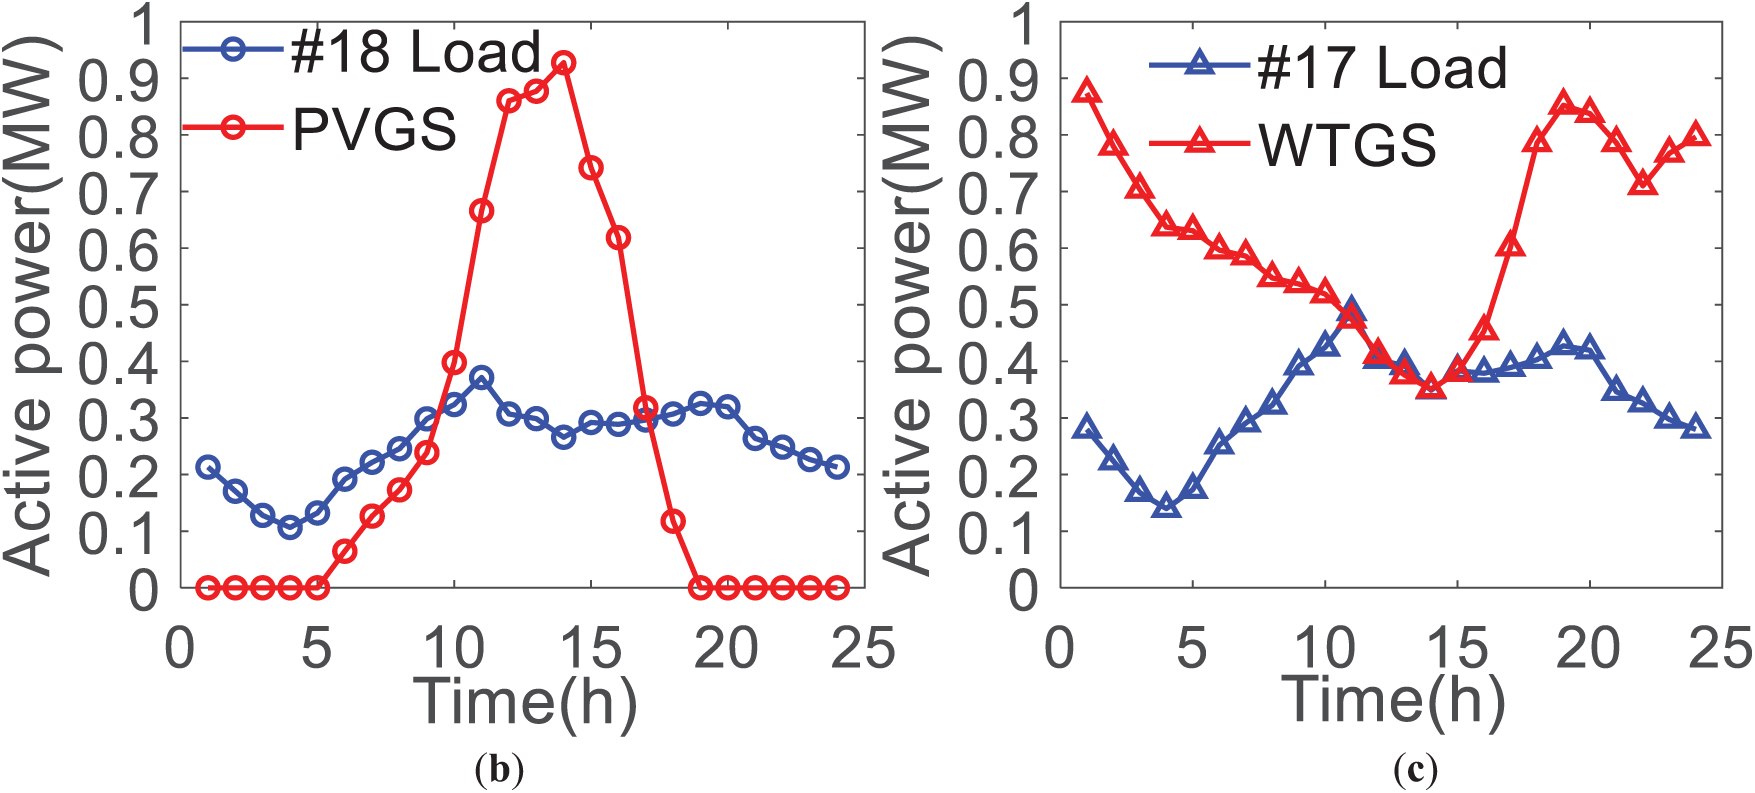
Figure 4: Power curve in the numerical case. (a) Load power curve; (b) Active power of PVGS and load at #18 node; (c) Active power of WTGS and load at #17 node
To highlight the abandonment of new energy source generation and the role of mPSS in its consumption, this paper sets up a 1 MW PVGS and WTGS in nodes #17 and #18, respectively. It will form the phenomenon that the power of new energy source generation is surplus in the LVS and flows to the medium-voltage distribution network. In addition, to compare SRM and CLRM equally, the UR capacities of the two mPSSs are set to be equal. And the total capacity of the LR is equal. Under the SRM, the LRs of two mPSSs have an equal capacity of 25 kWh.
In Fig. 4a, the total load of the medium-voltage distribution network shows two peak power consumption at 11 and 19 h, and low power consumption at 4 h in the morning, the peak-valley deviation of electricity consumption is about 6 MW, and the load apparent power of the medium-voltage distribution network is about 8.5 MVA. Fig. 4b,c respectively shows the load power and new energy sources power in LVS #17 and LVS #18. As can be seen from the figure, there is a phenomenon that the power of new energy source generation is greater than the load power in both LVSs.
If there is no energy storage system in the LVS, to improve the utilization rate of new energy sources, the LVS must inject power into the medium-voltage distribution network. It will affect the operation of the medium-voltage distribution network. In addition, there is a certain complementarity in time between PVGS and WTGS in the LVSs. For instance, in the 0~9 h and 18~24 h, the wind turbine power in the LVS #17 is greater than the load power. It will result in LVS #17 injecting power into the medium-voltage distribution network to increase the utilization of wind turbine power. In the same period of time, the output power of the PVGS in LVS #18 is less than the load power. Then, the medium-voltage distribution network will inject power into LVS #18 to support the load power demand. Based on the above operation process, the energy needs to be transferred between the two LVSs through the medium-voltage distribution network. It is limited by the capacity of the transformer and transmission line. Therefore, it is the original intention of this study to establish a novel mode and a new channel of energy mutual benefit in multiple LVSs.
Based on the above simulation parameters, this section compares the energy losses of the medium-voltage distribution network with LVSs using none pumped storage mode (NPM), SRM, and CLRM. The Total energy losses (TLoss) include the line losses (LLoss) of the medium-voltage distribution network, the energy loss (NLoss) of new energy sources, and the energy loss (PLoss) of mPSS. Using the above three modes, the numerical results of the different energy losses are listed in Table 3. Then, based on the SRM, the comparison results are shown in Fig. 5. Fig. 6 represents the percentages of the different energy losses using the three modes.
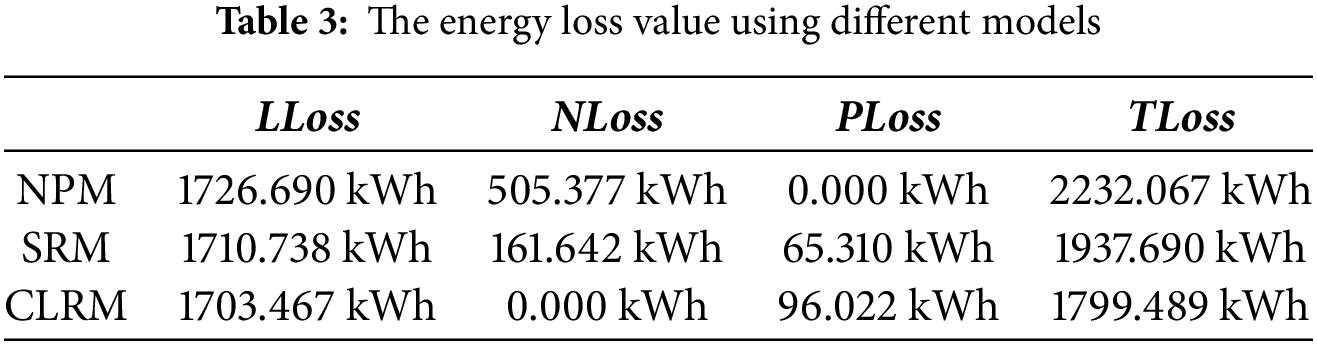
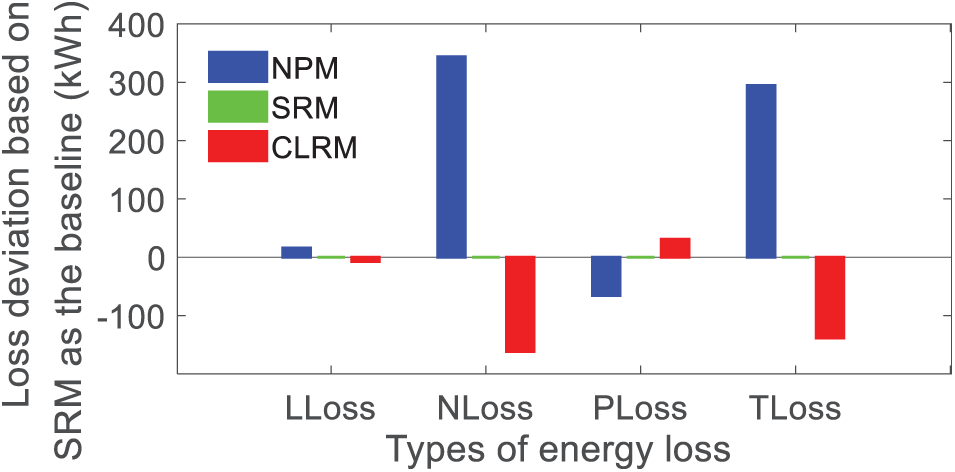
Figure 5: Loss deviations of different models based on SRM as the baseline
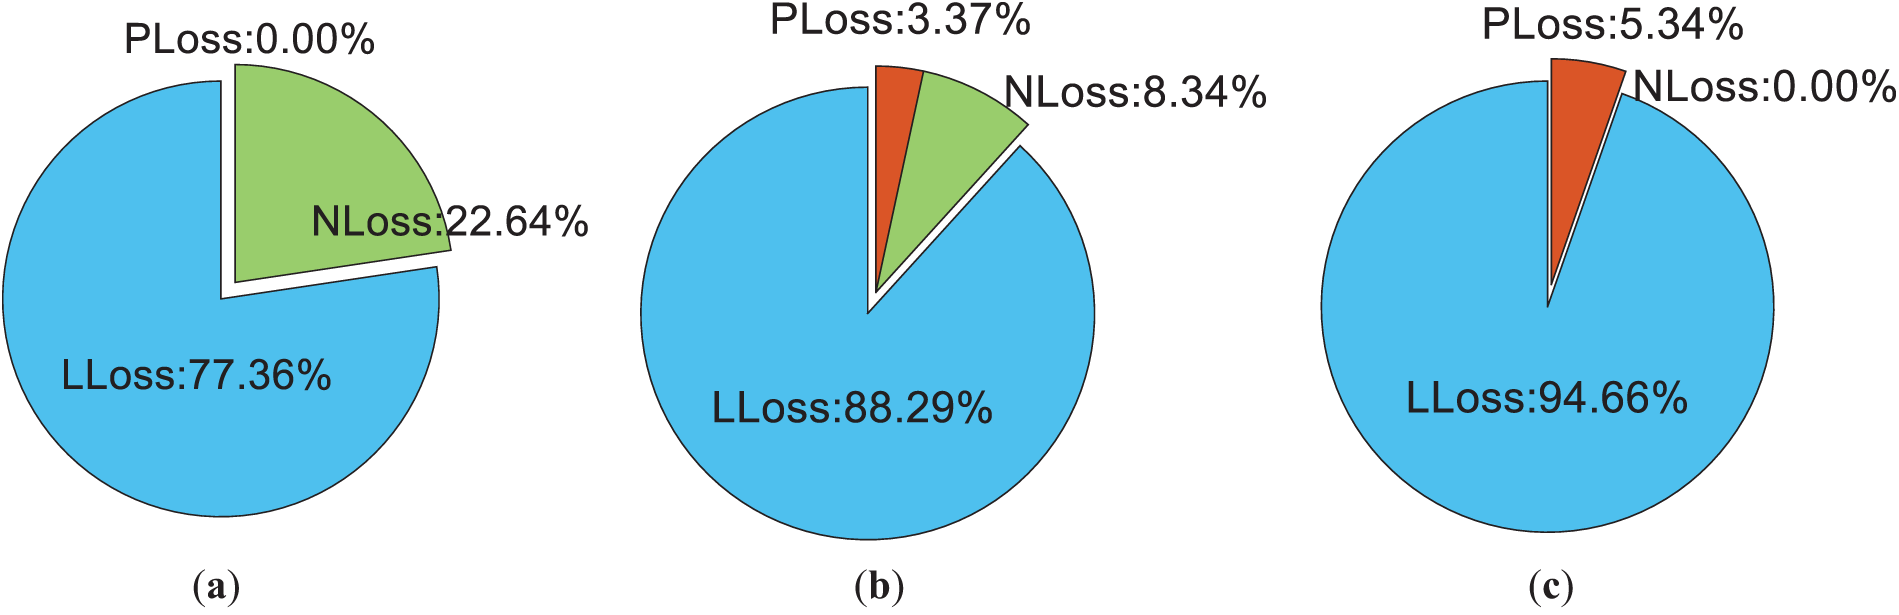
Figure 6: Proportion of the different energy losses using different modes. (a) NPM; (b) SRM; (c) CLRM
In Table 3 and Fig. 5, the conclusions are as follows:
(1) The TLoss of NPM is 2232.067 kWh. Compared to SRM and CLRM, the TLoss has increased by 294.377 and 432.578 kWh, respectively. Specifically, in terms of LLoss, node #1 needs to inject more energy to satisfy the load power demand. These energies are transmitted in the distribution lines and increase the line losses. Compared to SRM, the LLoss of NPM increases by 0.933%. In addition, under the limited transformer capacity, the injection of surplus power from the new energy source generation system into the distribution network is restricted in LVS #17 and LVS #18. It causes a large amount of new energy sources abandoned and the NLoss reaches 505.377 kWh. It is 1.685% of the total new energy source generation. The NLoss of the NPM is 3.13 times that of the SRM. Therefore, the configuration of mPSS in the LVS can improve the utilization rate of the new energy source generation system, and relieve the pressure of transformer capacity in the LVS.
(2) Compared with SRM, the TLoss of CLRM decreases by 138.201 kWh, accounting for 7.68%. And, the LLoss of CLRM decreases by 7.271 kWh. It means that CLRM can reduce the pressure of current transmission on the distribution network and ease the urgency of distribution network expansion and reconstruction.
(3) Compared to the NLoss and PLoss of SRM, the NLoss and PLoss of CLRM decreased by 161.642 kWh and increased by 30.712 kWh, respectively. It means that the mPSS recovers about 160 kWh of new energy source generation and increases the energy loss by about 30 kWh. It is 0.539% of the new energy source generation. If energy utilization is only considered, it is clearly valuable.
From the above results, CLRM is superior to SRM and NPM is the worst.
In Fig. 6, the NLoss of NPM accounts for 22.64% of the TLoss. It indicates that the amount of new energy source generation abandoned should be paid attention to. Then, the NLoss and PLoss of SRM account for 8.34% and 3.37%, respectively. They are 11.71% of the TLoss. It means that the mPSS has significantly increased the consumption of new energy source generation. However, limited by the capacity of mPSS, the NLoss is still larger than the PLoss. It is necessary to increase the capacity of mPSS to further consume new energy source generation. Further, in the CLRM, without increasing the capacity of the mPSS, the percentage of PLoss is 5.34% of the TLoss, and the new energy source generation is consumed in its entirety. It indicates that the CLRM has a greater capacity than SRM to consume new energy source generation under the same capacity as the mPSS.
To further analyze the operation process of the mPSS using SRM and CLRM, Fig. 7 exhibits the operation power and LR energy change of two mPSSs in LVS #17 and #18. Then, the results of the line current deviation between SRM and CLRM are shown in Fig. 8.
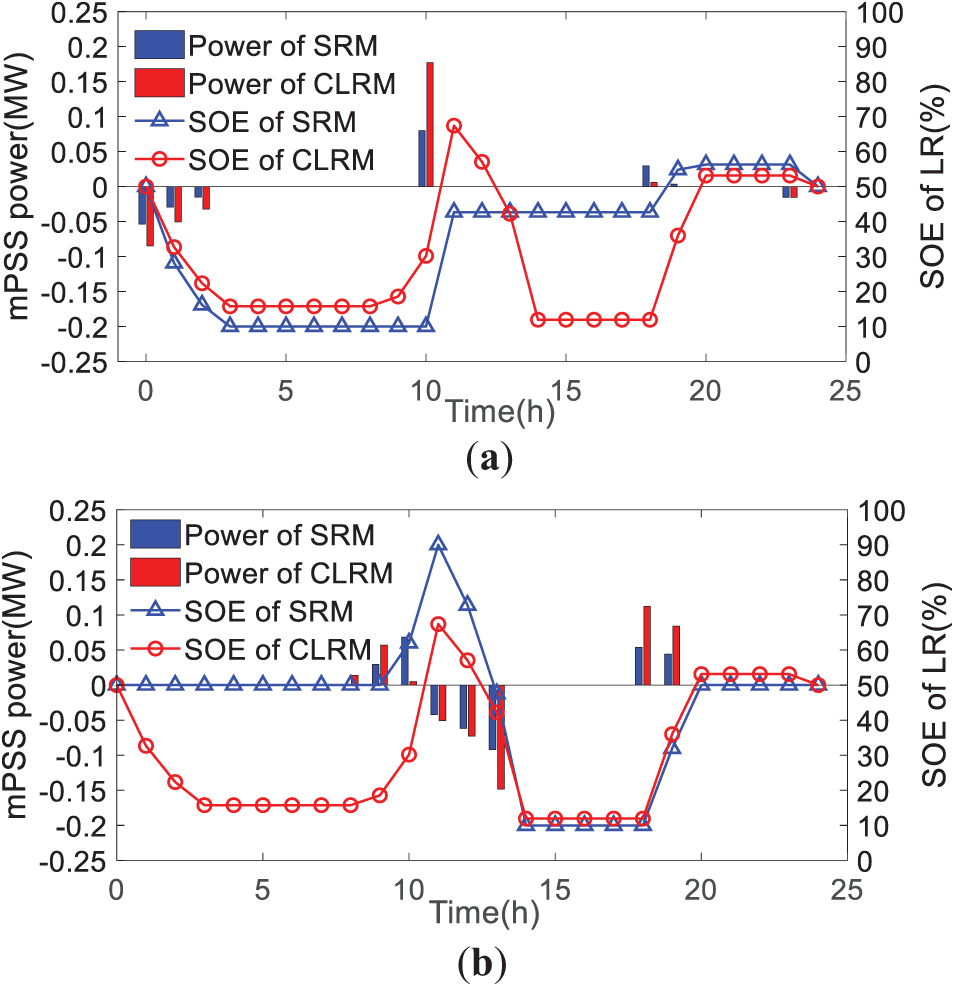
Figure 7: The comparison results of the mPSS in the two LVSs using different modes. (a) The mPSS output power and the LR capacity changes in the LVS #17; (b) The mPSS output power and the LR capacity changes in the LVS #18
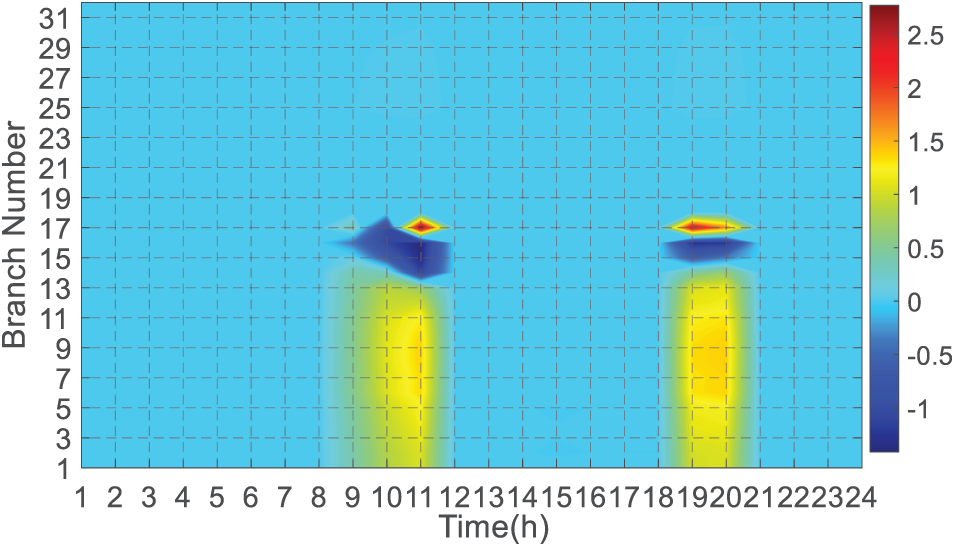
Figure 8: Distribution of branch currents in the distribution network using different modes
In Fig. 7, based on SRM, the mPSS in LVS #17 works in the pumping state to dissipate the surplus power of WTGS from 0 to 3 h. After 3 h, the LR reaches the lower value, and the mPSS is unable to further dissipate the wind turbine power. During the same time period, the CLRM model incorporates the LR of the mPSS in two LVSs, and the LRs are shared. It results in that the total capacity of LR increases. This implies that the mPSS can consume more wind turbine generation power. Similarly, during the 0~9 h time period, the load power consumption of LVS #18 is greater than the mPSS. Then, the distribution network injects power into LVS #18 to satisfy the load demand. Based on SRM, the energy state of LR maintains at 50%. With the output power of PVGS increasing, the power generated by the mPSS in the LVS causes the LR to be elevated. It will ensure that the mPSS has more capacity for dissipating the surplus power of PVGS during the 11~13 h time period. Compared to SRM, the common LR of the mPSS is affected by the WTGS in the LVS #18 during the 3~8 h period and the energy state is maintained at 10%. To consume the peak power of PVGS in 12~14 h, the mPSS in LVS #17 will generate power and boost the energy state of the LR to 70%. At this time, in terms of the storage energy of LR, the CLRM is larger than the SRM. It leads that there is a larger capacity of the CLRM to consume the power of PVGS in the 12~14 h period.
In Fig. 8, on branch #17, the current of SRM exceeds CLRM and reaches 2.5 A during the 9~11 h and 19~20 h. It means that the energy interactions between LVS #17 and LVS #18 will be more dependent on the transmission lines. The limited capacity of the transmission line will block the energy interactions between the two LVSs. This is an advantage of CLRM to relieve the power pressure of the transmission line. In addition, the current SRM is lower than that of CLRM in branches #15 and #16. Using CLRM, the surplus power of the WTGS in LVS #17 and the PVGS in LVS #18 is secured for the loads by the energy interacting with the common LR. It results in a lower current in branch # 17. Then, more currents are supplied to loads in nodes #15 and #16 via branches #15 and #16.
Based on the above results, this section discusses the impact of factors such as efficiency, capacity, and deployment location of the mPSS on energy loss. In particular, Fig. 9 demonstrates the variation of TLoss, PLoss, LLoss, and NLoss using different efficiencies of mPSS. Fig. 10 displays the variation of TLoss, PLoss, LLoss, and NLoss in the different reservoir capacities of mPSS.
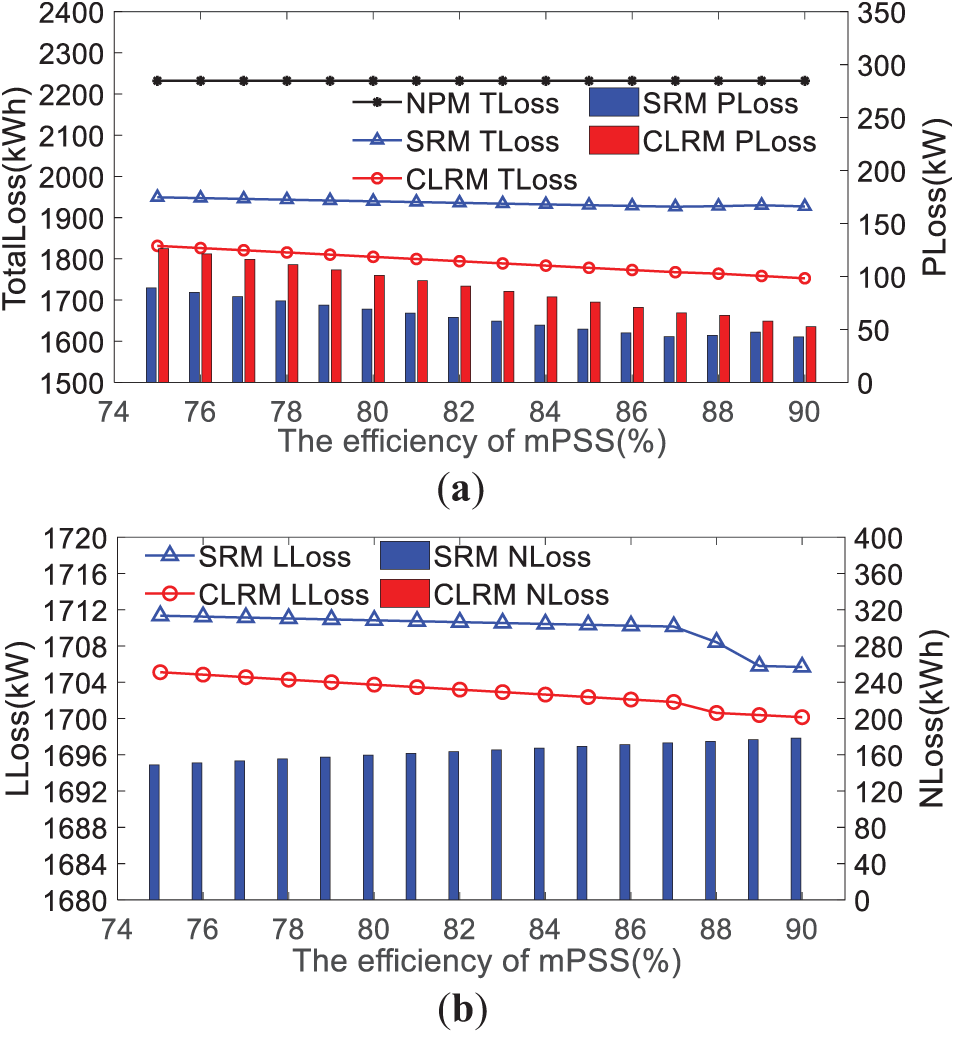
Figure 9: Variation curves of energy loss using the different efficiencies of mPSS. (a) TLoss and PLoss; (b) LLoss and NLoss
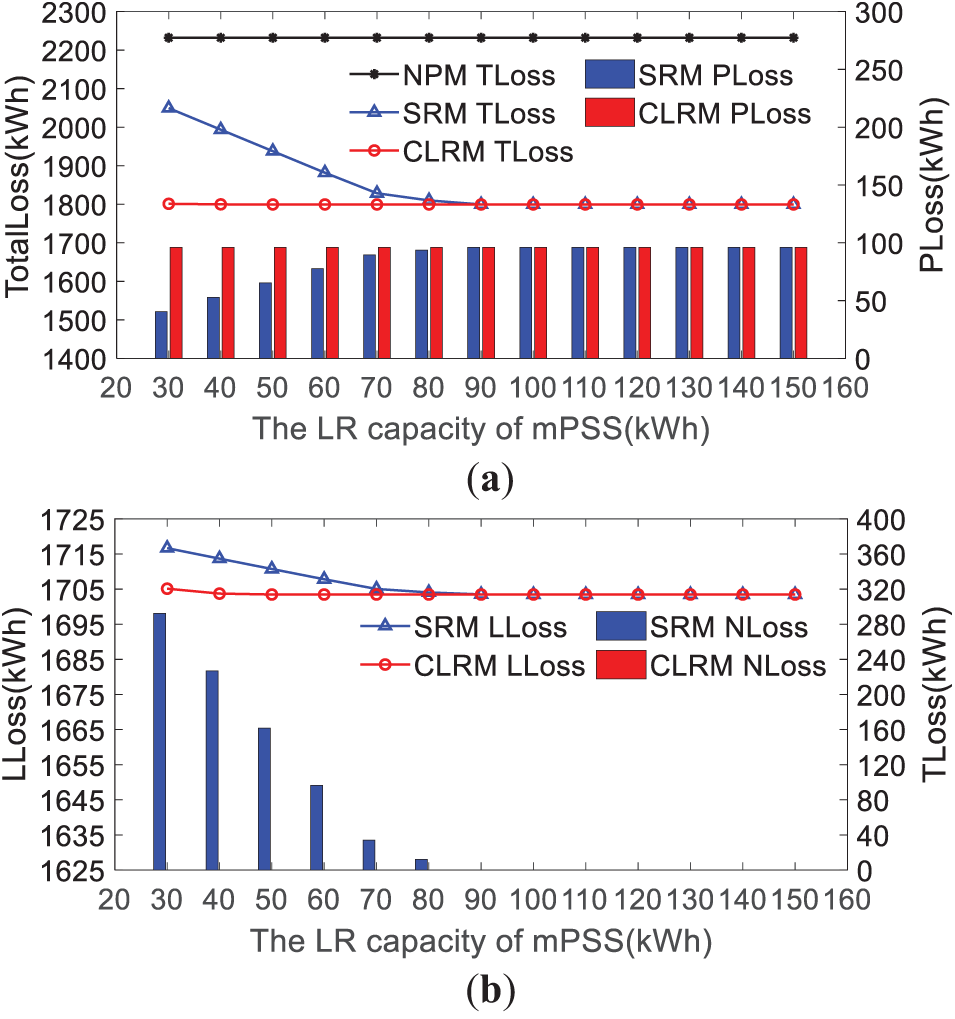
Figure 10: Variation curves of energy loss using the different lower reservoir capacities of the mPSS. (a) TLoss and PLoss; (b) LLoss and NLoss
In Fig. 9, with the efficiency of the mPSS increasing from 75% to 90%, the TLoss of CLRM and SRM decreases by 78.75 and 22.20 kWh, respectively. And the CLRM is more than 3.5 times that of SRM. It indicates that the efficiency of the mPSS has a greater impact on CLRM. The energy loss of each part is compared as follows:
(1) In terms of the PLoss, CLRM and SRM decreased by 73.78 and 46.11 kWh, respectively. And CLRM is more than 1.6 times that of SRM. In the process of decreasing the TLoss, the PLoss has the largest share. This is the most direct reason why the efficiency of mPSS affects the TLoss of the distribution network.
(2) In terms of LLoss, CLRM and SRM decreased by 4.96 and 5.67 kWh, respectively. And the LLoss reduction of the two operation models is small and basically the same. It implies that the efficiency of the mPSS has a low impact on the power injected into the distribution network from the LVS. On the other hand, under CLRM, the NLoss is always 0. The new energy source generation is completely consumed by the mPSS. However, under SRM, the amount of new energy source generation abandonment increases by 29.58 kWh. It means that the 46.11 kWh of energy loss in mPSS was recovered, and 29.58 kWh of new energy source was abandoned.
Obviously, it is bad. The root cause of this phenomenon is the capacity restriction of the LR under SRM. If the efficiency of mPSS is improved under the limited capacity of LR, the electricity consumption will reduce and the power generation will increase. It will further consume new energy sources. Therefore, with the efficiency of mPSS increasing, the advantages of CLRM will become more significant.
In Fig. 10, with the LR capacity of the mPSS changing from 30 to 150 kWh, the difference between the SRM and CRLM is shown in two stages.
(1) When the change of the LR capacity is from 30 to 80 kWh, TLoss, PLoss, and NLoss remain unchanged using CRLM. And the SRM continues to decrease. It means that the mPSS with CRLM can achieve better performance with less construction capacity. For instance, a common LR capacity of 50 kWh under CRLM is identical in performance to the LR capacity of 90 kWh under SRM. Therefore, the reservoir capacity of the mPSS can be reduced by using CRLM. It can help to reduce the construction cost of the mPSS.
(2) When the capacity of the LR changes from 80 to 160 kWh, TLoss, PLoss, and NLoss are the same using CRLM and SRM. It means that CLRM does not show an advantage after a certain increase in LR capacity. The reason is that the mPSS can consume new energy source generation in each LVS. There is no need to exchange excess energy through a CRM.
Therefore, in this paper, the proposed CLRM can reduce the reservoir capacity of mPSS and is more applicable to scenarios where the capacity allocation of mPSS is limited.
Fig. 11 exhibits the variation of TotalLoss, PLoss, LLoss, and NLoss under the distribution network with the LVS. And the mPSSs are located on different nodes of the distribution network. The procedure is that the LVS that has WTGS remains at node #17, the LVS that has PVGS is placed at the different nodes, and the mPSSs are in each LVS.
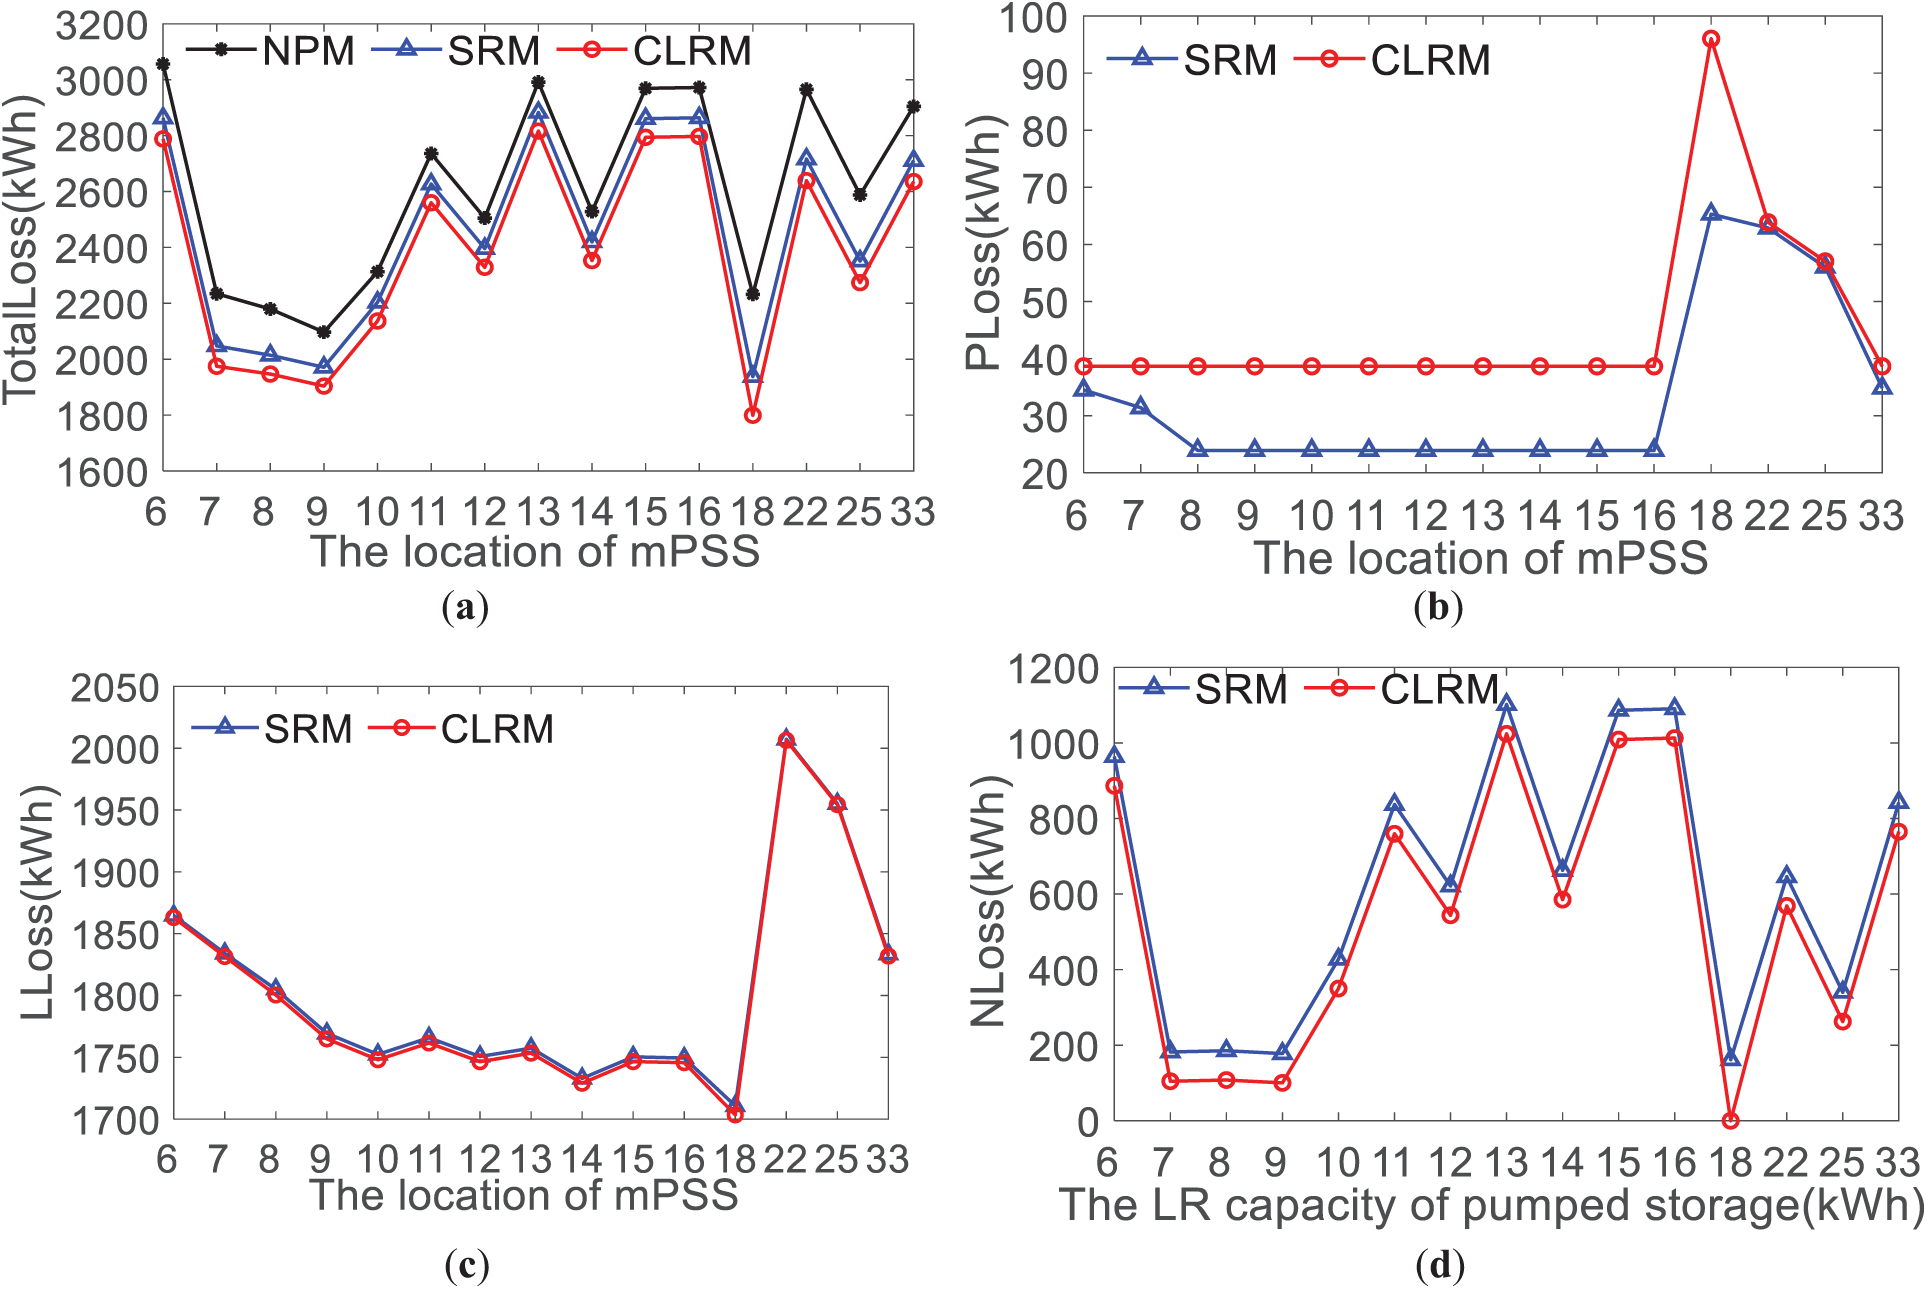
Figure 11: Variation curves of energy loss at different positions of mPSS. (a) TLoss; (b) PLoss; (c) LLoss; (d) NLoss
In Fig. 11, when the mPSS is located on different nodes, there is a significant difference in the TLoss which can be up to 1200 kWh. However, the optimization relationship between CLRM, SRM, and NPM is constant. The CLRM is better than the SRM, and the NPM is the worst. With the distance between the two LVSs including the mPSS and the new energy source system increasing, the LLoss of the distribution network is rising. In the NLoss, if the LVSs including the mPSS and the new energy source system are configured in different distribution network locations, the same mPSS has different consumption degrees of new energy source generation. It implies that the impact of the location of LVS with new energy generation systems on the capacity of the mPSS should not be ignored. In summary, based on CLRM, the capacity configuration and economy of the mPSS will be focused on in future research.
To enhance the level of energy interaction between multiple LVSs in the distribution network, this paper proposes a common reservoir operation mode of mPSS. It is applied to energy mutualization in multiple LVSs. By interconnecting some reservoirs of the mPSSs in two LVSs, the consumption of new energy source generation is promoted in the LVSs, and the advantages of energy complementarity between LVSs are reflected. The main conclusions are as follows:
(1) The proposed operation model and control strategy of mPSSs between the LVSs can effectively balance the power contradiction between new energy source and load, improve the absorption capacity of new energy source in the LVS, reduce the lines loss of distribution network, and avoid the adverse effects caused by energy backflow to the power grid.
(2) Compared with SRM, the total energy loss of CLRM decreases by 138.201 kWh and accounts for 7.68% of the total energy loss. As the energy loss of mPSS increases by 30.712 kWh, the 161.642 kWh of surplus energy from new energy source generation is absorbed, and the 7.271 kWh of line loss is reduced. Obviously, the proposed CLRM is superior to traditional SRM.
(3) With the efficiency of mPSS increasing from 75% to 90%, in the reduction of total energy loss, CLRM is 3.5 times that of SRM. The higher efficiency of the mPSS can make CLRM more obvious.
(4) Under the same degree of energy loss, the proposed CLRM can significantly reduce the reservoir capacity of mPSS, and the common lower reservoir capacity is 55.56% of the total lower reservoir capacity using SRM. The proposed CLRM is more suitable for the scenario where the capacity of the mPSS is limited.
To enhance the reliability of the CLRM model, it needs to be further verified in some actual applications. Then, the capacity configuration and economy of mPSS will be the key issue for the further application of the proposed CLRM. In addition, it is needed on the hybrid common reservoir modes for more than two mPSSs in further research.
Acknowledgement: This paper was completed with the hard help of every author.
Funding Statement: This study was sponsored by the State Grid Corporation of China Technology Project (Research on Key Technologies and Equipment Development of Micro Pumped Storage for Distributed New Energy Consumption in Distribution Networks, 5400-202324196A-1-1-ZN).
Author Contributions: The authors confirm contribution to the paper as follows: study conception and design: Yunzhao Wu, Guanglin Sha; analysis and interpretation of results: Qing Duan, Yunzhao Wu, Yingjie Zhou; drawing and supervision: Lu Liu, Xinwei Cong; draft manuscript preparation: Guanglin Sha, Ning Zhou, Yingjie Zhou. All authors reviewed the results and approved the final version of the manuscript.
Availability of Data and Materials: The authors confirm that the data supporting the findings of this study are available within the article.
Ethics Approval: Not applicable.
Conflicts of Interest: The authors declare no conflicts of interest to report regarding the present study.
References
1. Xu Y, Liu H, Xiong X, Ji Y, Shao Y, Zhang H, et al. Key technologies and development modes of flexible interconnection of low-voltage distribution station area. In: Proceedings of the 7th World Congress on Civil, Structural, and Environmental Engineering (CSEE’22); 2022 Apr 10–12; Lisbon, Portugal. p. 3986–4001. [Google Scholar]
2. Liu WJ, Li SH, Ma R, He SY. Multi-objective DDPG optimal dispatch for low-voltage distribution station area flexible interconnection system. Smart Power. 2024;52(6):62–70. [Google Scholar]
3. Wang Z, Li Y, Wu F, Wu J, Shi L, Lin K. Multi-objective day-ahead scheduling of cascade hydropower-photovoltaic complementary system with pumping installation. Energy. 2024;290(4):130258. doi:10.1016/j.energy.2024.130258. [Google Scholar] [CrossRef]
4. Wang X, Chen L, Chen Q, Mei Y, Wang H. Model and analysis of integrating wind and PV power in remote and core areas with small hydropower and pumped hydropower storage. Energies. 2018;11(12):3459. doi:10.3390/en11123459. [Google Scholar] [CrossRef]
5. Kitsikoudis V, Archambeau P, Dewals B, Pujades E, Orban P, Dassargues A, et al. Underground pumped-storage hydropower (UPSH) at the Martelange Mine (Belgiumunderground reservoir hydraulics. Energies. 2020;13(14):3512. doi:10.3390/en13143512. [Google Scholar] [CrossRef]
6. Guezgouz M, Jurasz J, Bekkouche B. Techno-economic and environmental analysis of a Hybrid PV-WT-PSH/BB standalone system supplying various loads. Energies. 2019;12(3):514. doi:10.3390/en12030514. [Google Scholar] [CrossRef]
7. Maio M, Marrasso E, Roselli C, Sasso M, Fontana N, Marini G. An innovative approach for optimal selection of pumped hydro energy storage systems to foster sustainable energy integration. Renew Energy. 2024;227:120533. doi:10.1016/j.renene.2024.120533. [Google Scholar] [CrossRef]
8. Li B, Zhao J, Zhang Y, Bai X. Optimal configuration and economic operation of wind-solar-storage complementary system for agricultural irrigation in mountainous areas. J Electr Eng Technol. 2023;18(4):2649–66. doi:10.1007/s42835-022-01373-z. [Google Scholar] [CrossRef]
9. Li Y, Li O, Wu F, Shi L, Ma S, Zhou B. Coordinated multi-objective capacity optimization of wind-photovoltaic-pumped storage hybrid system. Energy Rep. 2022;8(S13):1303–10. doi:10.1016/j.egyr.2022.08.160. [Google Scholar] [CrossRef]
10. Hozouri MA, Abbaspour A, Fotuhi-Firuzabad M, Moeini-Aghtaie M. On the use of pumped storage for wind energy maximization in transmission-constrained power systems. IEEE Trans Power Syst A Publ Power Eng Soc. 2015;30(2):1017–25. doi:10.1109/TPWRS.2014.2364313. [Google Scholar] [CrossRef]
11. Majidi M, Rodriguez-Garcia L, Mosier TM, Parvania M. Coordinated operation of pumped-storage hydropower with power and water distribution systems. Int J Electr Power Energy Syst. 2022;142(6):108297. doi:10.1016/j.ijepes.2022.108297. [Google Scholar] [CrossRef]
12. Sun Z, Zhao Y, Ren J. Regional development potential of underground pumped storage power station using abandoned coal mines: a case study of the Yellow River Basin, China. J Energy Storage. 2024;77:109992. doi:10.1016/j.est.2023.109992. [Google Scholar] [CrossRef]
13. Chaima E, Lian J, Ma C, Zhang Y, Kavwenje S. Complementary optimization of hydropower with pumped hydro storage-photovoltaic plant for all-day peak electricity demand in Malawi. Energies. 2021;14(16):4948. doi:10.3390/en14164948. [Google Scholar] [CrossRef]
14. Zhang S, Yang W, Li X, Zhao Z, Wang R, Li Y. Economic evaluation of Wind–PV–Pumped storage hybrid system considering carbon emissions. Energy Rep. 2022;8(S5):1249–58. doi:10.1016/j.egyr.2022.03.001. [Google Scholar] [CrossRef]
15. Wang Z, Tan Q, Wen X, Su H, Fang G, Wang H. Capacity optimization of retrofitting cascade hydropower plants with pumping stations for renewable energy integration: a case study. Appl Energy. 2024;377:124429. doi:10.1016/j.apenergy.2024.124429. [Google Scholar] [CrossRef]
16. Zhang S, Qiu G, Liu Y, Ding L, Shui Y. Data-driven distributionally robust optimization-based coordinated dispatching for cascaded hydro-PV-PSH combined system. Electronics. 2024;13(3):667. doi:10.3390/electronics13030667. [Google Scholar] [CrossRef]
17. Wu Y, Li Y, Xu X, Huang J, Li C. Research on low carbon dispatching of hybrid power generation system with wind power and pumped storage station. IOP Conf Ser Earth Environ Sci. 2018;153:032047. doi:10.1088/1755-1315/153/3/032047. [Google Scholar] [CrossRef]
18. Zhang H, Wu S, Li H, Zhang J, Zhu C, Zhou H, et al. Multi-scheme optimal operation of pumped storage wind-solar–thermal generation system based on tolerable energy abandonment. Water. 2024;16(4):576. doi:10.3390/w16040576. [Google Scholar] [CrossRef]
19. GhoshThakur R, Ruchi RD, Ghosh A, GonChaudhuri S, Balachandran S. Green inertia and reliable power: fortifying edge-to-grid connectivity with micro variable speed solar pumped storage. Energy Convers Manag. 2024;307(1):118375. doi:10.1016/j.enconman.2024.118375. [Google Scholar] [CrossRef]
20. Wang Q, Xiao Y, Tan H, Mohamed MA. Day-Ahead scheduling of rural integrated energy systems based on distributionally robust optimization theory. Appl Therm Eng. 2024;246:123001. doi:10.1016/j.applthermaleng.2024.123001. [Google Scholar] [CrossRef]
21. Ma S, Wu Y, Jiang Y, Li Y, Sha G. Research on two-stage optimization control method for energy storage systems based on multi service attribute utility evaluation. Energy Sources Part A Recovery Util Environ Eff. 2024;46(1):3041–60. doi:10.1080/15567036.2024.2308647. [Google Scholar] [CrossRef]
22. Li J, Shi L, Fu H. Multi-objective short-term optimal dispatching of cascade hydro-wind–solar-thermal hybrid generation system with pumped storage hydropower. Energies. 2023;17(1):98. doi:10.3390/en17010098. [Google Scholar] [CrossRef]
23. Yahia Z, Pradhan A. Simultaneous and sequential stochastic optimization approaches for pumped storage plant scheduling with random breakdowns. Energy. 2020;204:117896. doi:10.1016/j.energy.2020.117896. [Google Scholar] [CrossRef]
24. Gu S, Rao C, Yang S, Liu Z, Rehman AU, Mohamed MA. Day-ahead market model based coordinated multiple energy management in energy hubs. Sol Energy. 2023;262(4):111877. doi:10.1016/j.solener.2023.111877. [Google Scholar] [CrossRef]
25. Lin S, Liu M, Li Q, Lu W, Yan Y, Liu C. Normalised normal constraint algorithm applied to multi-objective security-constrained optimal generation dispatch of large-scale power systems with wind farms and pumped-storage hydroelectric stations. IET Gener Transm Distrib. 2017;11(6):1539–48. doi:10.1049/iet-gtd.2016.1386. [Google Scholar] [CrossRef]
26. Azizivahed A, Karandeh R, Cecchi V, Naderi E, Li L, Zhang J. Multi-area dynamic economic dispatch considering water consumption minimization, wind generation, and energy storage system. In: 2020 IEEE Power & Energy Society Innovative Smart Grid Technologies Conference (ISGT); 2020 Feb 17–20; Washington, DC, USA. p. 1–5. [Google Scholar]
27. Ma Y, Li C, Zhou J, Zhang Y. Comprehensive stochastic optimal scheduling in residential micro energy grid considering pumped-storage unit and demand response. J Energy Storage. 2020;32:101968. doi:10.1016/j.est.2020.101968. [Google Scholar] [CrossRef]
28. Xu X, Hu W, Cao D, Huang Q, Chen C, Chen Z. Optimized sizing of a standalone PV-wind-hydropower station with pumped-storage installation hybrid energy system. Renew Energy. 2020;147(4):1418–31. doi:10.1016/j.renene.2019.09.099. [Google Scholar] [CrossRef]
29. Patwal RS, Narang N. Multi-objective generation scheduling of integrated energy system using fuzzy based surrogate worth trade-off approach. Renew Energy. 2020;156(1):864–82. doi:10.1016/j.renene.2020.04.058. [Google Scholar] [CrossRef]
30. Guo Y, Ming B, Huang Q, Wang Y, Zheng X, Zhang W. Risk-averse day-ahead generation scheduling of hydro-wind–photovoltaic complementary systems considering the steady requirement of power delivery. Appl Energy. 2022;309(8):118467. doi:10.1016/j.apenergy.2021.118467. [Google Scholar] [CrossRef]
31. Wang R, Yang W, Li X, Zhao Z, Zhang S. Day-ahead multi-objective optimal operation of Wind-PV–Pumped Storage hybrid system considering carbon emissions. Energy Rep. 2022;8:1270–9. doi:10.1016/j.egyr.2022.02.293. [Google Scholar] [CrossRef]
32. Lou N, Zhang Y, Wang Y, Liu Q, Li H, Sun Y, et al. Two-stage congestion management considering virtual power plant with cascade hydro-photovoltaic-pumped storage hybrid generation. IEEE Access. 2020;8:186335–47. doi:10.1109/ACCESS.2020.3030637. [Google Scholar] [CrossRef]
34. Ma S, Li Y, Jiang Y, Wu Y, Sha G. The multiobjective control based on tolerance optimization in a multienergy system. Int Trans Electr Energy Syst. 2024;2024(7):9991046. doi:10.1155/2024/9991046. [Google Scholar] [CrossRef]
33. Li Y, Li O, Wu F, Ma S, Shi L, Hong F. Multi-objective capacity optimization of grid-connected wind-pumped hydro storage hybrid systems considering variable-speed operation. Energies. 2023;16(24):8113. doi:10.3390/en16248113. [Google Scholar] [CrossRef]
Cite This Article
 Copyright © 2025 The Author(s). Published by Tech Science Press.
This work is licensed under a Creative Commons Attribution 4.0 International License , which permits unrestricted use, distribution, and reproduction in any medium, provided the original work is properly cited.
 Downloads
 Citation Tools