
 Submit a Paper
 Propose a Special lssue
 Open Access
ARTICLE

Innovative Mechanical Ventilation Control for Enhanced Indoor Air Quality and Energy Efficiency
1 Department of Mechanical, Energy and Management Engineering (DIMEG), University of Calabria, Cosenza, 87036, Italy
2 Department of Computer, Modelling, Electronics and Systems Engineering (DIMES), University of Calabria, Cosenza, 87036, Italy
* Corresponding Author: Giovanni Miracco. Email:
(This article belongs to the Special Issue: Innovative Approaches in Clean Energy Systems: Integration, Sustainability, and Policy Impact of Renewable Energy)
Energy Engineering 2025, 122(3), 861-883. https://doi.org/10.32604/ee.2025.060750
Received 08 November 2024; Accepted 22 January 2025; Issue published 07 March 2025
 View Full Text
 Download PDF
Abstract
Indoor air quality (IAQ) is often overlooked, yet a poorly maintained environment can lead to significant health issues and reduced concentration and productivity in work or educational settings. This study presents an innovative control system for mechanical ventilation specifically designed for university classrooms, with the dual goal of enhancing IAQ and increasing energy efficiency. Two classrooms with distinct construction characteristics were analyzed: one with exterior walls and windows, and the other completely underground. For each classroom, a model was developed using DesignBuilder software, which was calibrated with experimental data regarding CO₂ concentration, temperature, and relative humidity levels. The proposed ventilation system operates based on CO2 concentration, relative humidity, and potential for free heating and cooling. In addition, the analysis was conducted for other locations, demonstrating consistent energy savings across different climates and environments, always showing an annual reduction in energy consumption. Results demonstrate that mechanical ventilation, when integrated with heat recovery and free cooling strategies, significantly reduces energy consumption by up to 25%, while also maintaining optimal CO2 levels to enhance comfort and air quality. These findings emphasize the essential need for well-designed mechanical ventilation systems to ensure both psychophysical well-being and IAQ in enclosed spaces, particularly in environments intended for extended occupancy, such as classrooms. Furthermore, this approach has broad applicability, as it could be adapted to various building types, thereby contributing to sustainable energy management practices and promoting healthier indoor spaces. This study serves as a model for future designs aiming to balance energy efficiency with indoor air quality, especially relevant in the post-COVID era, where the importance of indoor air quality has become more widely recognized.Keywords
Indoor air quality (IAQ) significantly influences building conditions, affecting the health, comfort, and productivity of the people who inhabit them [1–3].
The recent COVID-19 pandemic served as a wake-up call to draw attention to a problem that has often been overlooked [4,5]: in indoor environments, particularly in school facilities, the concentration of hazardous substances reaches critical levels, causing varying degrees of illness depending on the type and duration of exposure experienced by occupants. People spend 90% of their lives indoors, meaning that exposure to indoor air pollutants has a significant impact on both human health and workplace effectiveness [6].
Until recently, research on air quality primarily focused on outdoor environments, emphasizing the need to reduce CO2 emissions [6,7]. Buildings themselves represent a significant source of environmental pollution due to their high energy demand [8–10]. However, emissions to the outdoor environment are not the only issue concerning them. Often, the level of indoor air quality is overlooked unless it results in a noticeable decline in occupant well-being; however, inadequate air quality can lead to various health issues [11]. Sundell [12] analyzed the relationships between indoor environments with inadequate air quality and associated health problems, such as allergies and respiratory infections, from various perspectives, concluding that indoor air quality plays a crucial role in public health.
Therefore, it is essential to equip spaces with carefully designed ventilation systems to ensure adequate air exchange rates at all times, thus providing the necessary conditions for air quality [13]. Air conditioning systems that do not include ventilation can even worsen indoor pollution levels [14]. Intelligent ventilation systems must maintain acceptable air quality levels by controlling humidity and CO2 [15]. Since the system introduces air that rarely matches the thermohygrometric conditions of the air present within, it is evident that such a system must operate using the least amount of energy possible [16–18]. De Jonge et al. [19] examined various mechanical ventilation control strategies to save energy while maintaining air quality.
The link between ventilation, indoor air quality (IAQ), and energy efficiency is widely recognized. Adequate ventilation is essential to dilute the concentrations of indoor pollutants, such as CO2, VOCs (Volatile Organic Compounds), and particulate matter, ensuring occupant comfort and health. High CO2 concentrations, for instance, can lead to symptoms like drowsiness and reduced cognitive performance, which are particularly critical in educational settings. Maintaining CO2 levels below 1000 ppm, as recommended by standards such as UNI EN 16798-1, ensures a healthy and productive environment [3].
However, ensuring proper air exchange comes with significant energy costs, as outdoor air must often be heated, cooled, or dehumidified depending on climatic conditions [20]. Advanced strategies, such as demand-controlled ventilation (DCV) and heat recovery systems, balance IAQ and energy efficiency by modulating airflow based on occupancy and pollutant levels. Dynamic ventilation systems that integrate free cooling and heating further enhance energy savings while maintaining indoor comfort.
The pollutants generated inside a classroom can vary, each with its own effects, ranging from nausea and headaches to very serious health issues [21]. Several studies have established relationships between indoor air quality and cognitive performance, suggesting that a greater supply of outdoor air corresponds to improved indoor air quality [22,23]. Among the most common pollutants are viruses and bacteria [5,24], VOCs [25], CO2 [26], formaldehyde [27], and many others [12]. The presence of occupants plays a key role in the energy consumption of buildings [28]. In addition to the activities performed, occupants release both sensible and latent heat into indoor spaces depending on their behavior and also determine the amount of CO2 emitted into the environment due to respiration [29]. In school environments and, more generally, in closed spaces, it is important to monitor carbon dioxide levels, not so much because it represents a high-risk component but because it serves as an excellent indicator for assessing overall air quality: CO2 levels in the air increase proportionally to the rising levels of other potentially harmful substances [30]. However, according to ASHRAE’s position document (American Society of Heating, Refrigerating, and Air-Conditioning Engineers), the relationship between CO2 concentration and indoor air quality (IAQ) has been misinterpreted [31]. Indeed, CO2 measurements do not necessarily reflect overall IAQ. On the other hand, if managed appropriately, they can be useful for regulating ventilation rates in different areas, in accordance with ASHRAE standards 62.1 [32].
Ventilation can be performed actively, through systems that exchange air, or passively. Passive ventilation in schools requires regular window opening to maintain hygienically safe indoor air quality, but this is often perceived as inconvenient by occupants. Moreover, it does not always maintain hygienic air exchange rates, resulting in elevated CO2 concentrations [33]. Mechanical ventilation, on the other hand, allows for filtering and regulating air flow according to occupancy needs [34]. These advanced mechanical ventilation systems, especially when integrated with intelligent control strategies, represent a crucial step forward in achieving energy-efficient air exchange while maintaining indoor comfort and safety. The integration of heat recovery units in ventilation systems would increase air pumping costs but would allow for a substantial reduction in ventilation loads. These strategies are particularly relevant in educational settings, where poor IAQ can directly affect learning outcomes and overall well-being [35].
In this context, the proposed study investigates innovative mechanical ventilation control strategies that optimize IAQ and energy efficiency. The system evaluates ventilation rates (Q = 150, 300, and 450 m3 h−1) and integrates free cooling and heating, ensuring pollutant removal while minimizing energy consumption. These principles highlight how advanced ventilation systems can effectively balance the trade-offs between indoor air quality, occupant comfort, and energy use.
Different ventilation control strategies can influence indoor air quality [15]. Moreover, the adoption of intelligent ventilation systems reduces energy consumption by removing part of the thermal load from the room [15,36]. Hesaraki et al. [37] demonstrated that controlling the ventilation rate based on CO2 levels leads to acceptable indoor air quality and significant energy savings.
Bruno et al. [38] verified the efficient use of a building-system approach to improve the summer thermal comfort of a real conference room, evaluating different types of emitters, control strategies, and comfort parameters. Other researchers have found that significant energy savings can be achieved from systems controlled by efficient ventilation strategies: specifically, energy savings exceeding 20% on energy demand can be obtained [39,40].
The aim of this work is to define an easily replicable control system that ensures the salubrity of air in enclosed spaces, with particular attention to the amount of energy required for environmental conditioning. This paper presents an innovative control system for mechanical ventilation in buildings. Specifically, a management program has been defined for the system’s activation under conditions that allow for free heating and free cooling, enabling the system to provide ventilation for air conditioning purposes even when critical pollution levels are not present. If this opportunity for free conditioning is not available, the system assesses CO2 concentration using appropriate sensors, and if it exceeds permitted limits, mechanical ventilation is activated. Conversely, if even the CO2 level in the indoor air does not necessitate the use of replacement air, the system evaluates relative humidity in order to activate mechanical ventilation.
Compared to existing studies in the literature, this introduces free heating and free cooling strategies into controlled mechanical ventilation as methods of energy-efficient air exchange: indeed, the energy spent only pertains to that necessary for air movement since it already presents the useful temperature conditions for internal environmental conditioning. This approach not only enhances energy efficiency but also provides a replicable model adaptable to various building types and climatic conditions, addressing a critical gap in existing research.
An innovative aspect of the proposed system lies in its integration of free heating and free cooling strategies with conventional ventilation controls. This allows for energy-efficient air exchange by leveraging favorable outdoor conditions, minimizing the need for mechanical conditioning. The hierarchical decision-making process prioritizes free conditioning, followed by CO2 concentration control and humidity regulation. This sequential approach ensures optimal indoor air quality and comfort while reducing energy demand. Simulations demonstrated that, compared to conventional systems, the proposed method reduces thermal energy demand by up to 34%, highlighting its effectiveness and efficiency. Furthermore, this approach offers flexibility, making it adaptable to various building types and climatic conditions.
Simulations were conducted using the EnergyPlus calculation code through the DesignBuilder graphical interface, which is internationally recognized for its accuracy in modeling building performance, making it a widely used tool in energy efficiency studies [38,41].
The next section will present the methodology used to conduct the study, then the defined simulation model in the software will be calibrated, and finally, the results of the energy analysis will be presented.
This document discusses the design of a system intended to ensure both thermal-hygrometric and olfactory comfort in buildings.
First of all, the control system will be introduced. Following this, the implemented numerical model and the experimental setup for the measurements will be discussed. The model will then be calibrated using CO2 values acquired on-site during a short occupancy period. After validating the model implemented in the software, energy simulations will be conducted according to different strategies to assess their effectiveness in terms of indoor pollution, while also focusing on energy consumption for both summer and winter conditioning. Then, specific indices will be defined to evaluate the performance of the various control systems analyzed. Finally, an additional analysis will be conducted to evaluate the effects of external factors on energy demand.
2.1 Definition of Control System
This section will present the innovative control system that manages the activation of the mechanical ventilation system. It includes three different types of operation, implemented in order of priority. First, the system checks the conditions under which free heating or free cooling can be utilized. If this does not occur, the system activates if the CO2 level inside the environment is high. If, on the other hand, the CO2 concentration is within safe levels, the system then checks the internal relative humidity.
The control over the possibility of utilizing free heating and free cooling strategies differs between the winter and summer periods. During the heating season, if the outdoor air temperature is higher than the indoor temperature, the mechanical ventilation system operates without using the heat recovery unit, introducing a certain amount of fresh air into the environment. The same applies in the summer period, if the outdoor air temperature is lower than the indoor temperature.
The control over the carbon dioxide levels inside the classroom dictates that the ventilation system activates for concentrations exceeding 900 ppm [42] and deactivates for concentrations below 750 ppm. Since this is a “dead-band control” for each simulation step within this range, the system will follow the instructions executed in the previous step.
The control for relative humidity accounts for the fact that occupants feel comfortable in an environment with a relative humidity between 40% and 60%. Additionally, for humidification or dehumidification through the introduction of external air to be effective, a significant difference between the specific humidity of the outdoor air and that of the indoor air is necessary. This gap is defined as the Humidity Factor (HF), which, in the case of humidification, represents the factor to multiply the specific humidity of the indoor air so that it matches that of the outdoor air; the reverse applies for dehumidification. It ensures that the replacement air has a sufficiently different humidity level to adjust the indoor relative humidity.
Fig. 1 shows the block diagram explaining the operation of the designed control system. The diagram illustrates that the first check involves the possibility of using free air conditioning strategies; if this condition is met, the system is activated, otherwise, it moves to the next control, and so on.
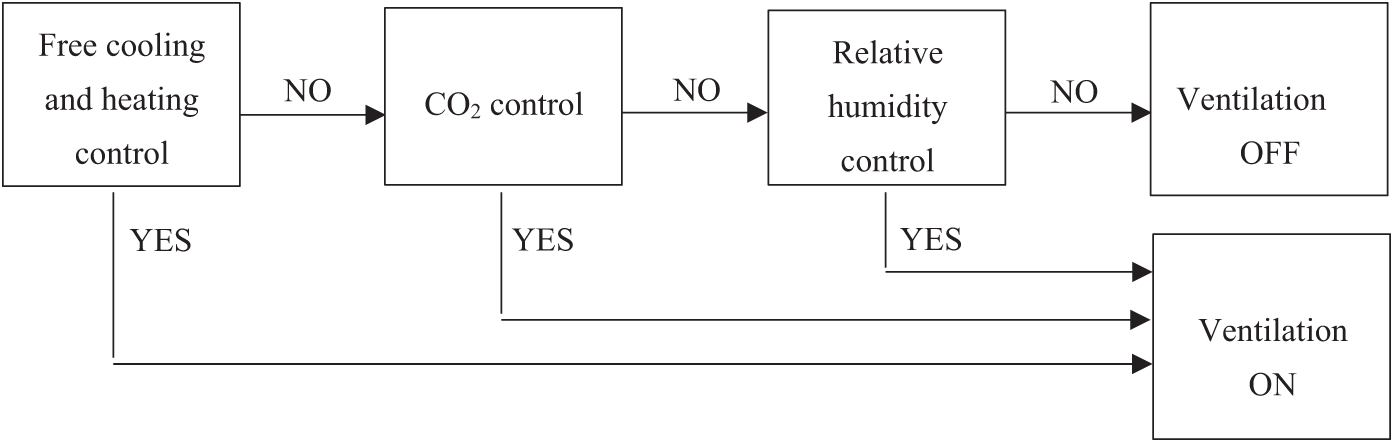
Figure 1: Block diagram of the control hierarchy for mechanical ventilation
First, the three control systems are analyzed individually. Next, to complete the ventilation control, the three codes have been combined to ensure that the system makes the best use of favorable outdoor air conditions and guarantees occupant comfort. The complete control first checks the possibility of utilizing free cooling and free heating, as these are free resources, and thus very advantageous. Next, the CO2 concentration control is applied, followed lastly by the relative humidity control.
Unlike traditional systems, which typically rely on fixed ventilation rates or only address CO2 concentration or humidity, the proposed system integrates multiple control strategies in a hierarchical approach. First, it prioritizes the use of free cooling or heating, which are energy-efficient solutions utilizing outdoor environmental conditions to reduce indoor temperature. If these strategies are not applicable, the system then activates based on CO2 concentration, followed by humidity control if necessary. This dynamic prioritization of control based on real-time indoor conditions is an innovative aspect of the proposed system. It allows for a flexible, energy-efficient solution that adapts to varying environmental conditions while maintaining optimal indoor air quality. By integrating free heating and cooling into the decision-making process, the system reduces reliance on mechanical conditioning, significantly improving energy efficiency without compromising occupant comfort.
Simulations have been conducted under various conditions. First, the behavior of the classroom without a mechanical ventilation system (NO-MV case study) was examined. Next, the various controls were tested individually (free cooling and heating FC&H, CO2 and relative humidity RH), and finally, the complete control (CC) was employed, performing a parametric analysis by varying the ventilation rate and the factor related to the specific humidity of the outdoor air. The time interval used is 10 min, and the simulation was conducted over an entire calendar year.
2.2 Implementation of the Control System in EMS
Since the system requires control to function properly, the EMS (Energy Management System) in DesignBuilder will be used to provide the instructions to the program. In this study, a system will be simulated that activates based on the amount of CO2 present in the environment, relative humidity, or the possibility of utilizing free cooling and free heating strategies. Initially, the indoor environment behavior will be simulated with each control applied individually, and subsequently, a simultaneous control of all parameters will be adopted. The system will be turned off during nighttime hours (from 8:00 p.m. to 8:00 a.m. the following day), on weekends, and in August.
Regarding free heating and free cooling, the EMS code stipulates that in the winter period, from October 15 to April 15, if the outdoor air temperature is greater than the indoor air temperature, the system should operate without using the heat recovery unit; the same consideration applies in the summer period (from April 15 to October 15) when the outdoor air temperature is less than the indoor air temperature.
The case study analyzing the innovative control system was conducted with reference to two typical university classrooms. The first classroom, referred to as Classroom A, measures 7.40 m × 6.65 m × 2.92 m. The room has only one exterior wall, which is uninsulated. There is a door and single-glazed windows with shading that extend the entire length of the exterior wall, reaching a height of 2 m. The classroom is equipped with a conditioning system that operates through a duct located at the top of the wall opposite the exterior, delivering thermally treated air into the room, while the air is extracted due to the overpressure that builds up inside the environment. Fig. 2 shows the model of the classroom implemented in the software, where the door is depicted in blue and the windows in yellow. All walls are adiabatic, except for the one with the glazing components.
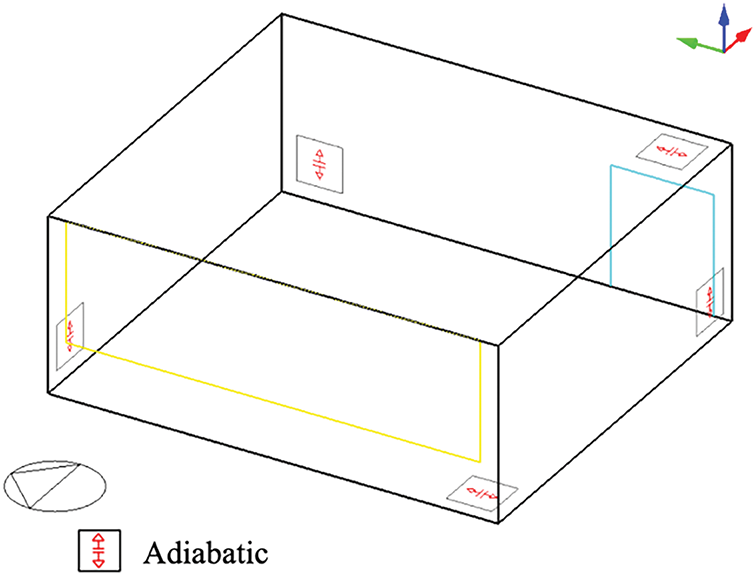
Figure 2: DesignBuilder layout of Classroom A
The second classroom, referred to as Classroom B (Fig. 3), is completely underground, so it has no walls facing the outside. Its dimensions are 8.52 m × 9.44 m × 3.00 m, and the only opening is a door measuring 1.34 m × 2.2 m. The classroom is equipped with a ventilation system that activates when the CO2 sensor detects a concentration of approximately 750 ppm: the air extracted from the environment passes through a heat recovery unit, where outside air is brought in, and is then expelled into the corridor. Additionally, there are supply and exhaust ducts for the air conditioning system. Fig. 3 shows that the floor of the room is at ground level.
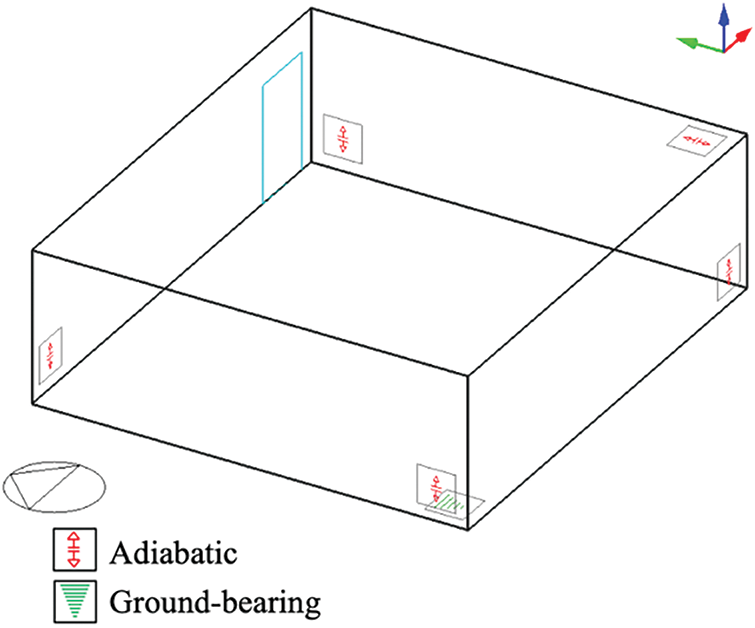
Figure 3: DesignBuilder layout of Classroom B
The two classrooms are equipped with a system for measuring carbon dioxide concentration within the environment in the presence of occupants, to assess air quality and olfactory comfort. These measuring instruments are capable of measuring, in addition to carbon dioxide concentration, the air temperature and relative humidity. The measurement time of the instruments is 1 min. Two different types of sensors were used.
The first sensor is the Comet U3430, which can record temperature, relative humidity, and carbon dioxide signals. The data is recorded on non-volatile electronic memory, and the information can be easily transferred to a PC via a USB-C interface. The technical specifications of the instrument are as follows:
– Temperature: measurement range from −20°C to +60°C (±0.4°C—resolution of 0.1°C);
– Relative humidity: measurement range from 0% to 100% (±1.8%—resolution of 0.1%);
– CO2: measurement range from 0 to 5000 ppm (±50 ppm—resolution of 1 ppm) at 25°C and 1013 hPa.
The recording interval can be adjusted from 1 s to 24 h, and the data overwrites previous data once the memory is full.
The Comet U3430 sensor was selected for its accuracy and wide measurement range, suitable for capturing CO2 concentrations up to 5000 ppm, which is critical for indoor air quality monitoring in classroom settings. With an accuracy of ±50 ppm for CO2 and ±0.4°C for temperature, the sensor provides reliable data for air quality management. The 1-min measurement interval ensures a balance between real-time monitoring and data manageability, allowing for effective system control without overwhelming the system with excessive data.
Before use, the sensors were calibrated with reference standards to ensure accuracy. Calibration was conducted for CO2, temperature, and humidity, and the sensors were positioned at approximately 1.5 m above the ground to capture air quality at the breathing level of the occupants. This positioning ensures that the sensors provide accurate readings of the air experienced by the occupants. Additionally, the sensor was placed away from local sources of pollution, such as windows and fans, to obtain accurate air quality measurements throughout the environment, without being affected by airflows or external atmospheric conditions. This positioning ensures that the sensor detects air quality in a representative manner, reflecting the true conditions of the entire space.
The non-volatile memory of the sensors allows continuous data recording, even in case of power interruptions. The data can be easily transferred via USB-C interface, making integration with the monitoring system seamless. The adjustable recording interval offers flexibility, enabling the system to be tailored to specific monitoring needs.
Measurements for Classroom A were taken during a typical day of university lectures from 9:49 a.m. to 12:09 p.m. The time period considered for Classroom B, on the other hand, runs from 12:30 p.m. to 2:20 p.m.
2.5 Calibration of the Numerical Model
The numerical model of the two classrooms is validated using two sets of experimental data on CO2 concentration within the environments. The first data set is used to define the parameters that need to be calibrated to ensure that the model and reality are as similar as possible; the second data set is used to validate the previously defined model. For this purpose, we define four calibration simulations:
– C1, calibration of the Classroom A model with the first data set,
– C2, calibration of the Classroom B model with the first data set,
– C3, validation of the Classroom A model with the second data set,
– C4, validation of the Classroom B model with the second data set.
The two classrooms were defined in the software according to the models shown in Figs. 2 and 3. The input parameter settings for calibration reflect the actual conditions under which the measurements of the observed parameters were taken and differ for the four case studies.
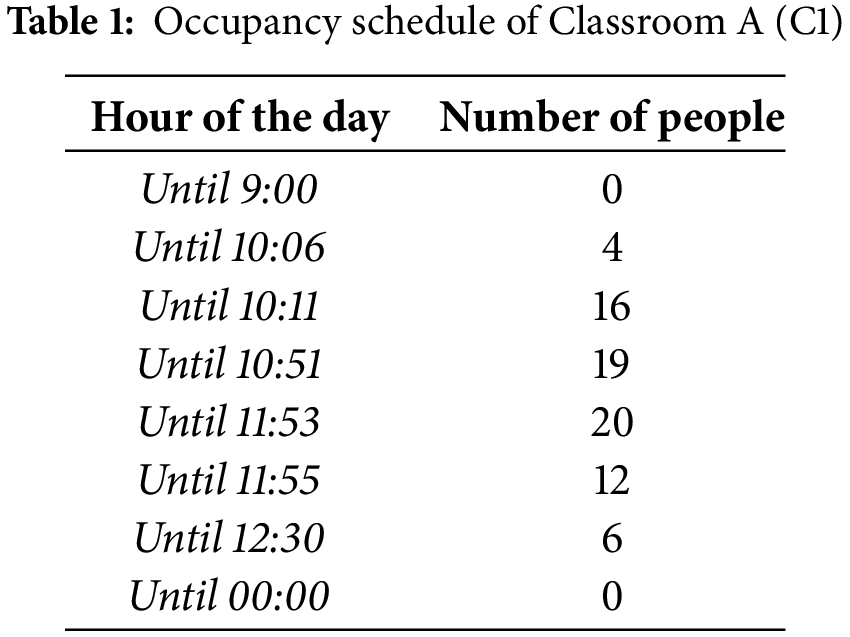
For Case C1, concerning Classroom A, in the “Activity” section of the software, a density of people per unit area of 0.406 people per square meter was set (for a total of 20 people). The classroom’s occupancy schedule is shown in Table 1. The air infiltration rate is the target of the model calibration. The windows are half open from 10:55 a.m. to 11:35 a.m. and fully open from 11:35 a.m. onward; the door is open from 10:55 a.m. to 11:15 a.m. and again from 11:35 a.m. onward.
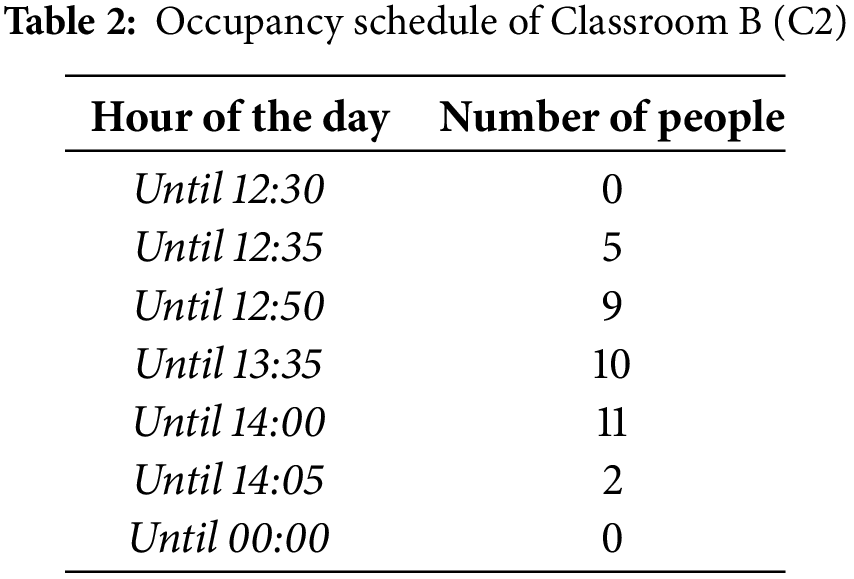
As previously mentioned, Classroom B has no openings to the outside, but it is equipped with a mechanical ventilation system that activates when the CO2 concentration exceeds a threshold of approximately 750 ppm. Since this value is not precisely defined due to a sensor malfunction in the classroom, determining its optimal value is part of the model calibration. In this case, it was necessary to define a program within the EMS (Energy Management System) of DesignBuilder to ensure that the ventilation system is activated when the CO2 concentration exceeds the limit value. Regarding classroom occupancy during the measurement period, refer to Table 2. The door remains closed from 12:38 p.m. to 2:00 p.m.; otherwise, it is fully open.
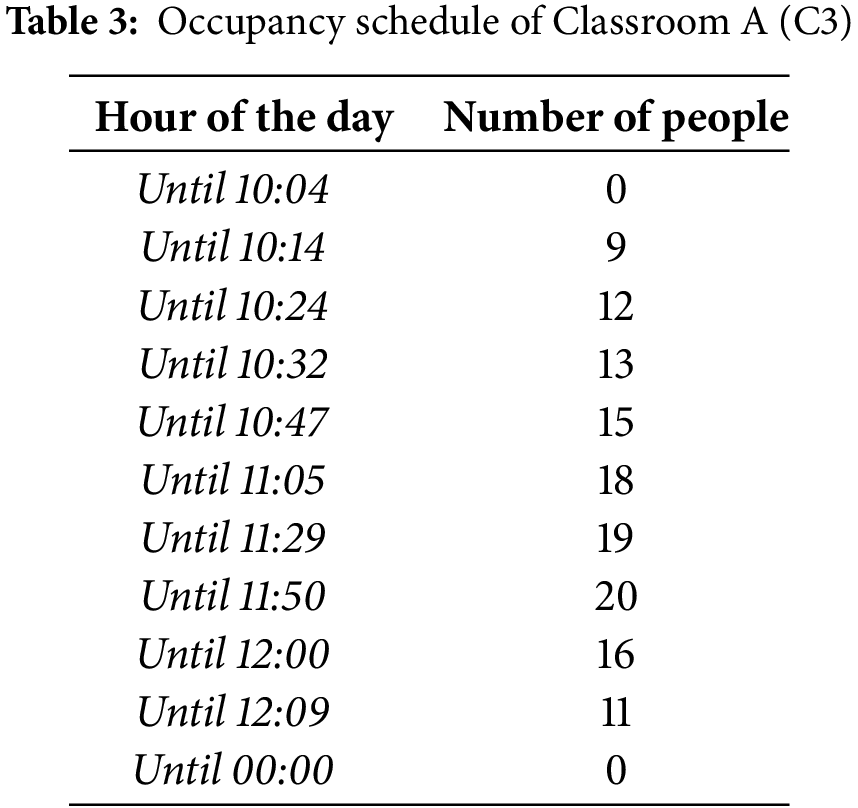
Case C3 analyzes Classroom A with the same parameters as Case C1, except for occupancy and the opening of doors and windows. In this case, the measurement period runs from 10:04 a.m. to 12:34 p.m. The occupancy schedule is shown in Table 3. The windows are half open from 10:35 a.m. to 11:05 a.m., from 11:15 a.m. to 11:35 a.m., and fully open from 12:25 p.m. onward; the door is open from 10:55 a.m. to 11:05 a.m., from 11:15 a.m. to 11:35 a.m., and again from 12:25 p.m. onward.
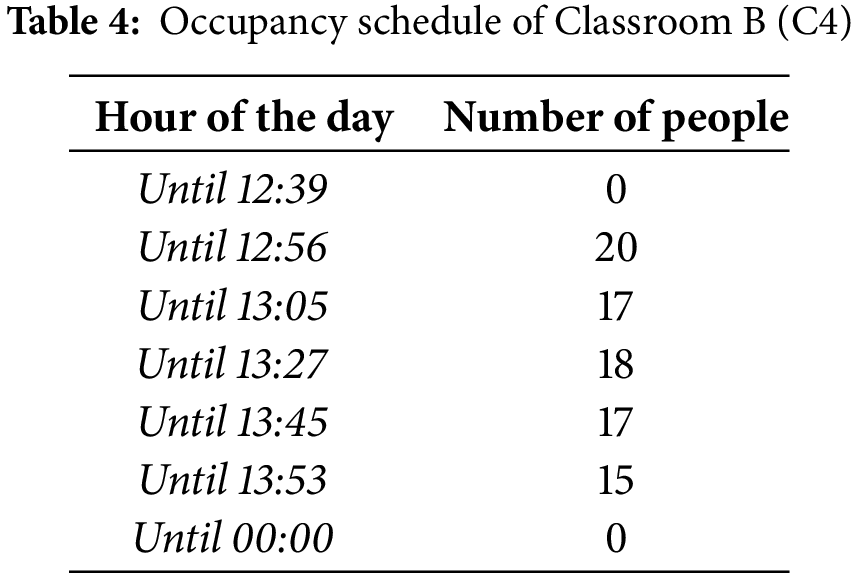
Case C4 concerns the validation of the model for Classroom B. The measurements refer to the time period from 12:39 p.m. to 1:54 p.m. In this case, the occupancy schedule refers to Table 4, and the door remains closed for the entire time.
The software allows for the definition of the CO2 trend over the analyzed time period, which must be compared with the experimental values to calibrate the most significant parameters, such as:
– Occupants’ metabolic rate,
– Air permeability rate,
– MVHR (mechanical ventilation with heat recovery) activation threshold (Classroom B only),
– MVHR system airflow rate (Classroom B only).
External variables such as wind and outdoor temperature were accounted for in the infiltration rate calibration by providing the software with the necessary values for external temperature, wind speed, and wind direction. This allowed the software to incorporate these factors into the calculation, ensuring a more accurate determination of the infiltration rate by considering the impact of outdoor conditions on the indoor environment.
To evaluate the error between the trends obtained through DesignBuilder and those derived from the experimental data collected on-site, the root mean square error (RMSE) was used, along with its normalized value (NRMSE). The expression used to calculate this error is as follows:
where:
– n: total number of values,
– Ys,i: i-th value obtained from the simulation,
– Ym,i: i-th value obtained from the measurement.
The normalized value is obtained by dividing the RMSE by the average of all values obtained through the simulation:
2.6 Definition of Simulation Scenarios
This section addresses the design of the mechanical ventilation system aimed at ensuring optimal conditions in the two classrooms, both in terms of indoor air quality and thermal comfort. Using DesignBuilder, the system’s operation will be simulated by varying certain parameters and in different operational scenarios, with attention to total energy consumption over an entire year. Based on these simulations, indices will be defined to evaluate the optimal outcomes achievable through the system’s use.
For Classroom A, since it has windows facing the exterior and a heating system but lacks a mechanical ventilation system, DesignBuilder will be used to implement an MVHR system that aims to achieve air quality and thermal comfort objectives. The system provided for the classroom includes a boiler (efficiency η = 0.80) for winter heating, a heat pump (coefficient of performance COP = 1.80) for summer cooling, and an air handling unit with heat recovery (efficiency ε = 0.75) for mechanical ventilation.
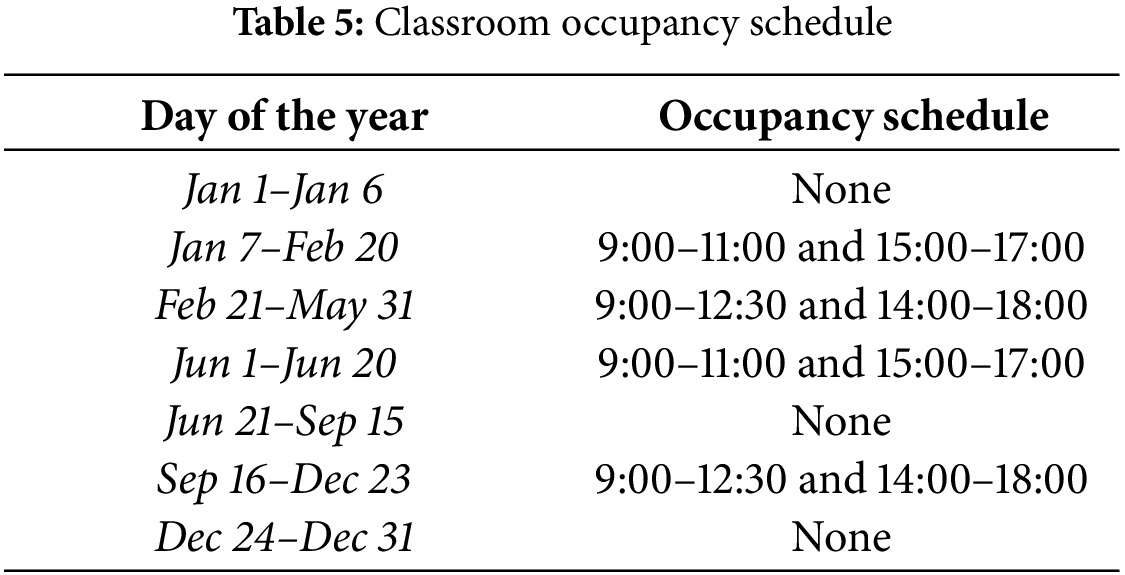
While calibration involved measurements taken over a short period, this analysis aims to represent the classroom’s behavior over an entire year. A new typical annual occupancy schedule for a university classroom is defined. The occupancy schedule for the two classrooms is shown in Table 5. During weekends and holidays, the classrooms will be unoccupied, while on occupied days, Classroom A will consistently accommodate 20 people, and Classroom B will accommodate 11 people.
In addition to the presence of occupants, it is essential to consider the devices used within the classroom that can emit heat and thus impact the room’s thermal balance equation. In this case, it has been assumed that the only device present is a computer with a power rating of 125 W, whose operation is regulated by a specific program pre-set in the software, related to devices typically found in educational environments.
Finally, the temperature setpoints for heating and cooling are set at 20°C and 26°C, respectively. There is also a lighting system with a power density of 5 W m−2.
In the simulations performed, the Humidity Factor (HF) takes on values of 1.1, 1.2, 1.3, and 1.5. These values are chosen to ensure that there is a sufficient difference between the moisture content of the indoor and outdoor air, but not so large as to prevent the control from acting, which could occur if the HF condition is set too stringently.
The ventilation rate (Q) is set at 150, 300, or 450 m3 h−1. The value of 150 m3 h−1 corresponds to 1 ACH (air change per hour), which is the air change rate obtained from the calibration for Classroom A. The values of 300 and 450 m3 h−1 are recommended by the UNI EN 16798-1 [42] standard, ensuring compliance with higher ventilation requirements for improved indoor air quality.
Classroom B, being larger in floor area, would typically require a higher air exchange rate. However, considering its lower occupancy rate, it was decided to maintain the same values of Q used for Classroom A to balance air quality and energy efficiency.
To evaluate which scenario is the best in terms of comfort, several indices were introduced for comparison. This way, the necessary humidity factor and ventilation rate will be determined.
The first index is the average CO2 concentration during the occupancy period: it represents the sum of all measured carbon dioxide concentration values (CCO2) during the intervals when people occupy the room, divided by the number of those intervals (N), and is expressed by the formula:
Subsequently, the percentage of time that occupants are present while the relative humidity remains between 40% and 60% was evaluated. By calculating the ratio between the number of intervals in which these conditions are met and the number of intervals in which people are present, the percentage of time in a year during which relative humidity falls within the optimal range can be determined.
Additionally, the software can identify the summer and winter thermal energy demand for the specified classroom in each of the various configurations analyzed.
To evaluate the impact of external factors on energy consumption, a sensitivity analysis was conducted by varying the infiltration rate and outdoor temperature. First, different infiltration rates (0.5 to 1.0 ACH, with step of 0.1 ACH) were simulated to analyze how variations in this parameter affect thermal loads and the overall energy consumption of the ventilation system.
Subsequently, three locations with different average annual temperatures were considered: Barcelona, Palermo, and Berlin. The selection was based on their average annual temperatures, representing diverse climatic conditions. Specifically, Barcelona has an average annual temperature of 15.72°C, Palermo of 18.42°C, and Berlin of 9.82°C. Among these, Palermo and Berlin were selected for detailed simulations due to their contrasting climates: Palermo, with a Mediterranean climate characterized by high outdoor temperatures, and Berlin, with a temperate continental climate featuring colder conditions. This allowed for a comprehensive analysis of how outdoor temperature variations influence the operation of the ventilation system and energy demand.
The energy demand was compared between the case with no ventilation system (NO-MV) and the case with complete control (CC) using a ventilation rate of 450 m3/h and a Humidity Factor (HF) of 1.3. This comparison highlighted the energy-saving potential of the ventilation system, showing how the complete control scenario reduces energy consumption while maintaining optimal indoor air quality and comfort.
The simulations were conducted only for Classroom A, as Classroom B does not have any building elements exposed to the external environment. This lack of external exposure in Classroom B made it less relevant for the analysis of infiltration and outdoor temperature effects, so the focus was placed solely on Classroom A.
This analysis highlighted the crucial role of climatic conditions and infiltration rates in determining system efficiency, underscoring the need to adapt control parameters to local characteristics. The results were used to evaluate the flexibility of the proposed methodology and optimize its performance in diverse climatic and operational scenarios.
3.1 Calibration of Numerical Models
This section presents the results related to the calibration of the models implemented in the software for both classrooms.
In Case C1 related to Classroom A, the calibration resulted in an air infiltration rate of 1 ACH and a metabolic rate of 1 W m−2. For Classroom B, in addition to the parameters already defined for Classroom A, it was necessary to calibrate the activation threshold value of the ventilation system, which is set at 735 ppm of CO2, and the ventilation rate provided by the system, which is 3 ACH. Fig. 4 shows the trends of the measured and simulated calibration values for Classrooms A and B.
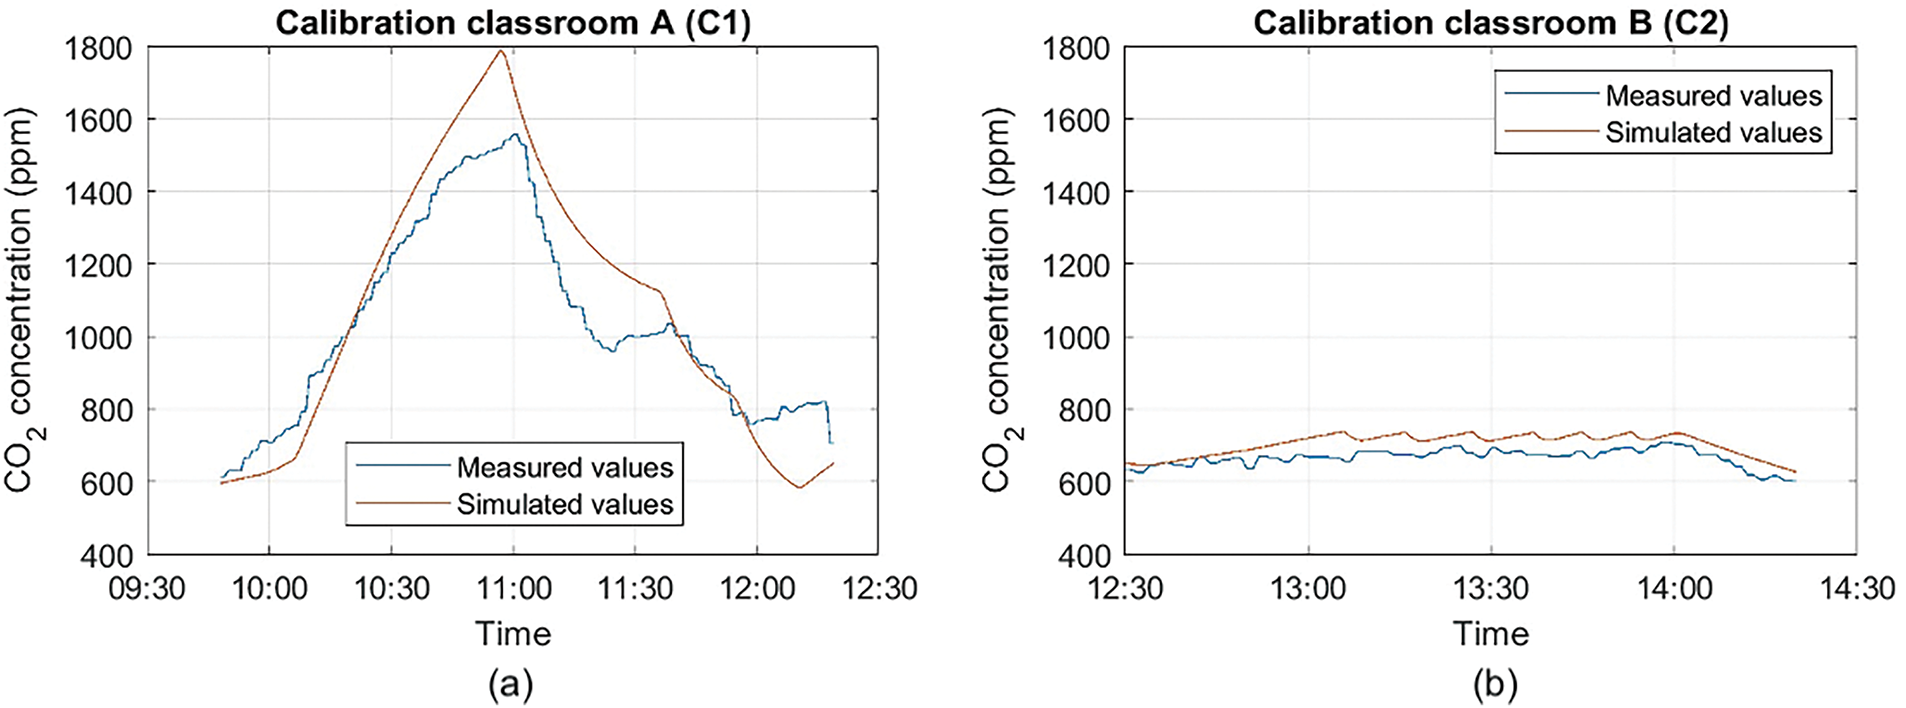
Figure 4: Trends of CO2 in the calibration of the models of the Classroom A (a) and the Classroom B (b)
As can be seen from Fig. 4a, due to the lack of an adequate mechanical ventilation system, the amount of pollutant present in the environment for Classroom A is almost always above the threshold of 900 ppm. Given that this is a university classroom, it is clear that this could lead to a decrease in attention span and thus a reduction in productivity among the students and faculty occupying the room. The decrease in carbon dioxide concentration within the classroom, observed from around 11:00 a.m., is due to the opening of the window. Classroom B, being equipped with a ventilation system controlled by a carbon dioxide sensor, never exceeds the 900 ppm limit (Fig. 4b). This indicates that the classroom is suitable for educational activities.
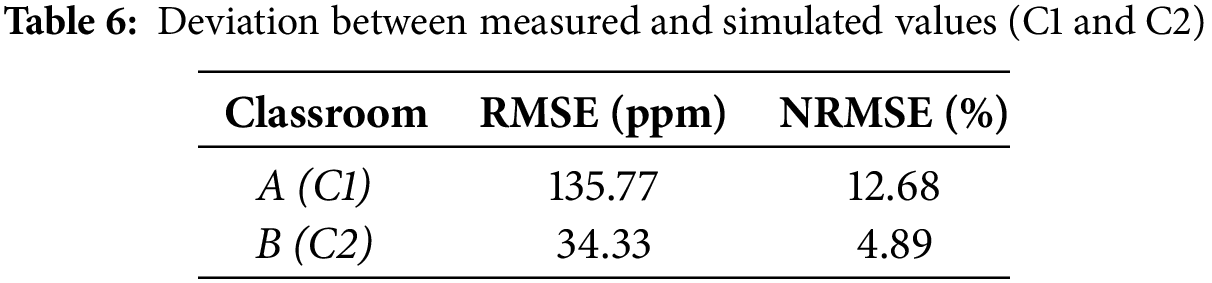
Table 6 shows the RMSE and NRMSE values for both classrooms. In both cases, the NRMSE values are below 30%, which is the recommended threshold suggested by ASHRAE [43]. In the case of Classroom A, higher error values are noted compared to Classroom B, due to the influence of natural factors such as wind speed and outdoor air temperature, making it challenging to accurately simulate the system’s behavior.
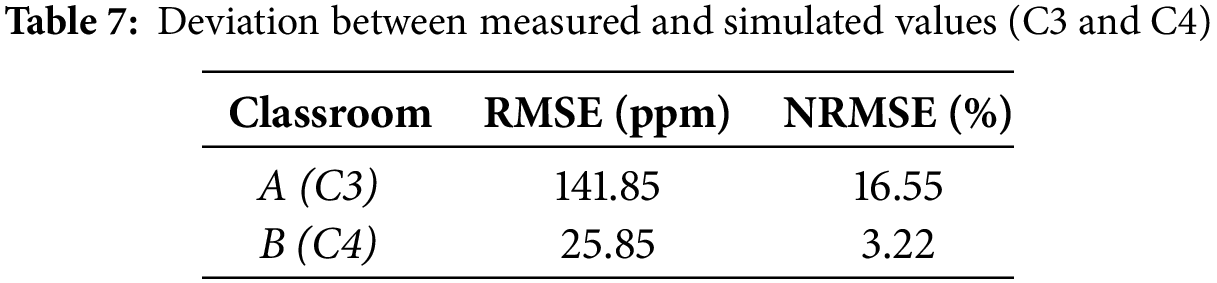
Regarding the model validation simulations, Fig. 5 shows the trends of CO2 concentration in each of the two classrooms. The error values, compared to the previous case, are higher for Classroom A but lower for Classroom B. In both cases, however, the NRMSE values are below the limits set by ASHRAE, so it is fair to say that the model is well calibrated and can be used for simulations, as can be seen in Table 7.
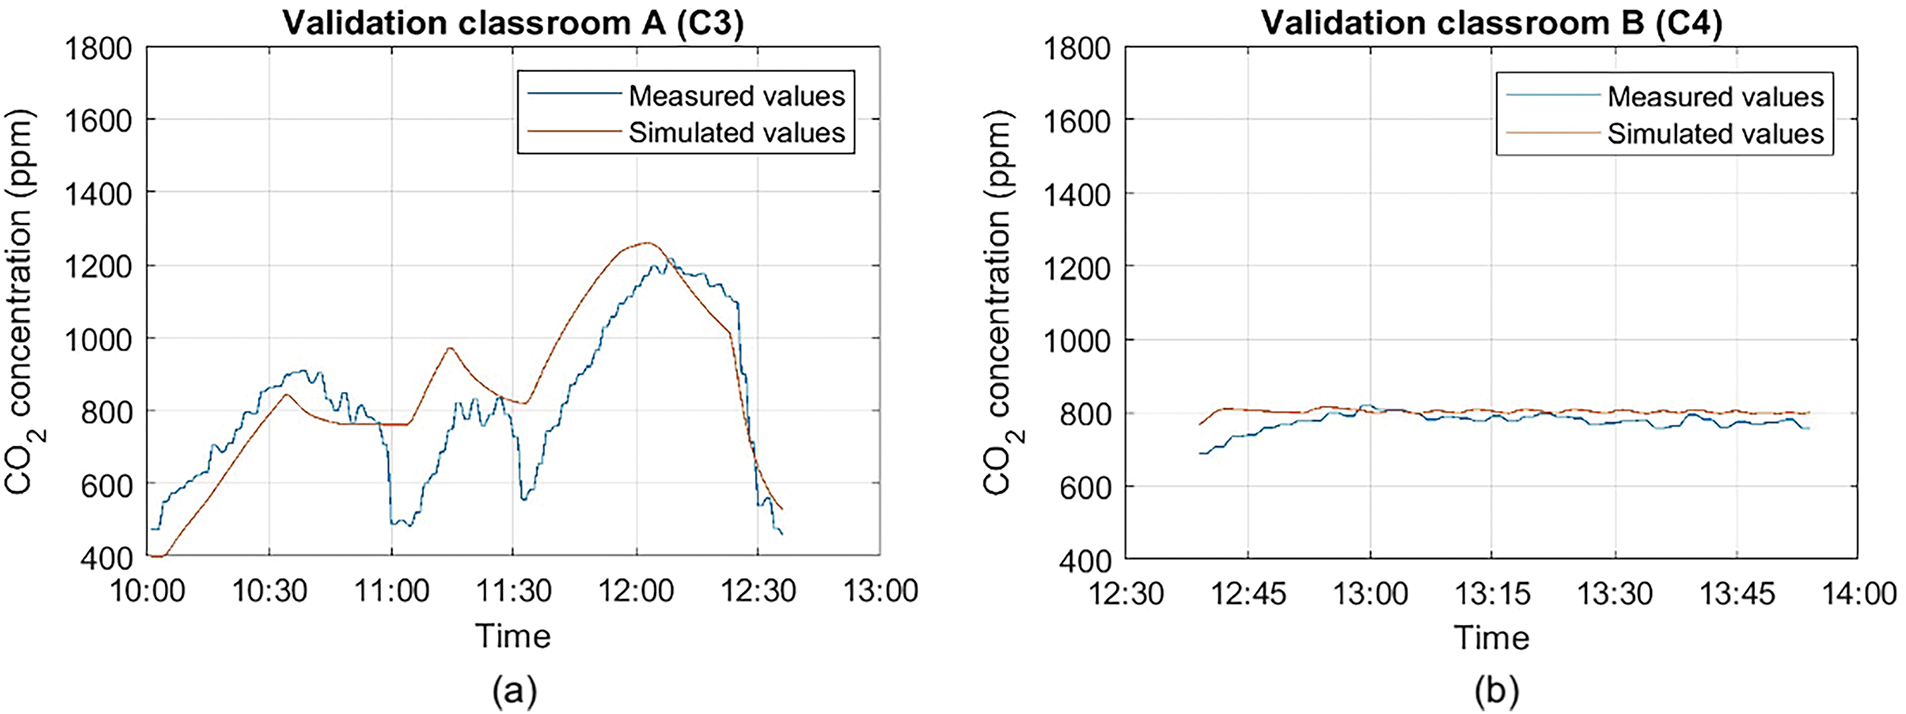
Figure 5: Trends of CO2 in the validation of the models of the Classroom A (a) and the Classroom B (b)
3.2 Results of Energy Simulations for Classroom A
Based on the performance indices defined previously, the results obtained for both classrooms in the various plant configurations are presented.
For Classroom A, Fig. 6 shows the values of the average CO2 concentration for the various system configurations. In the case of complete control, when the HF is varied, the airflow is set at 450 m3 h−1, while when the airflow itself is varied, HF = 1.3. The graph clearly illustrates that the absence of a ventilation system creates an intolerable situation within the environment. The best situation is certainly achieved when the ventilation flow rate is 450 m3 h−1, which ensures proper and effective dilution of the indoor air. The flow rate is indeed a parameter that greatly influences indoor air quality. Since the concentration of carbon dioxide has been assessed using an index that considers the average during the period of occupants’ presence, it does not provide an accurate indication of what is happening in the classroom. For this reason, it is necessary to visualize the trend of CO2 over an entire day in the various system configurations.
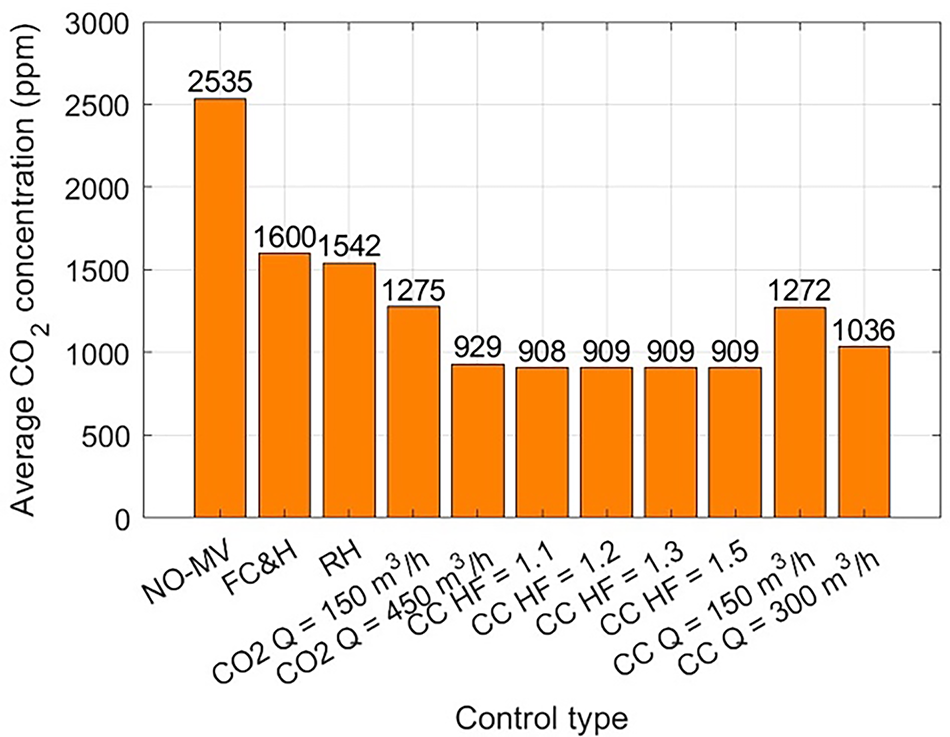
Figure 6: Average CO2 concentration in various configurations for Classroom A
In Fig. 7a, the trend of carbon dioxide concentration is shown for a typical day of university classes. The classroom is occupied from 9:00 a.m. to 12:30 p.m. and then from 2:00 to 6:00 p.m., during which periods a rapid increase in pollutant concentration is observed. The parametric analysis conducted suggests that only for flow rates greater than 450 m3 h−1 is the correct air exchange guaranteed, thus preventing the threshold value from being exceeded.
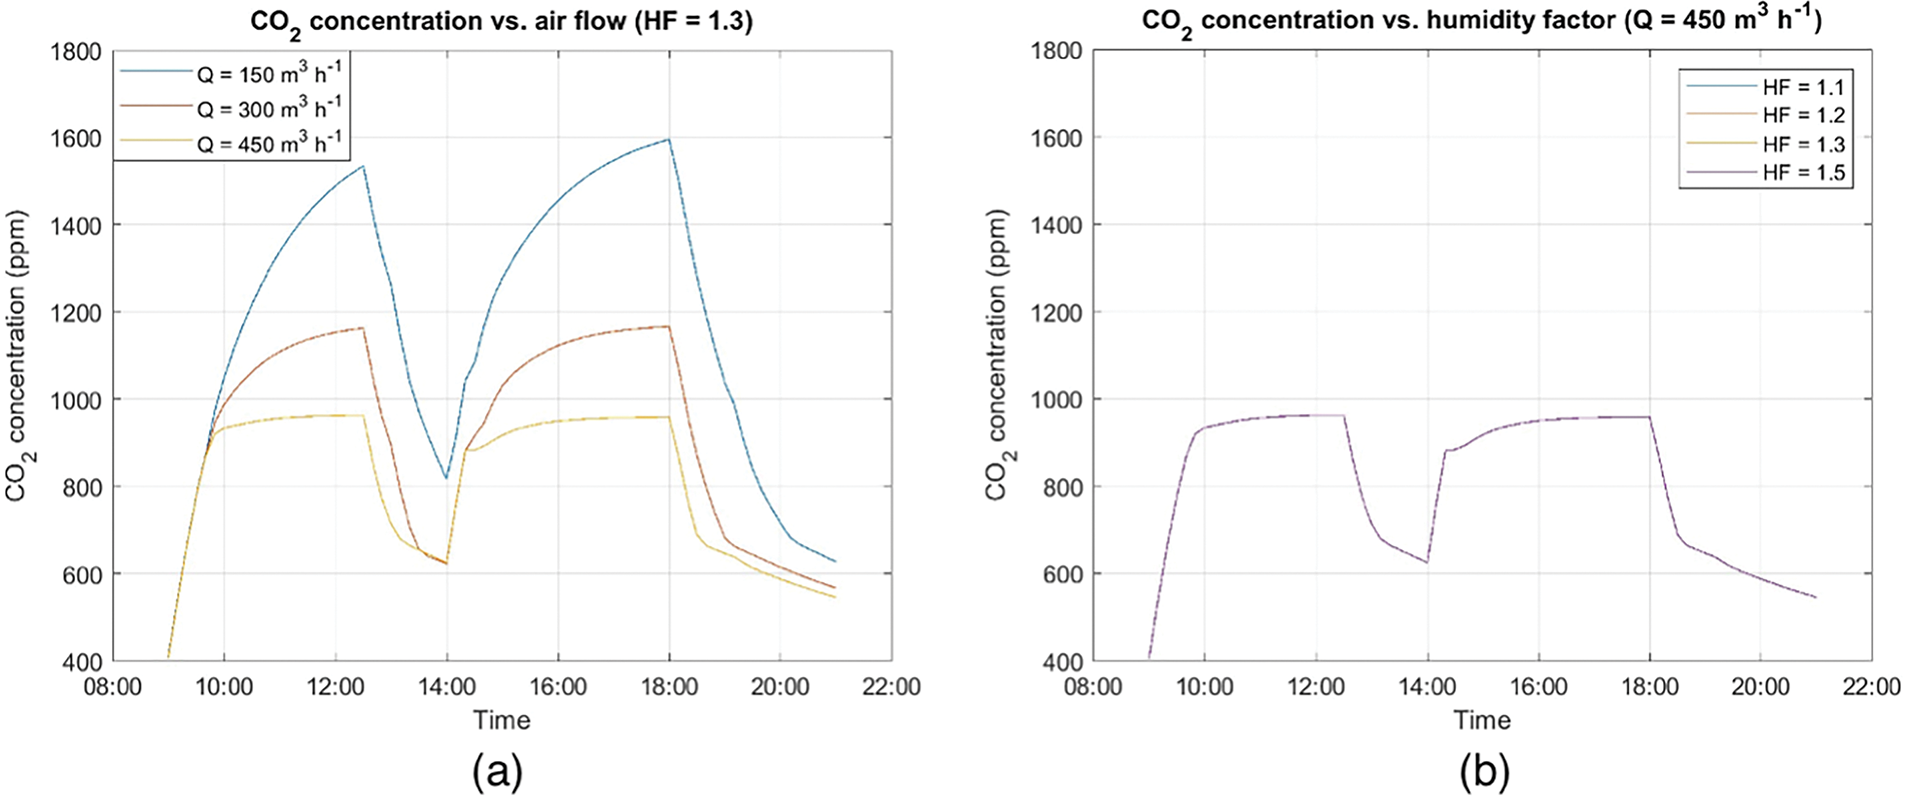
Figure 7: Daily CO2 concentration inside Classroom A varying with Q (a) and HF (b)
The parametric analysis varying the relative humidity factor shows that its influence on the internal carbon dioxide concentration is virtually nonexistent. As shown in Fig. 7b, the trends obtained from the simulation are completely overlapping: for this reason, the relative humidity factor does not affect the level of contaminants within the environment.
Fig. 8 presents the values of the relative humidity index. The most favorable situation occurs not only with control over the relative humidity present within the environment, as expected, but also through control over CO2 and complete control; in all these cases, the index is above 50%.
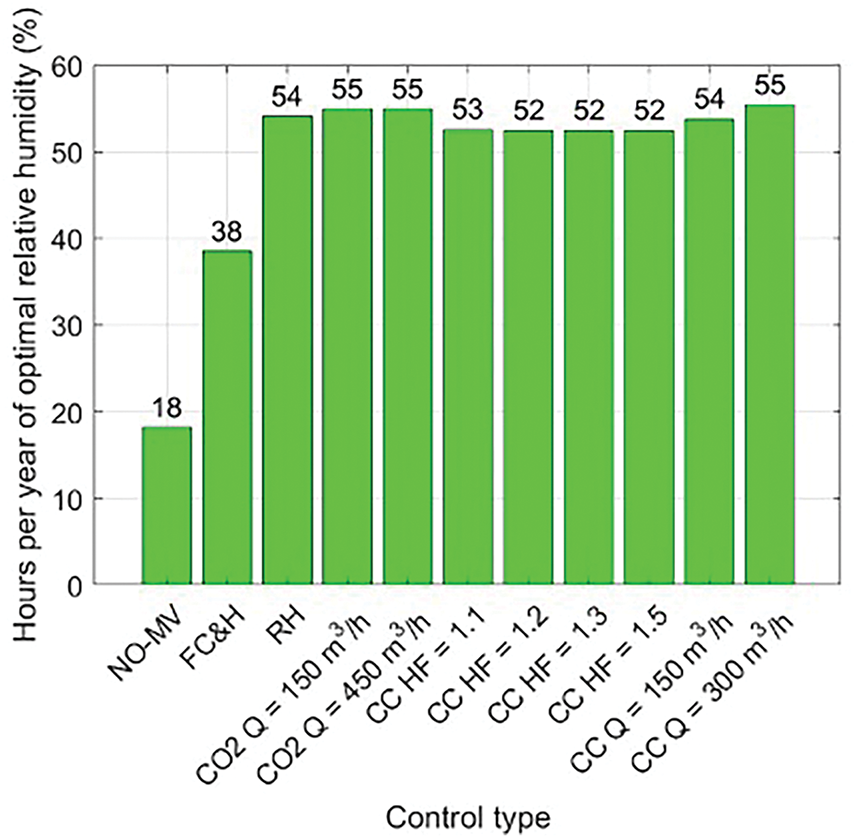
Figure 8: Percentage of optimal relative humidity hours within Classroom A under various configurations
Finally, Fig. 9 displays the graph showing the cooling and heating demand for each configuration. The most favorable situation occurs when only free heating and free cooling are utilized; however, this configuration does not ensure an optimal environmental comfort level. Fig. 9a,b shares the same scale on the vertical axis to facilitate a direct comparison between heating and cooling energy demands.
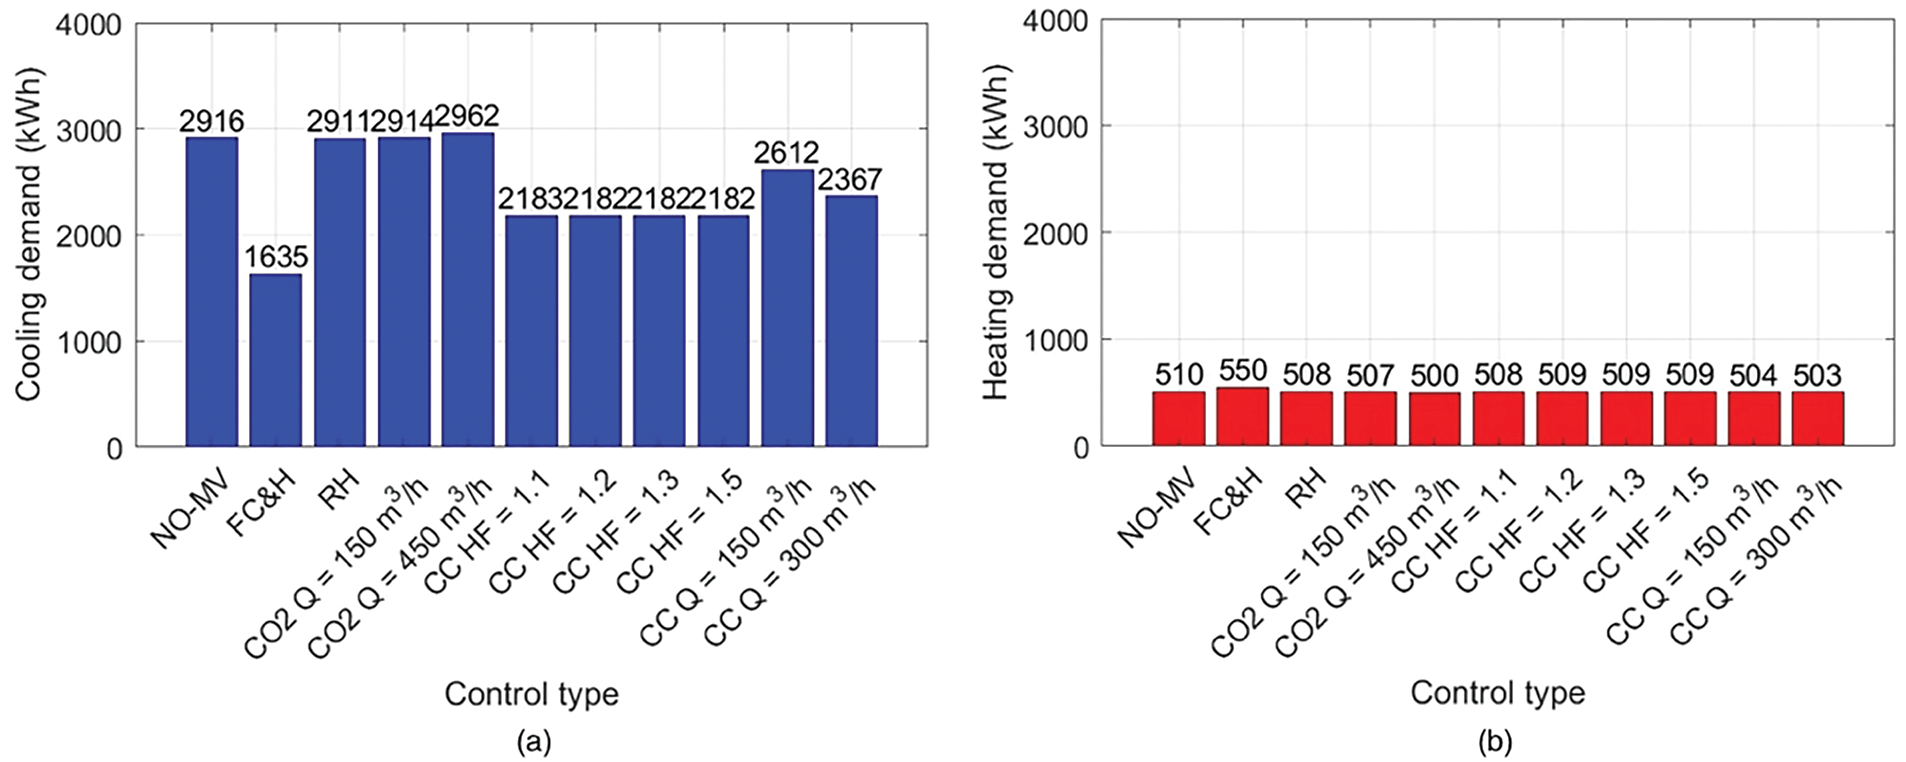
Figure 9: Cooling (a) and heating (b) demand for Classroom A
In the case of full control with a ventilation flow rate of 450 m3 h−1, regardless of the humidity factor, the energy demand decreases. This is due to the increased use of the heat recovery system, leading to significant energy savings. Indeed, if the ventilation flow used in free cooling and free heating decreases, the advantage obtained from this strategy diminishes, necessitating greater thermal power to reach the ideal temperature within the environment. Regardless of the flow rate, it is clear that this strategy results in energy savings in each configuration that incorporates it.
3.3 Results of Energy Simulations for Classroom B
In the case of Classroom B, however, since there is already an air ventilation system with control over internal carbon dioxide levels, the focus is on evaluating the potential benefits of using a mechanical ventilation system that controls CO2, relative humidity, and considers the use of free cooling and free heating when possible, highlighting the differences from the existing system. We will not assess individually the effects of potential control over relative humidity or the use of free heating and free cooling because, with an existing CO2 control system, the goal is to find a solution that improves the current situation. Additionally, since the classroom lacks windows, controlling CO2 remains crucial to ensure the exchange of indoor air in case of excessive values and discomfort felt by occupants.
Fig. 10 shows the average CO2 concentration in the various analyzed situations. As in the previous case, the worst condition is obviously the one without any system. In the other cases, the concentration decreases as the flow rate increases: in particular, it can be noted that the average concentration is below 900 ppm in all cases, and implementing complete control improves air quality because the exchange is carried out not only due to high pollutant levels but also in relation to relative humidity and free heating and free cooling.
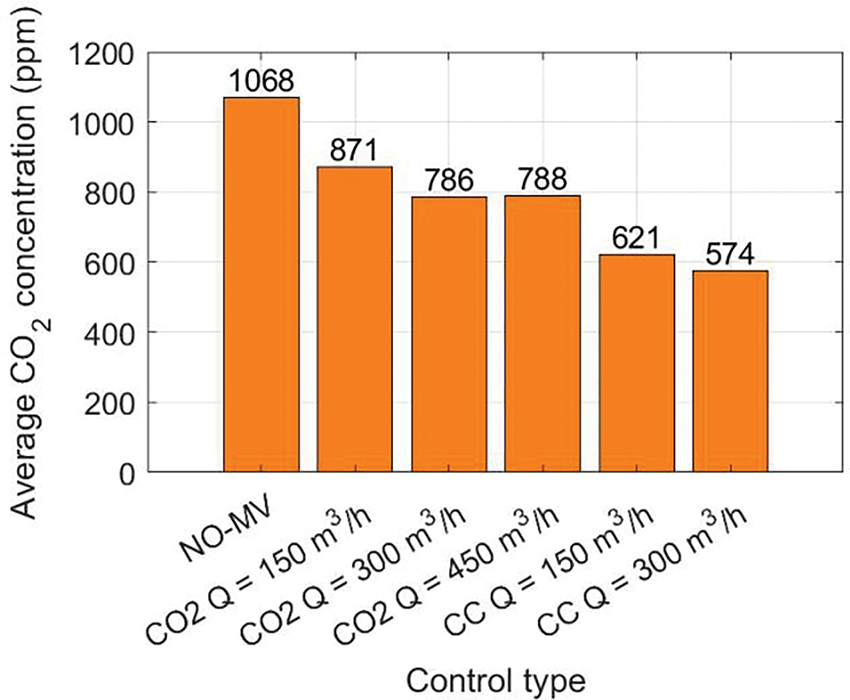
Figure 10: Average CO2 concentration in various configurations for Classroom B
In Fig. 11a,b, the graphs show the daily trend of carbon dioxide concentration inside the classroom. In the first case (a), three distinct curves are observed for three different ventilation flow rates. The curve corresponding to a flow rate of 150 m3 h−1 exhibits constant segments, indicating that the air exchange maintains a concentration close to the threshold value during the period when the classroom is occupied. When the flow rate is increased to 300 m3 h−1, the system activates upon reaching the maximum limit, after which the concentration decreases.
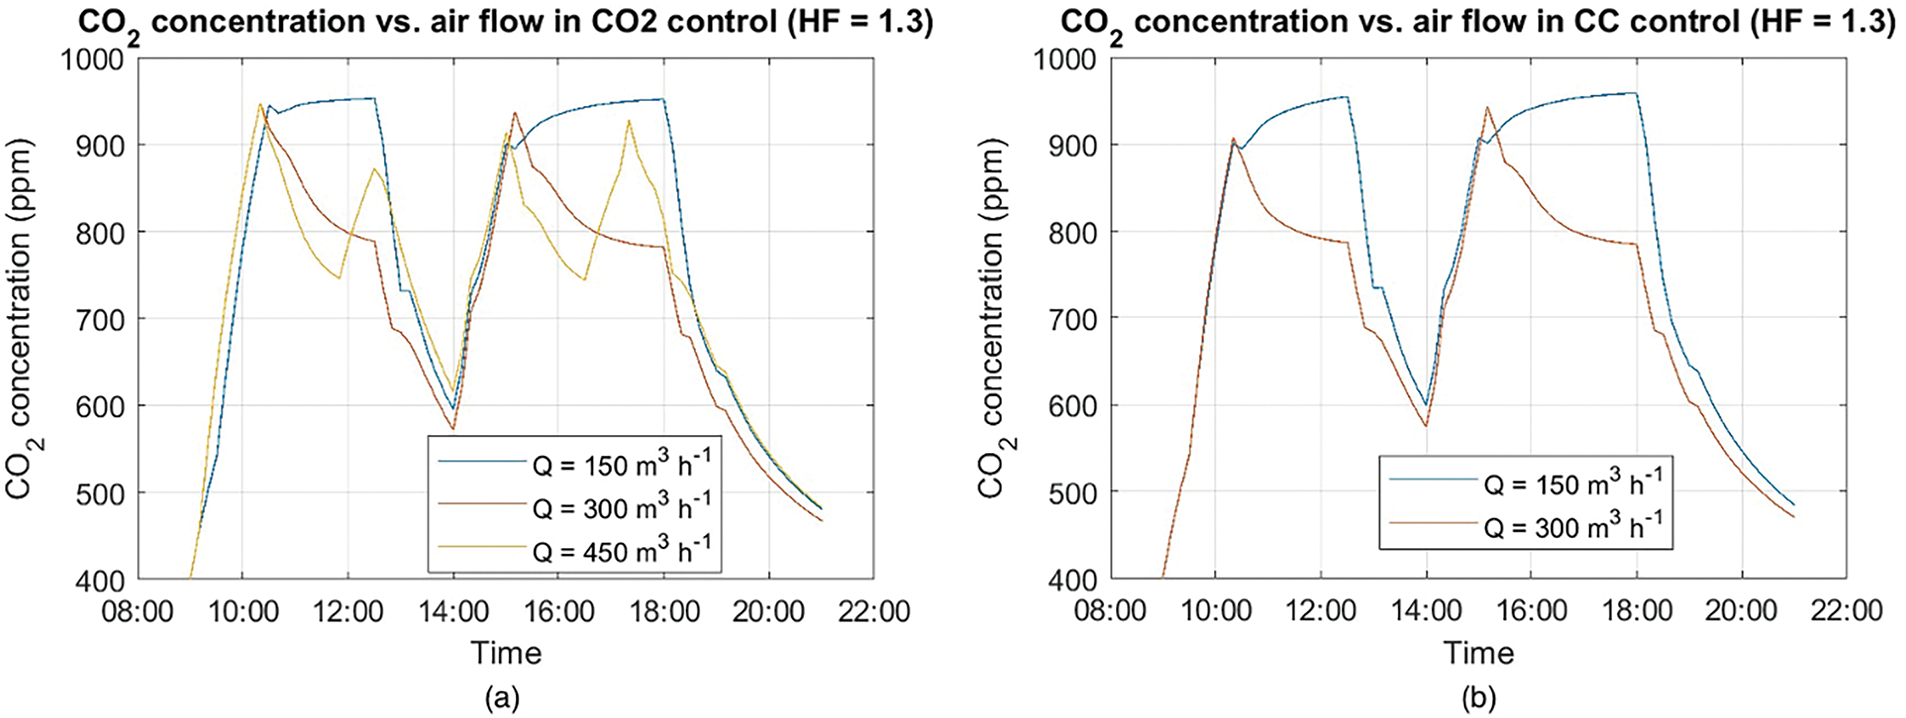
Figure 11: Daily CO2 concentration inside Classroom B with CO2 control (a) and complete control (b)
With a ventilation flow rate of 450 m3 h−1, two peaks occur during each of the two periods when the classroom is occupied. The high flow rate allows for rapid dilution of pollutants, reaching a concentration of 750 ppm at which point the system turns off, only to reactivate when the threshold is reached again. This situation presents a disadvantage regarding the average CO2 concentration, as during the occupancy period, such as from 9:00 a.m. to 12:30 p.m., the maximum limit is reached twice.
Fig. 11b, on the other hand, shows the graphs related to the case with full control, with a ventilation flow rate of 150 and 300 m3 h−1. The results reflect those obtained with CO2 control.
The graph in Fig. 12 refers to the percentage of hours in which the relative humidity is within the range of 40% to 60%. The case without the system is the most advantageous, while using only CO2 control results in a slight deterioration of the situation. In the case of complete control, the index decreases, which is due to the preference given to free heating and free cooling. Thus, the issue of relative humidity is neglected when it is possible to recover thermal energy from the outside air. In all examined cases, the airflow does not significantly affect this index.
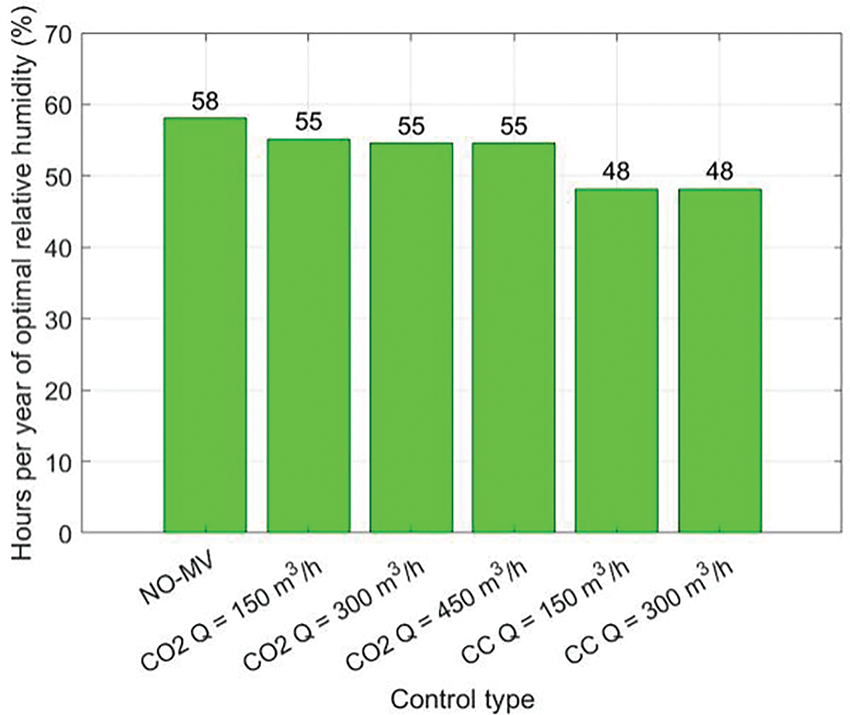
Figure 12: Percentage of optimal relative humidity hours within Classroom B under various configurations
Regarding the energy demand (Fig. 13), the greatest savings are obviously achieved through complete control, regardless of the ventilation rate used. In fact, as the ventilation rate increases, the thermal demand for cooling remains approximately the same, while the thermal demand for heating is slightly higher. This is due to a greater influx of renewal air at a temperature different from that present in the environment. On the other hand, with exclusive CO2 control, the energy demand is higher in all cases: as the ventilation rate increases, the summer demand rises for the same reason as in the previous case. Therefore, considering the advantages and disadvantages of each system configuration, it is clear that, for a lower energy demand, complete control with an air flow rate of 300 m3 h−1 is the most favorable situation to utilize in this classroom. In the case of CO2 control, with an airflow of 450 m3 h−1, a trend change is observed along with a decrease in cooling demand. As shown in Fig. 11, a high airflow allows the CO2 level to exceed the lower limit of the dead zone, meaning the system stays on for a shorter period compared to cases with lower airflow.
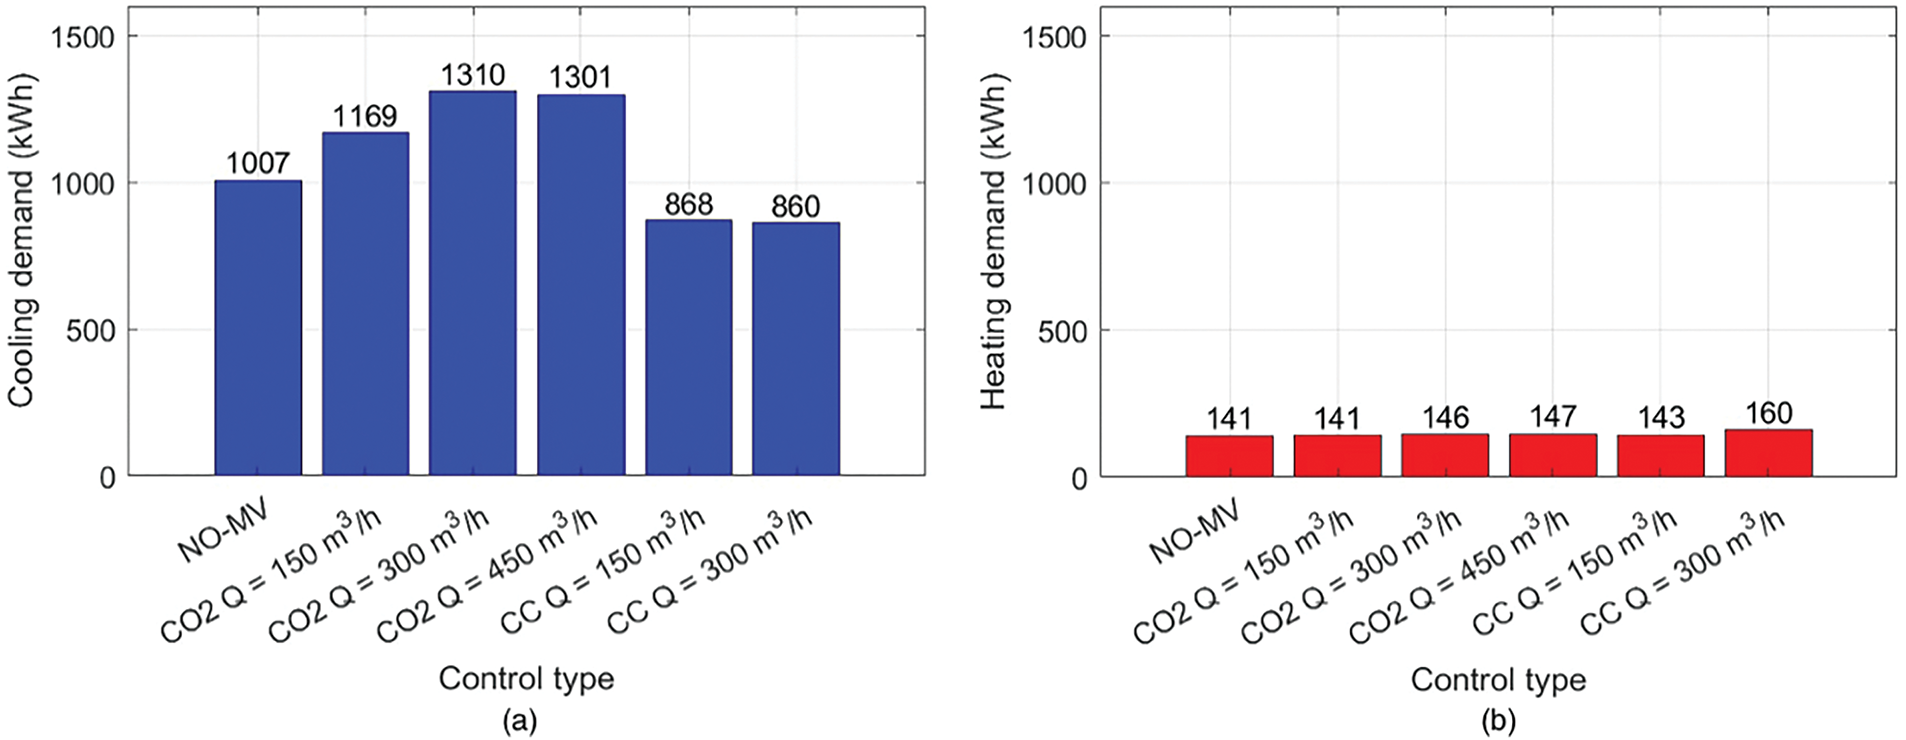
Figure 13: Cooling (a) and heating (b) demand for Classroom B
3.4 Results of Sensitivity Analysis
The analysis of the ventilation rate yielded interesting results, which are shown in Fig. 14. As the infiltration rate increases, a reduction in the summer thermal demand can be observed. This is due to the fact that the introduction of outdoor air helps remove part of the additional thermal load from the environment. In winter, the situation is the opposite, as the outdoor air, having lower temperatures, introduces an additional thermal load to be compensated for, resulting in an increase in the energy required to heat the indoor environment.
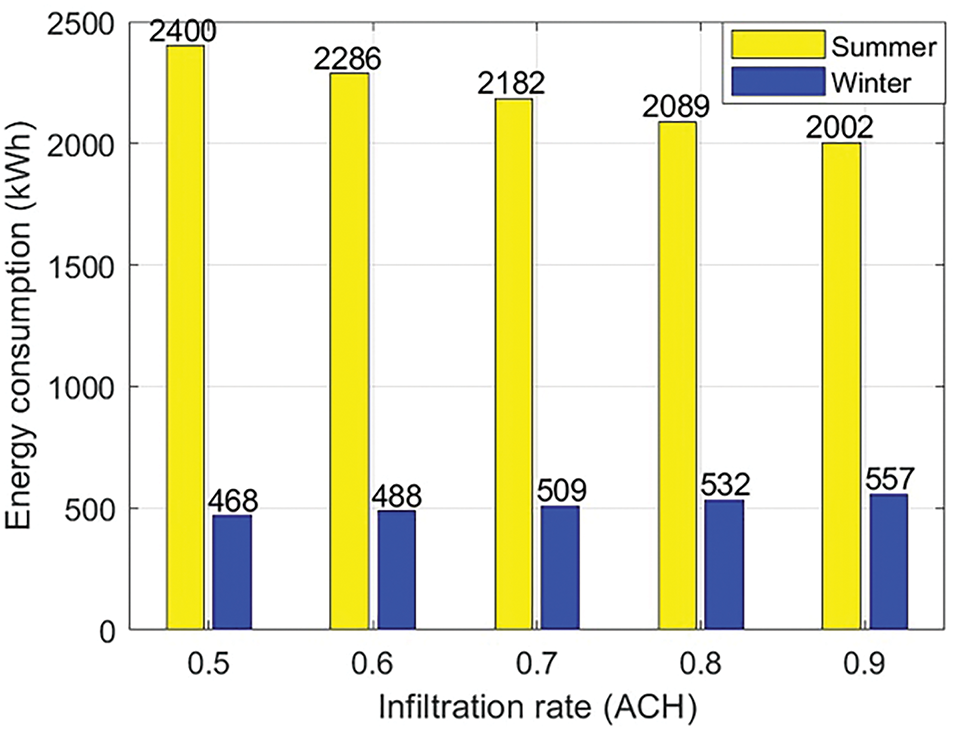
Figure 14: Summer and winter demand as a function of the external air infiltration rate with full control (CC) (HF = 1.3, Air flow rate 450 m3 h−1)
The results related to heating and cooling demand for the different locations are shown in Fig. 15. Specifically, the savings achieved through the use of the system with complete control (CC) compared to the case without mechanical ventilation (NO-MV) are presented. It can be observed that for hot climates, such as that of Barcelona, the summer savings are around 25%, while Berlin, with a lower average annual temperature, allows for greater use of the free cooling strategy, achieving a 50% savings. Regarding the winter period, for the same reasons, Berlin shows a 10% increase in energy consumption for heating. This is due to the fact that the ventilation requirement introduces air at a lower temperature into the environment. For Barcelona, the consumption is quite similar, while Palermo, due to its milder temperature, allows for more frequent use of free heating, ensuring a winter savings of nearly 50%.
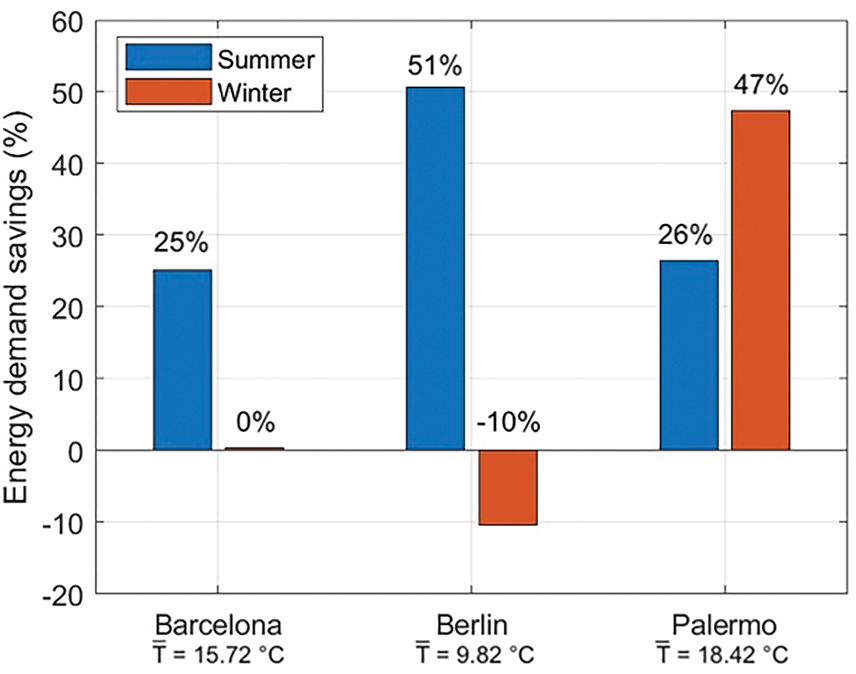
Figure 15: Energy savings of the CC (HF = 1.3, Air flow rate 450 m3 h−1) compared to the NO-MV case for the locations of Barcelona, Berlin, and Palermo
This study highlights the necessity of employing a properly designed controlled mechanical ventilation system to ensure psychophysical well-being and air quality in enclosed spaces, particularly in educational settings.
For building types where occupants remain for many hours a day, it is essential to achieve adequate air exchange to keep CO2 concentrations below threshold values. Since these spaces host people engaged in intellectual activities, poor air quality may compromise performance, even without noticeable discomfort.
On-site measurement campaigns revealed that external openings in Classroom A are insufficient to ensure complete removal of pollutants. In contrast, Classroom B, equipped with a CO2 sensor-based system, allows educational activities to proceed without issue.
Simulations conducted using DesignBuilder confirmed the effectiveness of the proposed solutions. In Classroom A, the CO2 index indicates that, without a ventilation system, pollution levels far exceed regulatory limits. A dedicated system containing pollutant levels and maintaining temperature within an optimal range proved essential. Complete control with a ventilation flow rate of at least 450 m3 h−1 represented the best scenario for indoor pollution mitigation. Additionally, energy recovery from expelled air in the complete control configuration reduced summer thermal demand by approximately 25% compared to the scenario without ventilation. The relative humidity index remained above 50% across configurations, maintaining levels between 40% and 60% for half of the hours when the classroom was occupied.
Classroom B, with a lower occupant density, demonstrated better performance compared to Classroom A. Without a ventilation system, average CO2 concentrations were more favorable in Classroom B. With a ventilation flow of 150 m3 h−1, both complete control and specific CO2 control maintained adequate pollution levels. However, relative humidity control deteriorated when additional controls, such as free cooling and heating, were applied. This was attributed to the control hierarchy, where free cooling/heating and CO2 control were prioritized over relative humidity control. Consequently, specific CO2 control increased energy demand compared to the scenario without a ventilation system. The energy-saving strategy involving free heating and cooling achieved optimal pollutant levels while reducing cooling energy needs by up to 34% compared to CO2 control alone at the same flow rate.
Overall, Classroom B outperformed Classroom A due to several factors:
• Lower occupant density resulted in reduced CO2 levels.
• Lower energy demand due to its underground location, unlike Classroom A, which is exposed to external factors through windows.
• Relative humidity levels showed no significant differences when a system was in place.
A limitation identified in this study was the relative humidity control. Hygrometric well-being in classrooms was ensured for only about 50% of occupied hours. This issue arises from the hierarchy of the control system, which prioritizes free heating/cooling and CO2 control over relative humidity control. Even if the relative humidity is optimal, incoming air with inappropriate moisture content could worsen internal conditions. Addressing this limitation, an enthalpy heat exchanger could replace the sensible heat exchanger in simulations to achieve a better internal humidity balance and enhance overall comfort. This limitation provides valuable insight for future research to increase system complexity and performance.
The sensitivity analysis of external factors, including infiltration, showed that the system performs effectively across different locations, achieving significant energy savings despite climatic differences. As the infiltration rate increased, summer thermal demand decreased, while winter energy consumption for heating rose due to colder outdoor air. In warmer climates like Barcelona, summer savings reached around 25%, whereas in Berlin, savings due to extensive use of free cooling reached up to 50%. In Palermo, winter savings of nearly 50% were observed due to more frequent use of free heating, despite a slight increase in heating demand during Berlin’s winter.
The primary objective of this work was to raise awareness about the necessity of mechanical ventilation in enclosed spaces for prolonged occupancy. While the COVID-19 pandemic renewed attention to this issue, a lack of full awareness persists regarding the benefits of ventilation systems. Authorities should provide incentives to encourage the implementation of these essential systems in educational environments.
The results, while specific to the studied scenario, demonstrate the potential for adapting the proposed system to other contexts. The ventilation control system, calibrated for the studied classrooms, can be adjusted for various climatic conditions and building types. By modifying parameters such as ventilation rates (Q) and humidity factors (HF), the system can ensure adequate air quality and energy efficiency across different operational scenarios. For instance, integrating heat recovery strategies in colder climates can minimize heating demands, whereas stricter humidity control in hot and humid regions can improve indoor comfort. The innovative integration of free heating and cooling strategies into the ventilation control process offers a sustainable, energy-efficient solution that maintains optimal indoor air quality. The modular nature of the methodology ensures flexibility for buildings with varying occupancy levels and pollutant loads, extending its applicability beyond the studied case.
Acknowledgement: The authors would like to thank the Tech4You Project for its support in enabling this research.
Funding Statement: This research was conducted as part of the Tech4You Project “Technologies for climate change adaptation and quality of life improvement”, n. ECS0000009, CUP H23C22000370006, Italian PNRR, Mission 4, Component 2, Investment 1.5 funded by the European Union-NextGenerationEU.
Author Contributions: Giovanni Miracco contributed to literature review, writing sections of the manuscript, software development, data analysis and finalizing the manuscript for submission. Francesco Nicoletti contributed to the conceptualization of the study, methodology design, software development, data analysis, and interpretation of results. Vittorio Ferraro contributed to the conceptualization of the study, interpretation of results and validation of results. Dimitrios Kaliakatsos contributed to the conceptualization of the study, supervised the research, providing guidance and mentorship to researchers and ensuring the overall quality of the work. All authors reviewed the results and approved the final version of the manuscript.
Availability of Data and Materials: The data that support the findings of this study are available from the corresponding author upon reasonable request.
Ethics Approval: This study focused on improving indoor air quality and energy efficiency without involving human participants. Data on CO2 concentration, temperature, and humidity were collected following ethical environmental research guidelines. The methods used were aligned with sustainability standards, promoting both occupant well-being and environmental responsibility. No personal data were involved in the study.
Conflicts of Interest: The authors declare no conflicts of interest to report regarding the present study.
References
1. Kajjoba D, Kasedde H, Kirabira JB, Wesonga R, Mugwanya R, Lwanyaga JD, et al. Impact of natural ventilation and outdoor environment on indoor air quality and occupant health in low-income tropical housing. Energy Rep. 2024;12(3):4184–94. doi:10.1016/j.egyr.2024.10.004. [Google Scholar] [CrossRef]
2. Apte K, Salvi S. Household air pollution and its effects on health. F1000Research. 2016;5:2593. doi:10.12688/f1000research. [Google Scholar] [CrossRef]
3. Jarrahi A, Aflaki A, Khakpour M, Esfandiari M. Enhancing indoor air quality: harnessing architectural elements, natural ventilation and passive design strategies for effective pollution reduction—a comprehensive review. Sci Total Environ. 2024;954(4):176631. doi:10.1016/j.scitotenv.2024.176631. [Google Scholar] [PubMed] [CrossRef]
4. Vilcins D, Christofferson RC, Yoon JH, Nazli SN, Sly PD, Cormier SA, et al. Updates in air pollution: current research and future challenges. Ann Glob Health. 2024;90(1):9. doi:10.5334/aogh.4363. [Google Scholar] [PubMed] [CrossRef]
5. Tognon G, Marigo M, De Carli M, Zarrella A. Mechanical, natural and hybrid ventilation systems in different building types: energy and indoor air quality analysis. J Build Eng. 2023;76:107060. doi:10.1016/j.jobe.2023.107060. [Google Scholar] [CrossRef]
6. Mannan M, Al-Ghamdi SG. Indoor air quality in buildings: a comprehensive review on the factors influencing air pollution in residential and commercial structure. Int J Environ Res Public Health. 2021;18(6):3276. doi:10.3390/ijerph18063276. [Google Scholar] [PubMed] [CrossRef]
7. Liang R, Wang PH. Enhancing energy efficiency in buildings, optimization method and building management systems application for lower CO2 emissions. Energy. 2024;313:134054. doi:10.1016/j.energy.2024.134054. [Google Scholar] [CrossRef]
8. Bruno R, Cristaudo A. Theoretical analysis of a novel rock wall to limit heating demands in historical buildings. Energies. 2024;17(21):5465. doi:10.3390/en17215465. [Google Scholar] [CrossRef]
9. Ma Z, Cui S, Chen J. Demand response through ventilation and latent load adjustment for commercial buildings in humid climate zones. Appl Energy. 2024;373(9):123940. doi:10.1016/j.apenergy.2024.123940. [Google Scholar] [CrossRef]
10. Perrella S, Bruno R, Bevilacqua P, Cirone D, Arcuri N. Energy evaluations of a new plant configuration for solar-assisted heat pumps in cold climates. Sustainability. 2023;15(2):1663. doi:10.3390/su15021663. [Google Scholar] [CrossRef]
11. López Plazas F, Sáenz de Tejada C. Natural ventilation to improve indoor air quality (IAQ) in existing homes: the development of health-based and context-specific user guidelines. Energy Build. 2024;314(1):114248. doi:10.1016/j.enbuild.2024.114248. [Google Scholar] [CrossRef]
12. Sundell J. On the history of indoor air quality and health. Indoor Air. 2004;14(Suppl 7):51–8. doi:10.1111/j.1600-0668.2004.00273.x. [Google Scholar] [PubMed] [CrossRef]
13. Pan CY, Weng KT, Hsu HC. Air change per hour improvement for positive and negative pressure mechanical ventilation facilities systems. J Build Eng. 2024;83(2):108414. doi:10.1016/j.jobe.2023.108414. [Google Scholar] [CrossRef]
14. Liu X, Wang H, Li Z, Zhao J, Li C, Xie D. Effectiveness of natural ventilation through single-sided window opening in air-conditioning rooms. Energy Build. 2024;314:114260. doi:10.1016/j.enbuild.2024.114260. [Google Scholar] [CrossRef]
15. Chiesa G, Vigliotti M. Comparing mechanical ventilation control strategies for indoor air quality: monitoring and simulation results of a school building in northern Italy. Energy Build. 2024;322(41):114665. doi:10.1016/j.enbuild.2024.114665. [Google Scholar] [CrossRef]
16. Zhang S, Ai Z, Lin Z. Novel demand-controlled optimization of constant-air-volume mechanical ventilation for indoor air quality, durability and energy saving. Appl Energy. 2021;293(2):116954. doi:10.1016/j.apenergy.2021.116954. [Google Scholar] [CrossRef]
17. Maiques M, Tarragona J, Gangolells M, Casals M. Energy implications of meeting indoor air quality and thermal comfort standards in Mediterranean schools using natural and mechanical ventilation strategies. Energy Build. 2025;328(1):115076. doi:10.1016/j.enbuild.2024.115076. [Google Scholar] [CrossRef]
18. Rashad Y, Azzam HM, Karram M. Mixed-mode ventilation system as an effective aspect for improving energy efficiency in office spaces in Egypt. Alex Eng J. 2024;102(4):223–39. doi:10.1016/j.aej.2024.05.084. [Google Scholar] [CrossRef]
19. De Jonge K, Ghijsels J, Laverge J. Energy savings and exposure to VOCs of different household sizes for three residential smart ventilation systems with heat recovery. Energy Build. 2023;290(3–4):113091. doi:10.1016/j.enbuild.2023.113091. [Google Scholar] [CrossRef]
20. Khaleel AJ, Ahmed AQ, Dakkama HJ, Al-Shohani WAM. Improvement of energy saving and indoor air quality by using a spot mixing ventilation (SMV) system in a classroom. J Eng Res. 2024;12(3):523–38. doi:10.1016/j.jer.2023.100147. [Google Scholar] [CrossRef]
21. Schibuola L, Scarpa M, Tambani C. Natural ventilation level assessment in a school building by CO2 concentration measures. Energy Proc. 2016;101(6):257–64. doi:10.1016/j.egypro.2016.11.033. [Google Scholar] [CrossRef]
22. Wargocki P, Ali Porras-Salazar J, Contreras-Espinoza S, Bahnfleth W. The relationships between classroom air quality and children’s performance in school. Build Environ. 2020;173:106749. doi:10.1016/j.buildenv.2020.106749. [Google Scholar] [CrossRef]
23. Seppänen O, Fisk WJ, Lei-Gomez QH. Effect of temperature on task performance in office environment. In: Proceeding of the 5th International Conference on Cold Climate Heating, Ventilating and Air Conditioning; 2006; Moscow, Russia. [Google Scholar]
24. Sha H, Zhang X, Qi D. Optimal control of high-rise building mechanical ventilation system for achieving low risk of COVID-19 transmission and ventilative cooling. Sustain Cities Soc. 2021;74(6):103256. doi:10.1016/j.scs.2021.103256. [Google Scholar] [PubMed] [CrossRef]
25. Huynh HN, Ditto JC, Yu J, Link MF, Poppendieck D, Farmer DK, et al. VOC emission rates from an indoor surface using a flux chamber and PTR-MS. Atmos Environ. 2024;338(1):120817. doi:10.1016/j.atmosenv.2024.120817. [Google Scholar] [CrossRef]
26. Franco A, Leccese F. Measurement of CO2 concentration for occupancy estimation in educational buildings with energy efficiency purposes. J Build Eng. 2020;32(129):101714. doi:10.1016/j.jobe.2020.101714. [Google Scholar] [CrossRef]
27. Salthammer T, Mentese S, Marutzky R. Formaldehyde in the indoor environment. Chem Rev. 2010;110(4):2536–72. doi:10.1021/cr800399g. [Google Scholar] [PubMed] [CrossRef]
28. Mora D, Carpino C, De Simone M. Behavioral and physical factors influencing energy building performances in Mediterranean climate. Energy Proc. 2015;78(3):603–8. doi:10.1016/j.egypro.2015.11.033. [Google Scholar] [CrossRef]
29. Yang J, Santamouris M, Lee SE. Review of occupancy sensing systems and occupancy modeling methodologies for the application in institutional buildings. Energy Build. 2016;121(4):344–9. doi:10.1016/j.enbuild.2015.12.019. [Google Scholar] [CrossRef]
30. Fisk W, Wargocki P, Zhang X. Do indoor CO2 levels directly affect perceived air quality, health, or work performance? ASHRAE J. 2019;61(9):70–7. [Google Scholar]
31. Persily A, Bahnfleth WP, Kipen H, Lau J, Mandin C, Sekhar C, et al. ASHRAE’s new position document on indoor carbon dioxide. ASHRAE J. 2022;64(5):50–2. [Google Scholar]
32. ASHRAE Standard 62.1-2016. Ventilation and acceptable indoor air quality. [cited 2024 Dec 20]. Available from: https://www.ashrae.org/File%20Library/Technical%20Resources/Standards%20and%20Guidelines/Standards%20Addenda/62.1-2016/62_1_2016_s_20190726.pdf. [Google Scholar]
33. Nehr S, Baus L, Çınar H, Elsen I, Frauenrath T. Indoor environmental quality assessment in passively ventilated classrooms in Germany and estimation of ventilation energy losses. J Build Eng. 2024;97:110937. doi:10.1016/j.jobe.2024.110937. [Google Scholar] [CrossRef]
34. Kaczmarczyk J, Melikov A, Fanger PO. Human response to personalized ventilation and mixing ventilation. Indoor Air. 2004;14(Suppl 8):17–29. doi:10.1111/j.1600-0668.2004.00300.x. [Google Scholar] [PubMed] [CrossRef]
35. Belmonte JF, Barbosa R, Almeida MG. CO2 concentrations in a multifamily building in Porto, Portugal: occupants’ exposure and differential performance of mechanical ventilation control strategies. J Build Eng. 2019;23:114–26. doi:10.1016/j.jobe.2019.01.008. [Google Scholar] [CrossRef]
36. Arcuri N, Bruno R, Bevilacqua P. Influence of the optical and geometrical properties of indoor environments for the thermal performances of chilled ceilings. Energy Build. 2015;88:229–37. doi:10.1016/j.enbuild.2014.12.009. [Google Scholar] [CrossRef]
37. Hesaraki A, Myhren JA, Holmberg S. Influence of different ventilation levels on indoor air quality and energy savings: a case study of a single-family house. Sustain Cities Soc. 2015;19:165–72. doi:10.1016/j.scs.2015.08.004. [Google Scholar] [CrossRef]
38. Bruno R, Bevilacqua P, Cirone D, Arcuri N. Thermo-hygrometric comfort analysis in a real public conference room to support a digital-twin targeted to parametric investigations. Build Simulat Appl BSA. 2022;185–92. doi:10.13124/9788860461919. [Google Scholar] [CrossRef]
39. Fan Y, Ito K. Integrated building energy computational fluid dynamics simulation for estimating the energy-saving effect of energy recovery ventilator with CO2 demand-controlled ventilation system in office space. Indoor Built Environ. 2014;23(6):785–803. doi:10.1177/1420326x13494034. [Google Scholar] [CrossRef]
40. Perrella S, Bisegna F, Bevilacqua P, Cirone D, Bruno R. Solar-assisted heat pump with electric and thermal storage: the role of appropriate control strategies for the exploitation of the solar source. Buildings. 2024;14(1):296. doi:10.3390/buildings14010296. [Google Scholar] [CrossRef]
41. Mah D, Tzempelikos A. Real-Time estimation of internal and solar heat gains in buildings using deep learning. Energy Build. 2024;324(1):114864. doi:10.1016/j.enbuild.2024.114864. [Google Scholar] [CrossRef]
42. UNI EN 16798-1. Energy performance of buildings. Ventilation for buildings—part 1: indoor environmental input parameters for design and assessment of energy performance of buildings addressing indoor air quality, thermal environment, lighting and acoustics-Module M1-6. Milan, Italy: Ente Italiano di Normazione; 2019. [Google Scholar]
43. ASHRAE Guideline 14-2014. Measurement of Energy, Demand and Water Savings. Atlanta, GA, USA: American Society of Heating, Refrigerating and Air-Conditioning Engineers; 2014. [Google Scholar]
Cite This Article
 Copyright © 2025 The Author(s). Published by Tech Science Press.
This work is licensed under a Creative Commons Attribution 4.0 International License , which permits unrestricted use, distribution, and reproduction in any medium, provided the original work is properly cited.
 Downloads
 Citation Tools