
 Submit a Paper
 Propose a Special lssue
 Open Access
ARTICLE

Coordinated Service Restoration of Integrated Power and Gas Systems with Renewable Energy Sources
1 College of Electrical Engineering, Zhejiang University, Hangzhou, 310000, China
2 Power Dispatch and Control Center State Grid, Shanxi Electric Power Company, Taiyuan, 030021, China
3 Planning Division of Power Dispatch and Control Center, State Grid Jincheng Power Supply Company, Jincheng, 048000, China
* Corresponding Author: Yuze Ji. Email:
Energy Engineering 2025, 122(3), 1199-1220. https://doi.org/10.32604/ee.2025.061586
Received 28 November 2024; Accepted 13 January 2025; Issue published 07 March 2025
 View Full Text
 Download PDF
Abstract
With the development of integrated power and gas distribution systems (IPGS) incorporating renewable energy sources (RESs), coordinating the restoration processes of the power distribution system (PS) and the gas distribution system (GS) by utilizing the benefits of RESs enhances service restoration. In this context, this paper proposes a coordinated service restoration framework that considers the uncertainty in RESs and the bi-directional restoration interactions between the PS and GS. Additionally, a coordinated service restoration model is developed considering the two systems’ interdependency and the GS’s dynamic characteristics. The objective is to maximize the system resilience index while adhering to operational, dynamic, restoration logic, and interdependency constraints. A method for managing uncertainties in RES output is employed, and convexification techniques are applied to address the nonlinear constraints arising from the physical laws of the IPGS, thereby reducing solution complexity. As a result, the service restoration optimization problem of the IPGS can be formulated as a computationally tractable mixed-integer second-order cone programming problem. The effectiveness and superiority of the proposed framework are demonstrated through numerical simulations conducted on the interdependent IEEE 13-bus PS and 9-node GS. The comparative results show that the proposed framework improves the system resilience index by at least 65.07% compared to traditional methods.Keywords
Nomenclature
| Abbreviations | |
| IPGS | Integrated power and gas distribution system |
| PS | Power distribution system |
| GS | Gas distribution system |
| RESs | Renewable energy sources |
| MGTs | Micro gas-fired turbines |
| EDFs | Electrically driven facilities |
| EDSs | Electrically driven gas sources |
| NEDFs | Non-electrically driven facilities |
| NEDCs | Non-electrically driven compressors |
| NEDSs | Non-electrically driven gas sources |
| DGs | Distributed generators |
| MILP | Mixed-integer linear program |
| MISOCP | Mixed-integer second-order cone program |
| MINLP | Mixed-integer nonlinear program |
| CVaR | Conditional value-at-risk |
| Sets | |
| Set of restoration time step | |
| Set of power loads | |
| Set of gas loads | |
| Set of power distribution lines | |
| Set of buses adjacent to bus i | |
| Set of power buses | |
| Set of buses without the root bus | |
| Set of buses connected to bus i | |
| Set of generators | |
| Set of distributed storage | |
| Set of electric vehicles | |
| Set of gas pipelines | |
| Set of gas nodes | |
| Sets of gas inflowing and outflowing nodes for node j | |
| Set of pipeline intersection nodes | |
| Sets of electrically driven compressors | |
| Sets of non-electrically driven compressors | |
| Sets of electrically driven gas sources | |
| Sets of non-electrically driven gas sources | |
| Set of gas loads unaffected by power outage | |
| Set of gas loads affected by power outage | |
| Set of restoration time step without time step T | |
| Set of micro gas-fired turbines | |
| Parameters | |
| Time interval for each restoration step | |
| Weight factor for power load i | |
| Weight factor for gas load i | |
| Weight coefficient connecting objective terms | |
| Restoration status of power load i is 1 at t | |
| Restoration status of gas load i is 1 at t | |
| rb | Root bus of PDS |
| Impedance of power line ij, | |
| A large number positive integer | |
| Amplitude of the limited current flowing through power line ij | |
| Lower bound of the voltage amplitude of bus i | |
| Upper bound of the voltage amplitude of bus i | |
| Upper bound of the active of generator i | |
| Upper bound of the reactive of the generator i | |
| Max charging power of the storage device i | |
| Max discharging power of the storage device i | |
| Lower bound of the state of charge that satisfies normal operation of storage device i | |
| Upper bound of the state of charge that satisfies normal operation of storage device i | |
| Initial state of charge of storage device | |
| Conversion factor of storage device | |
| Fanning friction coefficient | |
| Diameter of the pipeline | |
| Cross-sectional area of the pipeline | |
| The net body force per unit mass | |
| Pipe inclination | |
| Speed of sound | |
| Flow velocity of the natural gas | |
| Setting values of outlet gas pressure of NEDS i | |
| Setting values of outlet gas pressure of NEDC ij | |
| Setting values of outlet gas pressure of EDS i | |
| Setting values of outlet gas pressure of EDC i | |
| Lower bound of the gas supply capability of EDS i | |
| Upper bound of the gas supply capability of EDS i | |
| Lower bound of the gas supply capability of NEDS i | |
| Upper bound of the gas supply capability of NEDS i | |
| Mass flow rate of gas load i | |
| Minimum gas pressure requirement of gas load i | |
| Initial energy value of t generator i | |
| Length of the pipeline ij | |
| Probability density function of | |
| Cumulative distribution function | |
| Confidence level | |
| Threshold value | |
| Sampling value of the gth of i at t | |
| Y | Total number of selected time points in a time interval |
| G | Sampling number at each time point |
| N | Sampling number, N = G*T |
| auxiliary variable, | |
| Variables | |
| Binary variable of restoration status of power load i at t | |
| Binary variable of restoration status of gas load i at t | |
| Binary variable of restoration status of power line ij at t | |
| Binary variable of parent relationship between bus i and | |
| Binary variable of restoration status of EDS i at t | |
| Binary variable of restoration status of EDC ij at t | |
| Binary variable of restoration status of gas load supplying MGT i at t | |
| Binary variable of restoration status of electric load associated with the EDC ij at t | |
| Binary variable of restoration status of electric load associated with the EDs i at t | |
| System active power loss at | |
| Complex power flowing through lines ij at t | |
| Complex power flowing into bus i at t | |
| Current of power line ij at t, | |
| Voltage of bus i at t, | |
| Output complex power of generator i at t, | |
| Active power output of generator i at t | |
| Reactive power output of generator i at t | |
| Energy limit of generator | |
| Natural gas density | |
| Natural gas flow velocity | |
| Time | |
| Spatial distance of pipelines | |
| Mass flow rate of natural gas flowing into the pipeline ij at t | |
| Mass flow rate of natural gas flowing out of the pipeline ij at t | |
| Mass flow rate of the EDSs i at t | |
| Mass flow rate of the NEDSs i at t | |
| Mass flow rate of gas load i at t | |
| Gas pressure of node i at t | |
| Gas pressure of node connected to NEDS i at t | |
| Gas pressure of node connected to EDS i at t | |
| Average gas pressure for two successive time steps of the node of gas load i at t | |
| Real power output of RES i at t | |
| Predicated value of RES i at t | |
| Prediction error of RES i at t | |
The rapid development of integrated energy infrastructures has led to increasing interdependencies between power systems (PS) and gas systems (GS), coupled through micro gas-fired turbines (MGTs) and electrically driven facilities (EDFs) such as electrically driven compressors (EDCs) and electrically driven gas sources (EDSs) [1]. During extreme events, such as natural disasters, these interdependencies can trigger cascading power and gas outages, resulting in substantial socioeconomic losses [2]. Consequently, enhancing the integrated power-gas system’s (IPGS) resilience has become an urgent priority [3]. Developing effective restoration strategies is key to improving system resilience [4]. Meanwhile, the penetration of renewable energy sources (RESs) in power systems has reached unprecedented levels. Leveraging RESs to formulate system restoration strategies presents a promising opportunity. However, designing restoration strategies that adequately address the inherent interdependencies between GS and PS while fully utilizing RESs remains a significant challenge.
The restoration processes of PS and GS are bi-directionally coupled. Power outages caused by extreme events may last several to more than ten hours. During such outages, EDFs cease operation, severely impacting gas supply and pressure. Notably, node pressure is critical for maintaining gas loads; for example, micro gas-fired turbines (MGTs) cannot start or operate if gas pressure falls below a specific threshold [5]. Conversely, power load restoration relies on MGT generation. Moreover, EDFs cannot be restarted unless the power loads that provide power supply to EDFs have been restored. Therefore, these mutual dependencies highlight the need to fully account for the bi-directional coupling between PS and GS when developing service restoration schemes.
Additionally, GS has a slower response than PS due to the gas flow dynamics, which significantly affects the sequencing of restoration steps. Hence, it is essential to incorporate the dynamic response of GS into restoration planning. Furthermore, RESs introduce additional challenges due to their uncontrollable and weather-dependent nature, increasing the risks associated with system restoration in vulnerable states. Coordinating the restoration of MGTs and EDFs while accounting for GS dynamics and the uncertainties in RESs represents a critical and urgent challenge.
Existing studies mainly focus on utilizing local generation resources to restore critical loads in the distribution system [6–8] and microgrids [9,10]. The service restoration approach in [6] concentrated on determining the optimal restoration strategy coordinating multiple sources to serve critical loads after blackouts. A service restoration model for unbalanced distribution systems and inverter-dominated microgrids is proposed in [8], in which frequency dynamics constraints are developed to optimize the amount of load restoration and guarantee the dynamic performance of system frequency response during the restoration process. Reference [10] proposed a decentralized framework for resilience-oriented coordination of networked microgrids and a novel multi-agent reinforcement learning method to restore critical loads using distributed energy resources. To take full advantage of local restoration resources, References [11,12] used mobile emergency sources to restore critical loads. Moreover, Reference [13] discussed the dominant ways to utilize RESs for service restoration.
Due to increasing couplings between PS and GS, some researchers have focused on the resilience enhancement of IPGS after disasters. Reference [14] proposed a planning method for co-expansion and design of IPGS for resilience enhancement. An integrated model for resilience evaluation of IPGS is proposed in [15] under extreme weather events, focusing on windstorms. Reference [16] introduced a risk-constrained strategic resilience enhancement method for PS and GS through G2P and P2G planning and distributed load restoration against floods. References [17,18] focused on post-disaster optimal combined repair crew dispatch problems. A minimax-regret robust resilience-constrained unit commitment strategy is proposed in [19]. Reference [20] proposed a robust network hardening strategy for enhancing the resilience of IPGS against natural disasters.
As for load restoration to enhance the resilience of IPGS, researchers have made valuable efforts. In [21,22], a load restoration strategy is proposed based on power and gas conversion to restore important loads as much as possible. Reference [23] proposed a two-stage restoration model using power storage, gas storage, P2G, and other devices considering coupling operation of power and natural gas systems. Reference [24] introduced a decentralized operating paradigm for the real-time coordination of local multi-energy microgrids towards system-wise IPGS load restoration. At the same time, a novel topology-aware multi-task reinforcement learning method with soft modularization is proposed to solve it. A coordinated strategy for regional integrated electricity-natural gas system load restoration and repair schedule is proposed in [25] and transformed into a mixed integer second-order cone programming (MISOCP) model. Reference [26] concentrated on the collaborative load restoration of the IPGS after extreme weather events and formulated the problem as a mixed-integer linear programming (MILP) model. In [27], the load restoration problem is devised as a mixed-integer second-order cone programming model to minimize the total load loss cost of IPGS, considering network recon-figuration and the coupling effect. References [28–30] focused on coordinated load restoration optimization of power-gas integrated energy systems with mobile emergency sources.
However, the above studies do not focus on bi-directional restoration couplings between GS and PS by utilizing RESs. Power load restoration and gas load restoration are mutually constrained for IPGS. Loads restoration strategy without considering the interdependencies of two systems and output uncertainties of RESs may lead to a failed restoration process. In addition, to the best of our knowledge, the existing load restoration strategies of IPGS do not consider the GS dynamic restoration process. Due to the physical characteristics of gas flow, gas load restoration takes a long time, which can influence the restoration sequence significantly.
This research presents a decision-making framework to coordinate the restoration of PS and GS by leveraging local RESs and other sources. Compared to the existing state-of-the-art references, the key contributions of this work are as follows:
1. The influences of bi-directional couplings between PS and GS and the GS’s slow restoration response during the restoration process are analyzed.
2. A partial differential equation-constrained optimization model is formulated to enable the coordinated service restoration of PS and GS, comprehensively accounting for the interdependencies between the two systems and the dynamic restoration process within the GS. The model incorporates operational, restoration, and interdependency constraints governing the coupled power and gas distribution network.
3. The non-convex constraints in the optimization model are transformed into convex ones with accuracy and efficiency reserved. The partial differential equations (PDEs) constraints describing the GS dynamics are significantly transformed into linear algebra constraints using finite difference methods. An uncertainty management method of RES power generation is adopted to model RES output.
The remainder of this paper is organized as follows. Section 2 discusses the problems of the coordinated service restoration process. The coordinated restoration optimization model is formulated in Section 3. Section 4 deals with non-convex constraints and uncertainties in RESs, transforming the original coordinated restoration optimization model into a convex one. Simulation results are presented in Section 5. Finally, Section 6 concludes the paper.
As shown in Fig. 1, PS and GS are interconnected through MGTs, EDCs, and EDSs. Note that there are few non-electrically driven facilities (NEDFs), such as non-electrically driven compressors (NEDCs) and non-electrically driven gas sources (NEDSs), which are independent of electricity, running by gas or gasoline. PS contains various generation resources such as RESs, micro gas-fired turbines (MGTs), and distributed storage.
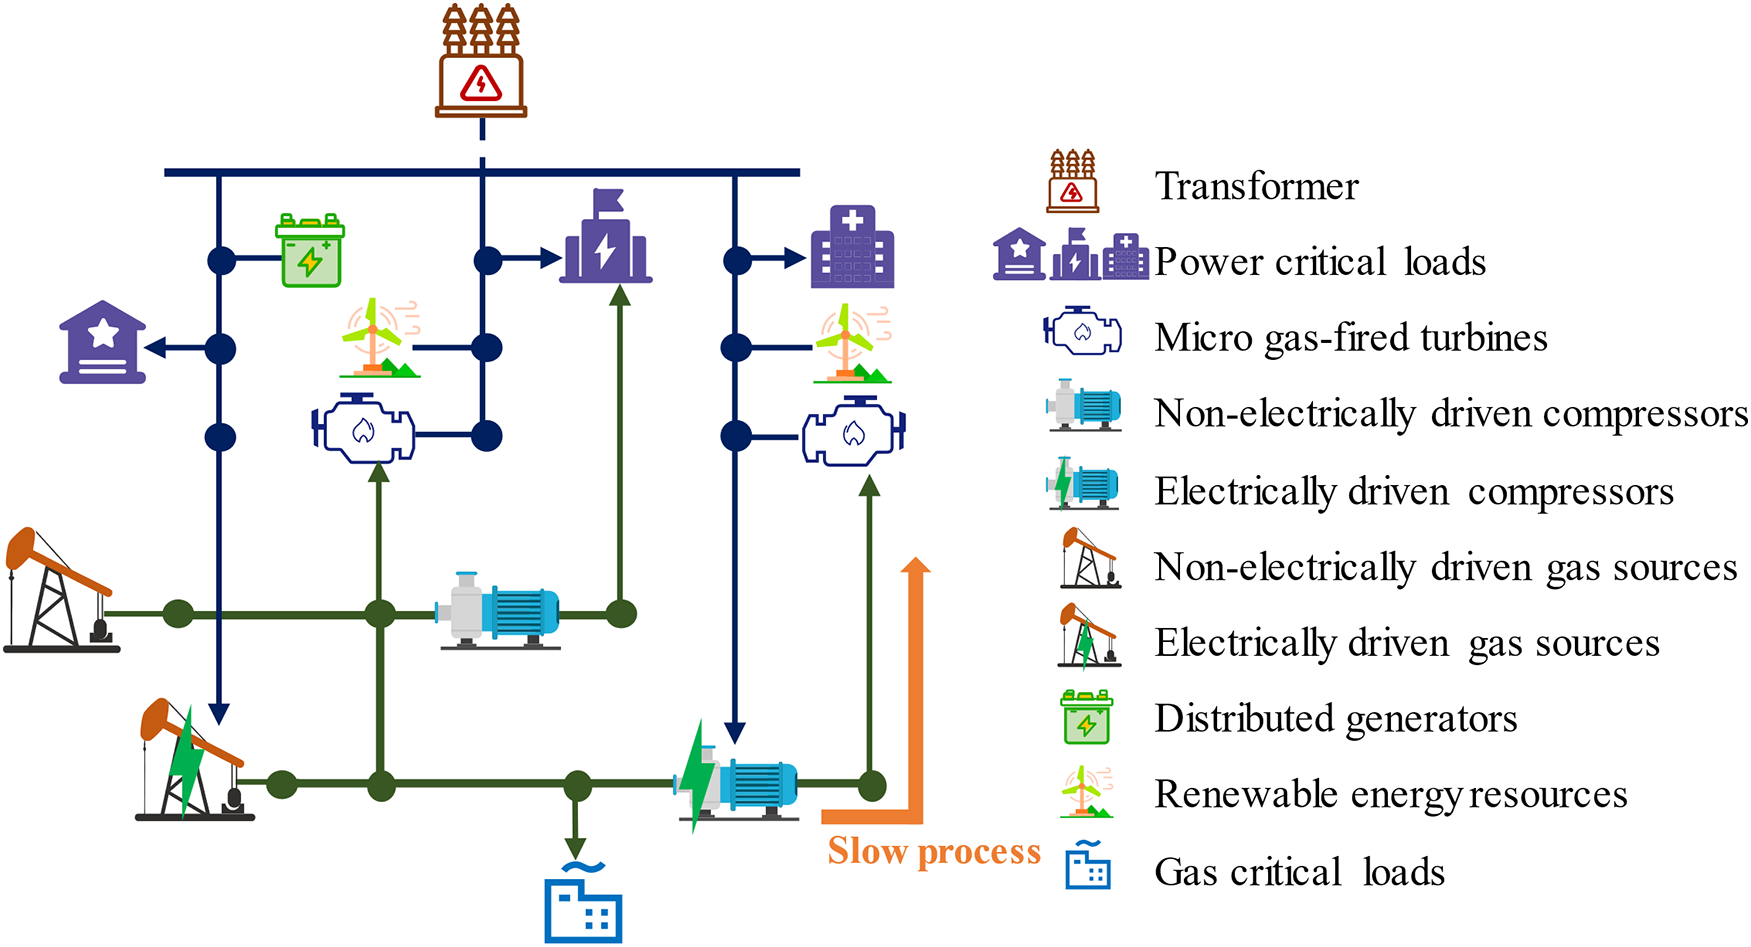
Figure 1: Structure of IPGS
Assuming a large-area blackout occurs after an extreme event, the power transmission system is disconnected from IPGS. PS loses all power loads, and EDSs in GS are shut down without a power supply. GS maintains operation with low gas supply pressure, and partial gas loads such as MGTs gas supplies are shed due to low pressure. With the knowledge of disasters and their impact combined with the transmission system restoration strategy and process, the power outage time of IPGS can be evaluated. To improve the system’s resilience, it is important to form an island PS and coordinate different local restoration resources in two different systems to restore the critical power and gas loads. Thus, this paper mainly focuses on the service restoration problem, considering the interdependencies between the two systems and the restoration dynamics of GS. The black process of forming the island PS is not considered in this paper.
In the service restoration process, there are three problems to be solved.
(1) The interdependencies between PS and GS restoration are inherently bidirectional. The restoration of MGTs and the restart of EDFs are interdependent. If EDFs cannot be restarted as soon as possible, gas loads supplying GFTs cannot be restored quickly, which means the generation of GFTs is significantly limited. For IPGS, generating GFTs is vital for PS restoration and operation. With limited generation of GFTs, only a few power loads can be restored, resulting in a slow restoration process.
(2) Compared to the PS, the GS exhibits a much slower dynamic response (e.g., tens of minutes to hours) due to the large time constant of GS, which can significantly influence the sequencing of restoration steps. Gas flow physics is described mathematically by partial differential equations, leading to complex model construction.
(3) Since the restored power system is typically fragile after a blackout, prioritizing highly reliable power sources is essential. In modern power systems with a high share of renewables, reliable generation from thermal and gas power is commonly limited during restoration. Leveraging renewable energy generation can provide significant benefits for system restoration. However, the variability in renewable generation poses challenges to maintaining power balance in the restored system, which can significantly impact the feasibility and optimality of the restoration strategy.
To address these challenges, it is crucial to develop a coordinated service restoration optimization model that accounts for system interdependencies, generator dynamics, and the management of uncertainties in RESs.
This section describes a coordinated service restoration optimization model for IPGS. The entire restoration process is divided into T time steps. The input data of the model are system data model parameters and initial status of devices. The solution of the model is the restoration strategy of IPGS, including generator output, power loads restoration, restart of EDFs, and gas loads restoration at each time step.
In-line equations/expressions are embedded into the paragraphs of the text. For example,
This paper focuses on rapidly restoring power and gas supplies to meet the demands of affected loads following a blackout. For the PS, the primary objective is to maximize the duration of power and gas supply to loads, weighted by their respective priorities. Additionally, the secondary objective is to minimize the losses in electrical loads during the restoration process. The mathematical formulations of the primary and secondary objectives for the PS are presented in Eqs. (1) and (2), respectively.
For GS, the objective is to maximize the gas supply time of shed loads, which can be expressed as follows:
Thus, the overall objective for the IPGS is defined as the summation of the normalized objectives for the PS and GS, as presented in Eq. (4). The value calculated from Eq. (4) represents the resilience of the IPGS following extreme events, commonly referred to as the resilience index.
where
Eq. (5) denotes that the base of the primary objective of PS is the objective value when all power loads are restored. Eq. (6) denotes that the base of the secondary objective of PS is the system base. Eq. (7) denotes the base of the GS objective value when all gas loads are restored.
PS constraints include topology constraints, operation constraints, and restoration constraints, as follows:
Constraints (8)–(10) are topological constraints, guaranteeing that the topology of restored PS is radial. Constraint (8) indicates parent relationship bus i, bus j, and line ij. Constraints (9) and (10) denote that each bus has a parent bus except the root bus. Bus 1 is assumed to be the root bus in this paper. Constraints (11) and (12) denote the power flow balance for each bus. Constraints (13)–(15) denote Ohm’s law and apparent power equation. Constraints (13) and (14) indicate the voltage relationship between two connected buses. Constraint (15) denotes the definition of apparent power flow, derived by multiplying its conjugate on both sides. Constraint (16) denotes the power loss calculation for the restored PS. Constraint (17) denotes the steady state current limit for each line. Constraint (18) denotes the voltage limits for each bus. Constraint (19) denotes the connectivity of bus i and bus j. If bus i and j are not connected, there is no power flow. Constraint (20) means power output upper and lower bounds for each generator except RESs. Constraints (21) and (22) are battery-based storage devices (e.g., distributed storage, electric vehicles) constraints. Constraint (21) denotes the charging and discharging limits of storage devices. Constraint (22) is a state of charge limits. Constraint (23) is energy limits for all generation resources. For battery-based storage devices, energy stored is limited. Besides, critical infrastructure may be damaged by extreme events. During restoration, gas and diesel cannot be resupplied for MGTs or diesel turbines. Constraint (24) indicates that they will not be powered off once power loads are restored.
The flow of natural gas through pipelines is driven by pressure gradients, which are influenced by factors such as gas composition, temperature, density, and pressure. The one-dimensional fluid dynamics along the pipeline establish relationships between various gas state parameters, including velocity, temperature, density, and pressure. This flow behavior is typically described by three fundamental equations: the momentum equation, the material-balance equation, and the state equation [31].
The material balance equation, Eq. (25), represents the conservation of mass within the gas pipeline. The momentum equation, Eq. (26), comprises five terms: the first three describe the effects of acceleration, convection, and hydrostatics on the natural gas flow. The fourth term accounts for altitude variations along the pipeline, while the fifth term represents the second-order deviatoric stress tensor. Finally, the state equation, Eq. (27), establishes the relationship between the gas’s temperature, density, and pressure.
Based on the physical characteristics of GS, the second term and fourth term can be neglected. Introducing gas velocity base value
Thus, gas flow dynamics are described by PDEs (27)–(29). To incorporate gas dynamic constraints into the optimization model, (27)–(29) are transformed into a series of linear algebra constraints, as shown in (30). The detailed transformation of PDEs will be discussed in Section 4.
Gas dynamic flow and pressure can be obtained by solving (30) with initial and boundary conditions. Initial conditions include the steady state value of GS before restoration. Boundary conditions indicate node gas flow balance, pressure, gas flow, and gas supply boundaries.
Constraint (31) denotes node gas flow balance. Constraints (32)–(35) are compressor-related constraints. Constraint (32) denotes that if EDCs are restarted, the output node pressure of EDCs is sustained at the setting value. Constraint (33) denotes that output node pressure equals input node pressure for EDCs with bypass mode due to power outage. Constraint (34) denotes that the output node pressure of NEDCs is unaffected by power outages. Constraint (35) denotes the gas flow relationship for compressors (including EDCs and NEDCs). Constraints (36)–(40) are gas sources related constraints. Constraint (36) denotes that if EDSs are restarted, the output node pressure of EDSs is sustained at the setting value. Constraint (37) denotes that EDSs cannot control the output node pressure if EDSs are shut down due to a power outage. Constraint (38) denotes that the output node pressure of NEDSs is unaffected by power outage. Constraints (39) and (40) are gas supply upper and lower limits for gas sources. EDSs are not able to supply gas unless being restored. Constraints (41) and (42) denote the gas flow of gas loads. For shedding loads, there is no gas flow unless being restored. Constraints (43) and (44) are gas load restoration constraints. Constraint (43) denotes the minimum pressure requirements for gas loads. Constraint (44) denotes that once gas loads are restored, they will not be powered off again.
3.4 Interdependency Constraints
Interdependency constraints of PS and GS include restoration logic constraints and energy limit constraints for coupling facilities.
Constraints (45) and (46) are constraints of MGTs. Constraint (45) denotes that the gas supply of MGTs can be restored only if corresponding gas loads are restored. Constraint (46) indicates that once the gas supply of MGTs is restored, there is no energy limit for MGTs. Constraints (47)–(50) are constraints of EDFs. Constraints (47) and (48) denote that EDFs can be restarted only if corresponding power loads are restored. Constraints (49) and (50) are restarting constraints; once the EDFs are restored, they will not be powered off again.
3.5 Optimization Model Formulation
To sum up, the optimization model of the coordinated service restoration model for IPGS is formulated as follows:
NLP: max
It is important to note that the nonlinear programming (NLP) model contains non-convex constraints, which pose significant challenges for solving the model. Specifically, constraints (15), (32), (33), (36), and (37) are non-convex, complicating the optimization process. Additionally, constraint (20) incorporates the output of renewable energy sources (RESs), whose inherent uncertainties should be effectively managed.
4.1 Transformation of PDEs Constraints
For PDEs (27)–(29) describing gas flow dynamics, the Wendroff difference technique is adopted to transform these PDEs into linear algebra equations [32], as follows:
Constraints (51)–(53) are concrete expressions of (30), representing the material-balance equation, momentum equation, and gas state equation, respectively. Space and time steps are
To eliminate the numerical oscillation caused by the change in gas pressure boundary condition and finite difference technique, average gas pressure for two successive time steps is calculated [33]. Therefore, constraint (43) is transformed into (54).
4.2 Transformation of Non-Convex Constraints
The branch power flow constraint (15) is a quadratic equality for PS. The convex relaxation technique is used to relax (15) into a second-order cone constraint [34]. Reference [35] shows that this relaxation is exactly the case for radial PDE restoration problems.
For GS, constraints (32), (33) and (36), (37) are both conditional constraints. This paper uses a large positive integer N to transform conditional constraints into linear inequality constraints as follows:
4.3 Uncertainties Management of RESs
To handle the uncertainties in RESs, the conditional value-at-risk (CVaR) values of predicted values are used instead of expected values [36]. The
According to (63), it is not easy to obtain CVaR values due to the complex formula and unavailable
CVaR calculation model (CCM) is summarized as follows:
CCM:
s.t. (71)
CCM is an integer linear program, and the CVaR value of uncertain RES output can be obtained from its objective.
In summary, a mixed-integer second-order cone program (MISOCP) is formulated as follows:
MISOCP: max
s.t. (8)–(14), (16)–(24), (31), (34), (35), (38)–(42), (44)–(59), (70), (71)
The proposed coordinated service restoration model (MISOCP) is implemented with the convex package in Julia based on the test system. The MISOCP model is optimized using the Gurobi solver. The test environment is an Intel Core i7 CPU at 2.60 GHz with 16 GB of RAM.
An IPGS is proposed that consists of a modified IEEE 13-bus power system [37] and a 9-node gas system [17]. The IPGS topology and coupling relationships are shown in Fig. 2. PS contains 4 DGs. 2 MGTs are located at buses 1 and 2. DG at bus 4 is a DS and DG at bus 13 is a RES. The total power load amount is 1340 kW + 650 kVar. All loads in IPGS are divided into three levels according to their priorities. The weighting factors of 1-level loads, 2-level, and regular loads are 100, 1, and 0.01, respectively. GS contains nine nodes, seven pipelines, two gas sources, one compressor, and four gas loads. The compressor between nodes 2 and 4 is an EDC. The gas source at node 7 is an EDS.
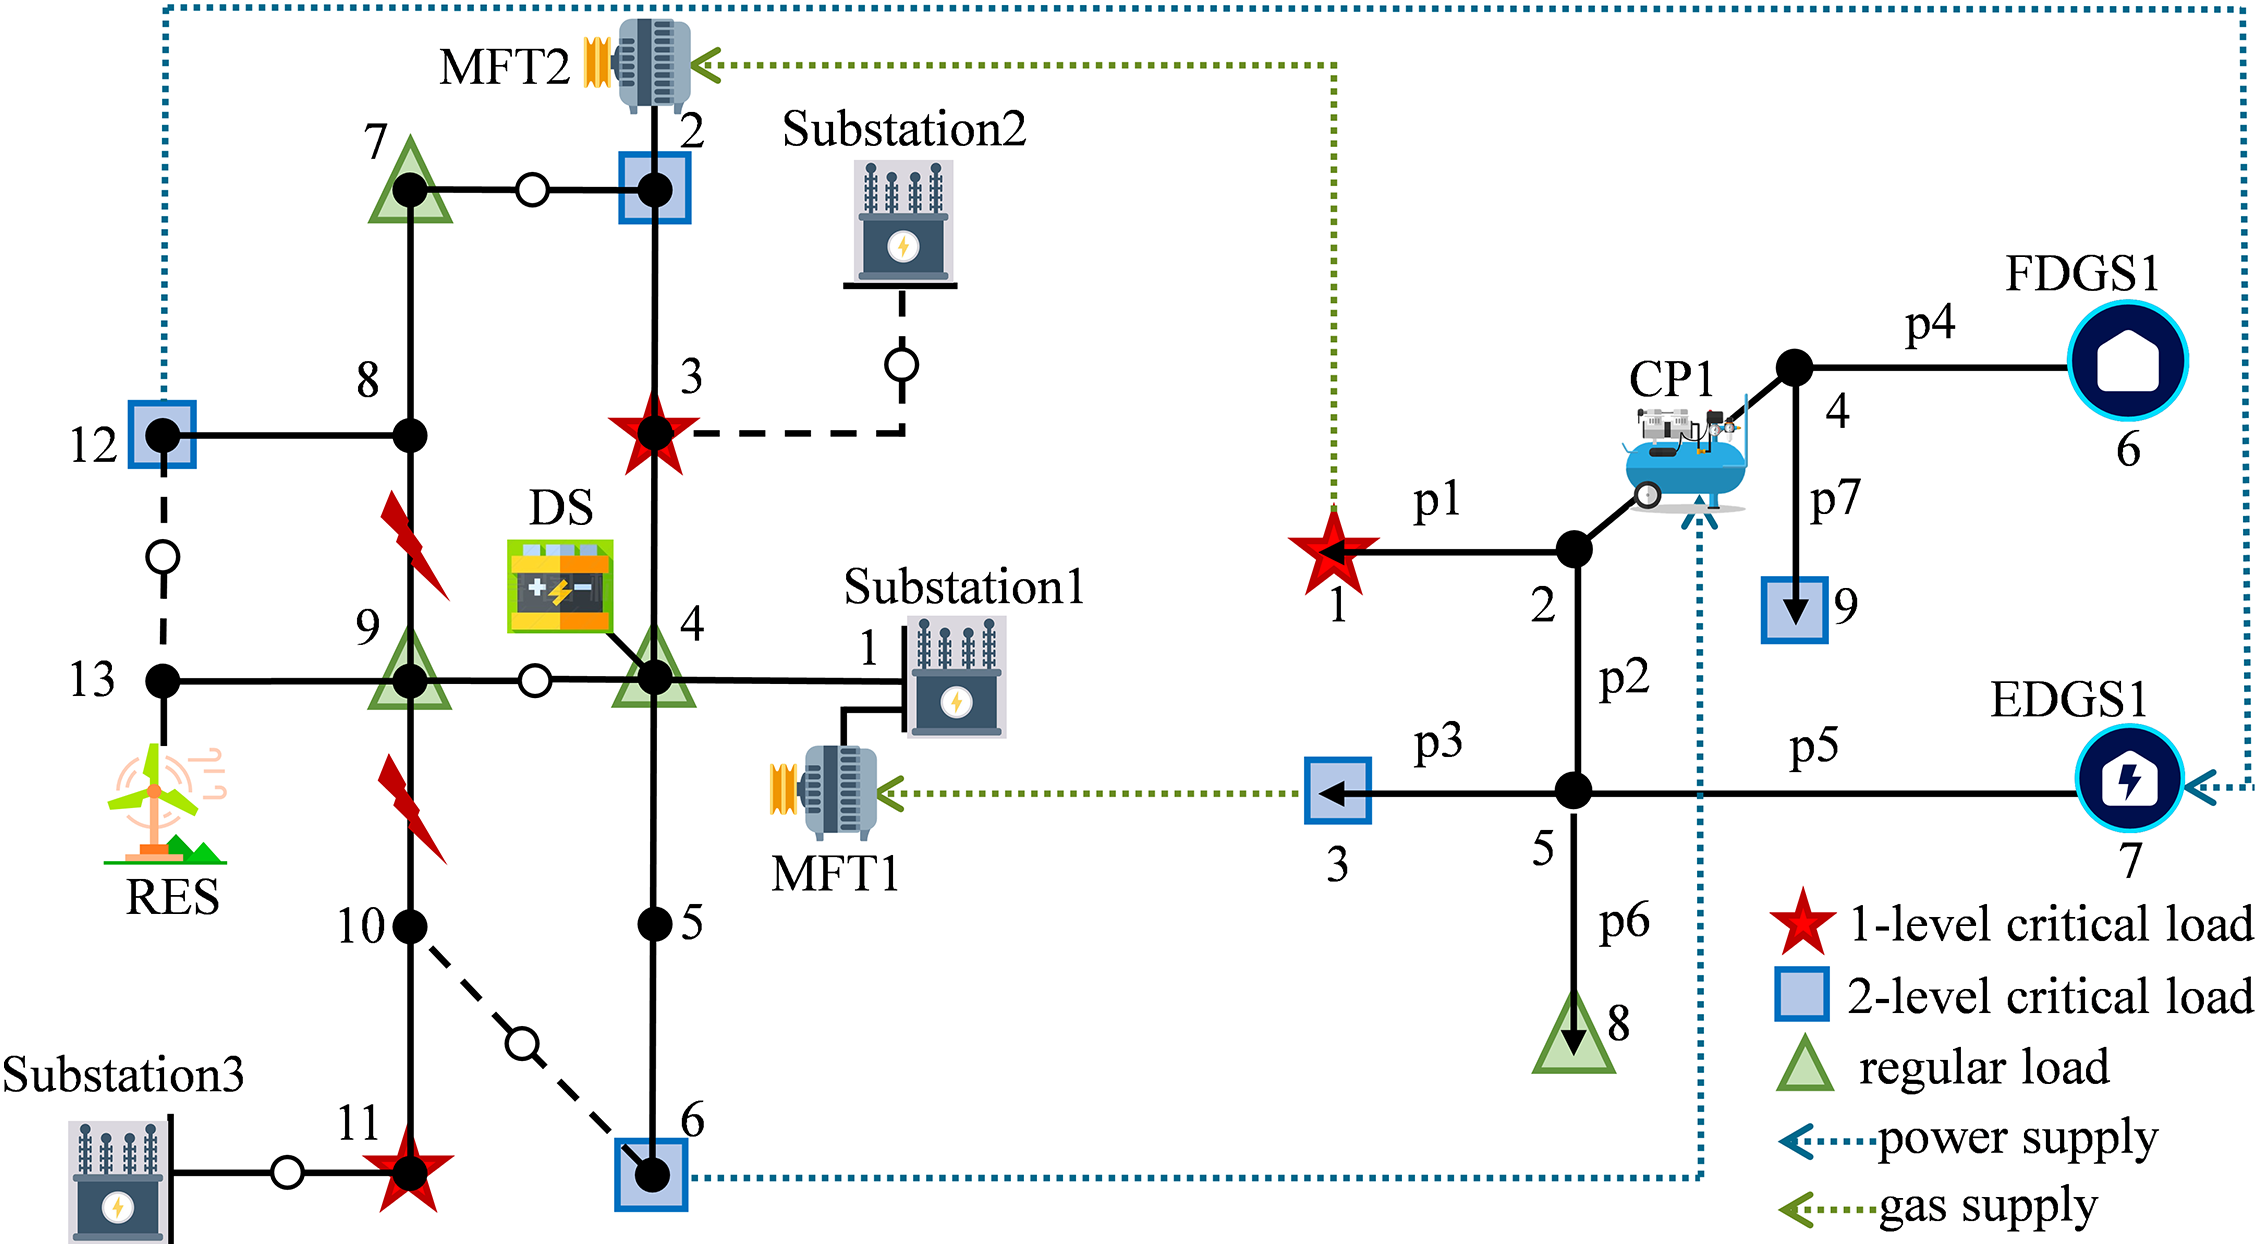
Figure 2: Schematic diagram of 13-bus PS with 7-node GS
Assume that a large-area blackout happens after an extreme event, IPGS is disconnected from the power transmission system, and gas pressure is maintained at a low level because of the shutdown of EDFs. Power distribution lines 8–9 and 9–10 are faulty and isolated. All DGs can be controlled to restore power loads, and all EDFs can be restarted if the power supply is restored. It takes five hours to restore the power transmission system based on evaluating the disaster impact and restoration process. The time of restoration step Δt of IPGS is set to 10 min. Thus, total restoration steps T are 30.
The input data of the proposed model includes test system data, parameters, and the initial status of devices. It takes 53.47 s to obtain the service restoration strategy with the proposed method. The optimized solution of the model is the restoration strategy of IPGS, including generator output, power loads restoration, restart of EDFs, and gas loads restoration at each time step. Based on the restoration strategy, system energy can be calculated. Restoration results such as system energy, number and amount of restored load, and gas node pressure curve can be calculated. The switches 12–13 are opened. The other switches in the system are closed. Table 1 shows the IPGS service restoration strategy, and Table 2 shows the system energy during restoration. Note that if the gas supply of MGT is restored, it is assumed that the generation energy for each MGT is 10,000 kWh. The number and amount of restored loads during the restoration process are shown in Fig. 3. The power output of DSs is shown in Fig. 4. Bus voltage during the service restoration process of 1-level and 2-level power loads is shown in Fig. 5.
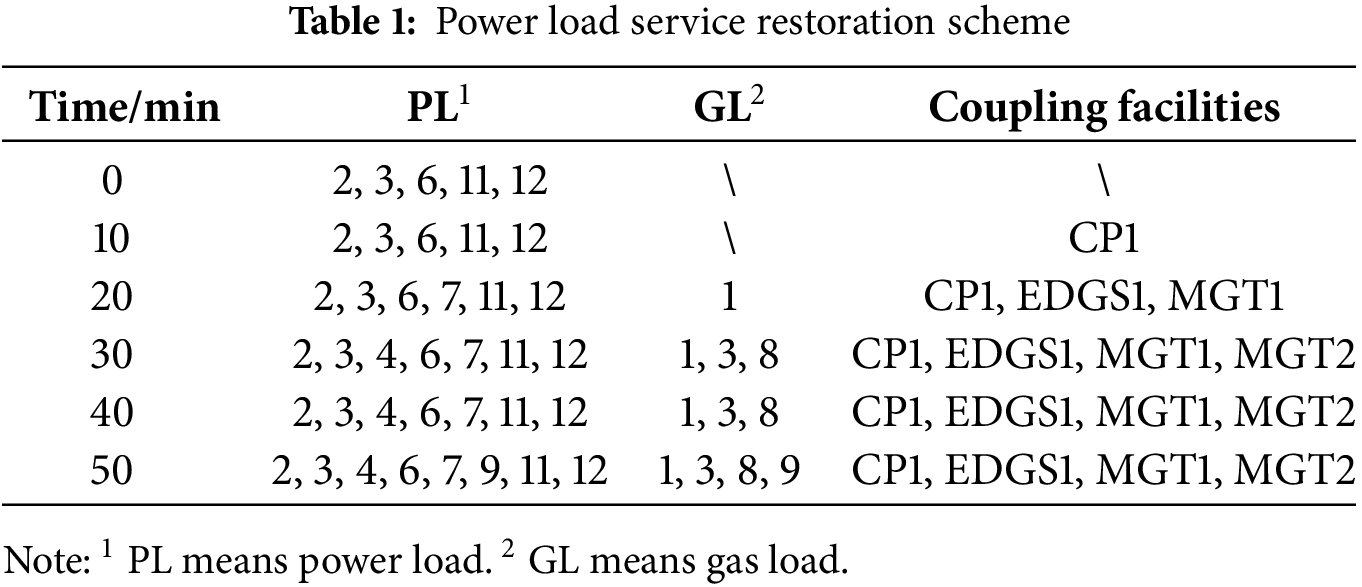
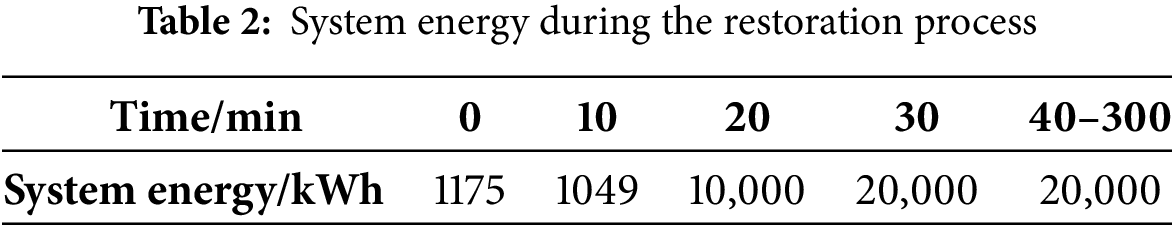
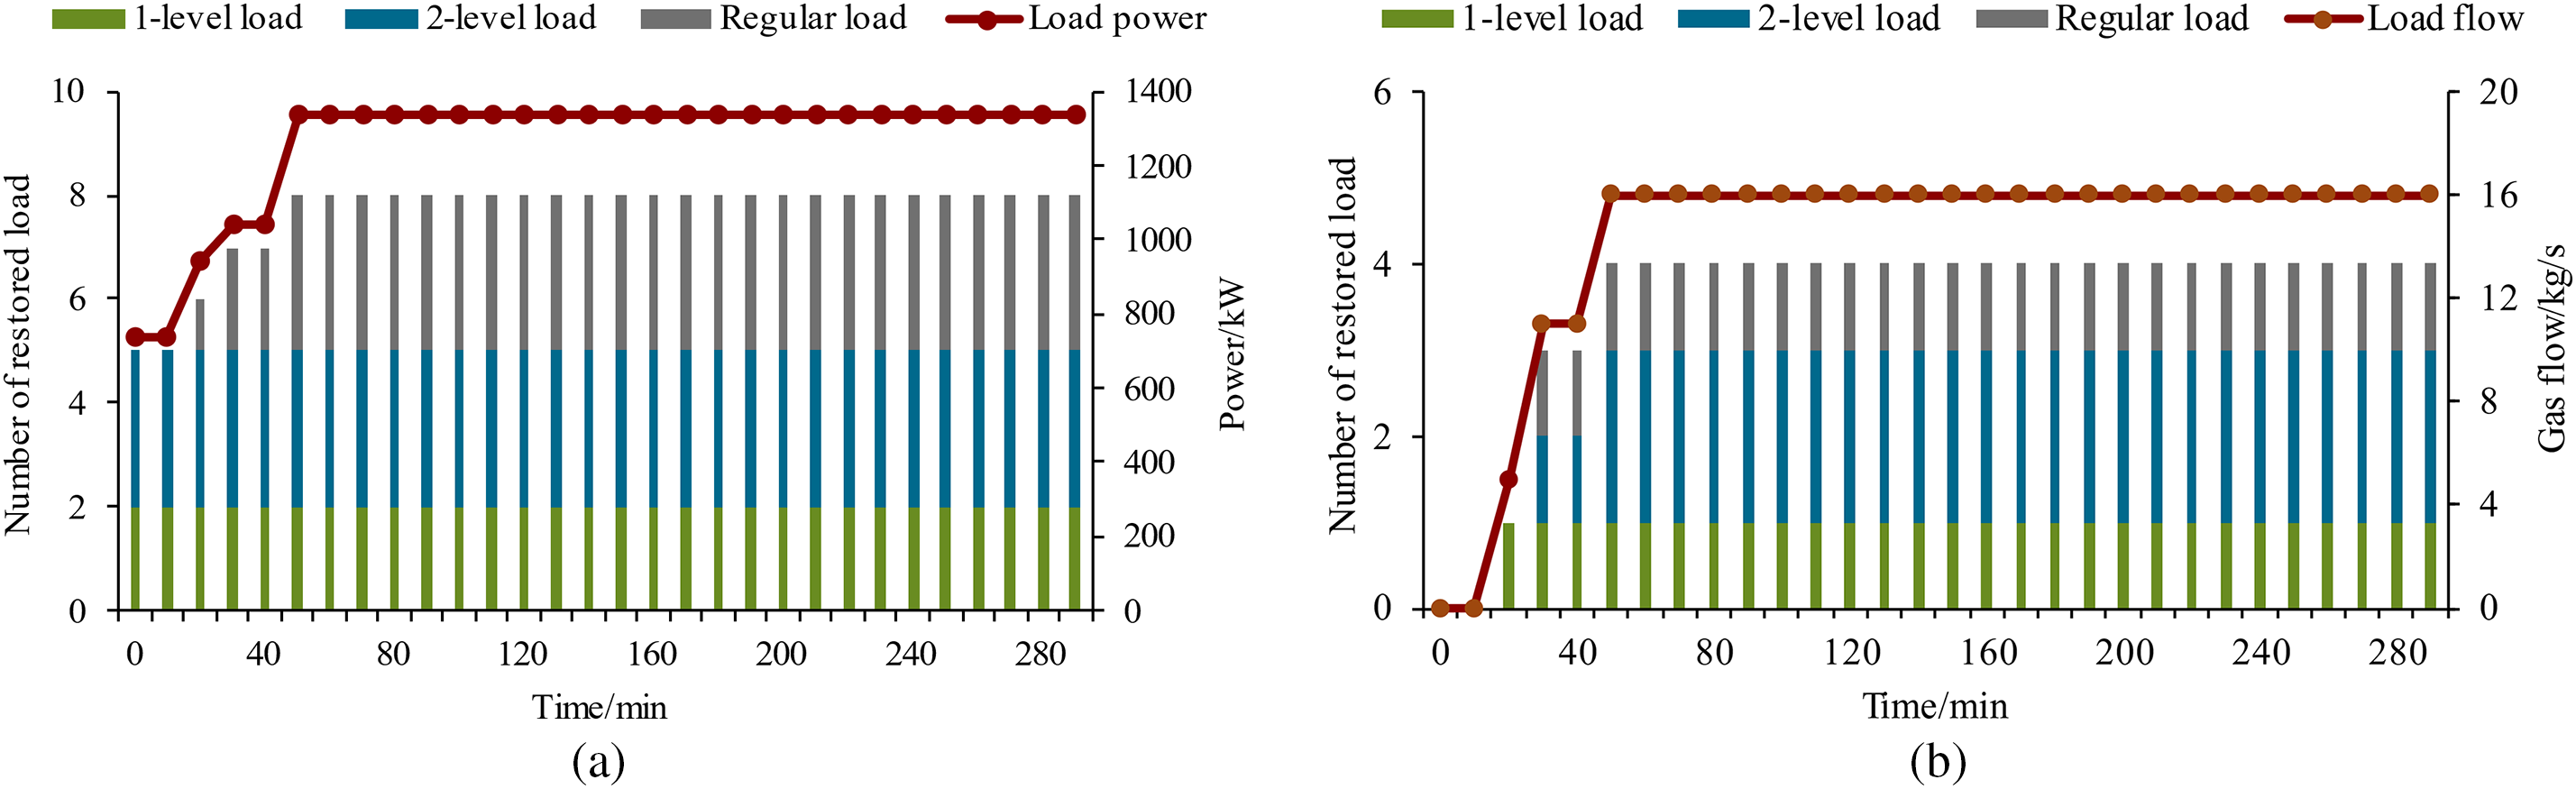
Figure 3: The number and amount of restored load during the restoration process: (a) Number and amount of restored power load; (b) Number and amount of restored gas load
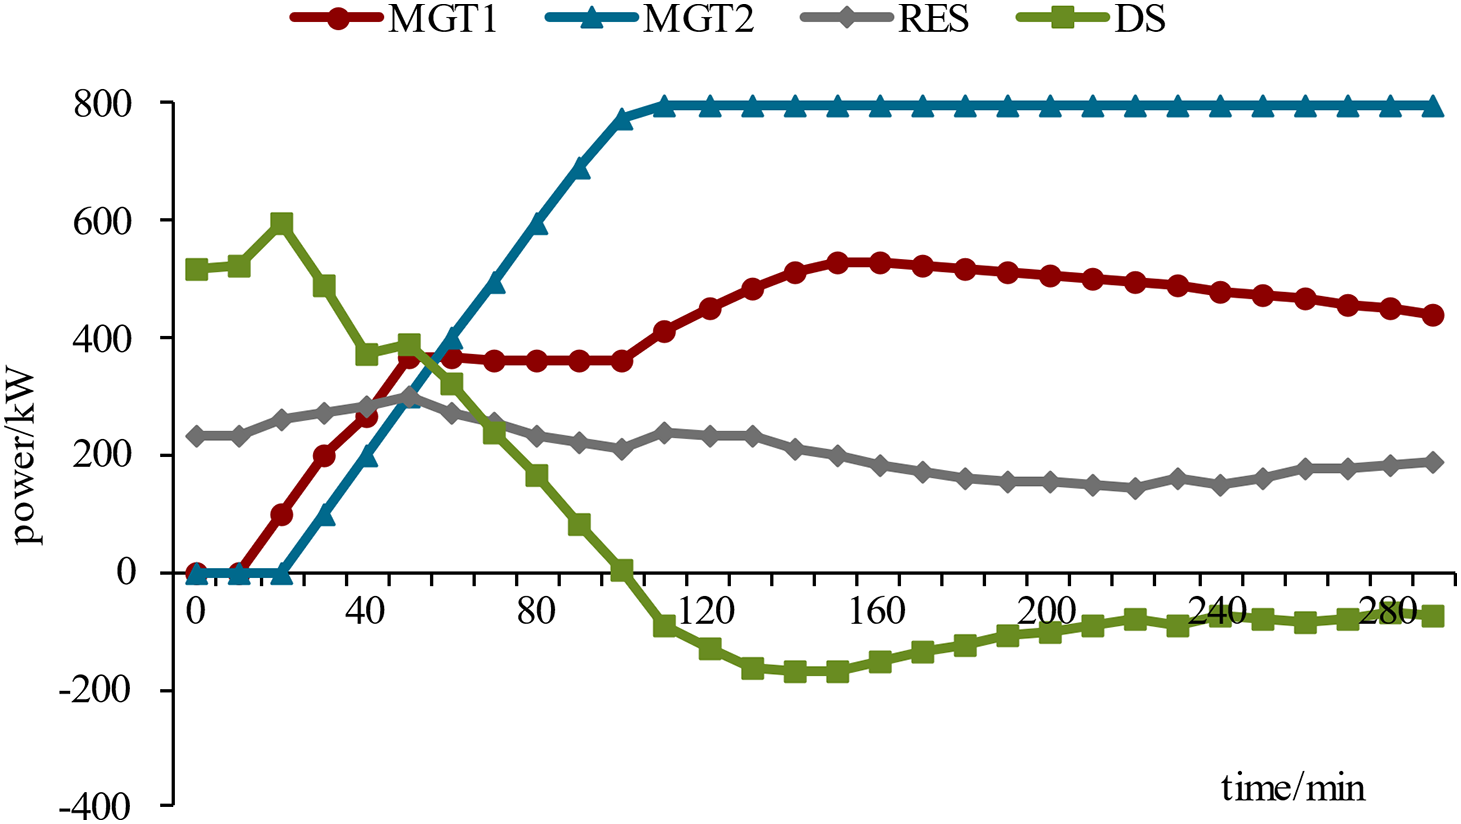
Figure 4: Power output of DGs during the restoration process
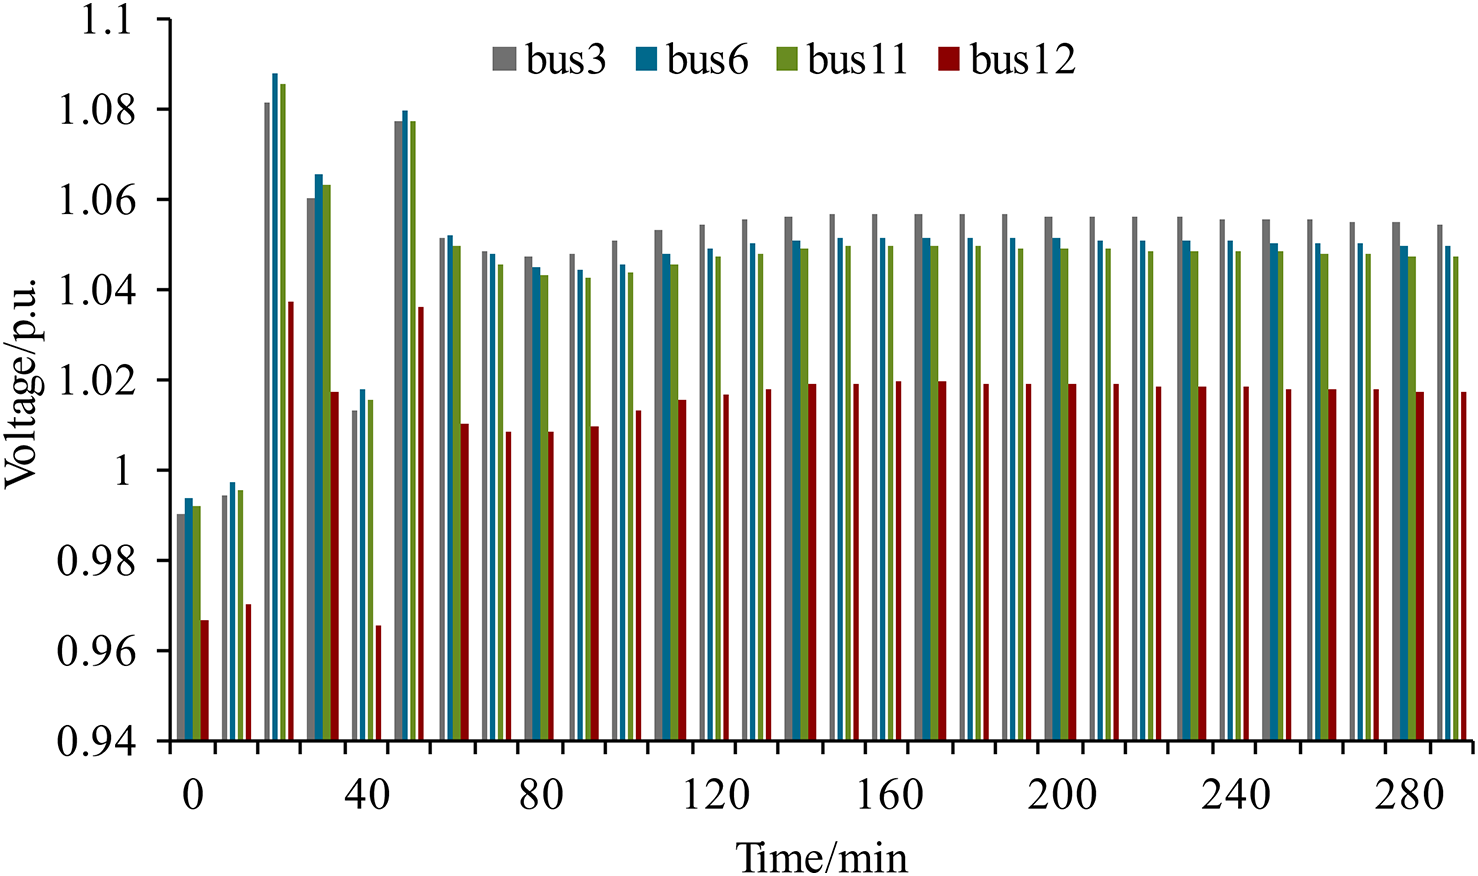
Figure 5: Bus voltage during service restoration
With the restoration of power loads 6 and 12 at 0 min, CP1 and EDGS1 are restarted at 10 and 20 min, respectively, which leads to the restoration of gas loads 1, 3, 8, and 9. MGT1 can be restored at 20 min, and MGT2 can be restored at 30 min with the restoration of gas loads 1 and 3, which provide gas to them. Once the gas supply is restored in 30 min, MGTs ramp up to their maximum output to restore more power load. The system’s power and energy generation are enhanced incredibly by restarting MGTs. With the power output ramping of MGTs, the output of DSs starts to decrease to save the energy stored.
5.3 Strategies Comparison and Analysis
A comparison between the four different restoration strategies is demonstrated to verify the superiority of the proposed method considering the interdependencies of PS and GS. In strategies 1, 2, and 3, the service restoration decision is made from the perspective of PS without considering interdependencies between two distribution systems and PS dynamics [6], referred to as traditional methods. Strategy 1 considers that all MGTs cannot be restarted due to a gas supply outage. In strategy 2, MGTs can be restarted once their gas supply is restored, which can be calculated with the restoration time of EDFs-related power loads using GS dynamic simulation. Strategy 3 considers that EDFs-related power loads and MGTs-related gas loads are 1-level loads, so corresponding weight factors are modified. It should be noted that EDF-related power loads are usually considered as 2-level loads in China.
Table 3, Fig. 6, and Fig. 7 show comparisons of results for different restoration strategies. Compared with strategies 1, 2, and 3, the proposed method can achieve a much higher resilience index, restore more service, and improve the restoration process. One important thing is that coupling facilities can be restarted early using the proposed method. The reason is that considering the interdependencies of the two distribution systems, the proposed method can coordinate the PS restoration and GS restoration so that MGTs and EDFs can be restored as soon as possible. With the restart of MGTs and EDFs, more power and gas loads can be restored. More importantly, compared with strategy 3, the proposed method contributes more to system resilience, which means adjusting the load priorities cannot handle the interdependencies of PS and GS during the service restoration process. Therefore, to enhance the system’s resilience, it is indispensable to consider bi-directional couplings to create service restoration schemes for IPGS.
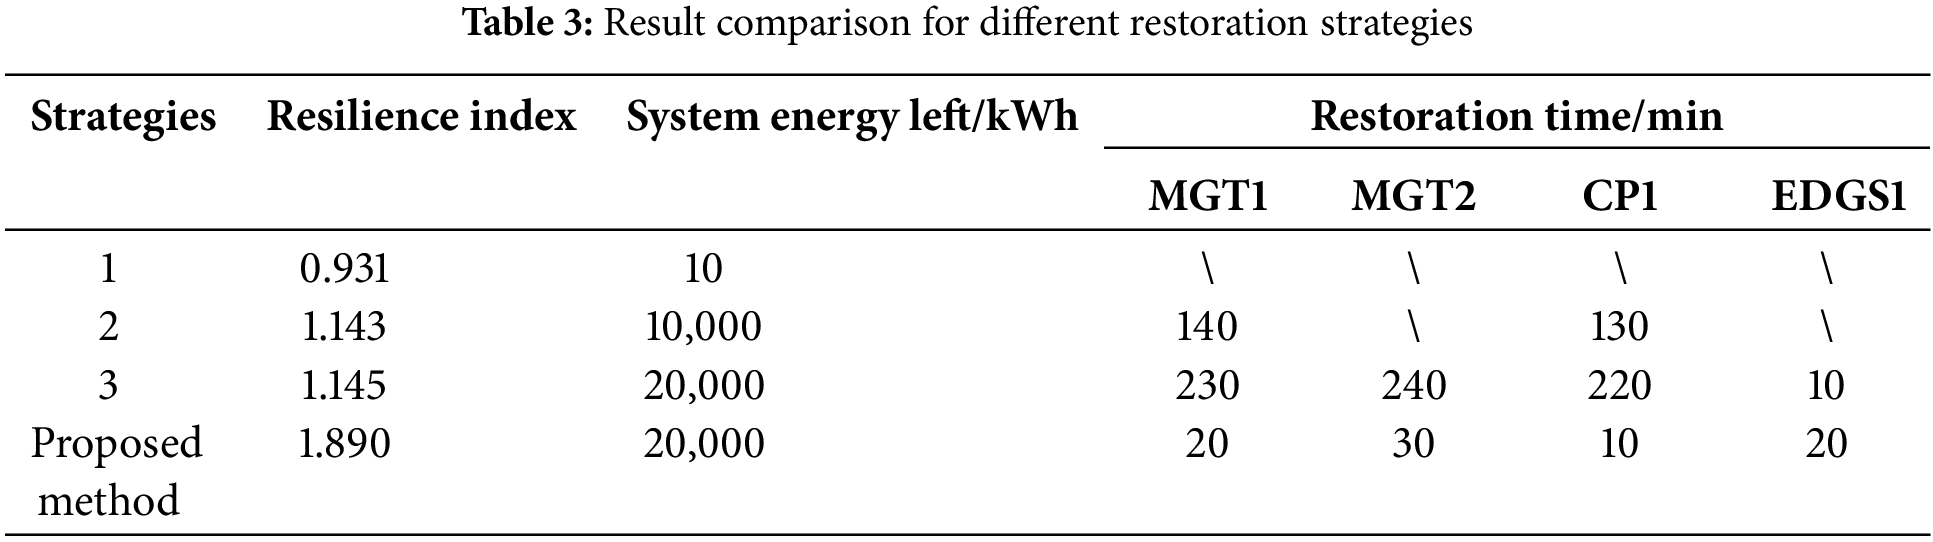
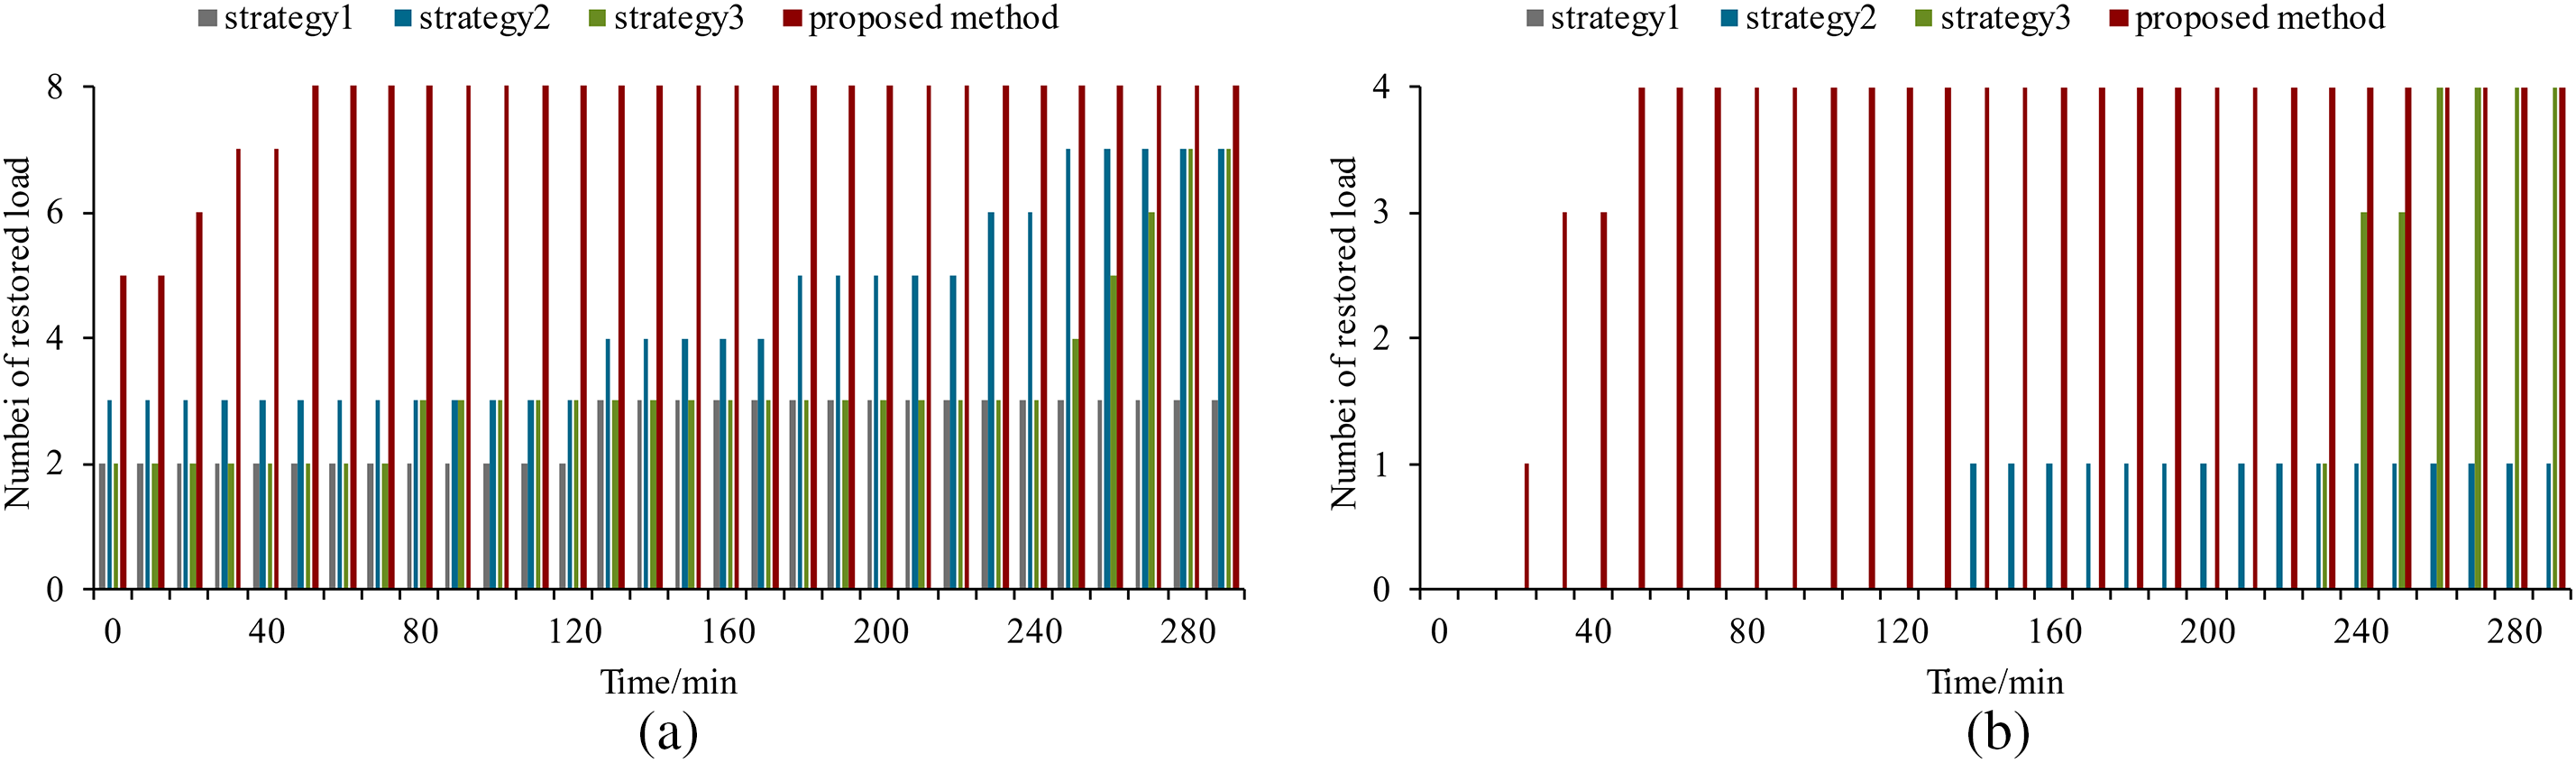
Figure 6: Comparison of the number of restored loads for different strategies: (a) Comparison of the number of restored power loads; (b) Comparison of the number of restored gas loads
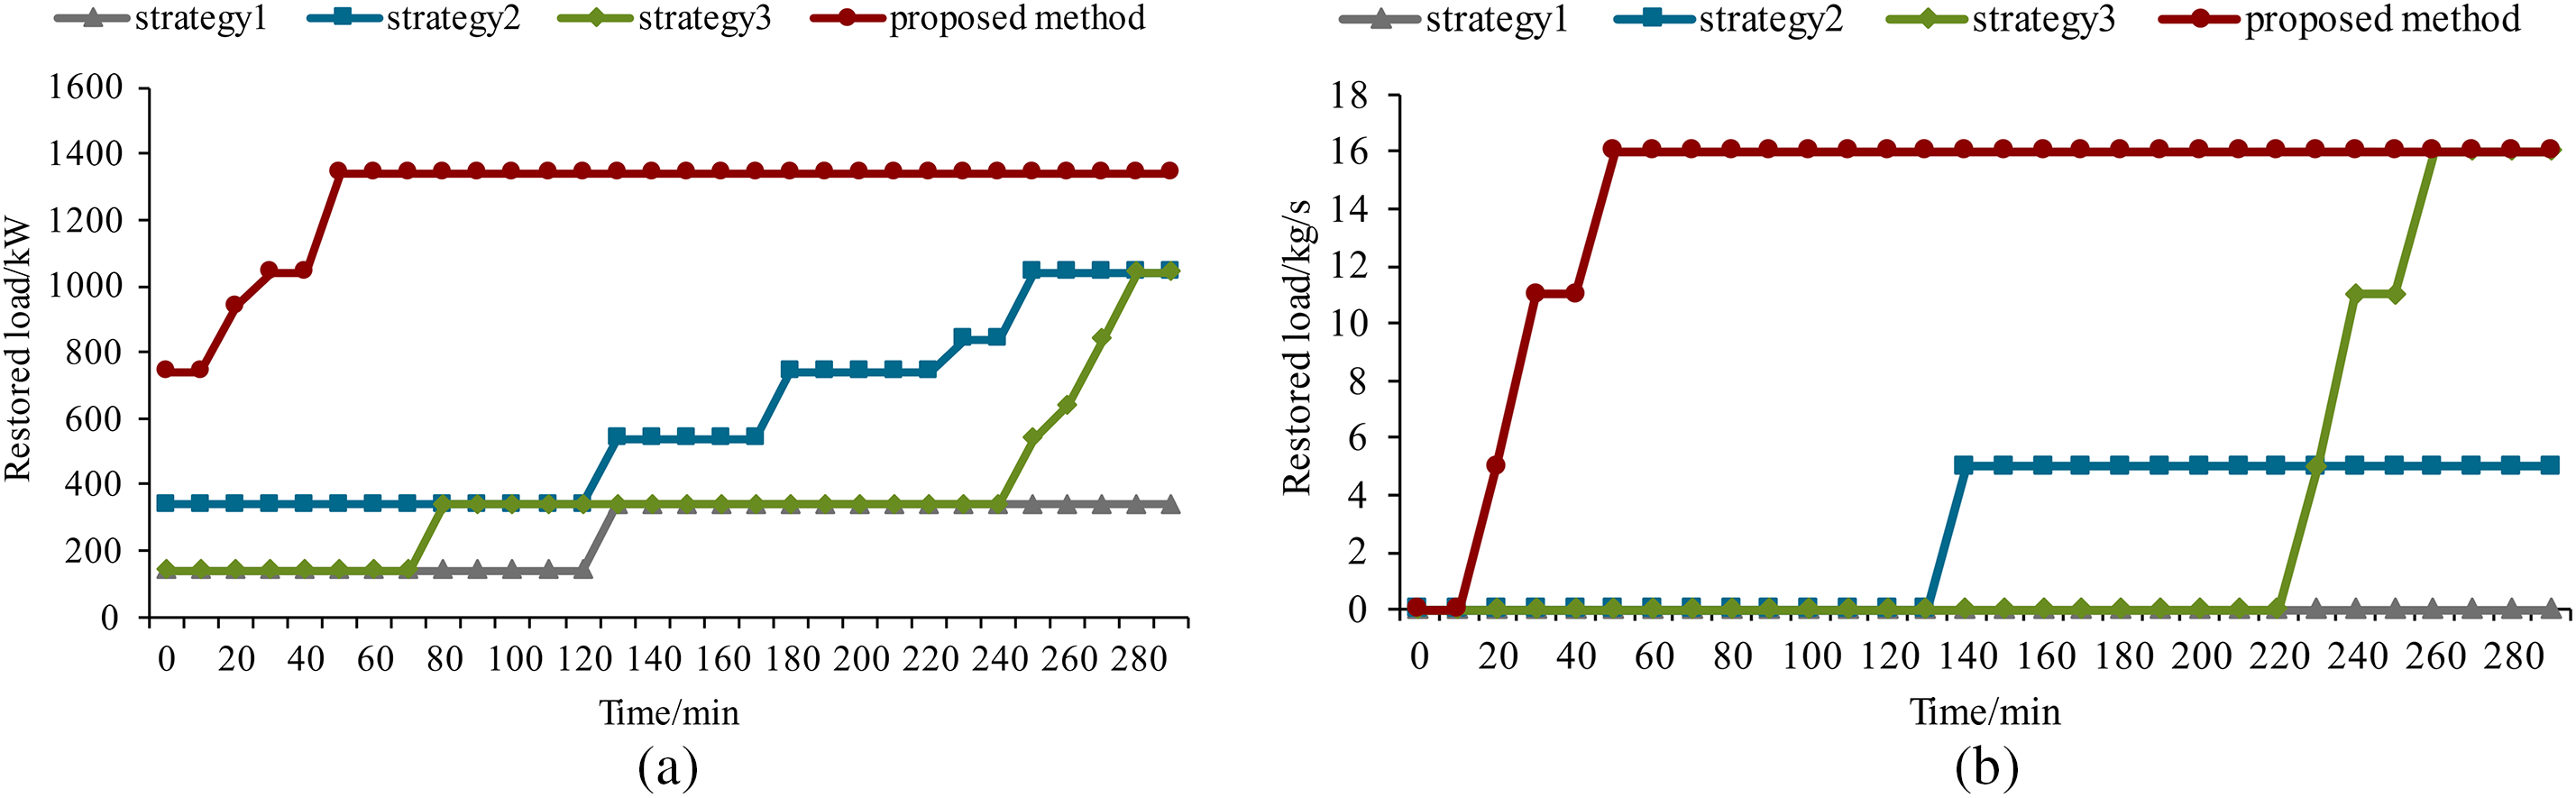
Figure 7: Comparison of the amount of restored loads for different strategies: (a) Comparison of the amount of restored power loads; (b) Comparison of the amount of restored gas loads
5.4 GS Dynamic Response Analysis
Due to the physical characteristics of gas flow, GS dynamic response plays a significant role in service restoration. For example, in strategy 3 in Section 5.3, it takes more than 200 min to restore the gas supply of MGTs after EDGS1 is restored. Four scenarios are assumed to demonstrate the influence of GS dynamics in service restoration. In scenarios 1 and 2, CP1 and EDGS1 cannot be restarted due to a control system problem. In scenarios 3 and 4, CP1 and EDGS1 take 200 min to repair the control system problem during restoration.
Table 4 shows the results of different scenarios for GS dynamic analysis. Note that the restoration time of the gas load is not the same in a specific scenario because different gas load locations have different dynamic responses. Compared with five scenarios, different CP1 and EDGS1 restarting combinations result in different GS dynamic responses, leading to different gas load restoration times. In addition, it can be seen from Fig. 8 that node pressure recovery is a slow process, which takes tens of minutes. A restart of CP1 causes node pressure fluctuations around 80 min of gas load nine. In summary, GS dynamic response is a complex and slow process determined by gas flow characteristics, GS topology and parameters, and EDFs starting situations, significantly influencing the decision-making of service restoration strategy.
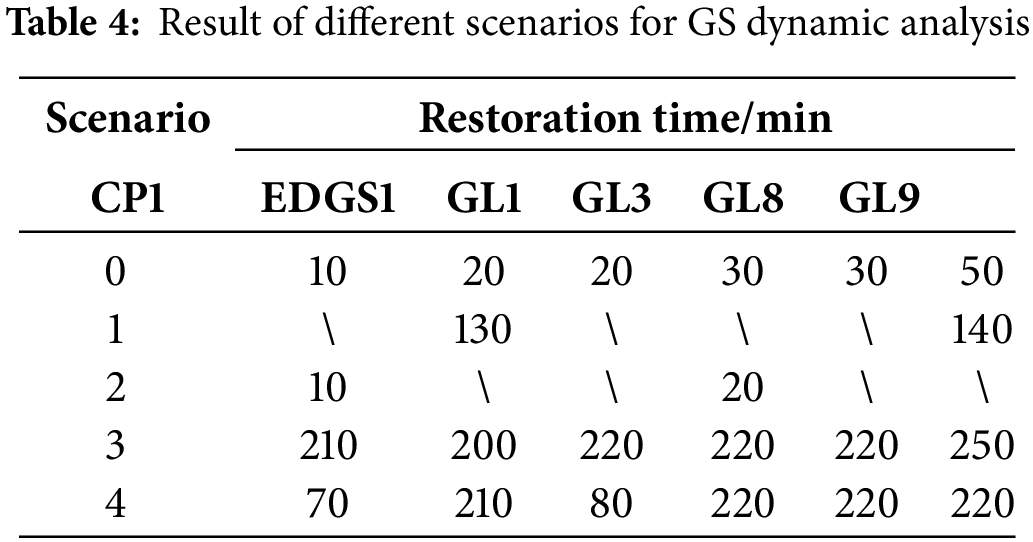
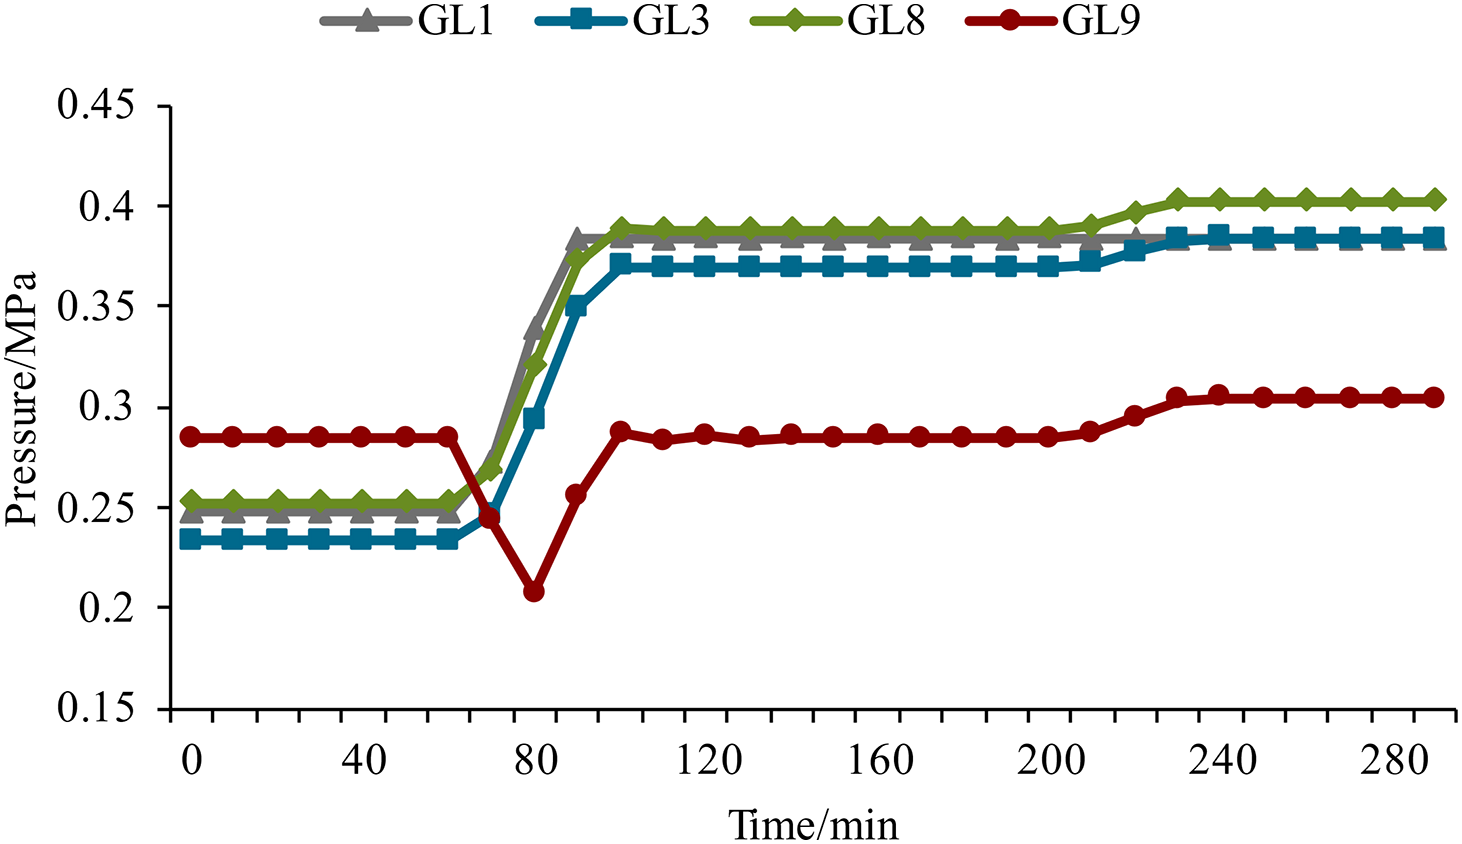
Figure 8: Node pressure curves of gas loads in scenario 4
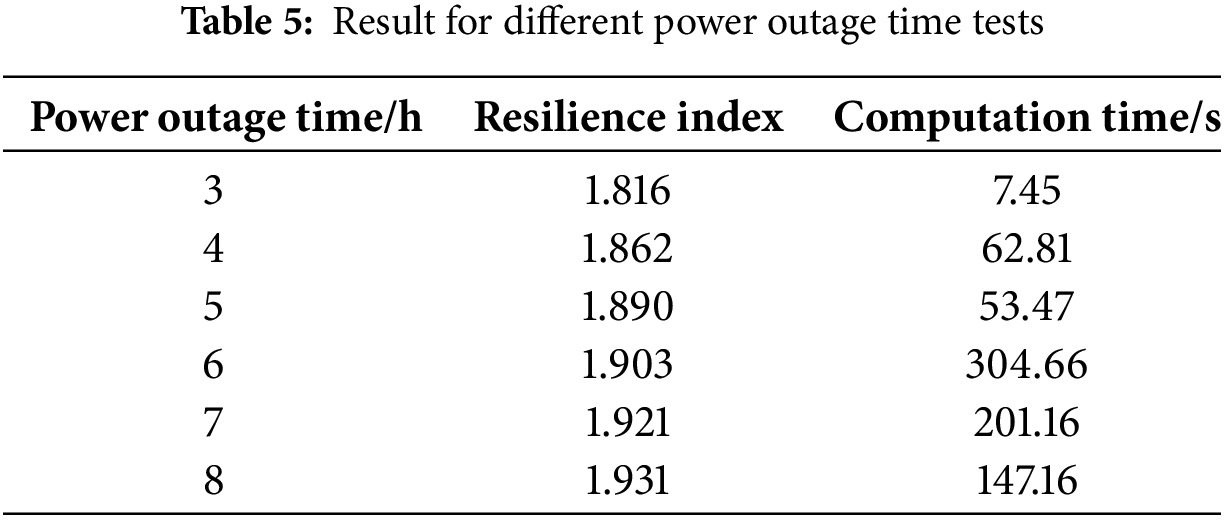
5.5 Computation Efficiency Analysis
To evaluate the effectiveness and computation efficiency of the proposed method, different power outage times, such as 3, 4, 5, 6, 7, and 8 h, are assumed. The testing result is shown in Table 5; with power outage time increasing, loads’ power and gas supply time increases during the service restoration process, so the obtained resilience index is getting larger. As for computation time, the maximum computation time is 304.66 s, and the average computation time is 129.45 s. The proposed method achieves an efficient computation. The longer the power outage time, the more time the computation will take. This is because as power outage time becomes longer, there will be more binary integer variables, which results in branches being much more and makes it difficult for the solver to search for optimal solutions. It should be noted that in a worst-case scenario, the solution time for integer optimization problems grows exponentially with the size of the problem. However, based on operational experience, the warm-start technique can reduce the size of binary variables, resulting in lower computation time for scenarios with longer power outage times.
This paper proposes an optimal service restoration decision-making method for coordinated restoration of IPGS with RESs, considering the interdependencies of two systems and GS dynamics. Considering the PS restoration constraints, GS dynamic restoration constraints, interdependent constraints, and RES uncertainty management, the restoration problem is formulated into a MISOCP model using convexification techniques. The case studies indicated that the proposed method is effective and can improve the system resilience index by at least 65.07% compared with the traditional method proposed in [6].
Stability issues are crucial for practical power system restoration, which may cause system oscillation, leading to restoration failure. Some researchers have started to work on power system restoration problems with transient constraints [38,39] and dynamic constraints [40–42]. In future work, restoration interdependencies between different energy supply systems, such as water and heat supply systems, and dynamic and transient stability issues of IPDS should be further studied.
Acknowledgement: The authors gratefully acknowledge State Grid Shanxi Electric Power Company for providing essential data, which significantly contributed to the completion of this research.
Funding Statement: This research was funded by the Science and Technology Project of State Grid Shanxi Electric Power Company (5205E0230001).
Author Contributions: The authors confirm their contribution to the paper as follows: study conception and design: Xincong Shi, Yuze Ji, and Xinrui Wang; data collection: Xincong Shi, Yuze Ji, and Ruimin Tian; analysis and interpretation of results: Xincong Shi, Yuze Ji, and Chao Zhang; draft manuscript preparation: Xincong Shi, Yuze Ji, and Xinrui Wang. All authors reviewed the results and approved the final version of the manuscript.
Availability of Data and Materials: The data and materials that support the findings of this study are available from the corresponding author upon reasonable request.
Ethics Approval: This study did not involve human participants, animals, or any data requiring ethical approval.
Conflicts of Interest: The authors declare no conflicts of interest to report regarding the present study.
References
1. Bao M, Ding Y, Shao C, Yang Y, Wang P. Nodal reliability evaluation of interdependent gas and power systems considering cascading effects. IEEE Trans Smart Grid. 2020;11(5):4090–104. doi:10.1109/TSG.2020.2982562. [Google Scholar] [CrossRef]
2. Shrestha S, Panchalogaranjan V, Moses P. The February 2021 US Southwest power crisis. Electr Power Syst Res. 2023;217:109124. doi:10.1016/j.epsr.2023.109124. [Google Scholar] [CrossRef]
3. Wang Y, Yang Y, Xu Q. Reliability assessment for integrated power-gas systems considering renewable energy uncertainty and cascading effects. CSEE J Power Energy. 2023;9(3):1214–26. doi:10.17775/CSEEJPES.2022.00740. [Google Scholar] [CrossRef]
4. Tao R, Zhao D, Xu C, Wang H, Xia X. Resilience enhancement of integrated electricity-gas-heat Urban energy system with data centres considering waste heat reuse. IEEE Trans Smart Grid. 2023;14(1):183–98. doi:10.1109/TSG.2022.3197626. [Google Scholar] [CrossRef]
5. Freeman G, Apt J, Dworkin M. The natural gas grid needs better monitoring. Issues Sci Technol. 2018;34(4):79–84. [Google Scholar]
6. Wang Y, Yin X, He JH, Liu CC, Schneider KP, Hong MG. Coordinating multiple sources for service restoration to enhance resilience of distribution systems. IEEE Trans Smart Grid. 2019;10(5):5781–93. doi:10.1109/TSG.2019.2891515. [Google Scholar] [CrossRef]
7. Zhang W, Zhang C, Li J. Multi-resource collaborative service restoration of a distribution network with decentralized hierarchical droop control. Prot Control Mod Power Syst. 2024;9(1):19–37. doi:10.23919/PCMP.2023.000530. [Google Scholar] [CrossRef]
8. Zhang Q, Ma Z, Zhu Y, Wang Z. A two-level simulation-assisted sequential distribution system restoration model with frequency dynamics constraints. IEEE Trans Smart Grid. 2021;12(5):3835–46. doi:10.1109/TSG.2021.3088006. [Google Scholar] [CrossRef]
9. Cao Y, Zhou B, Chung CY, Wu T, Zheng L, Shuai Z. A coordinated emergency response scheme for electricity and watershed networks considering spatio-temporal heterogeneity and volatility of rainstorm disasters. IEEE Trans Smart Grid. 2024;15(4):3528–41. doi:10.1109/TSG.2024.3362344. [Google Scholar] [CrossRef]
10. Qiu D, Wang Y, Wang J, Zhang N, Strbac G, Kang C. Resilience-oriented coordination of networked microgrids: a shapley Q-value learning approach. IEEE Trans Power Syst. 2024;39(2):3401–16. doi:10.1109/TPWRS.2023.3276827. [Google Scholar] [CrossRef]
11. Ye Z, Chen C, Chen B, Wu K. Resilient service restoration for unbalanced distribution systems with distributed energy resources by leveraging mobile generators. IEEE Trans Industr Inform. 2021;17(2):1386–96. doi:10.1109/TII.2020.2976831. [Google Scholar] [CrossRef]
12. Hua Z, Zhou B, Or SW, Zhang J, Li C, Wei J. Robust emergency preparedness planning for resilience enhancement of energy-transportation nexus against extreme rainfalls. IEEE Trans Ind Appl. 2024;60(1):1196–207. doi:10.1109/TIA.2023.3274615. [Google Scholar] [CrossRef]
13. Alobaidi H, Fazlhashemi SS, Khodayar M, Wang J, Khodayar ME. Distribution service restoration with renewable energy sources: a review. IEEE Trans Sustain Energy. 2023;14(2):1151–68. doi:10.1109/TSTE.2022.3199161. [Google Scholar] [CrossRef]
14. Zou B, Wang C, Zhou Y, Wang J, Chen C, Wen F. Resilient co-expansion planning between gas and electric distribution networks against natural disasters. IET Gener Transm Distrib. 2019;14(16):3561–70. doi:10.1049/iet-gtd.2019.0569. [Google Scholar] [CrossRef]
15. Wang Y, Yang Y, Xu Q. Integrated model for resilience evaluation of power-gas systems under windstorms. CSEE J Power Energy Systems. 2024;10(4):1427–40. doi:10.17775/CSEEJPES.2022.05420. [Google Scholar] [CrossRef]
16. Mostafa S, Hooshmand R, Miadreza S. Risk-constrained strategic resilience enhancement of power distribution and natural gas systems through G2P and P2G planning and distributed load Restoration against flood. Sustain Cities Soc. 2024;112:105618. doi:10.1016/j.scs.2024.105618. [Google Scholar] [CrossRef]
17. Lin Y, Chen B, Wang J, Bie Z. A combined repair crew dispatch problem for resilient electric and natural gas system considering reconfiguration and DG islanding. IEEE Trans Power Syst. 2019;34(4):2755–67. doi:10.1109/TPWRS.2019.2895198. [Google Scholar] [CrossRef]
18. Xu M, Ouyang M, Mao Z, Xu X. Improving repair sequence scheduling methods for post-disaster critical infrastructure systems. Comput Aided Civ Inf. 2019;34:506–22. doi:10.1111/mice.12435. [Google Scholar] [CrossRef]
19. Li Y, Li Z, Wen F, Shahidehpour M. Minimax-regret robust co-optimization for enhancing the resilience of integrated power distribution and natural gas systems. IEEE Trans Sustain Energy. 2020;11(1):61–71. doi:10.1109/TSTE.2018.2883718. [Google Scholar] [CrossRef]
20. He C, Dai C, Wu L, Liu T. Robust network hardening strategy for enhancing resilience of integrated electricity and natural gas distribution systems against natural disasters. IEEE Trans Power Syst. 2018;33(5):5787–98. doi:10.1109/TPWRS.2018.2820383. [Google Scholar] [CrossRef]
21. Li X, Du XX, Jiang T, Zhang RF, Chen HH. Coordinating multi-energy to improve urban integrated energy system resilience against extreme weather events. Appl Energy. 2022;309:118455. doi:10.1016/j.apenergy.2021.118455. [Google Scholar] [CrossRef]
22. Sang M, Ding Y, Bao M, Li S, Ye C, Fang Y. Resilience-based restoration strategy optimization for interdependent gas and power networks. Appl Energy. 2021;302:117560. doi:10.1016/j.apenergy.2021.117560. [Google Scholar] [CrossRef]
23. Jia B, Dan L, Li X, Ma T, Yuan D, Lu Z. Two-stage restoration strategy for multi fault of an electric gas integrated energy system. Prot Control Mod Power Syst. 2022;50(9):113–23. doi:10.19783/j.cnki.pspc.210744. [Google Scholar] [CrossRef]
24. Wang Y, Qiu D, Sun X, Bie Z, Strbac G. Coordinating multi-energy microgrids for integrated energy system resilience: a multi-task learning approach. IEEE Trans Sustain Energy. 2024;15(2):920–37. doi:10.1109/TSTE.2023.3317133. [Google Scholar] [CrossRef]
25. Wang K, Zhao P, Wang C, Zhang Z, Zhang Y, Lu J, et al. Resilience-oriented load restoration method and repair strategies for regional integrated electricity-natural gas system. Energy Eng. 2024;121:1091–108. doi:10.32604/ee.2023.044016. [Google Scholar] [CrossRef]
26. Yun J, Yan Z, Zhou Y, Zhang P, Hu W. Multi-time collaborative restoration for integrated electrical-gas distribution systems based on rolling optimization. CSEE J Power Energy Syst. 2024;10(2):660–71. doi:10.17775/CSEEJPES.2020.03720. [Google Scholar] [CrossRef]
27. Li G, Yan K, Zhang R, Jiang T, Li X, Chen H. Resilience-oriented distributed load restoration method for integrated power distribution and natural gas systems. IEEE Trans Sustain Energy. 2022;13(1):341–52. doi:10.1109/TSTE.2021.3110975. [Google Scholar] [CrossRef]
28. Fan J, He P, Li C, Zhao C, Ji Y. A post-disaster restoration model for power-gas-transportation distribution networks considering spatial interdependency and energy hubs. Electr Power Syst Res. 2024;233:110505. doi:10.1016/j.epsr.2024.110505. [Google Scholar] [CrossRef]
29. Wang W, He Y, Wang H, Chen H, Xiong X. Improving interdependent urban power and gas distribution systems resilience through optimal scheduling of mobile emergency supply and repair resources. Reliab Eng Syst Saf. 2024;250:110303. doi:10.1016/j.ress.2024.110303. [Google Scholar] [CrossRef]
30. Hao L, Hu W, Wang C, Wang G, Sun Y, Chen J, et al. Coordinated restoration optimization of power-gas integrated energy system with mobile emergency sources. Glob Energy Interconnect. 2023;6(2):205–27. doi:10.1016/j.gloei.2023.04.008. [Google Scholar] [CrossRef]
31. Clive A. Computational techniques for fluid dynamics. Volume 2: specific techniques for different flow categories. 2nd ed. Berlin/Heidelberg: Springer; 2012. p. 154–96. [Google Scholar]
32. Fang J, Zeng Q, Ai X, Chen Z, Wen J. Dynamic optimal energy flow in the integrated natural gas and electrical power systems. IEEE Trans Sustain Energy. 2018;9(1):188–98. doi:10.1109/TSTE.2017.2717600. [Google Scholar] [CrossRef]
33. Kan J, Xu Y, Wang Y, Zhang CG, Du Y, Guo LY. Optimal decision-making method for generator start-up considering interdependencies between power and gas transmission networks. Proc CSEE. 2022;43(19):7457–66. (In Chinese). doi:10.13334/j.0258-8013.pcsee.221189. [Google Scholar] [CrossRef]
34. Low SH. Convex relaxation of optimal power flow—part I: formulations and equivalence. IEEE Trans Control Netw Syst. 2014;1(1):15–27. doi:10.1109/TCNS.2014.2309732. [Google Scholar] [CrossRef]
35. Li Y, Xiao J, Chen C, Tan Y, Cao Y. Service restoration model with mixed-integer second-order cone programming for distribution network with distributed generations. IEEE Trans Smart Grid. 2019;10(4):4138–50. doi:10.1109/TSG.2018.2850358. [Google Scholar] [CrossRef]
36. Zhao J, Liu Y, Wang HT, Wu QW. Receding horizon load restoration for coupled transmission and distribution system considering load-source uncertainty. Int J Electr Power Energy Syst. 2020;116:105517. doi:10.1016/j.ijepes.2019.105517. [Google Scholar] [CrossRef]
37. Chen B, Chen C, Wang J, Butler-Purry KL. Multi-time step service restoration for advanced distribution systems and microgrids. IEEE Trans Smart Grid. 2018;9(6):6793–805. doi:10.1109/TSG.2017.2723798. [Google Scholar] [CrossRef]
38. Luo J, Teng F, Bu S. Stability-constrained power system scheduling: a review. IEEE Access. 2020;8:219331–43. doi:10.1109/ACCESS.2020.3042658. [Google Scholar] [CrossRef]
39. Wang Y, Strbac G. Transient stability-driven planning for the optimal sizing of resilient AC/DC hybrid microgrids. IEEE Trans Power Syst. 2024:1–13. doi:10.1109/TPWRS.2024.3505142. [Google Scholar] [CrossRef]
40. Liu F, Lin C, Chen C, Huang Y, Bie Z. Dynamic microgrids formation for resilient distribution systems with transient simulation-based verification and feedback. Paper presented at: The ICPICS 2021; 2021 Jul 29–31; Shenyang, China. [Google Scholar]
41. Ma J, Wang Y, Xu Y. Sequential distribution system restoration with inverter-based distributed generations considering dynamic frequency constraints. Paper presented at: The 4th CIEEC; 2021 May 28–30; Wuhan, China. [Google Scholar]
42. Bassey O, Butler-Purry K, Chen B. Dynamic modeling of sequential service restoration in islanded single master microgrids. IEEE Trans Power Syst. 2020;35(1):202–14. doi:10.1109/TPWRS.2019.2929268. [Google Scholar] [CrossRef]
Cite This Article
 Copyright © 2025 The Author(s). Published by Tech Science Press.
This work is licensed under a Creative Commons Attribution 4.0 International License , which permits unrestricted use, distribution, and reproduction in any medium, provided the original work is properly cited.
 Downloads
 Citation Tools