
 Submit a Paper
 Propose a Special lssue
 Open Access
ARTICLE

Thermo-Economic Performance Comparison between Basic Organic Rankine Cycle and Organic Rankine Cycle with Vapor-Liquid Ejector Driven by Solar Energy
1 School of Energy Science and Engineering, University of Science and Technology of China, Guangzhou, 510640, China
2 Guangzhou Institute of Energy Conversion, Chinese Academy of Sciences, Guangzhou, 510640, China
3 Industrial Turbine Division, Dongfang Turbine Co., Ltd., Deyang, 618000, China
* Corresponding Author: Zuowei Yang. Email:
(This article belongs to the Special Issue: Recent Advance and Development in Solar Energy)
Energy Engineering 2025, 122(4), 1443-1468. https://doi.org/10.32604/ee.2025.060113
Received 24 October 2024; Accepted 31 January 2025; Issue published 31 March 2025
 View Full Text
 Download PDF
Abstract
Amidst the global push for decarbonization, solar-powered Organic Rankine Cycle (SORC) systems are gaining significant attention. The small-scale Organic Rankine Cycle (ORC) systems have enhanced environmental adaptability, improved system flexibility, and achieved diversification of application scenarios. However, the power consumption ratio of the working fluid pump becomes significantly larger relative to the total power output of the system, adversely impacting overall system efficiency. This study introduces an innovative approach by incorporating a vapor-liquid ejector into the ORC system to reduce the pump work consumption within the ORC. The thermo-economic models for both the traditional ORC and an ORC integrated with a vapor-liquid ejector driven by solar parabolic trough collectors (PTCs) were developed. Key evaluation indicators, such as thermal efficiency, exergy efficiency, specific investment cost, and levelized cost of energy, were employed to compare the SORC with the solar ejector organic Rankine cycle (SEORC). Additionally, the study explores the effects of solar beam radiation intensity, PTC temperature variation, evaporator pinch point temperature difference, and condenser pinch point temperature difference on the thermo-economic performance of both systems. Results demonstrate that SEORC consistently outperforms SORC. Higher solar radiation intensity and increased PTC inlet temperature lead to better system efficiency. Moreover, there is an optimal PTC temperature drop where both thermal and exergy efficiencies are maximized. The influence of evaporator and condenser temperature pinches on system performance is found to be inconsistent.Keywords
Global economic expansion and urbanization have resulted in severe environmental pollution and substantial CO2 emissions [1]. In response to climate change, China has pledaged to reach peak total CO2 emissions before 2030 and achieve carbon neutrality before 2060, as announced on 22 September 2020, at the 75th United Nations (UN) General Assembly. To achieve this ambitious goal, the development of renewable and clean energy has become one of the most crucial strategies, garnering escalating attention [2]. Solar energy, with the abundance and widespread distribution, is supposed to a preferred solution to address the global climate change [3].
Organic Rankine cycle (ORC) is one of the most attractive technologies for harnessing solar energy [4]. Solar collectors capture solar radiation and convert it into heat. Among the various types of solar collectors, including flat-plate collectors with reflectors, parabolic trough collectors (PTCs), compound parabolic collectors, and Fresnel lens concentrating collectors, PTCs are the most commonly used for delivering process heat [5]. Over the past decades, extensive theoretical and experimental research has been conducted on PTC powered ORC systems. Rayegan et al. [6] developed a systematic approach for the selection of an appropriate working fluid. This method considers the molecular composition, their temperature-entropy characteristics, and the influence of these attributes on the thermodynamic efficiency of the system. Desai et al. [7] conducted thermo-economic investigation and working fluid selection for solar ORC. Soulis et al. [8] constructed a simulation model of a two-stage ORC engine coupled with evacuated tube solar collectors. The model was based on daily meteorological data covering a period of thirty-four years. The findings indicated significant spatial variability in the system’s performance. Calise et al. [9] conducted a thermo-economic optimization analysis of the heat exchanger parameters and demonstrated the off-design operational characteristics of a PTC powered ORC system that utilizes butane as its working fluid. Roumpedakis et al. [10] executed an assessment that combined exergetic and economic evaluations of a compact solar-powered ORC system. Georousis et al. [11] performed an optimization study with multiple objectives for a PTC-driven ORC system, employing CO2 as the working fluid.
Research in PTC-ORC has predominantly focused on working fluid selection, operating parameters optimization, components geometrical parameter optimization, multi-objective optimization and off-design study. These studies aimed at improving the thermodynamic efficiency of PTC-ORC systems. Javed et al. [12] carried out a comparative evaluation of three distinct ORC setups, encompassing basic, recuperative, and regenerative types, assessing them from both energetic and financial viewpoints. The results demonstrate that the regenerative ORC configuration, utilizing Toluene as the working fluid, outperforms the other configurations. Freeman et al. [13] introduced a concept for a domestic-scale PTC-ORC system designed for cogeneration of power and heat, tailored for the UK’s climate conditions. Bellos et al. [14] conducted a study focused on the investigation and enhancement of a trigeneration system designed for the concurrent generation of heating, cooling, and electricity. Jafary et al. [15] proposed and evaluated two distinct tri-generation system configurations driven by PTC, namely a regenerative ORC and an ORC system equipped with an internal heat exchanger.
The working fluid pump in ORC systems significantly impacts the overall system performance and stable operation. In the current literature on ORC systems, the efficiency of the working fluid pump is commonly estimated to range from 65% to 85% [16,17]. However, under current technological conditions, the actual operational efficiency of working fluid pumps frequently are less than these assumed values [18,19]. Zhang [20] emphasized that the selection of an appropriate circulation pump is pivotal to the system’s performance, as an unsuitable pump can lead to negative efficiency when its power consumption is accounted for. Jiang et al. [21] addressed this issue by developing a small-scale pumpless ORC system, which innovatively eliminates the pump to reduce the significant electrical power consumption and thereby enhances system efficiency. Yang et al. [22] evaluated the performance of different types of working fluid pumps used in ORC systems. Their analysis showed that the efficiency rates for multistage centrifugal pumps, hydraulic diaphragm metering pumps, and roto-jet pumps are 58.76%, 55.26%, and 30.51%, respectively. These results highlight the significant influence that the efficiency of the working fluid pump has on the overall efficiency of the ORC system. Furthermore, the working fluid pumps power consumption remains relatively high in medium-scale ORC systems [23,24]. Therefore, investigating strategies to reduce the power consumption of ORC pumps is of practical significance.
As an alternative expansion mechanism, the ejector is widely utilized due to its simple design, absence of moving parts, easy operation, and low maintenance requirements. The integration of an ejector into an ORC can reduce working fluid pumps power consumption. Wang et al. [25] conducted a comprehensive comparison of configurations, components, and working fluid options for small-scale solar ORC systems. The assessments considered a variety of solar collector types, different power cycle configurations, a range of expander types along with their respective designs, and a selection of suitable working fluids. Haghparast et al. [26] conducted a parametric optimization and evaluated the performance of an ejector integrated into an ORC. Sanaye et al. [27] proposed an innovative configuration combining an ejector refrigeration cycle with an ORC system for transformer cooling and power generation. In all the studies, the vapor produced by the second-stage evaporator was employed as the primary fluid for the ejector. The significance of this study lies in its innovative approach to enhancing the efficiency of solar-powered Organic Rankine Cycle (SORC) systems by integrating a vapor-liquid ejector, which has the potential to significantly reduce working fluid pumps power consumption and improve overall system performance. In present paper, vapor-liquid ejector serves as the primary fluid to entrain liquid from the condenser. The vapor of the working fluid at intermediate pressure, which is extracted from the expander, serves as the principal medium to entrain the liquid from the condenser. The vapor-liquid ejector not only reduces turbine backpressure but also enhances the working fluid pump inlet pressure. Initially, a comprehensive thermo-economic model of the PTC-ORC with the vapor-liquid ejector (SEORC) is established. Subsequently, a comparative analysis from both thermal and economic perspectives between the solar ORC (SORC) and SEORC is conducted. Finally, an investigation was conducted to assess the impact of critical operational parameters on system performance.
Fig. 1 illustrates the schematic diagram and temperature-entropy (T-s) of the SORC, with an extensive system description available in reference [28]. Fig. 2 presents the schematic diagram and the temperature-entropy (T-s) of the SEORC. The system predominantly comprises a PTC collector array, an evaporator, a turbine, a condenser, an ejector, and a working fluid pump. Syltherm 800 serves as the thermal transfer fluid, which is initially heated in the PTC collector and then proceeds to the evaporator to bring the working fluid to a saturated state. Noted for its broad operational range and resistance to pipe clogging, is ideal for this application. The working fluid experiences three stages: preheating (8–9), evaporation (9–10), and superheating (10–1), transforming into superheated vapor prior to entering the turbine. A portion of the vapor is throttled to intermediate pressure (1–6) and directed to the ejector as the primary flow, while the remainder continues to expand, generating work. The turbine’s exhaust is conveyed to the condenser, wherein the exhaust stream undergoes cooling and liquefaction facilitated by a precooling process using cooling water (2–3), condensation (3–4), and subcooling (4–5). The liquefied fluid then serves as the secondary flow for the ejector.
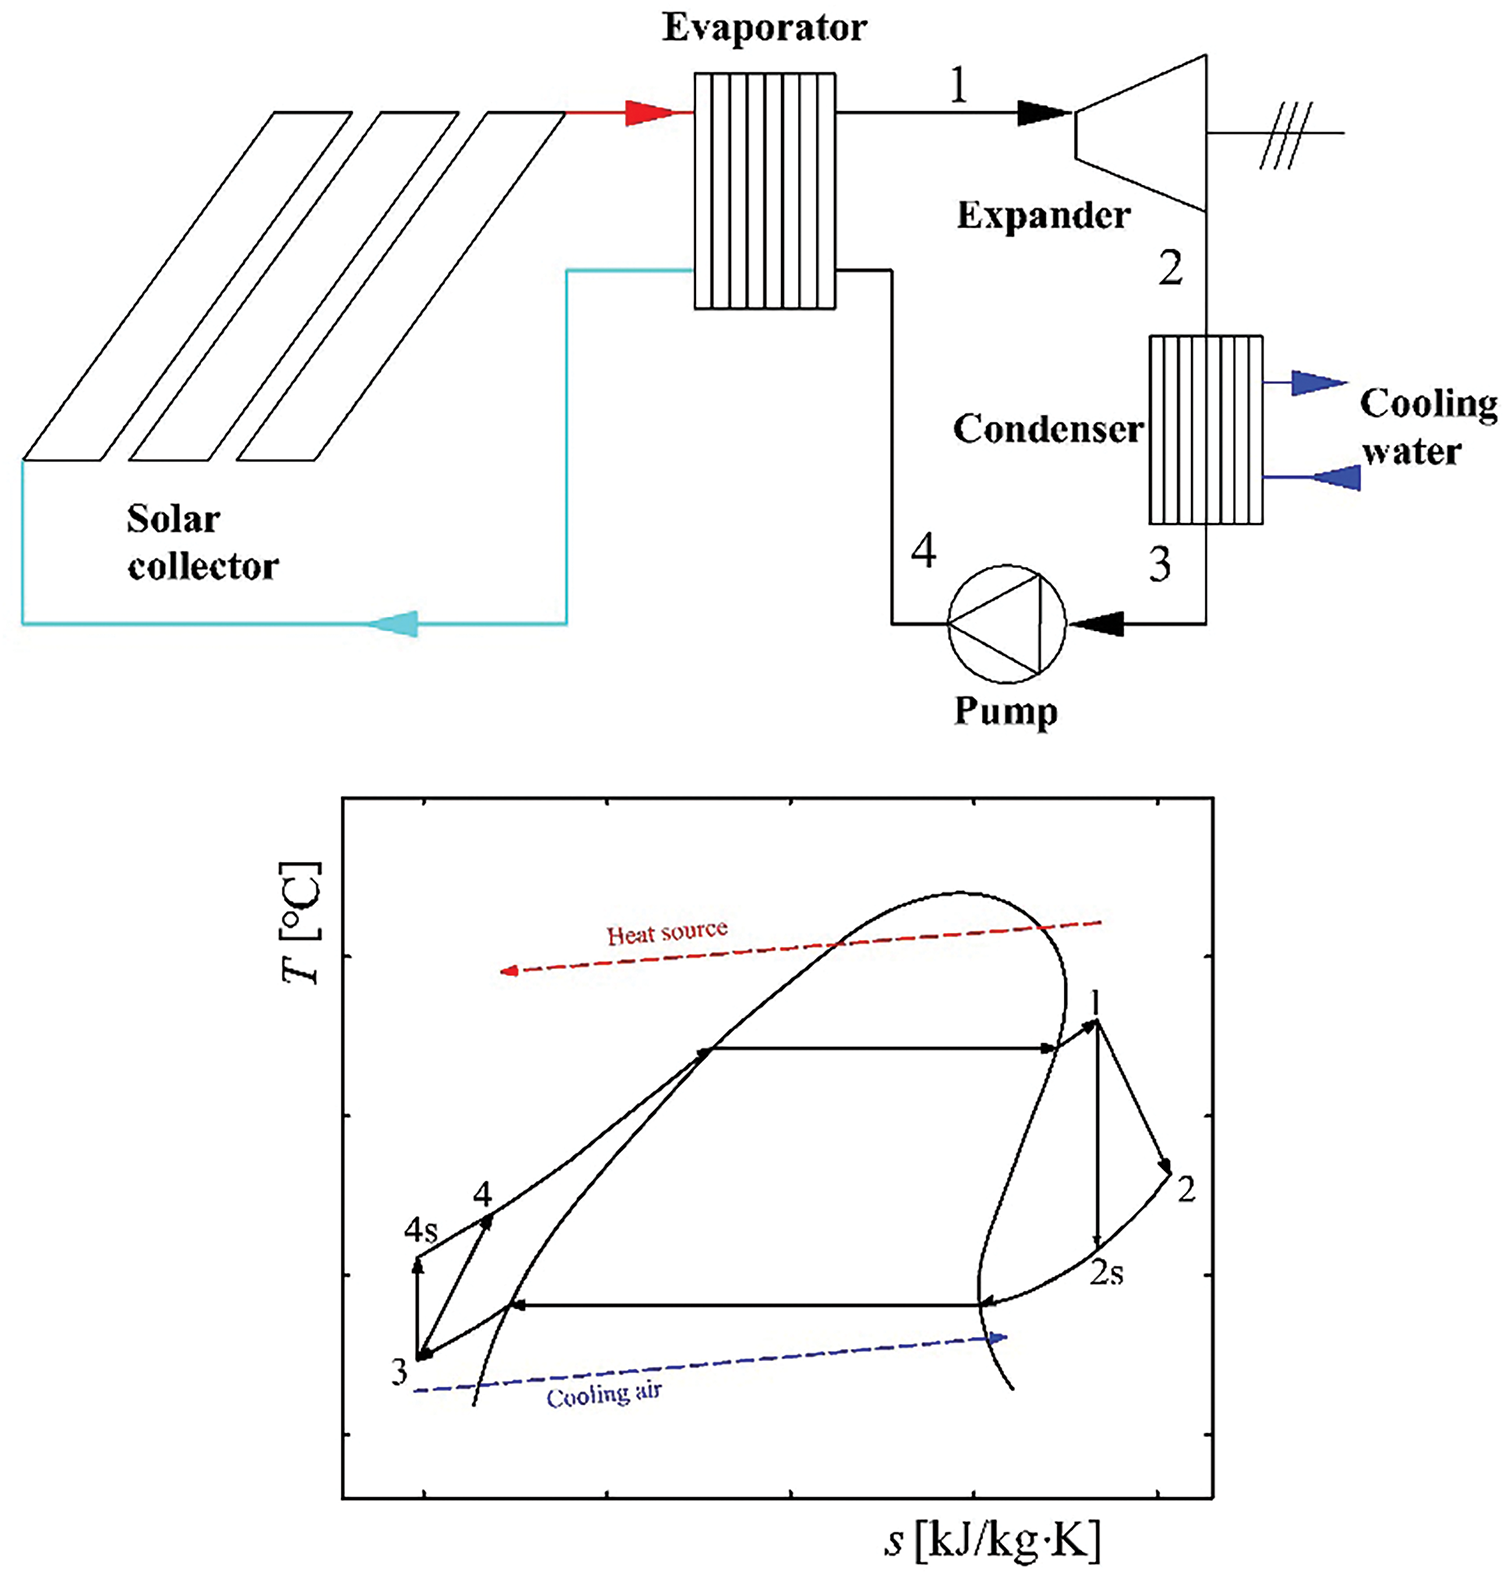
Figure 1: Schematic diagram and T-s chart of SORC
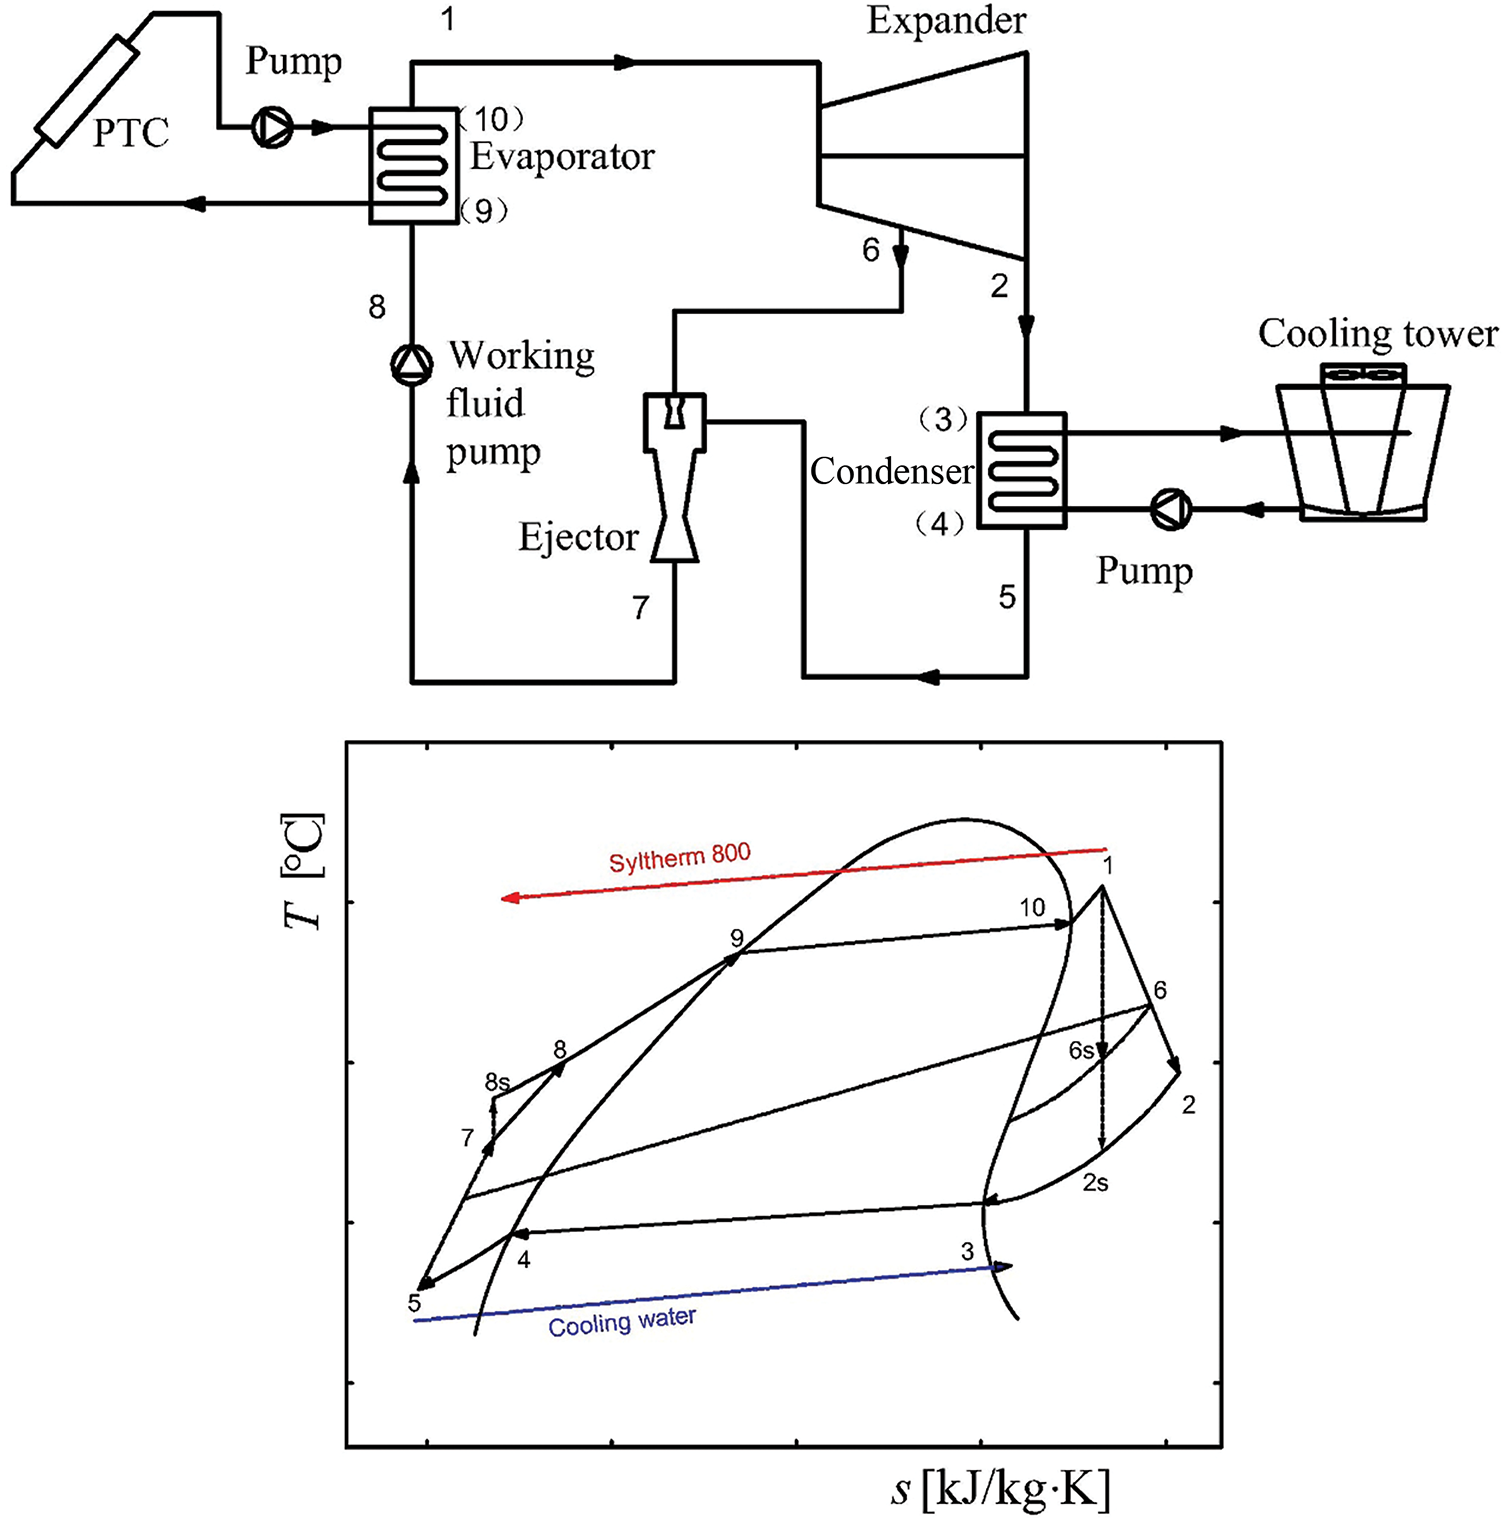
Figure 2: Schematic diagram and T-s chart of SEORC
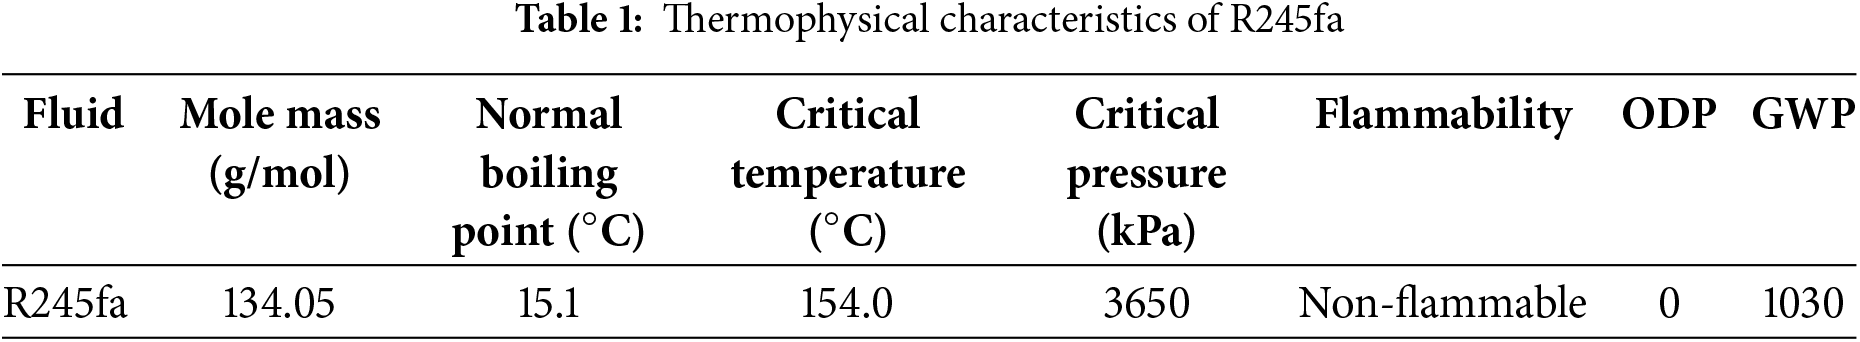
Fig. 3 illustrates schematic diagram of the ejector. The primary flow undergoes acceleration and expansion as it passes through the nozzle, resulting in the formation of a low-pressure zone at the inlet of the mixing chamber. Concurrently, the secondary flow is drawn into the mixing chamber by the action of vacuum and shear forces. Inside the mixing chamber, the primary flow condenses through direct contact heat transfer, leading to the formation of a uniform two-phase flow through vigorous mass, momentum, and heat exchange. At this stage, the two-phase flow is still supersonic and undergoes sudden compression, creating a strong condensation shock wave at the mixing chamber’s end, rapidly increasing the fluid pressure. Finally, the mixed fluid’s pressure rises further in the diffusion chamber, facilitating efficient heat transfer and pressurization. Following pressurization by the working fluid pump (7–8), the mixed fluid is channeled back to the evaporator to continue the cycle. The selection of R245fa as the working fluid is attributed to its superior thermal characteristics and favorable environmental profile [29], with a comprehensive overview of its thermophysical properties detailed in Table 1. The fluid properties in the simulation are calculated using the CoolProp library [30].
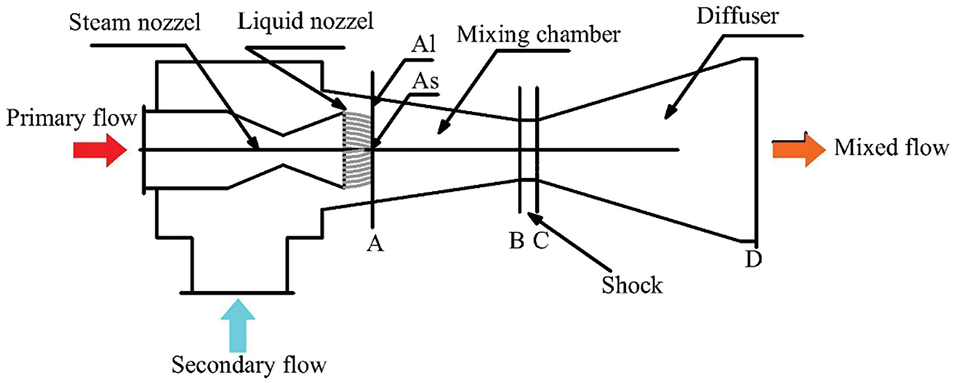
Figure 3: Schematic diagram of ejector
The following assumptions are made to simplify the analysis of SEORC:
(1) The system is modeled under steady-state conditions;
(2) Pressure and heat losses are neglected for all components, except in the turbine and pump;
(3) Friction losses, as well as the kinetic energy and potential energy of operating process are ignored;
(4) The incidence angle and surface temperature are assumed to zero and 5770 K;
(5) The ambient temperature and pressure are assumed to be 25°C and 101.325 kPa, respectively;
(6) The primary and secondary fluids are supplied to the ejector under stagnation state;
(7) The fluid at the exit of ejector is under stagnation state.
The available energy from the sun can be calculated by
where Q represents the heat transfer rate, kW; A is the area, m2; Gb indicates the solar beam radiation intensity, W/m2. The subscripts “ava” denotes available.
The PTC’s thermal efficiency is determined by [31,32]
where η signifies the thermal efficiency; T is temperature, °C. The subscripts “col”, “ave”, “am”, “in” and “out” denote the PTC, average, ambient, inlet and outlet, respectively.
The evaporator’s available energy is given by
The mass flow rate of Syltherm 800 in the PTC is expressed as
where m represents the mass flow rate, kg/s; Cp represents the specific heat capacity, kJ/(kg·K); T represents the temperature, °C; h represents the specific enthalpy, kJ/kg; the subscripts “syl” and “col” denote the syltherm 800 and solar collector, respectively.
The PTC’s input exergy is given by
The PTC’s output exergy is given by
where E is the available solar exergy, kW.
The exergy obtained by the solar radiation is given by
The PTC’s exergy efficiency is given by
where the subscript “ex” denotes exergy.
Vapor-liquid ejector model
Vapor-liquid ejectors are characterized by their ability to produce an outlet pressure that exceeds the primary flow pressure. Consequently, this feature can lead to a reduction in the working fluid pump powe consumption, and it allows for the anticipation of a more substantial net power output. The ejector features a central steam nozzle design. It is composed of three distinct sections: an intake section for drawing in the secondary fluid, a mixing chamber where the primary and secondary flows combine, and a diffuser that facilitates the pressure increase and flow transformation.
Steam nozzle
At the outlet of steam nozzle (section As), the pressure of primary flow is low, and the velocity is supersonic.
The primary flow pressure at section As is expressed as
where ps is the initial pressure of the primary flow, kPa; pAs is the primary flow pressure at section A, kPa; ε is the expansion rate assumed to be 0.25 [33].
The primary flow enthalpy at section As is expressed as
where hAs is the primary flow enthalpy, kJ/kg; hs represents the initial enthalpy of the primary flow, kJ/kg; hAs,s denotes the primary flow enthalpy during the isentropic process, kJ/kg; ηn,s is the steam nozzle’s isentropic efficiency.
The primary flow velocity at section As is given by
where uAs is velocity As, m/s.
The sectional area of section As is given by
where AAs is the area, m2; ms is the primary flow’s mass flow rate, kg/s; ρAs is the density, kg/m3.
Liquid nozzle
The secondary flow pressure at the outlet of liquid nozzle (section Al) is given by
where pAl is the secondary flow pressure, kPa.
The secondary flow enthalpy at section Al is given by
where hAl is the secondly flow enthalpy, kJ/kg; hl denotes the initial enthalpy of the secondary flow, kJ/kg; hAl,s represents the secondary flow enthalpy at section As during the isentropic process, kJ/kg; ηn,l is the liquid nozzle’s isentropic efficiency taken as 0.85 [34].
The secondary flow velocity at section Al is given by
where uAl is the secondary flow velocity at section Al, m/s.
The sectional area of section Al is given by
where AAl is the area, m2; ml is the secondary flow’s mass flow rate, kg/s; ρAl is the secondary flow density at section Al, kg/m3.
Mixing chamber before shock
The mixing chamber serves as the crucial component within the ejector, where the exchange of mass, momentum, and heat occurs between the vaporous and liquid phases of the working fluid.
The area of section B is given by
where AB is the area of section B, m2; RA,B is the section area ratio assumed to be 0.36.
The mass flow rate of section B is given by
where mB is the mixed working fluid’s mass flow rate, kg/s.
The mixed working fluid’s velocity is given by [35]
where μ is the entrainment ratio; ηmix is the mixing efficiency estimated at 0.95.
The mixed working fluid’s enthalpy at section B is given by
The mixed working fluid’s density at section B is given by
The mixed working fluid’s fraction dryness at section B is given by
where F denotes mixed working fluid’s fraction dryness, %; x is the dryness; ρl is the density of liquid-state part of the mixed working fluid, kg/m3; ρs is the density of steam-state part of the mixed working fluid, kg/m3.
The mixed working fluid’s sound velocity is given by
where usonic,m is the sound velocity, m/s; cs is the sound velocity of steam-state part of the mixed working fluid, m/s; cl is the sound velocity of liquid-state part of the mixed working fluid, m/s.
The Mach number at section B is given by
where MaB is the Mach number at section B.
The Mach number at section C is given by
where MaC is The Mach number at section C; k is heat capacity ratio.
The pressure at section C is given by
The velocity at section C is given by
The enthalpy at section C is given by
Diffuser
The pressure at section D is given by [36]
where ηdiff is the diffuser efficiency assumed to be 0.65.
The evaporator
The evaporator is the bridge between the PTC sub-system and the ORC sub-system. The energy conservation within the evaporator is described by
where m denotes the mass flow rate, kg/s; h denotes the specific enthalpy, kJ/kg; the subscripts “syl” and “wf” correspond to the syltherm 800 and working fluid, respectively. The numerical subscripts in these equations match those shown in Fig. 2.
The evaporator’s entropy generation is given by
where Sgen,e is the entropy generation, kW/K.
The evaporator’s entropy generation is given by
where Ie is the irreversible loss of the evaporator, kW.
The evaporator is structured into three distinct segments, namely preheating section, evaporation section and superheating section.
The thermal conductivity rate of the preheating section is given by
where KAe1 is thermal conductivity rate of the preheating section, W/°C; Δtpp is the pinch point difference, °C.
The thermal conductivity rate of the evaporation section is given by
where KAe2 is thermal conductivity rate of the evaporation section, W/°C.
The thermal conductivity rate of the superheating section is given by
where KAe3 is thermal conductivity rate of the superheating section, W/°C.
The Chisholm & Wanniarachchi correlation [37] is applied to determine the single-phase convective heat transfer coefficient for R245fa and water within the evaporator.
where dh denotes the hydraulic diameter, m; λ denotes coefficient of thermal conductivity, W/(m·K); β denotes the corrugation angle on the surface of a plate; Re denotes the Reynolds number; Pr denotes Prandtl number; φ denotes enlargment factor.
where Cp denotes the specific heat capacity, kJ/(kg·K); η denotes the viscosity, Pa·s.
where b is corrugation height, m; pco is corrugation pitch, m.
where G denotes the mass velocity kg/(m2·s).
where WN is plate width, m.
Han correlation [38] is used to calculate the two-phase flow boiling heat transfer coefficient of R245fa in the evaporator.
where Reeq denotes the equivalent Reynolds number, and Boeq denotes the equivalent boiling number.
where Ge1 and Ge2 are non-dimensional geometric parameters, respectively.
where xm denotes the vapor quality.
The power output of the turbine is given by
where W denotes the power, kW; ηt denotes the turbine’s isentropic efficiency.
The turbine’s entropy generation is given by
The turbine’s irreversible loss is given by
The thermal energy exchanged within the condenser is given by
The entropy generation of the condenser is given by
The irreversible loss of the condenser is given by
The condenser is structured into three distinct segments, namely precooling section, condensation section and subcooling section.
The thermal conductivity rate of the precooling section is given by
where KAc1 is thermal conductivity rate of the precooling section, W/°C.
The thermal conductivity rate of the condensation section is given by
where KAc2 is thermal conductivity rate of the condensation section, W/°C.
The thermal conductivity rate of the subcooling section is given by
where KAc3 is thermal conductivity rate of the condensation section, W/°C.
Eqs. (37)–(42) are used to calculate the single-phase heat transfer coefficient of R245fa and water in the condenser.
Longo correlation [39] is used to calculate the two-phase flow condensation heat transfer coefficient of R245fa in condenser.
If Re < 1600
If Re ≥ 1600
The pump consumed power is expressed as
The pump entropy generation is expressed as
The pump irreversible loss is expressed as
The gross power output is expressed as
The EORC’s thermal efficiency is expressed as
The SEORC’s thermal efficiency is expressed as
The EORC’s exergy efficiency is expressed as
The SEORC’s exergy efficiency is expressed as
The PTC investment cost is given by
In the SEORC system, a modular costing method is adopted to calculate the fundamental cost of each component, whereas the current capital expenditure is assessed using the Chemical Engineering Plant Cost Index (CEPCI).
The heat exchanger investment cost is given by
where Chx repsents the heat exchanger investment cost, $; CEPCI2001 and CEPCI2022 represent the chemical engineering plant cost index of 2001 and 2022, respectively; Fs is additional factor;
where K1,hx, K2,hx, C1,hx, C2,hx and C3,hx denote the constant values; Ahx represents the area of the plate-type heat exchanger, m2; Phx denotes the design pressure for a plate-type heat exchanger, bar.
The working fluid pump investment cost is given by
where Cpp is the pump investment cost, $; Fm,pp and Fp,pp are additional factor and pressure factor, respectively; Cpp0 denotes the basic cost, $.
where B1,pp, B2,pp, K1,pp, K2,pp, K3,pp, C1,pp, C2,pp and C3,pp denote the constant values; Ppp represents the pressure, bar; Wpp denotes power consumption, kW.
The turbine investment cost is given by
where Ct is turbine investment cost, $; Fm,t denotes the pressure factor;
Note that the costs of the ejector, valve, pipe and working fluid are ignored in present study, since their costs are much lower than those of other components [40]. Furthermore, the overall investment is comprised of additional costs and miscellaneous expenses, which are estimated at 15% and 3% of the initial investment cost, respectively [41].
The specific investment cost is given by
The capital recovery factor is expressed as [42]
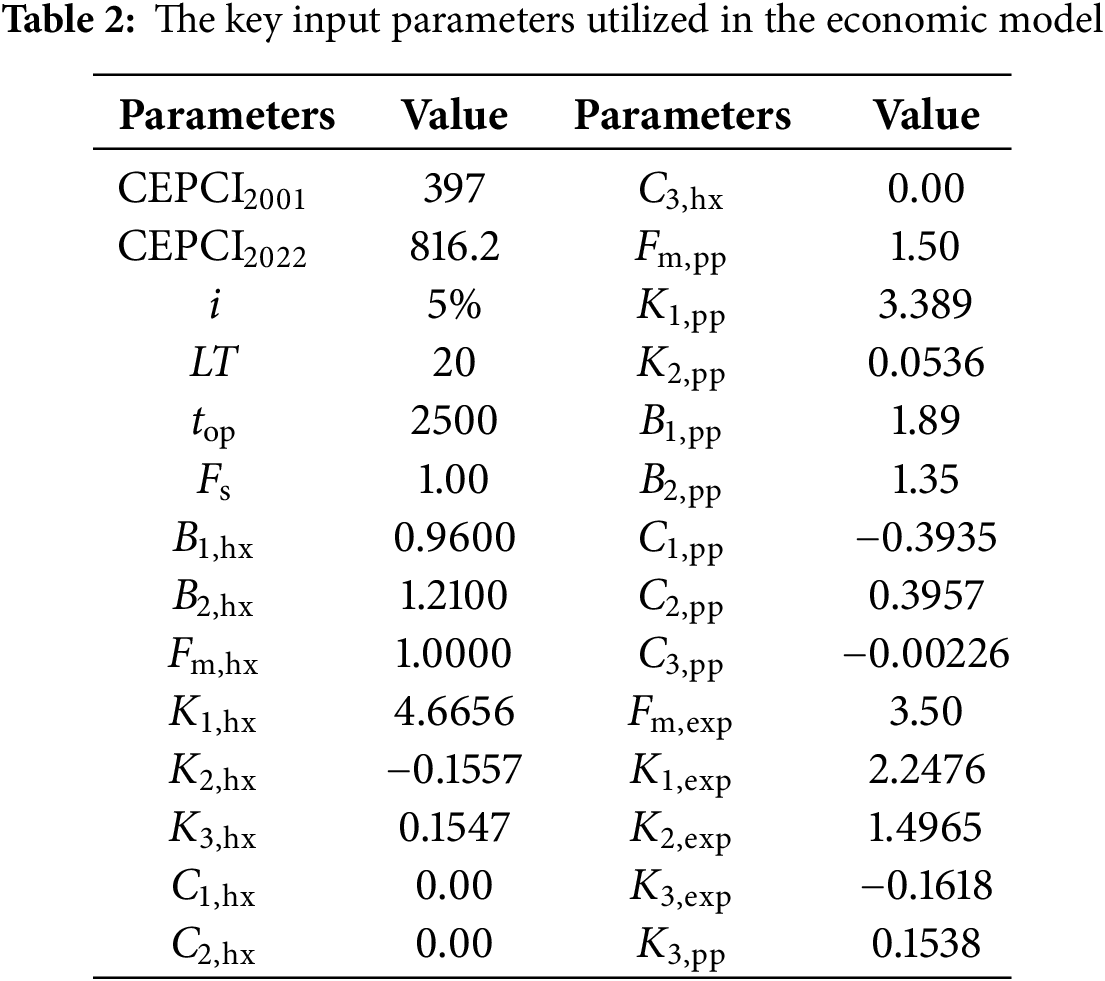
With the interest rate (i) set at 5% and the operational lifetime (LT) at 20 years, the levelized cost of energy is calculated as follows:
where Com represents the annual operation and maintenance cost, which is calculated at a rate of 1% of the total investment cost; top denotes the annual sunshine duration, estimated at 2500 h [43]. A comprehensive list of the parameters essential for the economic model is provided in Table 2, which enumerates the input parameters for the economic assessment.
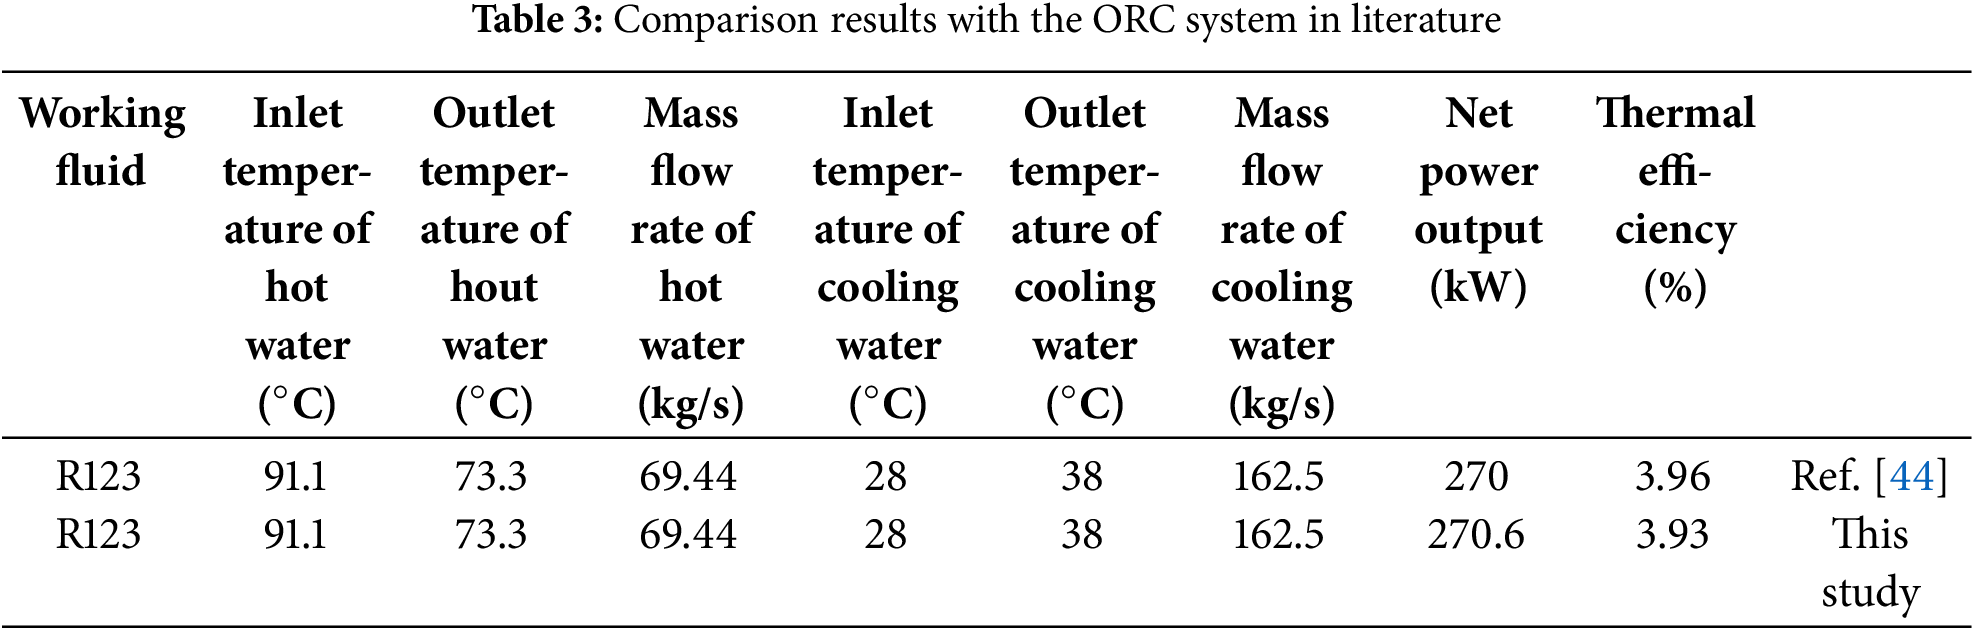
To evaluate the accuracy of the mathematical model developed for the ORC system in this research, a comparison was made between our findings and the data reported in the literature [44], under the same operational parameters as specified in Table 3. Our study’s net output power, at 270.6 kW, shows a mere 0.22% increase from the 270 kW reported in the literature. Similarly, our thermal efficiency of 3.93% is only a 0.76% reduction compared to the 3.96% efficiency documented in the literature. These results demonstrate that the thermodynamic model used in present study is sufficiently accurate for the investigation of ORC system cycle characteristics.
4.2 Model Validation of Injector Model
Utilizing the identical parameters from Yan et al.’s experiments as referenced in [33], this study’s injector model calculations were validated against the findings reported in the paper. Fig. 4 illustrates the model’s calculated outcomes in relation to the empirical data, with the relative error spanning from 0.227% to 11.75%, predominantly under 10%. This range of error suggests that the injector model possesses a degree of precision and dependability.
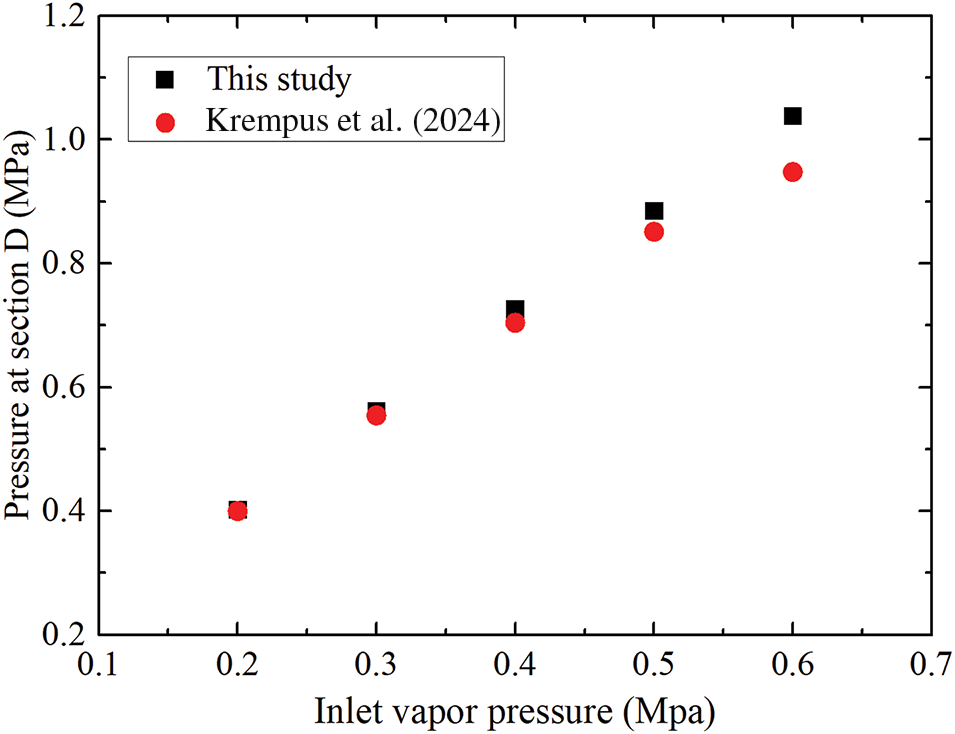
Figure 4: Injector model validation [45]
5.1 Effects of Solar Beam Radiation Intensity
Utilizing the model previously established, a comparative thermo-economic analysis of the SORC and SEORC systems has been conducted. Comprehensive details regarding the input parameters and boundary conditions are provided in Table 4. Furthermore, the effects of solar beam radiation intensity on the performance of both the SORC and SEORC systems are illustrated in Figs. 5 and 6.
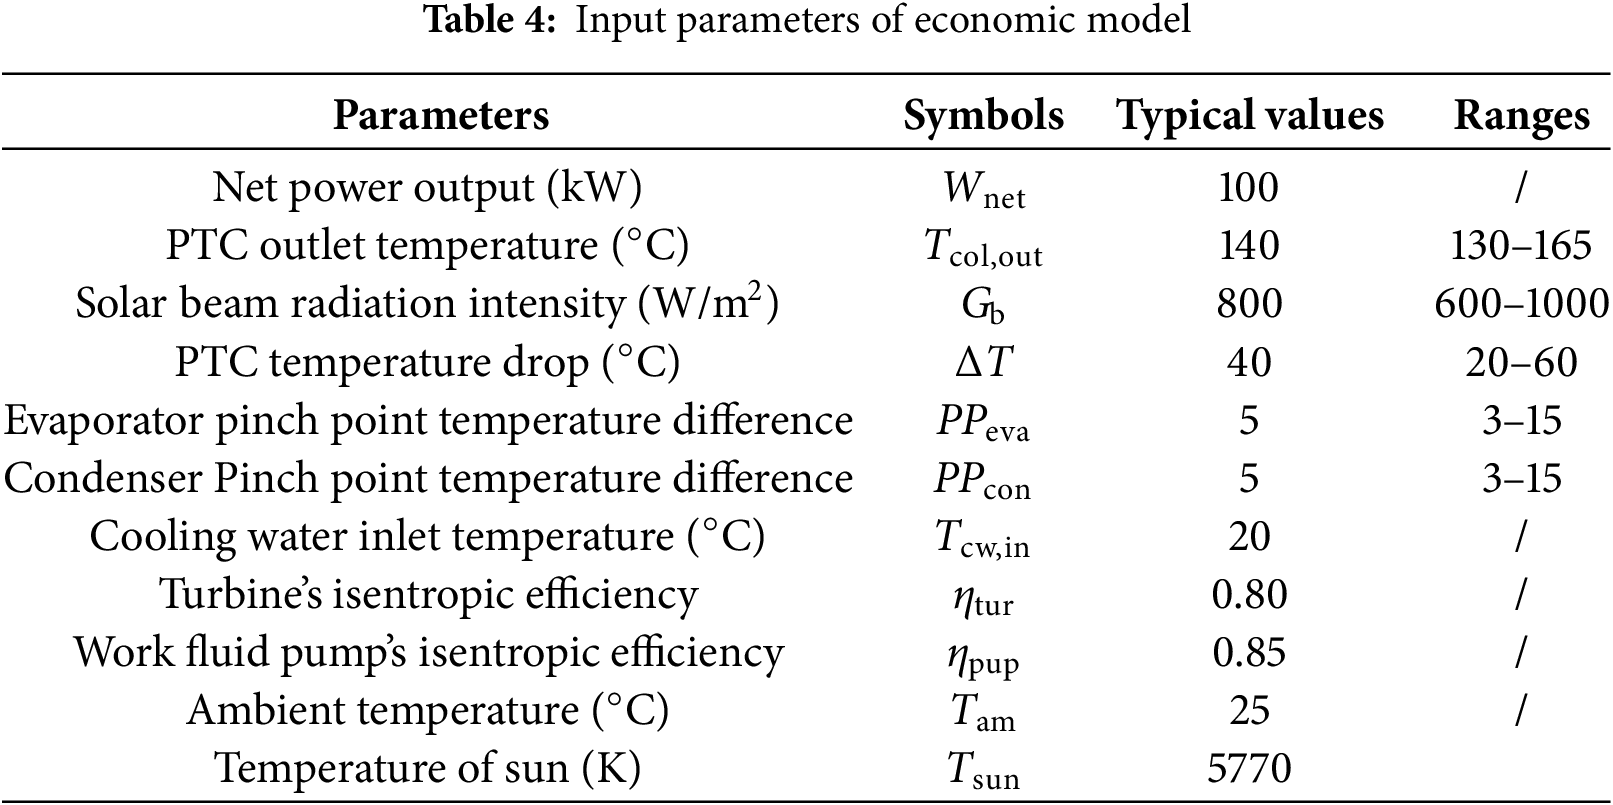
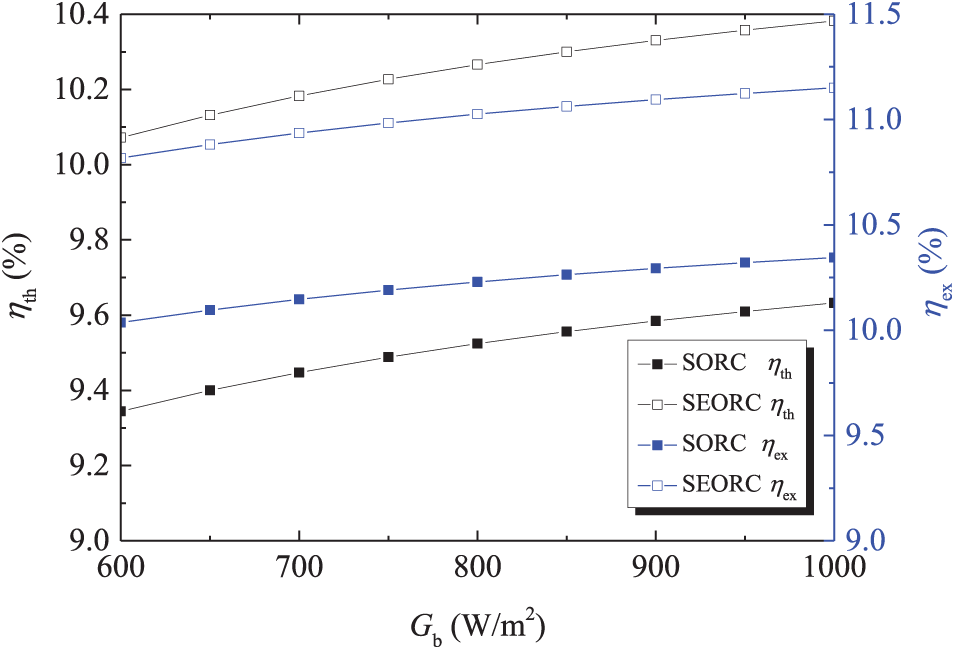
Figure 5: Variations of thermal efficiency and exergy efficiency with solar beam radiation intensity
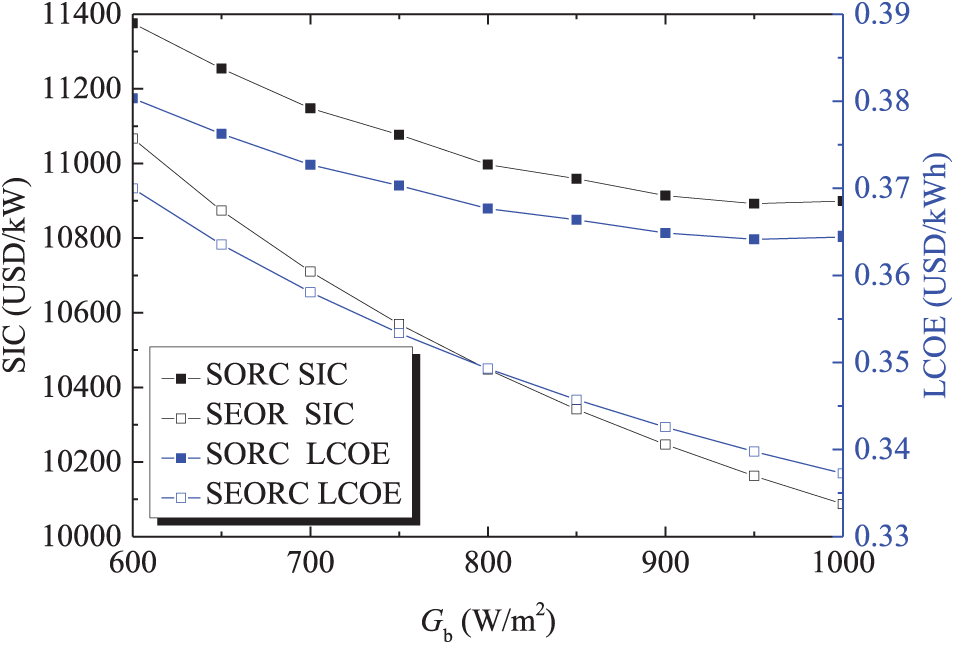
Figure 6: Variations of SIC and LCOE with solar beam radiation intensity
As observed in Fig. 3, it is anticipated that for the SORC and SEORC, a rise in solar beam radiation intensity leads to an increase in ηth and ηex. Within the operational parameters examined, the solar beam radiation intensity has no impact on the thermal efficiency and exergy efficiency for the ORC and EORC systems. Nevertheless, a higher solar beam radiation intensity is beneficial for improving the PTC efficiency. The ηth and ηex of SEORC surpass those of the SORC. This is attributed to the presence of the vapor-liquid ejector, which, on one hand, reduces the working fluid pump power consumption by decreasing the mass flow rate and increasing the pump’s inlet pressure, and on the other hand, lowers the turbine backpressure, leading to an increase in the specific enthalpy drop across the turbine. Consequently, higher thermal and exergy efficiencies are anticipated. The working fluid pump’s isentropic efficiency is assumed to be 0.85, which is significantly higher than the typical values observed in small-scale ORC systems [45]. That is to say the SEORC is more superior more than the SORC in the actual application. At a solar beam radiation intensity of 1000W/m², the SEORC’s thermal efficiency and exergy efficiency are 1.08 and 1.08 times as large as those of the SORC. As can be seen from Fig. 4, both the SIC and LCOE of the SORC and SEORC are decreased with the rising solar beam radiation intensity. Moreover, the solar beam radiation intensity has a more pronounced effect on the SORC, indicating that the SEORC is better suited for regions with lower solar beam radiation intensities.
5.2 Effects of PTC Temperature Drop
The influences of PTC temperature drop on the SORC and SEORC system performance are illustrated in Figs. 7 and 8. As observed in Fig. 6, with the rised ΔT, the ηth and ηex initially show a slight increase followed by a decline. Given the designed heat exchanger pinch point temperature difference, net power output, and PTC inlet temperature, a higher ΔT delivers more heat to the evaporator, leading to a reduction in evaporation temperature. Consequently, the thermal efficiency of the ORC system is diminished. According to Eq. (1), the PTC efficiency increses with the incrising of ΔT. The interplay of these factors accounts for the variation in ηth and ηex. An optimal ΔT exists at which both ηth and ηex are maximized. Across all investigated ΔT values, the efficiencies of SEORC surpass those of SORC. Under higher ΔT conditions, SEORC demonstrates greater superiority over ORC. When the ΔT reaches 50°C, the ηth of SEORC is 1.17 times larger than that of ORC. From Fig. 7, the SEORC yields better economic performance. For ΔT values below 20°C, the economic performance of SORC and SEORC is comparable. At a ΔT of 50°C, the SIC and LCOE for SEORC experience a 6.3% reduction compared to SORC.
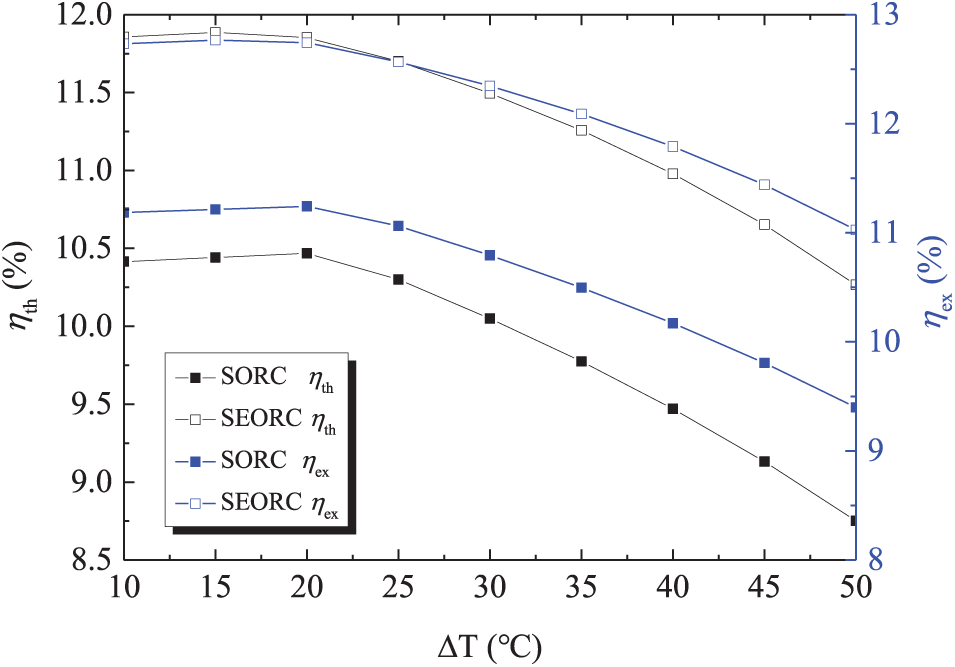
Figure 7: Variations of thermal efficiency and exergy efficiency with PTC temperature drop
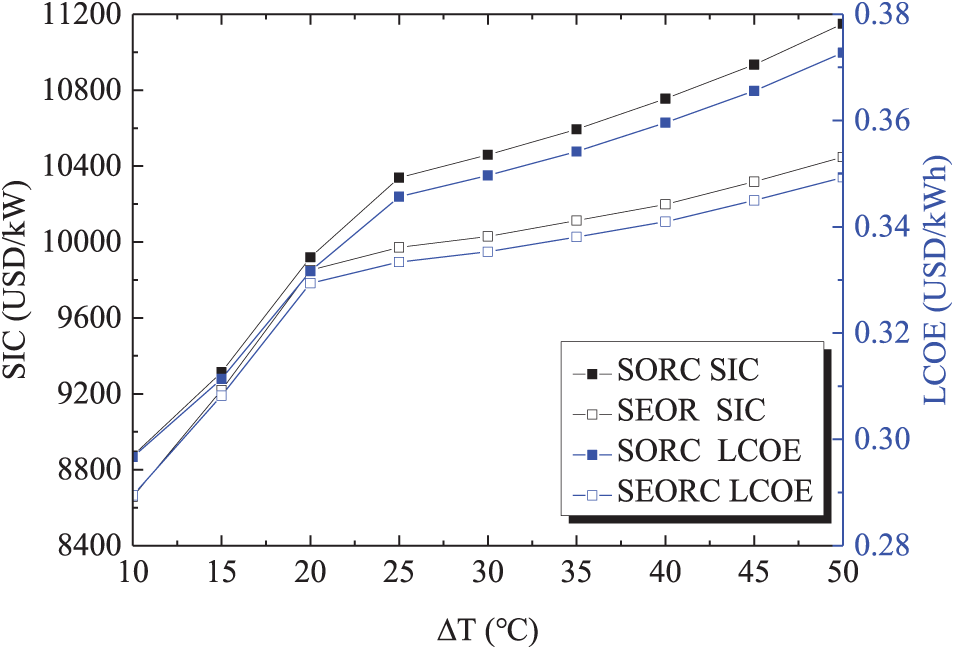
Figure 8: Variations of SIC and LCOE with PTC temperature drop
5.3 Effects of PTC Inlet Temperature
The influences of Tin on the SORC and SEORC system performance are depicted in Figs. 9 and 10. It is evident that for both systems, for the SORC and SEORC, Both the ηth and ηex exhibit an increasing trend in response to an increase in Tin. Under the typical working conditions, the PTC efficiency declines with a rise in Tin. Obviously, higher Tin is conductive to the evaporation temperature rising, leading to the improvement of ORC and EORC thermal efficiency and exergy efficiency. Nevertheless, the increments in the thermal and exergetic efficiencies of both ORC and EORC systems exceed the decrease in PTC efficiency. Due to the synergistic influence of these two factors, ηth and ηex of ORC and EORC both are increased. For SORC and SEORC, both the SIC and LCOE exhibit a downward trend as the Tin increases. With the net power output remains constant, higher values of Tin necessitate a reduction in the required heat exchanger and PTC areas. Notably, the efficiencies of SEORC consistently surpass those of SORC. As Tin increases, the ratio of SEORC’s ηth to SORC’s ηth ascends linearly. At a Tin of 165°C, the ηth of SEORC is 20% greater than that of SORC. In terms of economic performance, Tin exerts a more pronounced effect on the thermodynamic performance.
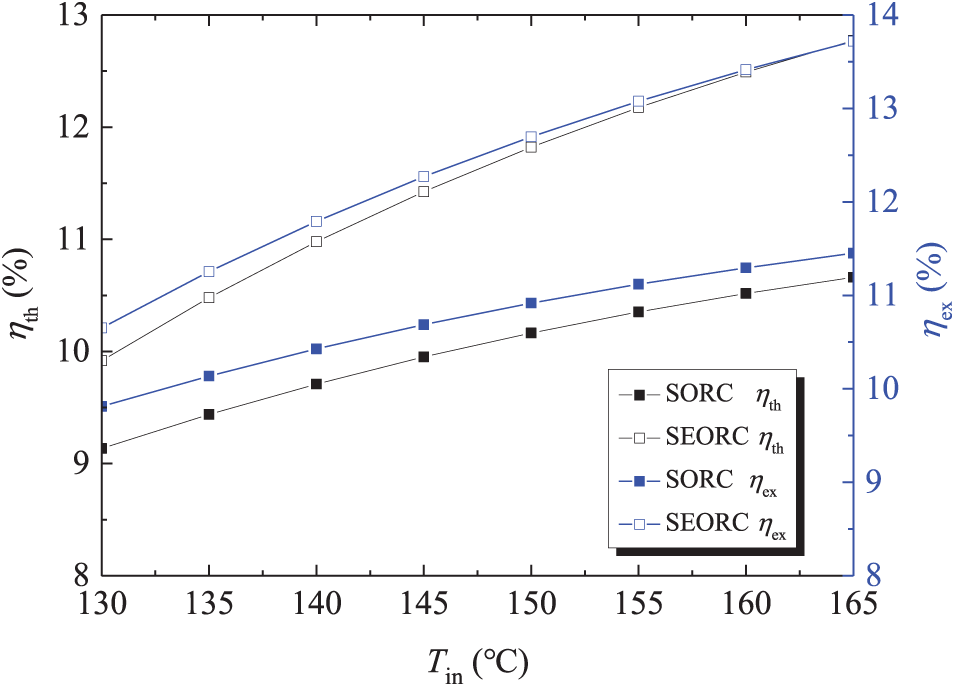
Figure 9: Variations of thermal efficiency and exergy efficiency with PTC inlet temperature
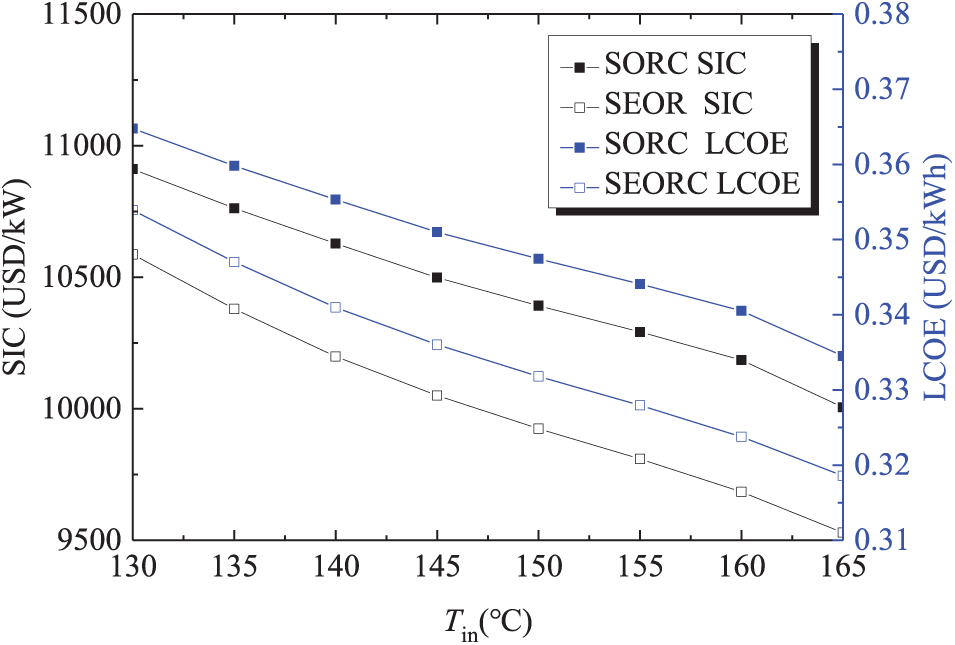
Figure 10: Variations of SIC and LCOE with PTC inlet temperature
5.4 Effects of Evaporator Pinch Point Temperature Difference
The influences of PPeva on the on the SORC and SEORC system performance are depicted in Figs. 11 and 12. It is observable that an increase in PPeva leads to a decline in both in ηth and ηex are decreased. Under the working condition investigated, the improvement of PPeva has no impact on the PTC efficiency, but will lead to an decrease in the evaporation temperature, which causes the decreasing of the ηth and ηex. The PPeva has larger impact on the ηth and ηex of SEORC than those of SORC. The increased PPeva also causes the decreasing of the SIC and LCOE with decreased reduction rate. Given a set net power output, the decreased ηth necessitates a greater heat input into the evaporator. Based on the energy balance within the evaporator, the area required is dependent on both the PPeva and the total heat input. The dual effect on the heat exchanger area accounts for the fluctuations in SIC and LCOE. When PPeva exceeds 12°C, its influence on SIC and LCOE becomes marginal. That is to say the PPeva should not surpass 12°C under the working conditions in this study. It is evident that it is not viable to achieve maximum thermodynamic performance (ηth and ηex) and minimum economic performance (SIC and LCOE), simultaneously.
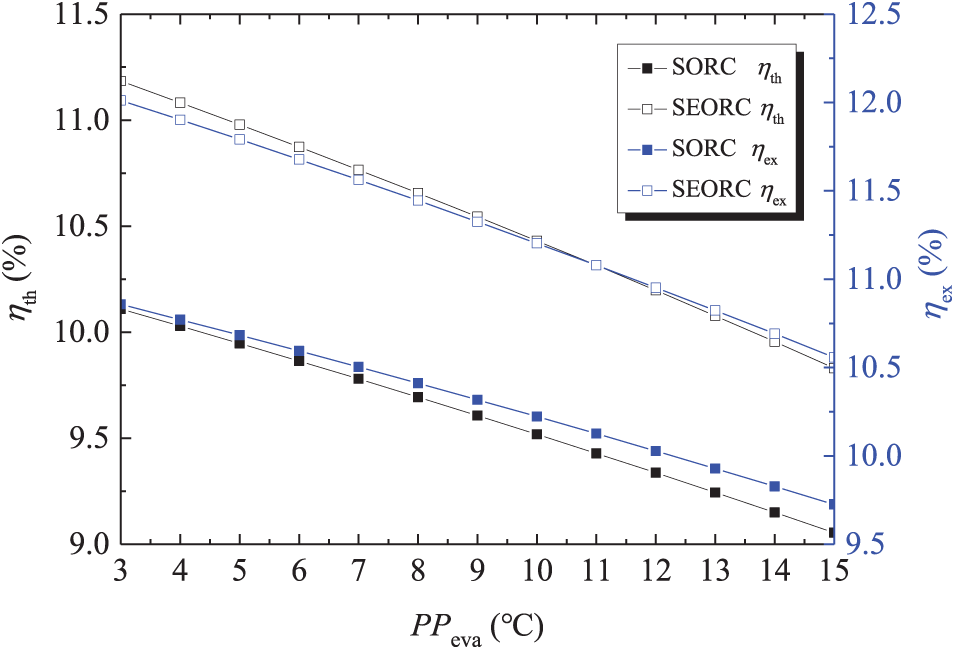
Figure 11: Variations of thermal efficiency and exergy efficiency with evaporator pinch point temperature difference
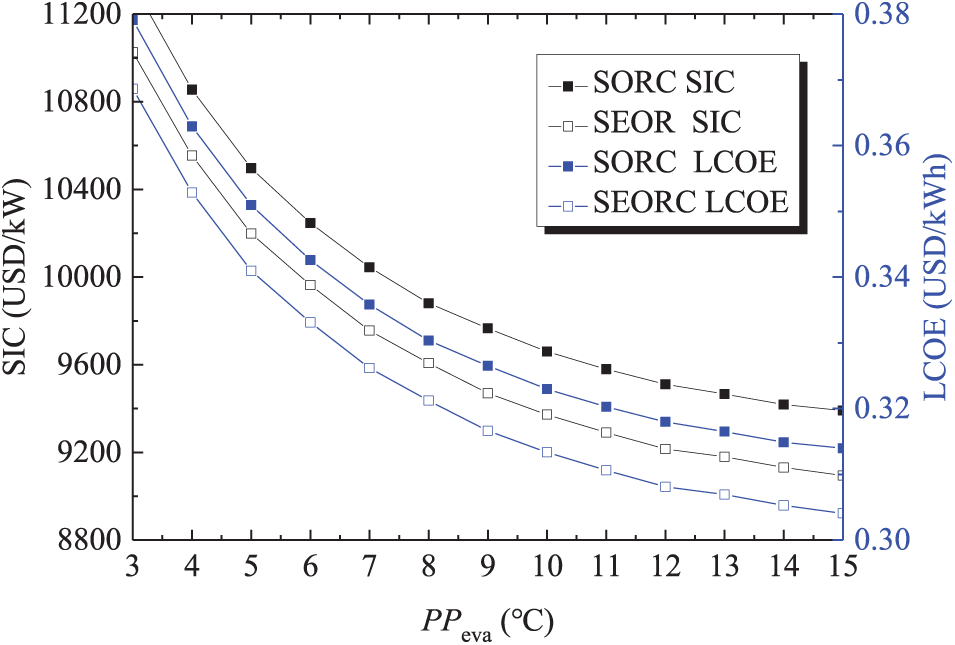
Figure 12: Variations of SIC and LCOE with evaporator pinch point temperature difference
5.5 Effects of Condenser Pinch Point Temperature Difference
The influences of PPcon on the on the SORC and SEORC system performance are charted in Figs. 13 and 14. It is observed that, in accordance with expectations, for both SORC and SEORC, the ηth and ηex exhibit a linear decline as PPcon increases, which is attributable to the rise in condensation temperature. The PPcon has larger impact on the ηth and ηex of SEORC than those of SORC. While the SIC and LCOE both exhibit an initial reduction followed by an increase as PPcon rises. At a PPcon of 10°C, the SIC and LCOE reach the minimum values. The rationale behind this trend is analogous to that of PPcon, while the PPcon has different effect degree on the total input heat and heat exchanger area. Relative to PPeva, the PPcon wields a more pronounced effect on ηth and ηex.
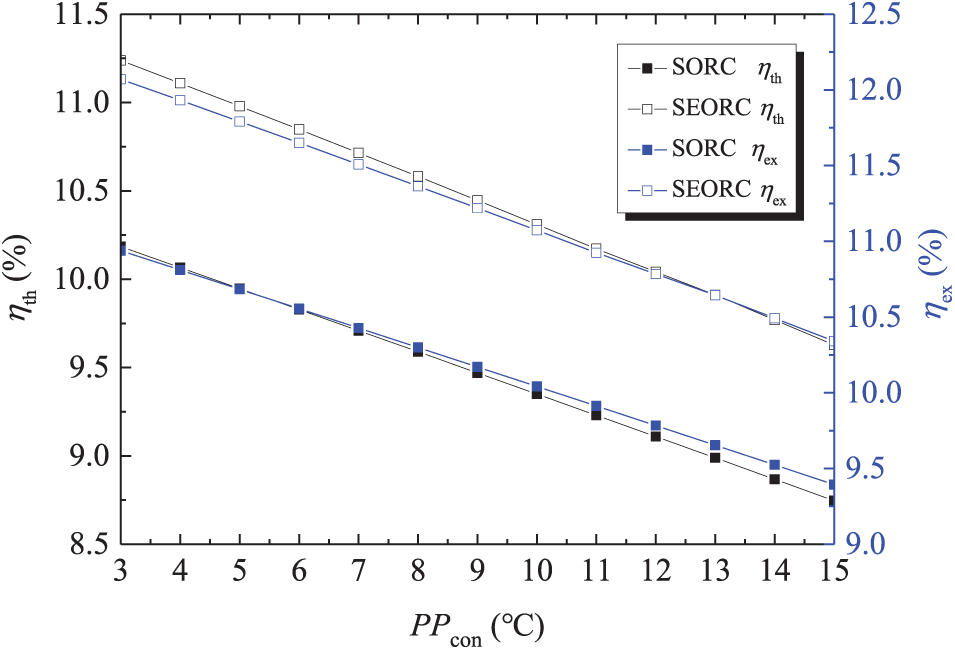
Figure 13: Variations of thermal efficiency and exergy efficiency with condenser pinch point temperature difference
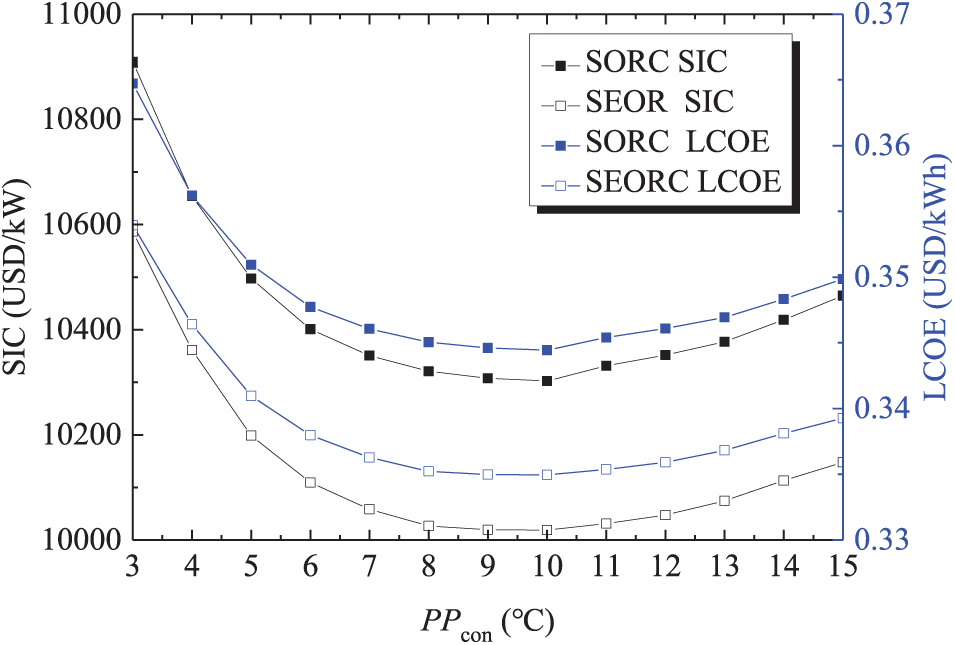
Figure 14: Variations of SIC and LCOE with condenser pinch point temperature difference
In the present study, a vapor-liquid ejector has been integrated into the PTC-driven ORC system to reduce the working fluid pump power consumption and to alleviate turbine backpressure. A detailed thermo-economic model has been developed. The thermodynamic and economic comparison between the SORC and SEORC are conducted. The study also explores the effects of solar beam radiation intensity, PTC temperature drop, evaporator pinch point temperature difference, and condenser pinch point temperature difference on thermal efficiency, exergy efficiency, specific investment cost, and levelized cost of energy. The conclusions drawn are as follows:
(1) The SEORC consistently demonstrates superior thermo-economic performance compared to the SORC, particularly when the working fluid pump exhibits lower isentropic efficiency. At a solar beam radiation intensity of 1000W/m2, the SEORC’s ηth and ηex are 1.08 and 1.08 times as large as those of the SORC. An increase in solar beam radiation intensity enhances system performance.
(2) There is an optimal ΔT at which ηth and ηex achieves the maximum. At higher ΔT values, the SEORC shows greater superiority over the ORC. At a ΔT of 50°C, the ηth of SEORC is 1.17 times larger than that of ORC. Similarly, at a ΔT of 50°C, the SIC and LCOE for the SEORC decrease by 6.3% compared to the SORC.
(3) An increase in Tin is conductive to the system thermo-economic performance. With high Tin, the SEORC is more excellent than the SORC. The Tin has a more profound impact on thermodynamic performance than on economic performance.
(4) A rise in PPeva will reduce the ηth and ηex of the SORC and SEORC. However, this increase in PPeva concurrently leads to a reduction in the required heat exchanger area, which in turn enhances the SIC and LCOE. When PPeva exceeds 12°C, the PPeva has minor impact on SIC and LCOE. In other words, the PPeva should not exceed 12°C under the working conditions considered in this study.
(5) In contrast to PPeva, PPcon has different influence on the system performance. A higher PPcon leads to lower ηth and ηex. When the PPcon is 10°C, the SIC and LCOE reach the minimum values. Compared to PPeva, the PPcon has a more significant impact on the ηth and ηex.
Acknowledgement: Not applicable.
Funding Statement: This research was funded by Natural Science Foundation of Guangdong Province, grant number 2024A1515030130, and National Natural Science Foundation of China, grant number 42102336.
Author Contributions: Conceptualization, Lingbao Wang and Zuowei Yang; methodology, Lingbao Wang and Zuowei Yang; software, Zhi Gan and Huashan Li; validation, Zhi Gan and Huashan Li; formal analysis, Yulie Gong and Xianbiao Bu; investigation, Huashan Li; resources, Xianbiao Bu; data curation, Zhi Gan; writing—original draft preparation, Lingbao Wang; writing—review and editing, Xianbiao Bu; visualization, Yulie Gong; supervision, Zuowei Yang; project administration, Yulie Gong; funding acquisition, Lingbao Wang. All authors reviewed the results and approved the final version of the manuscript.
Availability of Data and Materials: The data that support the findings of this study are available from the corresponding author, Yang Z.W., upon reasonable request.
Ethics Approval: Not applicable.
Conflicts of Interest: The authors declare no conflicts of interest to report regarding the present study.
Nomenclature
| Symbols | |
| A | Heat exchanger area (m2) |
| C | Investment cost (USD) |
| c1 | Sound velocity (m/s) |
| cp | Specific heat capacity (kJ/kg·K−1) |
| E | Available solar exergy (kW) |
| Gb | Solar beam radiation intensity (W/m2) |
| h | Specific enthalpy (kJ/kg) |
| i | Annual loan interest rate |
| I | Irreversible loss, kW |
| KA | Thermal conductivity rate, W/K |
| m | Mass flow rate (kg/s) |
| Ma | Mach number |
| P | Pressure (kPa) |
| Q | Heat transfer rate (kW) |
| R | Section area ratio |
| S | Entropy generation (kW/K) |
| T | Temperature (oC) |
| U | Flow velocity (m/s) |
| VF | Fraction dryness of mixed working fluid |
| W | Work (kW) |
| x | Dryness of the working fluid |
| ΔT | Logarithmic temperature difference (°C) |
| Greek | |
| η | Efficiency |
| k | Heat capacity ratio |
| λ | Coefficient of thermal conductivity (W/(m·K)) |
| ρ | Density (kg/m3) |
| μ | Viscosity (Pa·s) |
| ε | Efficiency |
| Subscripts | |
| 0 | Ambient condition |
| 1, 2, …, 12 | State points |
| am | Ambient |
| ava | Available |
| ave | Average |
| cw | Cooling water |
| c | Condenser |
| col | Parabolic trough collector |
| e | Evaporator |
| ex | Exergy |
| hx | Heat exchanger |
| in | Inlet |
| net | Net power output |
| out | Outlet |
| p | Working fluid pump |
| s | Isentropic process |
| syl | Syltherm 800 |
| t | Turbine |
| tot | Total |
| th | Thermal |
| u | Useful |
| wf | Working fluid |
| Acronyms | |
| CEPCI | Chemical engineering plant cost index |
| CRF | Capital recovery factor |
| GWP | Global warming potential |
| EORC | Ejector organic Rankine cycle |
| ODP | Ozone depletion potential |
| PTC | Parabolic trough collector |
| SIC | Specific investment cost |
References
1. Sufyanullah K, Ahmad KA, Ali MAS. Does emission of carbon dioxide is impacted by urbanization? An empirical study of urbanization, energy consumption, economic growth and carbon emissions-using ARDL bound testing approach. Ener Poli. 2022;164:112908. doi:10.1016/j.enpol.2022.112908. [Google Scholar] [CrossRef]
2. Zhao X, Ma X, Chen B, Shang Y, Song M. Challenges toward carbon neutrality in China: strategies and counter measures. Resourc Conservat Recycl. 2022;176:105959. doi:10.1016/j.resconrec.2021.105959. [Google Scholar] [CrossRef]
3. Obaideen K, AlMallahi MN, Alami AH, Ramadan M, Abdelkareem MA, Shehata N, et al. On the contribution of solar energy to sustainable developments goals: case study on Mohammed bin Rashid Al Maktoum Solar Park. Int J Thermofluids. 2021;12:100123. doi:10.1016/j.ijft.2021.100123. [Google Scholar] [CrossRef]
4. Fan G, Song J, Zhang J, Fu Z, Gong X, Dai Y, et al. Thermo-economic assessment and systematic comparison of combined supercritical CO2 and organic Rankine cycle (SCO2-ORC) systems for solar power tower plants. Appl Therm Eng. 2024;236:121715. doi:10.1016/j.applthermaleng.2023.121715. [Google Scholar] [CrossRef]
5. Gharat PV, Bhalekar SS, Dalvi VH, Panse SV, Deshmukh SP, Joshi JB. Chronological development of innovations in reflector systems of parabolic trough solar collector (PTC)—a review. Renew Sustain Energ Rev. 2021;145:111002. doi:10.1016/j.rser.2021.111002. [Google Scholar] [CrossRef]
6. Rayegan R, Tao YX. A procedure to select working fluids for Solar Organic Rankine Cycles (ORCs). Renew Energy. 2011;36(2):659–70. doi:10.1016/j.renene.2010.07.010. [Google Scholar] [CrossRef]
7. Desai NB, Bandyopadhyay S. Thermo-economic analysis and selection of working fluid for solar organic Rankine cycle. Appl Therm Eng. 2016;95(7):471–81. doi:10.1016/j.applthermaleng.2015.11.018. [Google Scholar] [CrossRef]
8. Soulis KX, Manolakos D, Ntavou E, Kosmadakis G. A geospatial analysis approach for the operational assessment of solar ORC systems: case study—performance evaluation of a two-stage solar ORC engine in Greece. Renew Energy. 2022;181:116–28. doi:10.1016/j.renene.2021.09.046. [Google Scholar] [CrossRef]
9. Calise F, Capuozzo C, Carotenuto A, Vanoli L. Thermoeconomic analysis and off-design performance of an organic Rankine cycle powered by medium-temperature heat sources. Sol Energy. 2014;103:595–609. doi:10.1016/j.solener.2013.09.031. [Google Scholar] [CrossRef]
10. Roumpedakis TC, Loumpardis G, Monokrousou E, Braimakis K, Charalampidis A, Karellas S. Exergetic and economic analysis of a solar driven small scale ORC. Renew Energy. 2020;157:1008–24. doi:10.1016/j.renene.2020.05.016. [Google Scholar] [CrossRef]
11. Georgousis N, Lykas P, Bellos E, Tzivanidis C. Multi-objective optimization of a solar-driven polygeneration system based on CO2 working fluid. Energy Convers Manag. 2022;252:115136. doi:10.1016/j.enconman.2021.115136. [Google Scholar] [CrossRef]
12. Javed S, Tiwari AK. Performance assessment of different Organic Rankine Cycle (ORC) configurations driven by solar energy. Process Saf Environ Prot. 2023;171:655–66. doi:10.1016/j.psep.2023.01.039. [Google Scholar] [CrossRef]
13. Freeman J, Hellgardt K, Markides CN. An assessment of solar-powered organic Rankine cycle systems for combined heating and power in UK domestic applications. Appl Energy. 2015;138:605–20. doi:10.1016/j.apenergy.2014.10.035. [Google Scholar] [CrossRef]
14. Bellos E, Tzivanidis C. Parametric analysis and optimization of a solar driven trigeneration system based on ORC and absorption heat pump. J Clean Prod. 2017;161:493–509. doi:10.1016/j.jclepro.2017.05.159. [Google Scholar] [CrossRef]
15. Jafary S, Khalilarya S, Shawabkeh A, Wae-hayee M, Hashemian M. A complete energetic and exergetic analysis of a solar powered trigeneration system with two novel organic Rankine cycle (ORC) configurations. J Clean Prod. 2021;281:124552. doi:10.1016/j.jclepro.2020.124552. [Google Scholar] [CrossRef]
16. Giménez-Prades P, Navarro-Esbrí J, Arpagaus C, Fernández-Moreno A, Mota-Babiloni A. Novel molecules as working fluids for refrigeration, heat pump, and organic Rankine cycle systems. Renew Sustain Energ Rev. 2022;167(12):112549. doi:10.1016/j.rser.2022.112549. [Google Scholar] [CrossRef]
17. Krail J, Beckmann G, Schittl F, Piringer G. Comparative thermodynamic analysis of an improved ORC process with integrated injection of process fluid. Energy. 2023;266:126352. doi:10.1016/j.energy.2022.126352. [Google Scholar] [CrossRef]
18. Tahir MBINM, Yamada N. Characteristics of small ORC system for low-temperature waste heat recovery. J Environ Eng. 2009;4(2):375–85. doi:10.1299/jee.4.375. [Google Scholar] [CrossRef]
19. Quoilin S, Van Den Broek M, Declaye S, Dewallef P, Lemort V. Techno-economic survey of organic Rankine cycle (ORC) systems. Renew Sustain Energ Rev. 2013;22(3):168–86. doi:10.1016/j.rser.2013.01.028. [Google Scholar] [CrossRef]
20. Zhang X, Zhang Y, Wang J. Evaluation and selection of dry and isentropic working fluids based on their pump performance in small-scale organic Rankine cycle. Appl Therm Eng. 2021;191:116919. doi:10.1016/j.applthermaleng.2021.116919. [Google Scholar] [CrossRef]
21. Jiang L, Lu HT, Wang LW, Gao P, Zhu FQ, Wang RZ, et al. Investigation on a small-scale pumpless Organic Rankine Cycle (ORC) system driven by the low-temperature heat source. Appl Energy. 2017;195(1):478–86. doi:10.1016/j.apenergy.2017.03.082. [Google Scholar] [CrossRef]
22. Yang Y, Zhang H, Xu Y, Yang F, Wu Y, Lei B. Matching and operating characteristics of working fluid pumps with organic Rankine cycle system. Appl Therm Eng. 2018;142(21):622–31. doi:10.1016/j.applthermaleng.2018.07.039. [Google Scholar] [CrossRef]
23. Doninelli M, Di Marcoberardino G, Iora P, Gelfi M, Invernizzi CM, Manzolini G. Silicon Tetrachloride as innovative working fluid for high-temperature Rankine cycles: thermal stability, material compatibility, and energy analysis. Appl Therm Eng. 2024;249:123239. doi:10.1016/j.applthermaleng.2024.123239. [Google Scholar] [CrossRef]
24. Saadon S, Mohd Nasir NA. Performance and sustainability analysis of an organic Rankine cycle system in subcritical and supercritical conditions for waste heat recovery. Energies. 2020;13(12):3035. doi:10.3390/en13123035. [Google Scholar] [CrossRef]
25. Wang Y, Song J, Chatzopoulou MA, Sunny N, Simpson MC, Wang J, et al. A holistic thermoeconomic assessment of small-scale, distributed solar organic Rankine cycle (ORC) systems: comprehensive comparison of configurations, component, and working fluid selection. Energy Convers Manag. 2021;248(5):114618. doi:10.1016/j.enconman.2021.114618. [Google Scholar] [CrossRef]
26. Haghparast P, Sorin MV, Richard MA, Nesreddine N. Analysis and design optimization of an ejector integrated into an organic Rankine cycle. Appl Therm Eng. 2019;159(4):113979. doi:10.1016/j.applthermaleng.2019.113979. [Google Scholar] [CrossRef]
27. Sanaye S, Refahi A. A novel configuration of ejector refrigeration cycle coupled with organic Rankine cycle for transformer and space cooling applications. Int J Refrig. 2020;115(6):191–208. doi:10.1016/j.ijrefrig.2020.02.005. [Google Scholar] [CrossRef]
28. Loni R, Mahian O, Markides CN, Bellos E, Le Roux WG, Kasaeian A, et al. A review of solar-driven organic Rankine cycles: recent challenges and future outlook. Renew Sustain Energ Rev. 2021;150:111410. doi:10.1016/j.rser.2021.111410. [Google Scholar] [CrossRef]
29. Wang S, Liu C, Li Q, Liu L, Huo E, Zhang C. Selection principle of working fluid for organic Rankine cycle based on environmental benefits and economic performance. Appl Therm Eng. 2020;178:115598. doi:10.1016/j.applthermaleng.2020.115598. [Google Scholar] [CrossRef]
30. Bell IH, Wronski J, Quoilin S, Lemort V. Pure and pseudo-pure fluid thermophysical property evaluation and the open-source thermophysical property library CoolProp. Indust Eng Chem Res. 2014;53(6):2498–508. doi:10.1021/ie4033999. [Google Scholar] [PubMed] [CrossRef]
31. Kalogirou SA. Solar thermal collectors and applications. Prog Energy Combust Sci. 2004;30:231–95. doi:10.1016/j.pecs.2004.02.001. [Google Scholar] [CrossRef]
32. Dudley VE, Evans LR, Matthews CW. Test results, industrial solar technology parabolic trough solar collector (SAND94-1117). Albuquerque, NM, USA: Sandia National Laboratory; 1995. [Google Scholar]
33. Yan YJ, Shao SF, Liu JP, Zhang Z. Experiment and analysis on performance of steam-driven jet injector for district-heating system. Appl Therm Eng. 2005;25(8–9):1153–67. doi:10.1016/j.applthermaleng.2004.09.001. [Google Scholar] [CrossRef]
34. Chen Z, Liu G, Zhao H, Deng J. Analysis of the internal flow features of a CO2 transonic nozzle and optimization of the nozzle shape profile. Appl Therm Eng. 2024;238:121945. doi:10.1016/j.applthermaleng.2023.121945. [Google Scholar] [CrossRef]
35. Chen JY, Havtun H, Palm B. Investigation of ejectors in refrigeration system: optimum performance evaluation and ejector area ratios perspectives. Appl Therm Eng. 2014;64(1–2):182–91. doi:10.1016/j.applthermaleng.2013.12.034. [Google Scholar] [CrossRef]
36. Chen JY, Huang YS, Niu ZT, Luo XL, Chen Y, Yang Z. Investigation of vapor-liquid ejector with organic working fluids. J Therm Sci. 2019;28(01):61–71. doi:10.1007/s11630-018-1031-2. [Google Scholar] [CrossRef]
37. Chen T, Kim J, Cho H. Theoretical analysis of the thermal performance of a plate heat exchanger at various chevron angles using lithium bromide solution with nanofluid. Int J Refrig. 2014;48(01):233–44. doi:10.1016/j.ijrefrig.2014.08.013. [Google Scholar] [CrossRef]
38. Han D-H, Lee K-J, Kim Y-H. Experiments on the characteristics of evaporation of R410A in brazed plate heat exchangers with different geometric configurations. Appl Therm Eng. 2003;23(10):1209–25. doi:10.1016/S1359-4311(03)00061-9. [Google Scholar] [CrossRef]
39. Longo GA, Righetti G, Zilio C. A new computational procedure for refrigerant condensation inside herringbone-type Brazed Plate Heat Exchangers. Int J Heat Mass Transf. 2015;82(541–546):530–6. doi:10.1016/j.ijheatmasstransfer.2014.11.032. [Google Scholar] [CrossRef]
40. Yang MH, Yeh RH. Economic performances optimization of the transcritical Rankine cycle systems in geothermal application. Energy Convers Manag. 2015;95:20–31. doi:10.1016/j.enconman.2015.02.021. [Google Scholar] [CrossRef]
41. Hashemi M, Jenkins G, Milne F. Rooftop solar with net metering: an integrated investment appraisal. Renew Sustain Energ Rev. 2023;188(3):113803. doi:10.1016/j.rser.2023.113803. [Google Scholar] [CrossRef]
42. Kocaman E, Karakuş C, Yağlı H, Koç Y, Yumrutaş R, Koç A. Pinch point determination and multi-objective optimization for working parameters of an ORC by using numerical analyses optimization method. Energy Convers Manag. 2022;271:116301. doi:10.1016/j.enconman.2022.116301. [Google Scholar] [CrossRef]
43. Ding X, Yang L, Zheng N, Duan L, Zhou Y. Dynamic response characteristics and economic analyses of two solar-assisted multi-generation systems. Appl Therm Eng. 2024;241:122339. doi:10.1016/j.applthermaleng.2024.122339. [Google Scholar] [CrossRef]
44. Li TL, Zhu JL, Zhang W. Cascade utilization of low temperature geothermal water in oilfield combined power generation, gathering heat tracing and oil recovery. Appl Therm Eng. 2005;40(2012):27–35. doi:10.1016/j.applthermaleng.2012.01.049. [Google Scholar] [CrossRef]
45. Krempus D, Bahamonde S, van der Stelt TP, Klink W, Colonna P, De Servi CM. On mixtures as working fluids of air-cooled ORC bottoming power plants of gas turbines. Appl Therm Eng. 2024;236(6):121730. doi:10.1016/j.applthermaleng.2023.121730. [Google Scholar] [CrossRef]
Cite This Article
 Copyright © 2025 The Author(s). Published by Tech Science Press.
This work is licensed under a Creative Commons Attribution 4.0 International License , which permits unrestricted use, distribution, and reproduction in any medium, provided the original work is properly cited.
 Downloads
 Citation Tools