
 Submit a Paper
 Propose a Special lssue
 Open Access
ARTICLE

Research on Wind-Solar Complementarity Rate Analysis and Capacity Configuration Based on COPULA-IMOPSO
1 School of Energy and Power Engineering, Inner Mongolia University of Technology, Hohhot, 010080, China
2 Department of New Energy Storage, Peking University Ordos Research Institute of Energy, Ordos, 017010, China
3 School of Data Science and Application, Inner Mongolia University of Technology, Hohhot, 010080, China
* Corresponding Authors: Feifei Xue. Email: ; Ning Yang. Email:
(This article belongs to the Special Issue: Advances in Renewable Energy Systems: Integrating Machine Learning for Enhanced Efficiency and Optimization)
Energy Engineering 2025, 122(4), 1511-1529. https://doi.org/10.32604/ee.2025.060810
Received 10 November 2024; Accepted 28 February 2025; Issue published 31 March 2025
 View Full Text
 Download PDF
Abstract
This paper presents a new capacity planning method that utilizes the complementary characteristics of wind and solar power output. It addresses the limitations of relying on a single metric for a comprehensive assessment of complementarity. To enable more accurate predictions of the optimal wind-solar ratio, a comprehensive complementarity rate is proposed, which allows for the optimization of wind-solar capacity based on this measure. Initially, the Clayton Copula function is employed to create a joint probability distribution model for wind and solar power, enabling the calculation of the comprehensive complementarity rate. Following this, a joint planning model is developed to enhance the system’s economy and reliability. The goal is to minimize total costs, load deficit rates, and curtailment rates by applying an Improved Multi-Objective Particle Swarm Optimization algorithm (IMOPSO). Results show that when the proportion of wind power reaches 70%, the comprehensive complementarity rate is optimized. This optimization leads to a 14.83% reduction in total costs and a 9.27% decrease in curtailment rates. Compared to existing studies, this paper offers a multidimensional analysis of the relationship between the comprehensive complementarity rate and the optimal wind-solar ratio, thereby improving predictive accuracy and providing a valuable reference for research on the correlation between wind and solar power.Keywords
Currently, there is a lack of comprehensive analysis regarding the relationship between wind-solar complementarity and capacity configuration in the planning of wind-solar power generation systems. Among the existing methods for studying wind-solar complementarity [1–3], the Copula model has proven effective in fitting complex correlation data and has been widely used in related research [4–7]. For instance, Han et al. [8] introduced a capacity distribution method based on the correlation between wind and solar power, highlighting a significant relationship between the capacity ratio of wind-solar generation and complementarity [9–11]. In correlation analyses utilizing the Copula model, Pearson correlation coefficients, as well as Kendall and Spearman rank correlation coefficients, are commonly used for calculations [12–14]. Canales et al. [15] combined the Kendall rank correlation coefficient with the Copula function to create a wind-solar resource model, achieving optimal complementarity by varying the wind-solar ratio [16,17], as the probability distribution of wind-solar resources significantly affects power output. Consequently, this paper focuses on analyzing the complementarity rate of wind-solar output to guide capacity configuration [18–21].
In terms of optimizing wind-solar capacity configuration, most studies tend to analyze the economic and reliability aspects of wind and solar power independently, with limited consideration given to the relationship between the comprehensive complementarity rate and capacity configuration across different wind-solar ratios [22]. For example, Komiyama et al. [23] proposed a bi-level planning model aimed at achieving optimal configuration, but it still lacks a quantitative analysis of wind-solar correlation [23,24].
This paper will carefully examine the functions and significance of various indicators in analyzing wind-solar complementarity. Based on this foundation, it will explore the relationship between the comprehensive complementarity rate and wind-solar ratios for capacity configuration. A multi-energy complementarity system optimization model will be constructed using Copula theory, allowing for layered optimization of system complementarity analysis and capacity configuration. Additionally, the wind-solar correlation metrics will be integrated into the capacity configuration problem, and the Improved Multi-Objective Particle Swarm Optimization algorithm will be employed to optimize the total cost, load deficit rates, and curtailment rates of wind-solar generation [25,26].
The methodology of this study is illustrated in Fig. 1. We identify the optimal model, the Clayton Copula, by comparing the parameters of various Copula functions. This model, along with the power complementarity rate, is used to predict the ideal ratio of wind to solar energy. Four distinct configurations are developed: (1) no complementarity with MOPSO, (2) no complementarity with IMOPSO, (3) complementarity with MOPSO, and (4) complementarity with IMOPSO. These configurations aim to investigate how the complementarity rate influences the setup of wind and solar capacity. Using data from a real-time wind-solar storage simulation system, we employ the kernel density estimation method to obtain the probability density of wind and solar power output. The maximum likelihood estimation method, based on Copula theory, is utilized to estimate the parameters of the Copula model through a marginal distribution model, facilitating the generation of the joint distribution of wind and solar generation. This study rigorously analyzes various correlation indicators, including the Pearson correlation coefficient and the Kendall rank correlation coefficient [27–30] as well as goodness-of-fit indicators such as Euclidean distance and maximum distance for evaluation purposes [31,32]. Through this comprehensive assessment, we select the optimal Copula model and calculate the overall complementarity rate. The capacity configuration is then performed with the objective of minimizing total costs, load deficit rates, and curtailment rates.
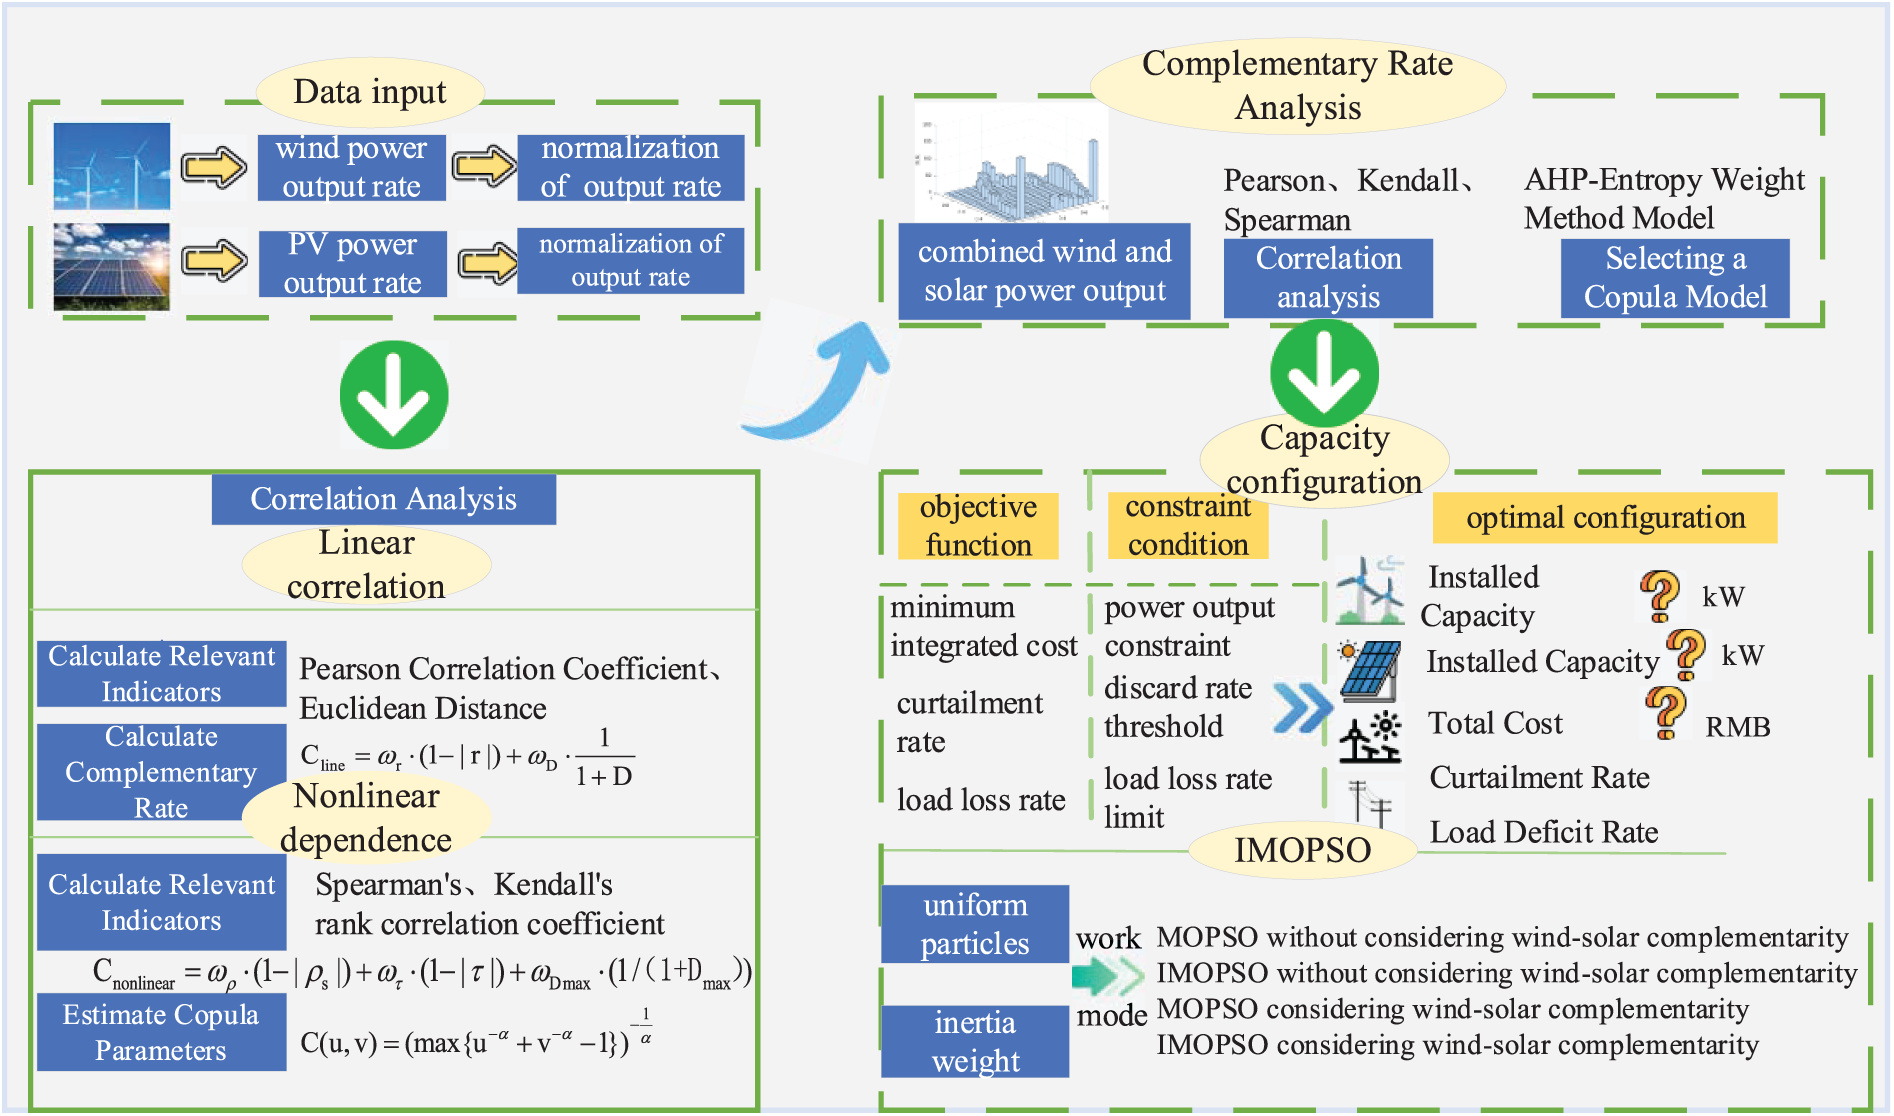
Figure 1: Overall research methodology
2.1 Comprehensive Complementarity Rate
To analyze the complementarity of wind and solar energy over the time scale t, this section measures the complementary characteristics of wind and solar power at different installed capacity ratios. The calculation of the linear correlation indicator, the complementarity rate, is shown in Eq. (1):
when the distance is 0, the complementarity rate is 1; as the distance increases, the complementarity rate gradually decreases. The calculation formula is as follows (Eq. (2)):
where
where
Nonlinear analysis offers a more comprehensive evaluation of the characteristics of wind and solar power [33,34]. Spearman or Kendall complementarity rate are employed to capture the complex relationships between wind and solar generation. The nonlinear complementarity rate is expressed by Eq. (4):
where
By traversing through the weight, the comprehensive complementarity rate is shown in Eq. (5):
where
In order to adjust the weight of each index comprehensively, sensitivity analysis method is used to carry out ergodic analysis of the weight of different indexes. In order to ensure the reliability and detail of the results, the step size is set to less than 0.1. In the analysis, Pearson correlation coefficient and Euclidean distance weight are traversed respectively for linear correlation index. Secondly, the nonlinear correlation index is analyzed by Kendall rank correlation coefficient, Spearman rank correlation coefficient and maximum distance weight. Through this process, we can systematically explore the influence of each index weight on the final comprehensive complementarity rate. Sensitivity analysis was used to assess the extent to which each weight change affected the overall score and complementarity rate. Through traversing different weight combinations, the index weights that are most sensitive to the comprehensive complementarity rate are identified, so as to provide a basis for model selection.
The comprehensive complementarity of the evaluation model indicators is shown in Eq. (6):
where
The appropriate model was selected based on comprehensive scores, with the highest-scoring Copula model identified as the best option. This model will be applied in the next section for capacity configuration of wind-solar installations using particle swarm optimization.
2.2 Capacity Configuration Optimization
For the optimization of wind-solar complementary generation systems, the capacity configuration must ensure both technical reliability and economic viability. To explore the relationship between the comprehensive complementarity rate and wind-solar ratio, this study proposes an IMOPSO. The optimization model is divided into three layers: the complementarity analysis layer, the objective construction layer, and the optimization algorithm layer [35]. A detailed flowchart is presented in Fig. 2.
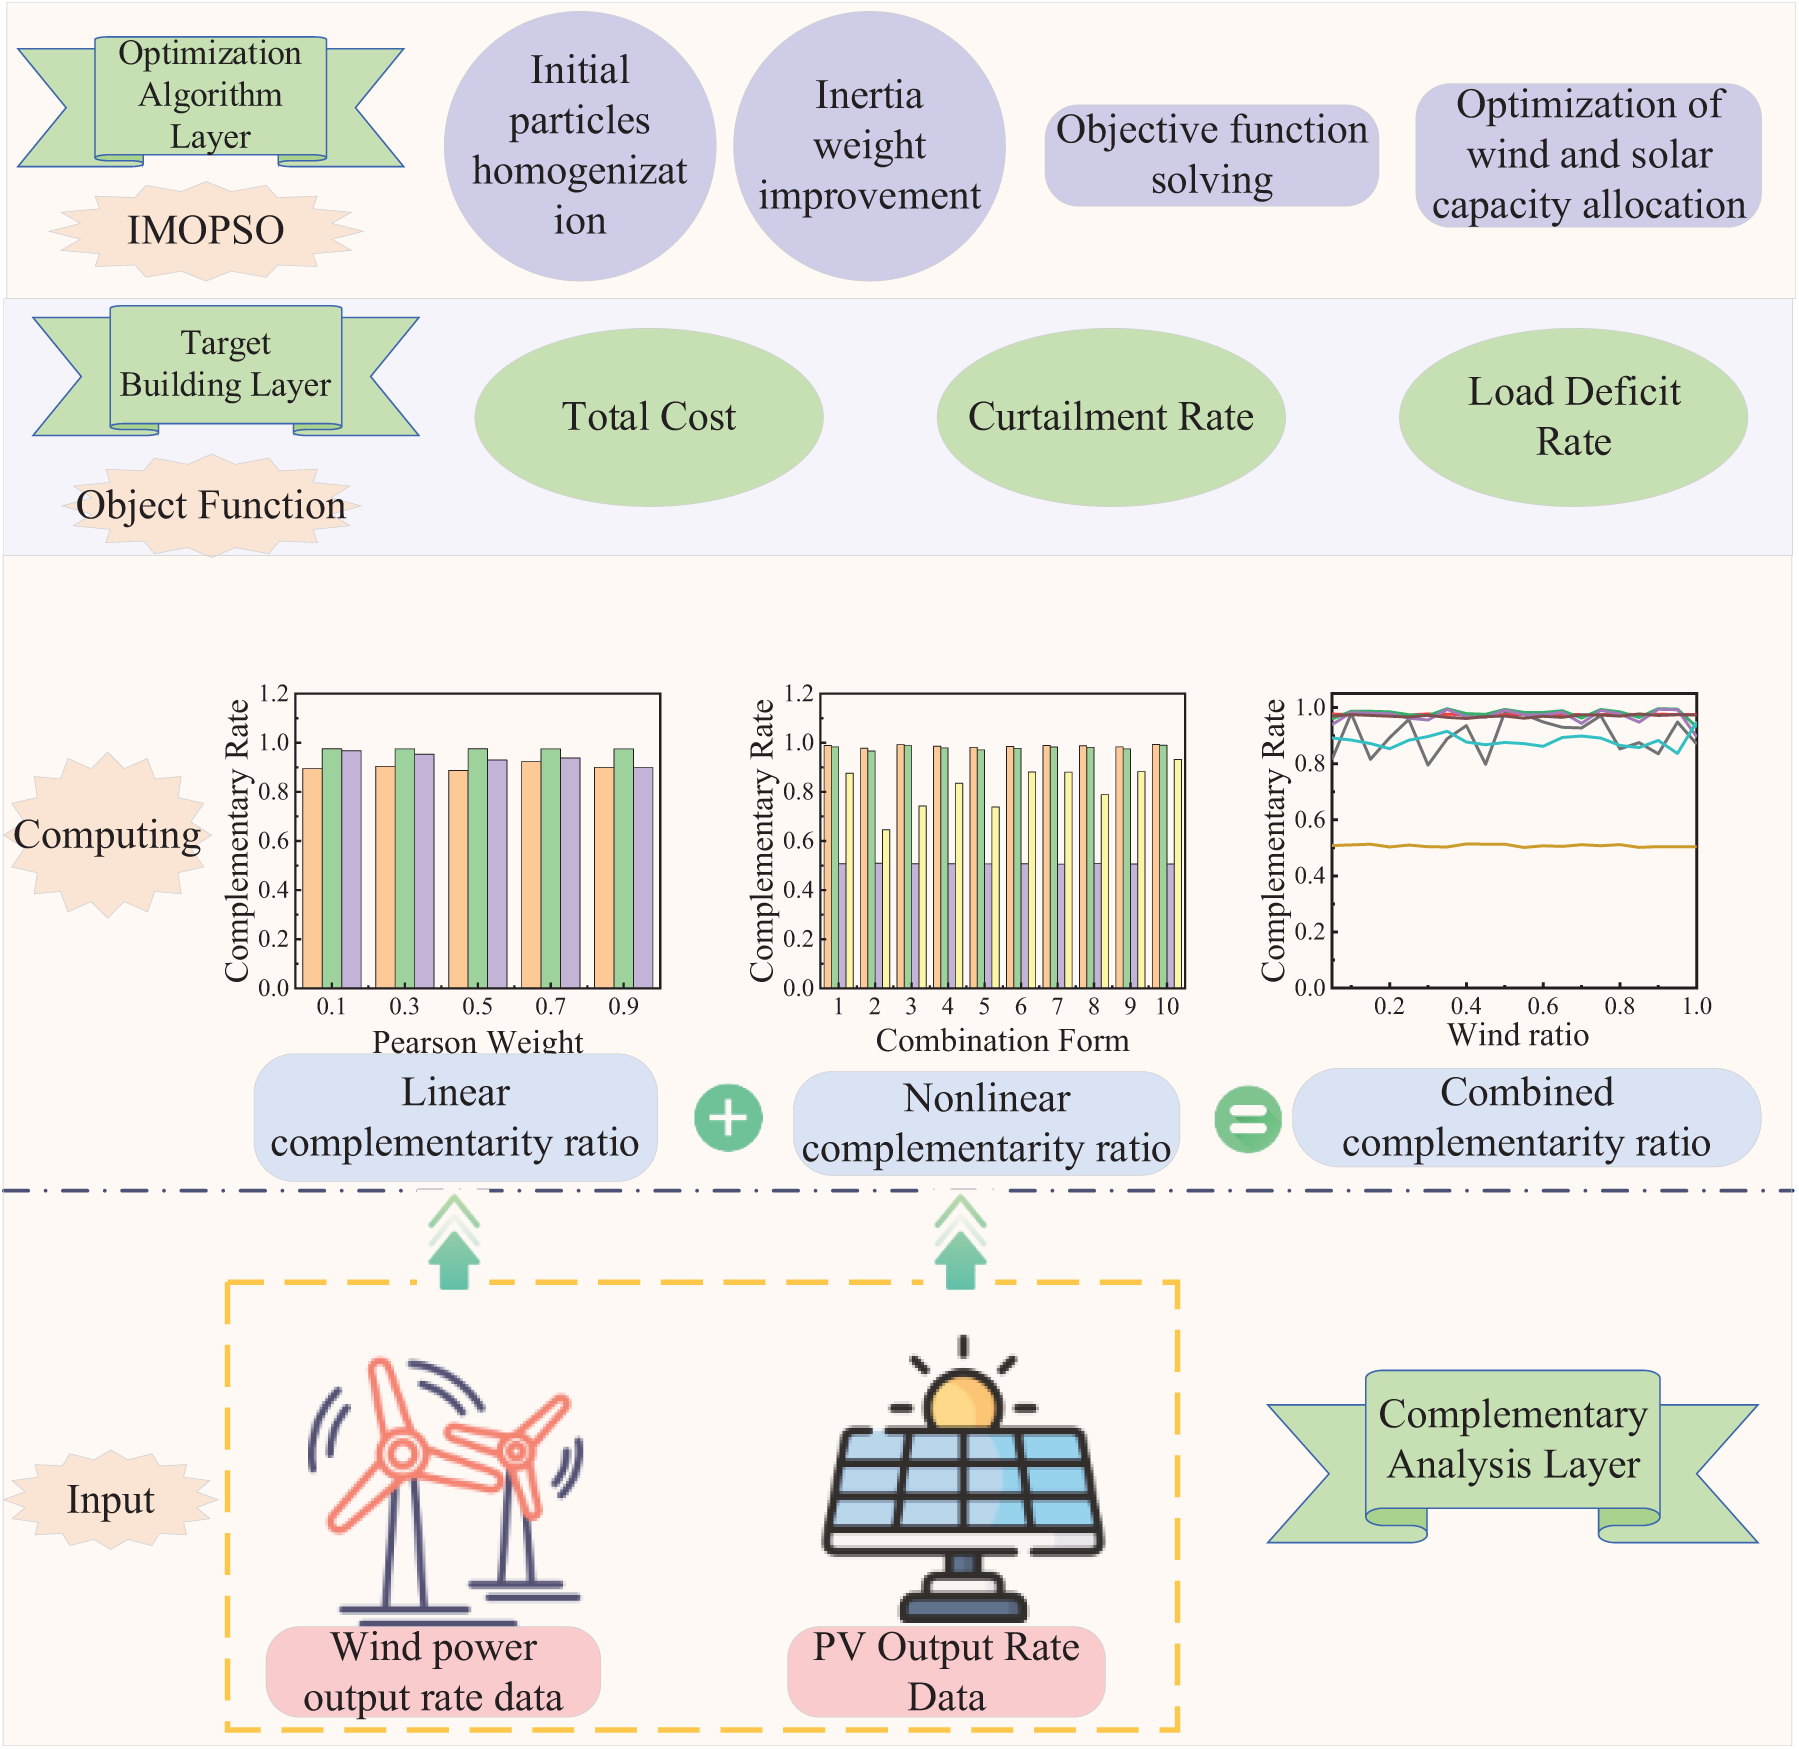
Figure 2: Optimization model based on wind-solar complementary capacity configuration
In the complementarity analysis layer, the theoretical framework established in the previous section is utilized to analyze various correlation and fitting indicators, and to calculate the comprehensive complementarity rate and its relationship to optimal wind-solar ratio. The complementarity rate is transmitted to the objective construction layer, where it is used to formulate the minimum objective function with the total cost, load deficit rates, and curtailment rates. In the optimization algorithm layer, the modified MOPSO algorithm utilizes uniform initialization and dynamic weight adjustment to solve the objective function, thereby achieving optimal capacity configuration for wind-solar generation systems.
(1) Total Cost of Wind-Solar Power Generation Systems
To focus on the impact of the complementarity rate on total cost, this analysis disregards secondary factors such as disposal cost and considers primarily the major investment and operational maintenance costs. The total cost and other costs are expressed by Eqs. (7) and (8):
The operational and maintenance (O&M) costs of the system include expenses for regular equipment maintenance, fault repairs, and personnel salaries. The O&M cost of wind power system typically accounts for 5%–10% of the investment cost, and in this paper, a value of
By incorporating wind-solar complementarity into the improved total cost formula, the cost formulas for different wind-solar ratio schemes are obtained, as shown in Eq. (10):
(2) Curtailment Rate Correction Equation
The system curtailment rate
(3) Load Deficit Rate Correction Equation
The load deficit rate
For the weight relationship between the above three objective functions, the paper adds weight adaptive control to the IMOPSO algorithm, and adaptively adjusts the weight relationship between the three objective functions in the optimization process. Since there is an inverse relationship between the load deficit rate and the curtailment rate in the objective function, the minimum weight is limited in the optimization algorithm. Avoid over-optimizing one of the targets in the optimization process of load deficit rate and curtailment rate, which will cause the overall optimization effect to decrease.
Generation Power Constraints is shown in Eq. (13) [34]:
where
Curtailment Rate Constraint is expressed by Eq. (14):
where
Load Deficit Rate Constraint is expressed by Eq. (15):
where
2.2.3 IMOPSO Optimizes Processes
Based on the Particle Swarm Optimization (PSO) in the classical intelligent algorithm, improvements are made in aspects such as population distribution, linearly decreasing inertia weight, and adjustment of learning factors. The specific process is shown in Fig. 3.
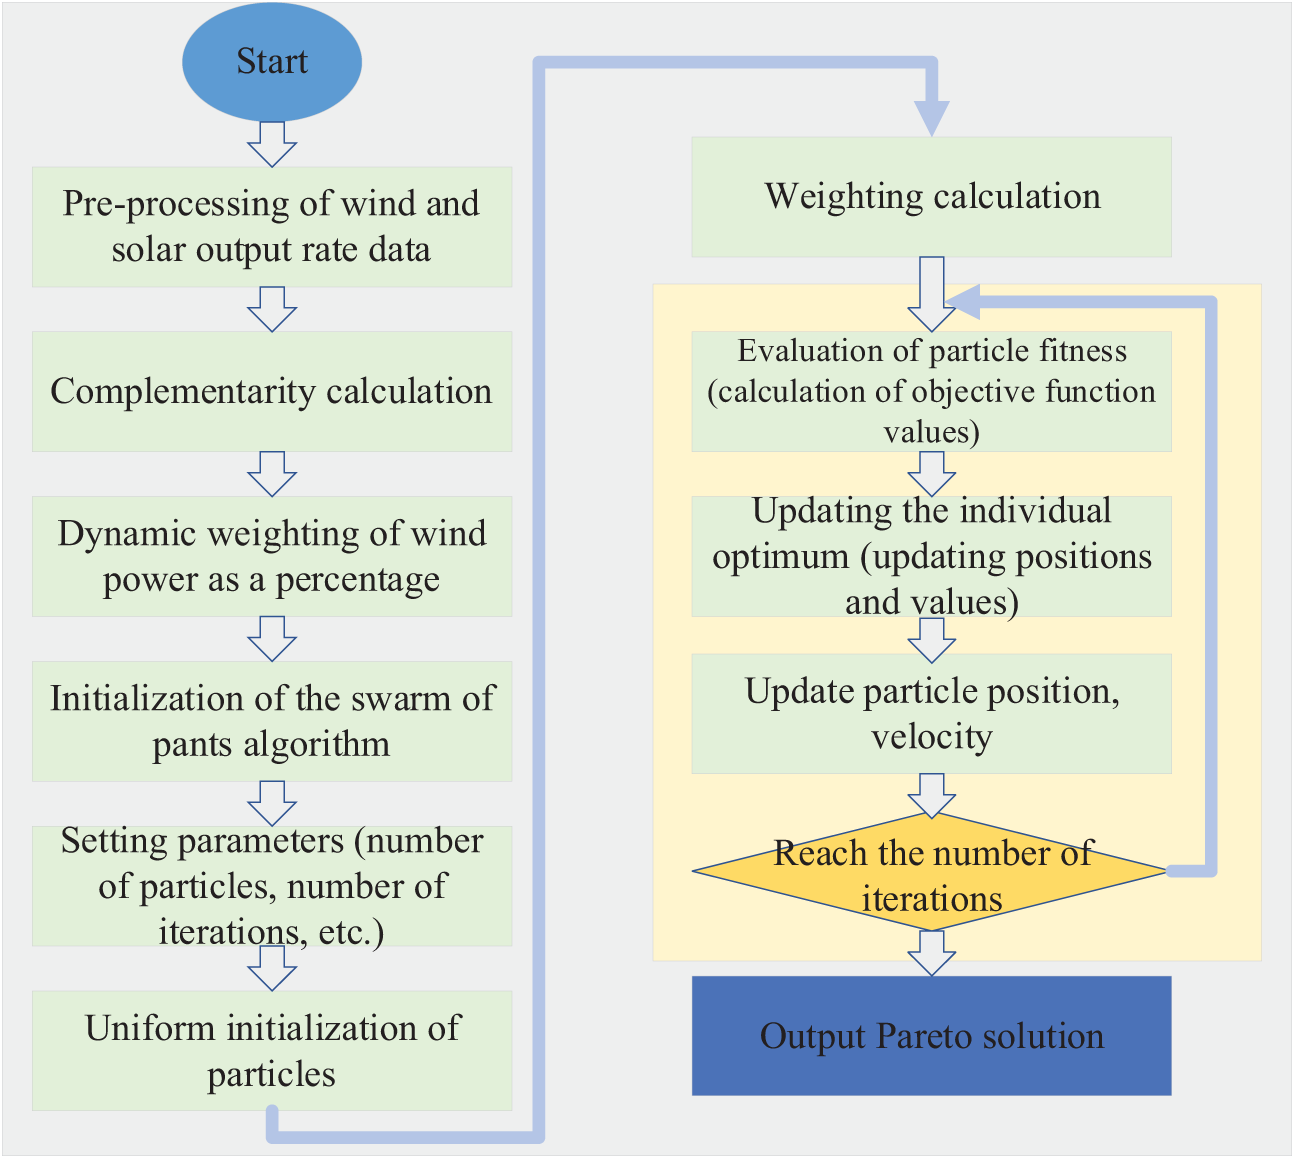
Figure 3: IMOPSO flowchart
In this study, the climatic data of Ordos City in Inner Mongolia, published on the Greenwich website is taken as an example for step by step calculation and analysis, as illustrated in Fig. 4. These climatic data are input into a real-time simulation model and transformed into the output ratio of wind and solar power.

Figure 4: Wind and solar statistical data for a specific day in Ordos City, Inner Mongolia
To thoroughly explore their interrelated characteristics, it is crucial to construct the join distribution of the wind-solar power output, as shown in Fig. 5. By establishing the wind-solar power function, the probability density distribution characteristics are obtained, and a bivariate histogram of the output is generated. The results indicate that the wind power density is primarily concentrated between 70% and 100%, with a greater density observed above 90%. The solar power density is relatively uniform for values above 20%, while the data below 20% is more densely distributed.
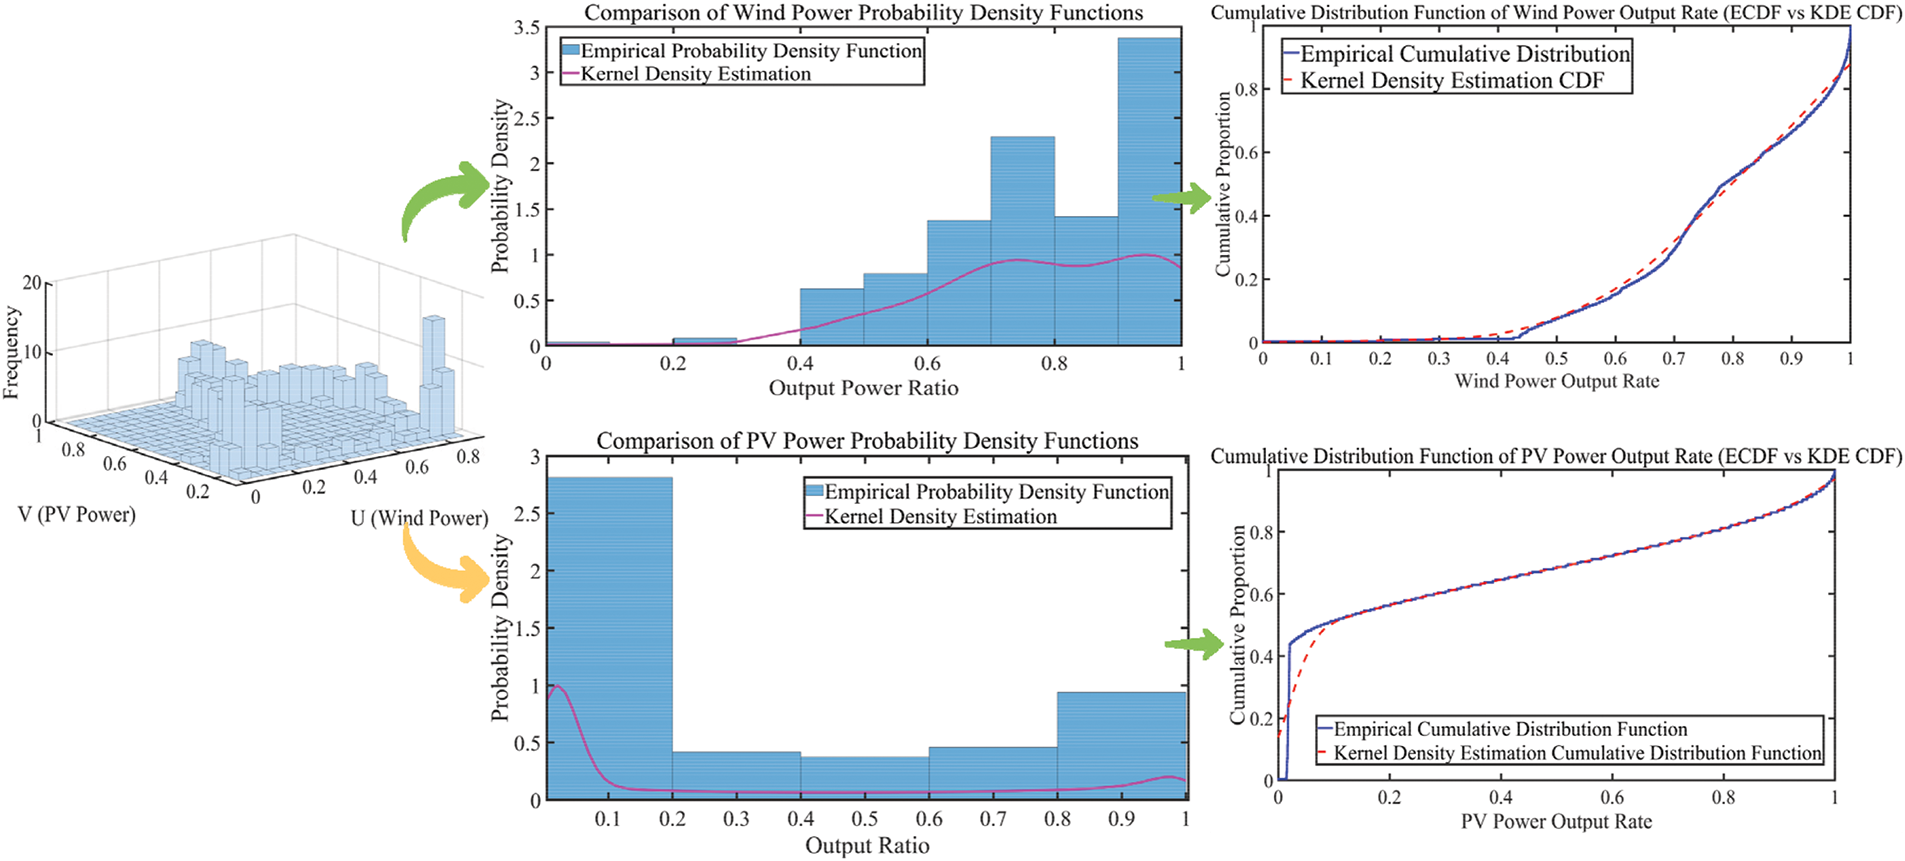
Figure 5: Probability density and cumulative distribution function of wind-solar power
Comparison of the empirical distribution function and the kernel density estimation (KDE) distribution function of the experimental data shows that the KDE provides a better fit. Therefore, the KDE is used to construct the probability density distribution model for the joint power output of wind and solar energy, and the joint probability distribution is calculated using the Copula function model.
Due to the asymmetric frequency distribution of wind and solar power, the Archimedean family of Copula functions is initially considered for constructing the probability distribution estimation of the joint power output. The goodness-of-fit test values of the model are shown in Table 1.
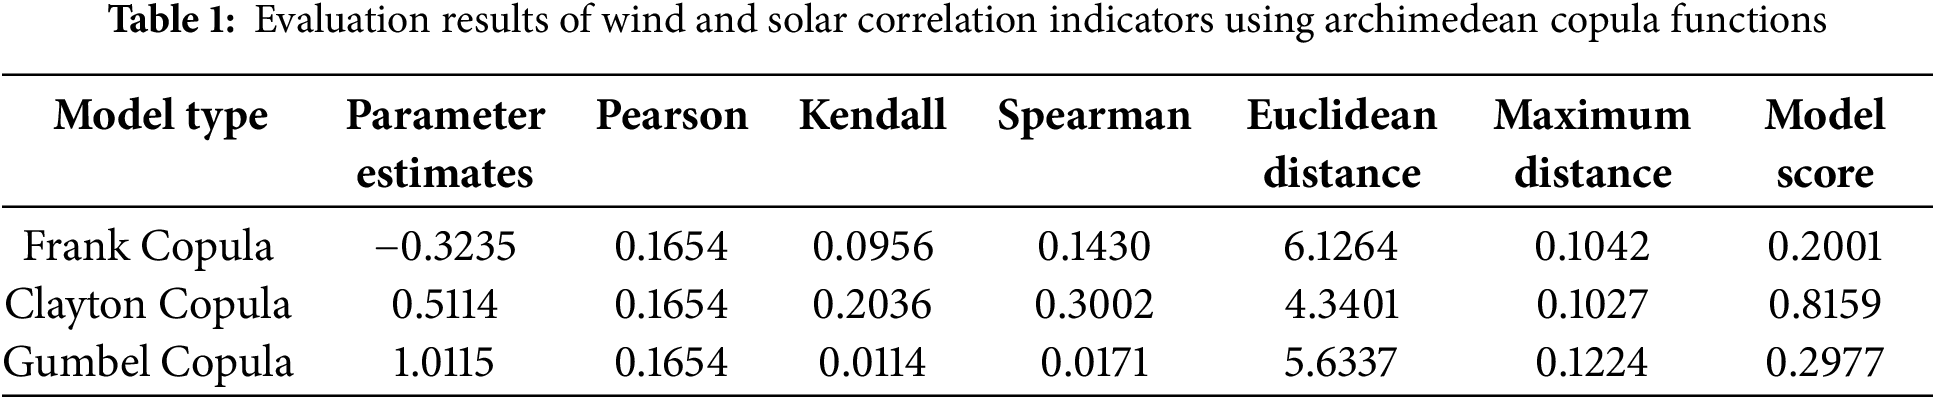
The fitting indicators of the Clayton Copula function, including Euclidean distance and maximum distance, are minimized, indicating the best fitting performance. The parameter estimate of Frank Copula is −0.3235, indicating a certain negative correlation between wind and solar power, while Pearson, Kendall and Spearman values are relatively low, indicating a weak correlation. The parameter estimation of the Clayton Copula indicates a positive correlation between wind and solar power, and the parameter estimation of the Gumbel Copula shows a strong positive correlation in extreme power output situation.
The complementary scores of the model were calculated by combining AHP and entropy weight method for indicators. The entropy weight method dynamically adjusts the weights in the AHP matrix, thereby achieving a more reasonable allocation of indicator weights. Ultimately, the Clayton Copula achieved the highest score of 0.8159, with the data results shown in Table 2.
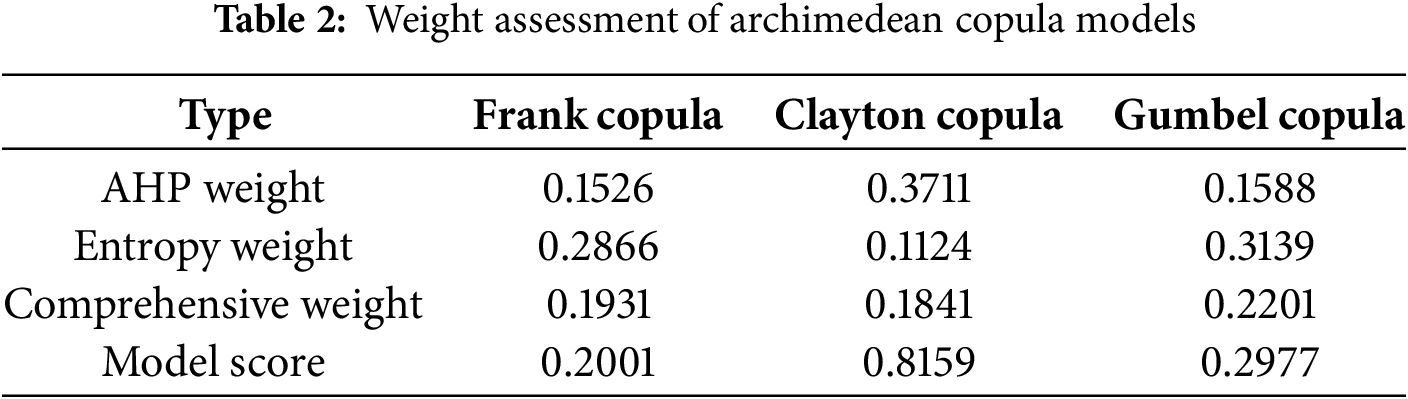
The AHP weight are used to adjust the complementary relationship of power output proportions for each Copula model. The AHP weight for the Clayton Copula is the highest at 0.3711, as this model captures the complementary relationship between wind power output proportions. Although the Clayton Copula may not excel in data variability characteristic compared to the Frank Copula, it exhibits a significant advantage in describing tail correlations. By calculating the comprehensive index using AHP and entropy weight method, the Clayton Copula model obtained the highest score, benefiting from its advantage in tail correlations and reasonable weight allocation. The results are consistent with traditional single-indicator analysis, verifying the correctness of the model.
3.2 Comprehensive Complementarity Analysis
The wind and solar power output data are fitted, samples are generated based on the Clayton Copula function model, the wind edge function distribution is extracted, and the samples are analyzed with linear and nonlinear indicators to calculate the comprehensive complementarity rate.
In the analysis of linear correlation indicators, the Pearson correlation coefficient and Euclidean distance weight are dynamically adjusted with a step size of 0.2. Fig. 6 illustrates the linear complementarity rate under typical combinations. The Pearson correlation coefficient is employed to measure the strength of the linear relationship between wind and solar power data, while the Euclidean distance reflects the distance differences among data points. Based on the above two indicators, The linear complementarity rate is calculated to assess the complementarity of wind and solar power data.
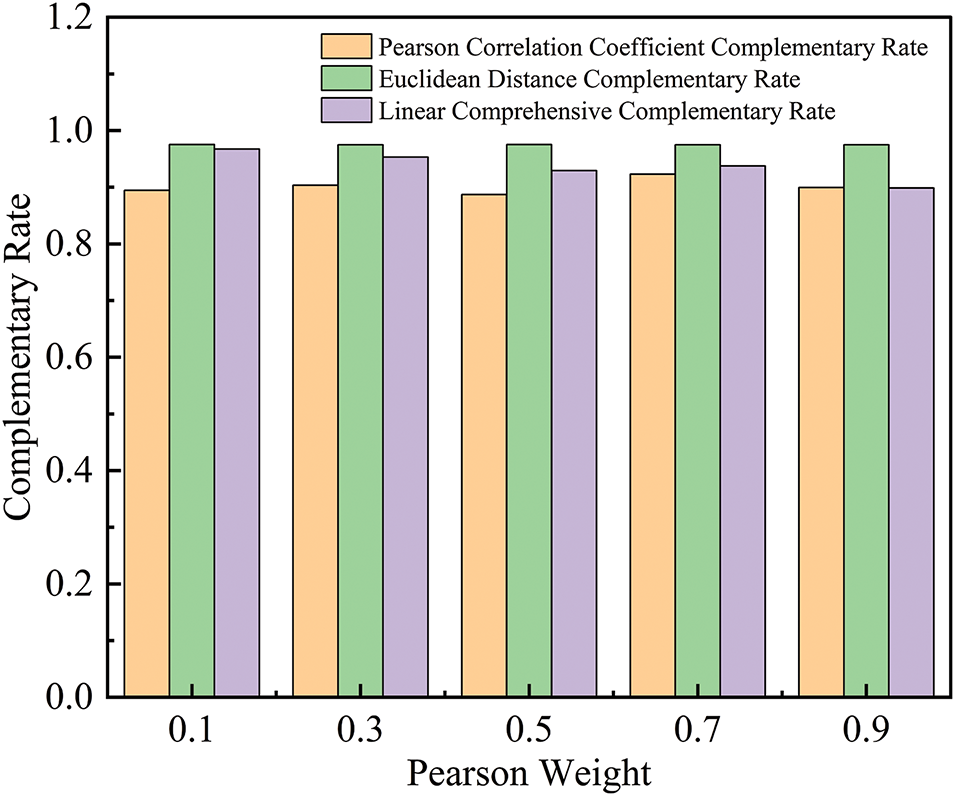
Figure 6: Linear indicator complementarity rate
As shown in Fig. 6, the Pearson correlation exhibits a general upward trend, reaching a peak value of 0.1223 as the weights change from (0.1,0.9) to (0.9,0.1). Concurrently, the linear complementarity rate progressively decreases from 0.9699 to 0.8848. It indicates that while the Pearson correlation complementarity rate is increasing, during resource configuration optimization, the decline in the linear comprehensive complementarity rate indicates potential nonlinear effects, which affects overall system performance.
In the analysis of nonlinear correlations, both Kendall and Spearman correlation coefficients, along with the maximal distance, are considered to assess the complementarity rate, as illustrated in Fig. 7.
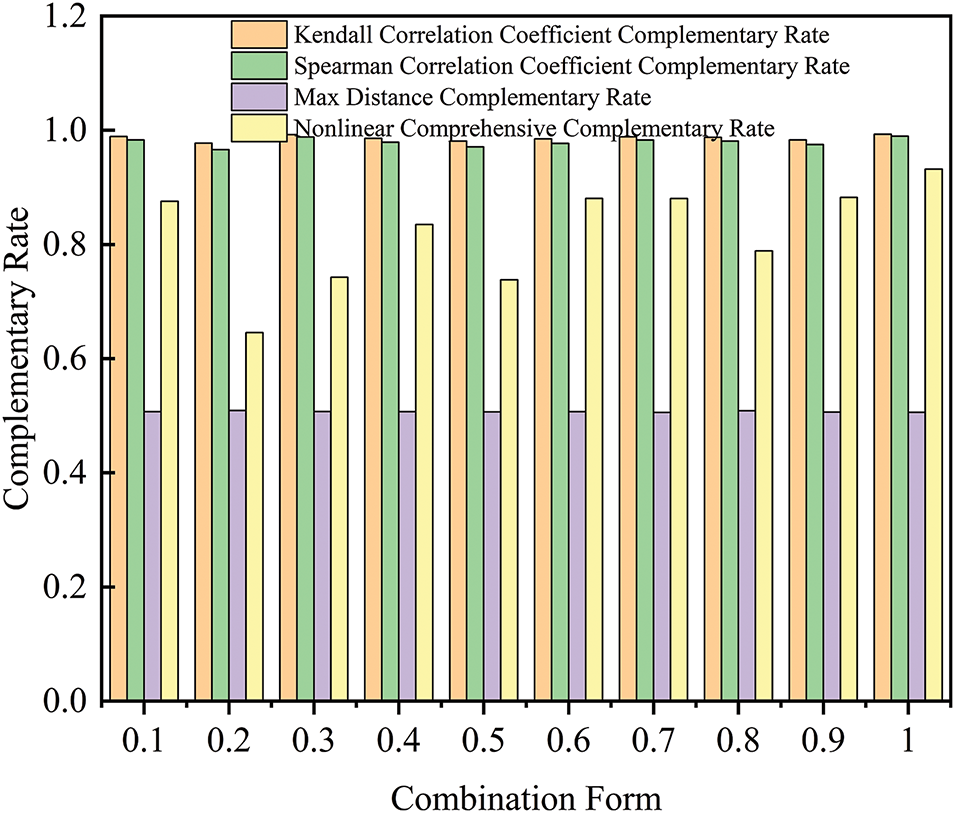
Figure 7: Nonlinear comprehensive complementarity rate
The small fluctuations in the Kendall and Spearman rank correlation coefficients indicate that the rank correlation of the case data is limited in its sensitivity to different weight combinations. Meanwhile, the maximum distance value, close to 1, indicates that the wind and solar power output characteristics are consistent across various weight configurations. The nonlinear complementarity rate for the weight combination (0.7, 0.2, 0.1) is 0.9169, indicating that this combination performs well in terms of nonlinear characteristics. In contrast, the complementarity rate for the weight combination (0.2, 0.3, 0.5) reaches its lowest value of 0.7363, reflecting its disadvantages in terms of nonlinear complementarity. In analyzing the ratio of wind and solar power, Kendall’s correlation is crucial for capturing the stability of relationships between variables, prioritizing the indicator that enhance nonlinear characteristic.
3.3 Comparative Analysis of Complementarity Rate Calculation Methods
In analyzing the impact of different wind and solar ratio on the complementarity rate, this study employs various calculation methods, including Pearson, Kendall, Spearman, and maximum distance, to explore the performance of these methods under different wind and solar ratio and their ability to predict the optimal wind and solar ratio. Fig. 8 illustrates the fluctuation trends of each indicator during the variation of wind and solar ratio, reflecting the importance of the comprehensive complementarity rate in optimizing the wind and solar ratio.

Figure 8: Complementarity rates of different indicators under varing wind and solar ratios
The Pearson complementarity rate and Euclidean distance complementarity rate exhibit relatively stable peaks at wind power shares of 35%, 55%, 70%, and 80%, with values ranging from 0.9759 to 0.9774, indicating the linear characteristics of the system. In contrast, the Kendall complementarity rate and maximum distance also reached peaks at wind power shares that include 70%, demonstrating a good ability to capture the nonlinear characteristic of the data. At the same time, the maximum distance indicator shows a peak of approximately 0.51 at various wind power share that include 70%, further confirming the nonlinear characteristics of the data. The comprehensive complementarity rate exceeds the average at wind power shares of 15%, 40%, and 70%, reflecting its advantage for capturing variations in wind and power. The linear indicator weight obtained through the Fmincon algorithm is 0.425, while the nonlinear indicator weight is 0.05, the comprehensive complementarity rate is 0.9488. Based on this result, a wind power ratio of 70% is predicted to be optimal configuration, further validating the effectiveness of the comprehensive complementarity rate as a tool for optimizing wind power share. Therefore, comprehensive complementarity rate not only reflects the data characteristics in a comprehensively manner, but also provides a scientific basis for the optimization of wind and solar ratios.
3.4 Optimization Algorithm Analysis
In this paper, the multi-objective particle swarm optimization algorithm is improved by uniformly covering search space and dynamically adjusting coefficient weights. Fig. 9 shows the uniform distribution of the initial particle swarm to ensure that the particles meet the uniform coverage. By homogenizing the initial particles, the local optimal situation of the optimization results can be avoided. Fig. 10 shows that dynamic adjustment of cognitive acceleration factors and social acceleration factors in MOPSO can not only significantly improve algorithm convergence but also improve the optimization accuracy of the optimization algorithm.
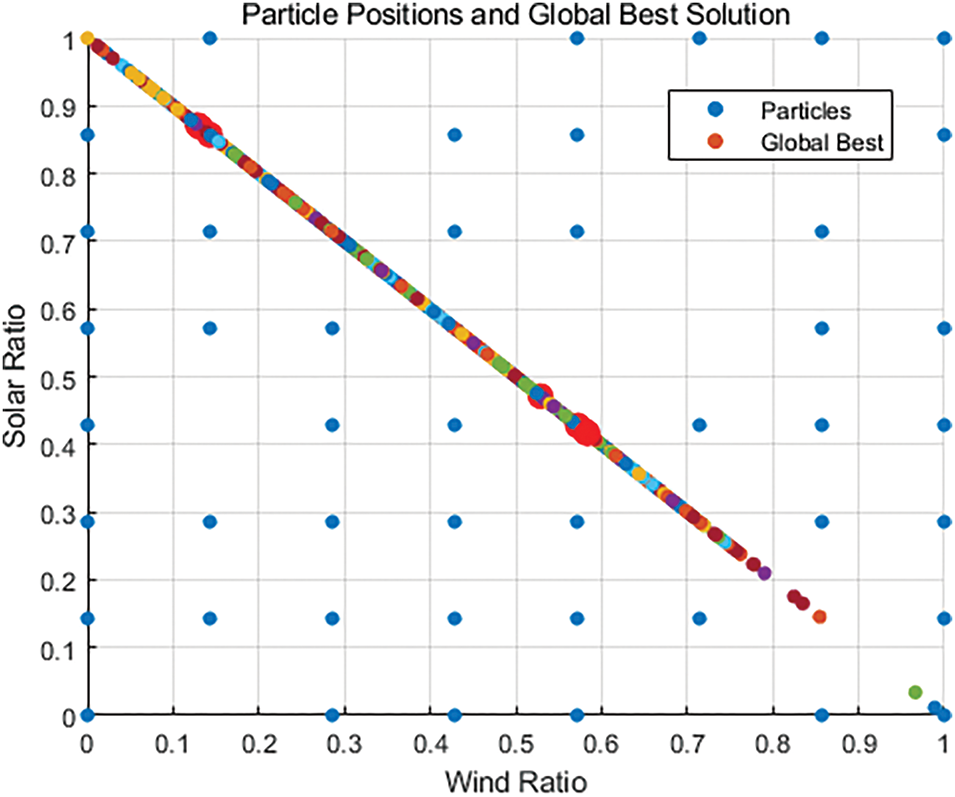
Figure 9: Uniform distribution of initial particles

Figure 10: Weight coefficient change
3.5 Analysis of Optimization Results
Based on the previous analysis, this study validates the accuracy of predicting the optimal wind and solar ratio using the comprehensive complementarity rate. It further optimizes the configuration to achieve the dual objectives of economic efficiency and reliability. The initial capacity configuration of this study is as follows: the rated capacity of wind power generation is 800 kW, the rated capacity of photovoltaic power generation is 500 kW, and the rated capacity of load is calculated by superimposing the load of 5 different scenarios. The rated capacity of each scenario is 80~110 kW, and the total capacity is 400~550 kW. A real-time simulation platform is employed to analyze and explore the optimal configuration scheme for wind and solar capacity in the region. To enhance the performance of the Particle Swarm Optimization (PSO), the improved strategy is employed that includes uniform coverage of the search space and dynamic adjustment of inertia weights. These strategies strengthen the algorithm’s convergence and search capabilities.
By analyzing the impact of the objective function in four different scenarios, the results indicate that, under varying wind and solar power ratio, the optimization algorithm considering complementarity rates significantly outperforms the other three scenarios. It is evident in terms of total cost, curtailment rate and load deficit rates under varying wind and solar ratios.
Fig. 11 shows that the total cost of the PSO optimization results without considering wind-solar complementarity ranges from 1.25 to 1.89 million yuan. In contrast, when complementarity is taken into account, the cost decreases to between 1.22 and 1.80 million yuan. These results indicate a significant reduction in costs. After applying the IMOPSO algorithm, the optimized cost further decreases to a range of 1.25 to 1.50 million yuan. The total costs stabilize in different situations, with mean values of 1.55, 1.55, 1.52, and 1.42 million yuan. The IMOPSO algorithm, which considers wind-solar complementarity, reduces the cost by 127 thousand yuan, resulting in a decrease of 8.18%.
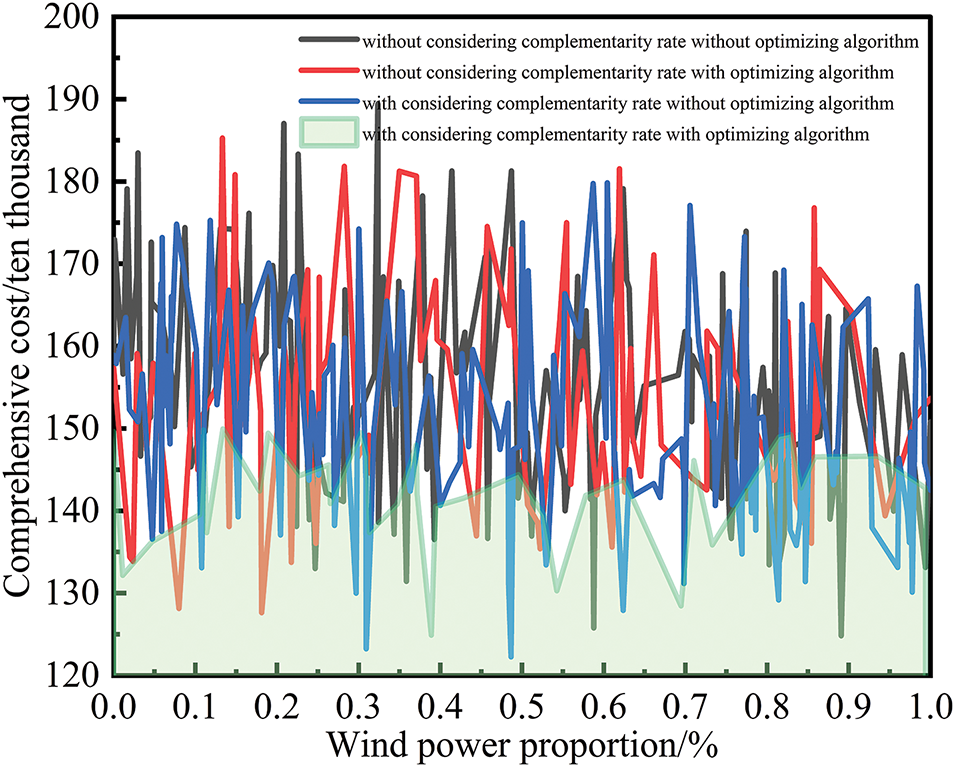
Figure 11: Comprehensive cost
The variations in the curtailment rate and load deficit rate are shown in Figs. 12 and 13. The maximum curtailment rate under different situations are 15.11%, 13.20%, 13.44%, and 12.15%, with the IMOPSO algorithm, which considers complementarity, achieving a reduction of 2.96%. The mean load deficit rates in different situations are 1.60%, 1.84%, 1.31%, and 1.24%. Under varying wind-solar output ratios, the instances where the load deficit rate is less than 1% are 70.14%, 60.22%, 71.14%, and 74.26%, respectively. After considering complementarity, the proportion of very low load deficit rates increases by 4.12%.

Figure 12: Curtailment rate
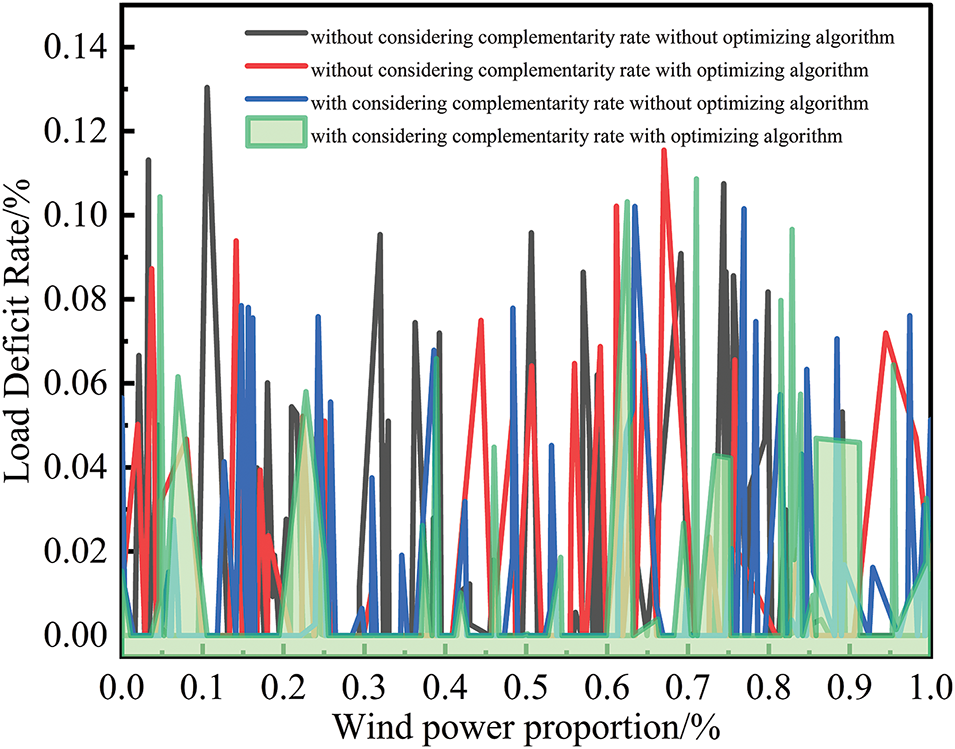
Figure 13: Load deficit rate
The multi-objective particle swarm optimization algorithm is applied to solve the objective function, resulting in the wind and solar capacity configuration parameters in four different modes, as shown in Tables 3 and 4.
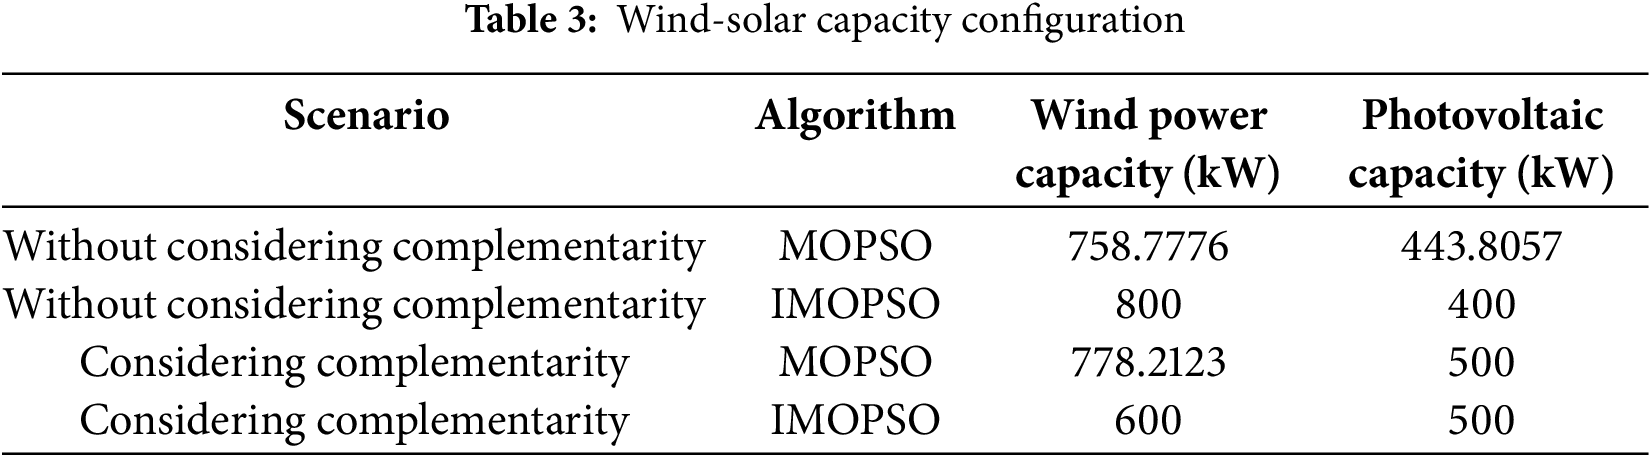
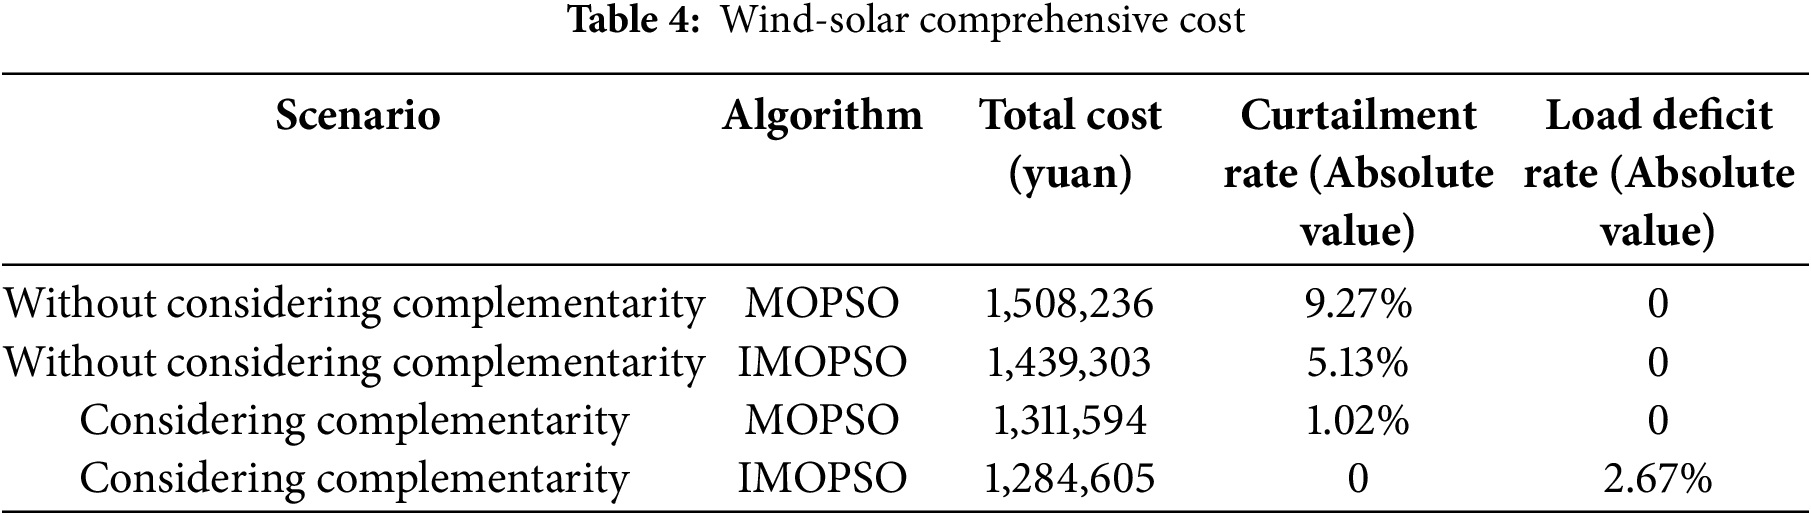
After taking into account the complementary characteristic of wind and solar, the wind power capacity is set at 600 kW, while the photovoltaic capacity is configured at 500 kW, resulting in a more rational allocation of climate conditions and resource utilization. When complementarity is not considered, the total cost decreases from 1.5082 to 1.4393 million yuan. With complementarity taken into account, the total cost further declines from 1.3116 to 1.2846 million yuan. Before and after considering the complementarity rate, the power generation cost decreased from 1.4393 to 1.3116 million yuan, and the power generation cost decreased significantly, indicating that considering the complementarity rate effectively improved the economy of the system. When the complementarity is not considered, the curtailment rate decreases from 9.27% to 5.13%, and when the complementarity is considered, the curtailment rate decreases from 1.02% to 0%. The curtailment rate decreased from 5.13% to 1.02% before and after considering the complementarity rate, the curtailment rate also decreased significantly. Although the load deficit rate increases by 2.67% after considering the complementarity rate, but the overall load deficit rate of the system decreases. It shows that considering the complementarity rate can effectively reduce the curtailment rate and the load deficit rate, and improve the stability and reliability of the system.
In summary, when the wind power share is 70%, the total cost, the curtailment rate, and load deficit rate all reach their minimum values. This further validates the effectiveness and reliability of the proposed method. However, this method has good analytical effect only for simple systems such as wind-solar complementary system. If the wind-solar complementary system is coupled with energy storage system or power grid system, whether this method still has good adaptive effect will be further explored in the subsequent research.
This study addresses the capacity configuration problem by taking into account the complementarity of wind and solar output. By selecting the optimal Copula model, we analyze the characteristics of wind and solar power and predict the optimal wind-solar ratio based on this complementarity. We validate the comprehensive complementarity rate and perform optimization of wind-solar capacity. The main conclusions are as follows:
(1) Prediction Method for Comprehensive Complementarity Rate:
We propose a method for predicting the optimal wind-solar ratio based on the comprehensive complementarity rate. By employing the Clayton Copula model, which effectively captures both linear and nonlinear characteristics of wind and solar output, we predict the optimal wind-solar ratio. Case analyses using this methodology demonstrate that at the optimal ratio, both the total cost and curtailment rate are minimized, further validating the effectiveness of our approach.
(2) Modification and Optimization of the Objective Function:
This study introduces a modified objective function that integrates the relationship between the wind-solar ratio and complementarity, allowing us to comprehensively describe total cost, curtailment rate, and load deficit rate. The IMOPSO algorithm effectively reduces the objective function. The analysis results indicate that at the optimal power output ratio, the total cost decreases by 10.75%, the curtailment rate decreases by 5.16%, and the load deficit rate increases by 2.67%. This highlights the importance of considering complementarity when configuring wind-solar capacity.
By combining complementarity with the prediction of the optimal wind-solar ratio and capacity configuration, we offer a new approach to wind and solar planning. For any remaining wind and solar capacity, future research can explore the addition of a Hybrid Energy Storage System (HESS). This remaining capacity can be allocated to the HESS, which not only improves the overall efficiency of the system but also smooths out fluctuations in wind and solar power, providing supplementary electric energy to the load. This approach plays a crucial role in enhancing the reliability of the system.
Acknowledgement: The authors would like to thank the new energy storage Department of Ordos Energy Research Institute of Peking University for its important support in providing RT-LAB and other simulation tools, and the Key Laboratory of Wind Energy and Solar Energy of Inner Mongolia University of Technology for providing the necessary test site for this paper. Finally, the authors thank the editors and anonymous reviewers for their critical and constructive comments.
Funding Statement: This work was supported by Inner Mongolia Natural Science Foundation Project and the Optimization of Exergy Efficiency of a Hybrid Energy Storage System with Crossover Control for Wind Power (2023JQ04).
Author Contributions: The authors confirm contribution to the paper as follows: Study conception and design: Caifeng Wen, Hongliang Hao; Fund preparation: Caifeng Wen, Yuwen Zhang; Data collection and sorting: Yongsheng Wang, Yuwen Zhang; Draft manuscript writing: Feifei Xue, Ning Yang; Paper translation: Edwin E. Nyakilla. All authors reviewed the results and approved the final version of the manuscript.
Availability of Data and Materials: The authors ensure the authenticity and validity of the materials and data in the article.
Ethics Approval: Not applicable.
Conflicts of Interest: The authors declare no conflicts of interest to report regarding the present study.
Nomenclature
| Complementarity rate | |
| Correlation indicator | |
| Fit complementarity rate | |
| Fit correlation coefficient | |
| Linear complementarity rate | |
| The Pearson correlation coefficient | |
| The Euclidean distance | |
| Nonlinear complementarity rate | |
| The Spearman rank correlation coefficient | |
| The Kendall rank correlation coefficient | |
| The weight of Spearman rank correlation coefficient | |
| The weight of Kendall rank correlation coefficient | |
| The maximum distance | |
| The weight of maximum distance | |
| Comprehensive complementarity rate | |
| The weight of linear complementarity rate | |
| The weight of nonlinear complementarity rate | |
| The total score of the i-th model | |
| The weight of each factor | |
| The score of the i-th model on the j-th indicators | |
| Total cost | |
| The costs of wind power, solar power investment | |
| Total investment | |
| The wind power proportion | |
| The unit investment cost for each type of equipment | |
| The unit discount price | |
| The depreciation rate | |
| Proportion of wind power operation and maintenance cost to investment cost | |
| Proportion of solar power operation and maintenance cost to investment cost | |
| Operation and maintenance (O&M) cost | |
| Corrected curtailment rate | |
| Corrected load deficit rate | |
| The upper and lower limits of wind power | |
| The upper and lower limits of solar power | |
| The preset maximum curtailment rate | |
| The preset maximum load deficit rate |
References
1. Yu B, Zhao Z, Zhao G, An R, Sun F, Li R, et al. Provincial renewable energy dispatch optimization in line with Renewable Portfolio Standard policy in China. Renew Energy. 2021;174:236–52. doi:10.1016/j.renene.2021.04.055. [Google Scholar] [CrossRef]
2. Alam MM, Murshed M, Ozturk I, Khudoykulov K. Macroeconomic determinants of non-renewable and renewable energy consumption in India: the roles of international trade, innovative technologies, financial globalization, carbon emissions, financial development, and urbanization. Energy. 2024;308(7):132939. doi:10.1016/j.energy.2024.132939. [Google Scholar] [CrossRef]
3. Zhu H, Goh HH, Zhang D, Ahmad T, Liu H, Wang S, et al. Key technologies for smart energy systems: recent developments, challenges, and research opportunities in the context of carbon neutrality. J Clean Prod. 2022;331(4):129809. doi:10.1016/j.jclepro.2021.129809. [Google Scholar] [CrossRef]
4. Wen C, Wang Q, Cao Y, Zhang L, Wang W, Zhang B, et al. Correlation analysis of wind turbine temperature rise and exergy efficiency based on field-path coupling. Energy Eng. 2023;120(7):1603–19. doi:10.32604/ee.2023.027074. [Google Scholar] [CrossRef]
5. Wen C, Zhang B, Dai Y, Wang W, Xie W, Du Q. The correlation between the power quality indicators and entropy production characteristics of wind power + energy storage systems. Energy Eng. 2024;121(10):2961–79. doi:10.32604/ee.2024.041677. [Google Scholar] [CrossRef]
6. Li Q, Zhang Y, Cheng F, Yao L, Xu Y, Liang S, et al. Generation expansion planning for Guizhou province based on the complementary characteristics of wind and solar. Energy Rep. 2022;8(6):574–84. doi:10.1016/j.egyr.2022.09.210. [Google Scholar] [CrossRef]
7. Wang Z, Zhu H, Zhang D, Goh HH, Dong Y, Wu T. Modelling of wind and photovoltaic power output considering dynamic spatio-temporal correlation. Appl Energy. 2023;352(25):121948. doi:10.1016/j.apenergy.2023.121948. [Google Scholar] [CrossRef]
8. Han S, Zhang LN, Liu YQ, Zhang H, Yan J, Li L, et al. Quantitative evaluation method for the complementarity of wind-solar–hydro power and optimization of wind-solar ratio. Appl Energy. 2019;236(7):973–84. doi:10.1016/j.apenergy.2018.12.059. [Google Scholar] [CrossRef]
9. Jurasz J, Canales FA, Kies A, Guezgouz M, Beluco A. A review on the complementarity of renewable energy sources: concept, metrics, application and future research directions. Sol Energy. 2020;195:703–24. doi:10.1016/j.solener.2019.11.087. [Google Scholar] [CrossRef]
10. Bin L, Shahzad M, Bing Q, Shoukat MU, Shakeel M, Mohammedsaeed EK. Probabilistic computational model for correlated wind farms using Copula theory. IEEE Access. 2018;6:14179–87. doi:10.1109/access.2018.2812790. [Google Scholar] [CrossRef]
11. Alghamdi AS. Optimal power flow of hybrid wind/solar/thermal energy integrated power systems considering costs and emissions via a novel and efficient search optimization algorithm. Appl Sci. 2023;13(8):4760. doi:10.3390/app13084760. [Google Scholar] [CrossRef]
12. Soukissian TH, Karathanasi FE, Zaragkas DK. Exploiting offshore wind and solar resources in the Mediterranean using ERA5 reanalysis data. Energy Convers Manag. 2021;237:114092. doi:10.1016/j.enconman.2021.114092. [Google Scholar] [CrossRef]
13. Pedruzzi R, Silva AR, Soares dos Santos T, Araujo AC, Cotta Weyll AL, Lago Kitagawa YK, et al. Review of mapping analysis and complementarity between solar and wind energy sources. Energy. 2023;283:129045. doi:10.1016/j.energy.2023.129045. [Google Scholar] [CrossRef]
14. Xiao Y, Zou C, Dong M, Chi H, Yan Y, Jiang S. Feasibility study: economic and technical analysis of optimal configuration and operation of a hybrid CSP/PV/wind power cogeneration system with energy storage. Renew Energy. 2024;225(8):120273. doi:10.1016/j.renene.2024.120273. [Google Scholar] [CrossRef]
15. Canales FA, Sapiega P, Kasiulis E, Jonasson E, Temiz I, Jurasz J. Temporal dynamics and extreme events in solar, wind, and wave energy complementarity: insights from the Polish Exclusive Economic Zone. Energy. 2024;305:132268. doi:10.1016/j.energy.2024.132268. [Google Scholar] [CrossRef]
16. Su H, Song S, Wang X. Probabilistic calculation of tidal currents for wind powered systems using PSO improved LHS. Energy Eng. 2024;121(11):3289–303. doi:10.32604/ee.2024.054643. [Google Scholar] [CrossRef]
17. Liu D, Zhang S, Cheng H, Liu L, Zhang J, Zhang X. Reducing wind power curtailment by risk-based transmission expansion planning. Int J Electr Power Energy Syst. 2021;124(1):106349. doi:10.1016/j.ijepes.2020.106349. [Google Scholar] [CrossRef]
18. Carvalho JH, Schwartz UB, Borges CLT. Copula based model for representation of hybrid power plants in non-sequential Monte Carlo reliability evaluation. Sustain Energy Grids Netw. 2023;35(14):101077. doi:10.1016/j.segan.2023.101077. [Google Scholar] [CrossRef]
19. Delbeke O, Moschner JD, Driesen J. The complementarity of offshore wind and floating photovoltaics in the Belgian North Sea, an analysis up to 2100. Renew Energy. 2023;218(20):119253. doi:10.1016/j.renene.2023.119253. [Google Scholar] [CrossRef]
20. Rezaeiha A, Montazeri H, Blocken B. A framework for preliminary large-scale urban wind energy potential assessment: roof-mounted wind turbines. Energy Convers Manag. 2020;214(10):112770. doi:10.1016/j.enconman.2020.112770. [Google Scholar] [CrossRef]
21. Gao F, Yuan C, Li Z, Zhuang S. Multi-objective optimal allocation of distributed generation considering the spatiotemporal correlation of wind-photovoltaic-load. Electr Power Syst Res. 2023;214(6):108914. doi:10.1016/j.epsr.2022.108914. [Google Scholar] [CrossRef]
22. Berzi L, Cultrera V, Delogu M, Dolfi M, Locorotondo E, Del Pero F, et al. A model for system integration of second life battery, renewable energy generation and mobile network station. In: 2020 IEEE International Conference on Environment and Electrical Engineering and 2020 IEEE Industrial and Commercial Power Systems Europe (EEEIC/I&CPS Europe); 2020 Jun 9–12; Madrid, Spain: IEEE; 2020. p. 1–6. doi:10.1109/eeeic/icpseurope49358.2020.9160747. [Google Scholar] [CrossRef]
23. Komiyama R, Fujii Y. Optimal integration assessment of solar PV in Japan’s electric power grid. Renew Energy. 2019;139(12):1012–28. doi:10.1016/j.renene.2019.02.130. [Google Scholar] [CrossRef]
24. Chen X, Lv J, McElroy MB, Han X, Nielsen CP, Wen J. Power system capacity expansion under higher penetration of renewables considering flexibility constraints and low carbon policies. IEEE Trans Power Syst. 2018;33(6):6240–53. doi:10.1109/TPWRS.2018.2827003. [Google Scholar] [CrossRef]
25. Luo Z, Yang S, Xie N, Xie W, Liu J, Souley Agbodjan Y, et al. Multi-objective capacity optimization of a distributed energy system considering economy, environment and energy. Energy Convers Manag. 2019;200:112081. doi:10.1016/j.enconman.2019.112081. [Google Scholar] [CrossRef]
26. Wen Q, Liu G, Wu W, Liao S. Genetic algorithm-based operation strategy optimization and multi-criteria evaluation of distributed energy system for commercial buildings. Energy Convers Manag. 2020;226(11):113529. doi:10.1016/j.enconman.2020.113529. [Google Scholar] [CrossRef]
27. Hormaza Mejia A, Brouwer J, Copp DA. Performance and dynamics of California offshore wind alongside Western US onshore wind and solar power. Renew Energy Focus. 2023;47(10):100490. doi:10.1016/j.ref.2023.100490. [Google Scholar] [CrossRef]
28. Jebli I, Belouadha FZ, Kabbaj MI, Tilioua A. Prediction of solar energy guided by Pearson correlation using machine learning. Energy. 2021;224(11):120109. doi:10.1016/j.energy.2021.120109. [Google Scholar] [CrossRef]
29. Wu J, Li N, Zhao Y, Wang J. Usage of correlation analysis and hypothesis test in optimizing the gated recurrent unit network for wind speed forecasting. Energy. 2022;242:122960. doi:10.1016/j.energy.2021.122960. [Google Scholar] [CrossRef]
30. Xu H, Zhang J, Cheng C, Cao H, Lu J, Zhang Z. A novel metric for evaluating hydro-wind-solar energy complementarity. Appl Energy. 2024;373(1):123926. doi:10.1016/j.apenergy.2024.123926. [Google Scholar] [CrossRef]
31. Harrison-Atlas D, Murphy C, Schleifer A, Grue N. Temporal complementarity and value of wind-PV hybrid systems across the United States. Renew Energy. 2022;201(6):111–23. doi:10.1016/j.renene.2022.10.060. [Google Scholar] [CrossRef]
32. Guezgouz M, Jurasz J, Chouai M, Bloomfield H, Bekkouche B. Assessment of solar and wind energy complementarity in Algeria. Energy Convers Manag. 2021;238(30):114170. doi:10.1016/j.enconman.2021.114170. [Google Scholar] [CrossRef]
33. Kapica J, Canales FA, Jurasz J. Global atlas of solar and wind resources temporal complementarity. Energy Convers Manag. 2021;246(1–3):114692. doi:10.1016/j.enconman.2021.114692. [Google Scholar] [CrossRef]
34. Xie C, Dong D, Hua S, Xu X, Chen Y. Safety evaluation of smart grid based on AHP-entropy method. Syst Eng Procedia. 2012;4(11):203–9. doi:10.1016/j.sepro.2011.11.067. [Google Scholar] [CrossRef]
35. El-kenawy EM, Khodadadi N, Mirjalili S, Abdelhamid AA, Eid MM, Ibrahim A. Greylag goose optimization: nature-inspired optimization algorithm. Expert Syst Appl. 2024;238(22):122147. doi:10.1016/j.eswa.2023.122147. [Google Scholar] [CrossRef]
Cite This Article
 Copyright © 2025 The Author(s). Published by Tech Science Press.
This work is licensed under a Creative Commons Attribution 4.0 International License , which permits unrestricted use, distribution, and reproduction in any medium, provided the original work is properly cited.
 Downloads
 Citation Tools