
 Submit a Paper
 Propose a Special lssue
 Open Access
ARTICLE

A Two-Stage Feature Extraction Approach for Green Energy Consumers in Retail Electricity Markets Using Clustering and TF–IDF Algorithms
1 Guangdong Power Exchange Center Co., Ltd., Guangzhou, 510180, China
2 School of Electric Power, South China University of Technology, Guangzhou, 510641, China
* Corresponding Author: Dongliang Xiao. Email:
Energy Engineering 2025, 122(5), 1697-1713. https://doi.org/10.32604/ee.2025.060571
Received 05 November 2024; Accepted 13 February 2025; Issue published 25 April 2025
 View Full Text
 Download PDF
Abstract
The rapid development of electricity retail market has prompted an increasing number of electricity consumers to sign green electricity contracts with retail electricity companies, which poses greater challenges for the market service for green energy consumers. This study proposed a two-stage feature extraction approach for green energy consumers leveraging clustering and term frequency-inverse document frequency (TF–IDF) algorithms within a knowledge graph framework to provide an information basis that supports the green development of the retail electricity market. First, the multi-source heterogeneous data of green energy consumers under an actual market environment is systematically introduced and the information is categorized into discrete, interval, and relational features. A clustering algorithm was employed to extract features of the trading behavior of green energy consumers in the first stage using the parameter data of green retail electricity contracts. Then, TF–IDF algorithm was applied in the second stage to extract features for green energy consumers in different clusters. Finally, the effectiveness of the proposed approach was validated based on the actual operational data in a southern province of China. It is shown that the most significant discrepancy between the retail trading behaviors of green energy consumers is the power share of green retail packages, whose averaged values are 25.64%, 50%, 39.66%, and 24.89% in four different clusters, respectively. Additionally, power supply bureaus and electricity retail companies affects the behavior of the green energy consumers most significantly.Keywords
In recent years, to overcome energy crisis issue [1], promote societal sustainable development [2], and mitigate climate change [3], integrating renewable energy resources into power grids has become increasingly imperative. To facilitate renewable energy consumption, electricity retail companies have launched green electricity retail contracts to satisfy green energy consumers. However, as the retail electricity market expands and electricity demands diversify, consumer behavior toward the market becomes more complex. Therefore, there is an urgent need to thoroughly analyze and comprehend the evolving complex trading behavior patterns of green electricity consumers, incentivize the green energy trading activities, and furnish decision-making tools for the electricity retail companies offering green retail contracts and the power exchange centers operating green retail electricity markets.
By the end of 2023, numerous provinces in China, such as Guangdong, Yunnan, Zhejiang and Shanxi provinces, have introduced online provincial retail energy trading platforms for electricity market, resulting in a significant number of consumers and electricity retail companies signing retail contracts online for the subsequent year. This retail trading platform offers market participants quick access to hotspot market information and launches private customized bids to multiple electricity retail companies simultaneously. Moreover, the platform facilitates trial calculations for preferred retail packages, providing insights into contract details, such as price and percentage parameters. In this circumstance, it is necessary to fully utilize the advanced data processing and analysis techniques, such as machine learning methods and knowledge graph methods, to further explore the value of the retail electricity market data available on the website of digital power trading platforms.
Electricity retail companies and consumers are key decision-makers in the retail electricity market. As shown in Fig. 1, the current research on energy consumers in retail electricity markets primarily focuses on designing electricity retail trading strategies, pricing schemes for retail packages and consumer behavior analysis.
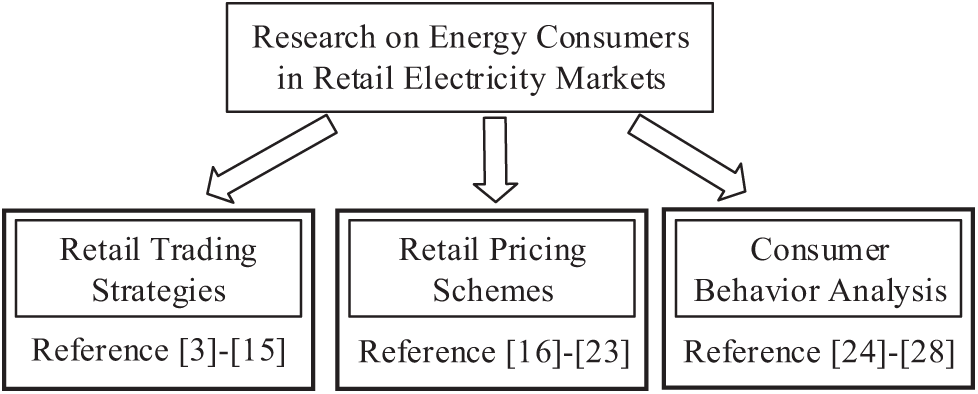
Figure 1: Research on energy consumers in retail electricity markets [3–28]
1) Retail trading strategies
In the context of retail market trading strategy optimization, the intermittent characteristics of renewable energy sources amplify risk levels for wholesale electricity market participants, necessitating managed risk through appropriate retail contract design and pricing strategies for retail electricity companies. Existing literature develops trading strategies for electricity retail companies in multi-type markets using mathematical optimization techniques, considering flexible resources such as demand response [4], energy storage [5], and financial tools [6]. Ghazvini et al. [7] and Khojasteh [8] developed multi-objective optimization models for electricity retail companies, focusing on disaster recovery scheduling and retail packages, respectively. Jacquet et al. [9] maximized the profits of an electricity retail company by designing customer contract menus and enhancing model robustness through quadratic regularization of customer response. Luo et al. [10] devised an electricity retail contract recommendation approach for residential users based on their energy consumption patterns. Lu et al. [11] investigated medium- and long-term electricity trading methodologies, while Charwand et al. [12] proposed a multi-objective framework considering the trade-off between profits and customers’ purchasing prices. Feuerriegel et al. [13] mitigated energy procurement through demand response in retail energy trading strategies. Liu et al. [14] examined electricity retail trading strategies using deep learning approaches, validated by case studies. Lu et al. [15] developed an energy cost minimization strategy for electricity retailers in China’s spot electricity market.
2) Retail pricing schemes
Efficient retail pricing schemes are essential for retailers to incentivize consumers to participate in the retail market. Green retail contracts serve as vital tools for promoting user-side renewable energy consumption, with stochastic modeling [16] and game theory widely employed. Zugno et al. [17] implemented the game theory to devise an efficient pricing method for electricity retailers, considering detailed interactions between market participants. Mahmoudi-Kohan et al. [18] established a pricing model for electricity retailers using load profiles and machine learning algorithms. Yang et al. [19] optimized retail pricing strategies with data mining methods using actual power demand data with specified pricing block numbers. Zhang et al. [20] developed a customized pricing method considering the diverse DR incentives of various consumers. Nojavan et al. [21] compared time-of-day pricing with fixed pricing methodologies to develop a retail pricing approach. Qin et al. [22] proposed a tri-level optimization approach to integrate pricing methods of electricity retailers with DR prices in wholesale electricity markets. Naseri et al. [23] reviewed risks and challenges for electricity retailers, employing machine learning and deep learning-based approaches for issue resolution.
3) Consumer behavior analysis
By analyzing the behaviors of electricity consumers, the electricity retailers can match supply and demand more accurately, formulate more reasonable pricing plans, and optimize market strategies to meet the consumers’ needs and improve market competitiveness. Guo et al. [24] comprehensively reviewed the research work on electricity consumer behavior, where the factors, theories, challenges and opportunities in social psychology were discussed in depth. Huebner et al. [25] investigated the types of variables that might explain annualized electricity consumption in residential buildings, which mainly includes the building factors, socio-demographics, appliance ownership, and attitudes. In [26], large volumes of data from smart meter were utilized to understand the knowledge of customers’ electricity consumption behaviors under competitive market environments by using time-based Markov model. Hortaçsu et al. [27] focus on analyzing the inertial decision-making behaviors in electricity markets, and an econometric model was employed to measure two sources of consumer inertias, including the search frictions/inattention and a brand advantage that consumers afford the incumbent. To promote household electricity saving, Wang et al. [28] studied the effects of non-cognitive and emotional factors on the household electricity saving behavior, and constructive policy implications were put forward.
1.3 Research Gaps and Contributions
Even though abundant research has been conducted on the retail electricity market, the trading behaviors of green energy consumers have not been analyzed comprehensively, and it is challenging to effectively leverage multi-type and multi-dimensional data related to green electricity consumers. In this circumstance, the decision makers in retail electricity markets, such as electricity retailers and market designers, cannot fully optimize their market strategies regarding the green energy consumers. To resolve the above issues, the advanced classification and feature identification methods that has been widely used in various industrial applications [29–31], can be utilized by the green energy consumers as well. Therefore, in the construction of a low-carbon electricity retail market, offering an efficient feature extraction approach for green energy consumers can partially address these challenges. This can also facilitate highly efficient and visualized analysis of green power user data, and enhance decision-making efficiencies of green electricity retail companies and consumers.
Therefore, leveraging multi-source heterogeneous data of the retail electricity market, this study adopts the basic framework of a knowledge graph and develops a two-stage feature extraction approach to comprehensively analyze green energy consumers, which are both validated using operational data and archival information on the retail electricity market. The overall framework of the proposed two-stage feature extraction approach is depicted in Fig. 2, and the contributions of the conducted research in this paper can be summarized as follows:
1) A data analysis framework based on knowledge graph is established for the green energy consumers in retail electricity markets to facilitate relevant feature analysis, where the head entity, relationship and attributes are specified and the features are categorized into discrete, interval, and relational features.
2) A practical two-stage feature extraction approach is developed for green energy consumers in retail electricity markets. A clustering algorithm was employed at the first stage to extract typical features of energy trading behavior and a TF–IDF algorithm was adopted in the second stage to further extract the other features of green energy consumers, which is easy to be implemented under actual market environments.
3) The characteristics of actual green energy consumers in a provincial retail electricity market in southern China were investigated in detail using realistic dataset. The analytic results obtained from case studies can provide information basis for the market players, system operators and policy makers, which can facilitate the development of retail electricity market under energy transition.
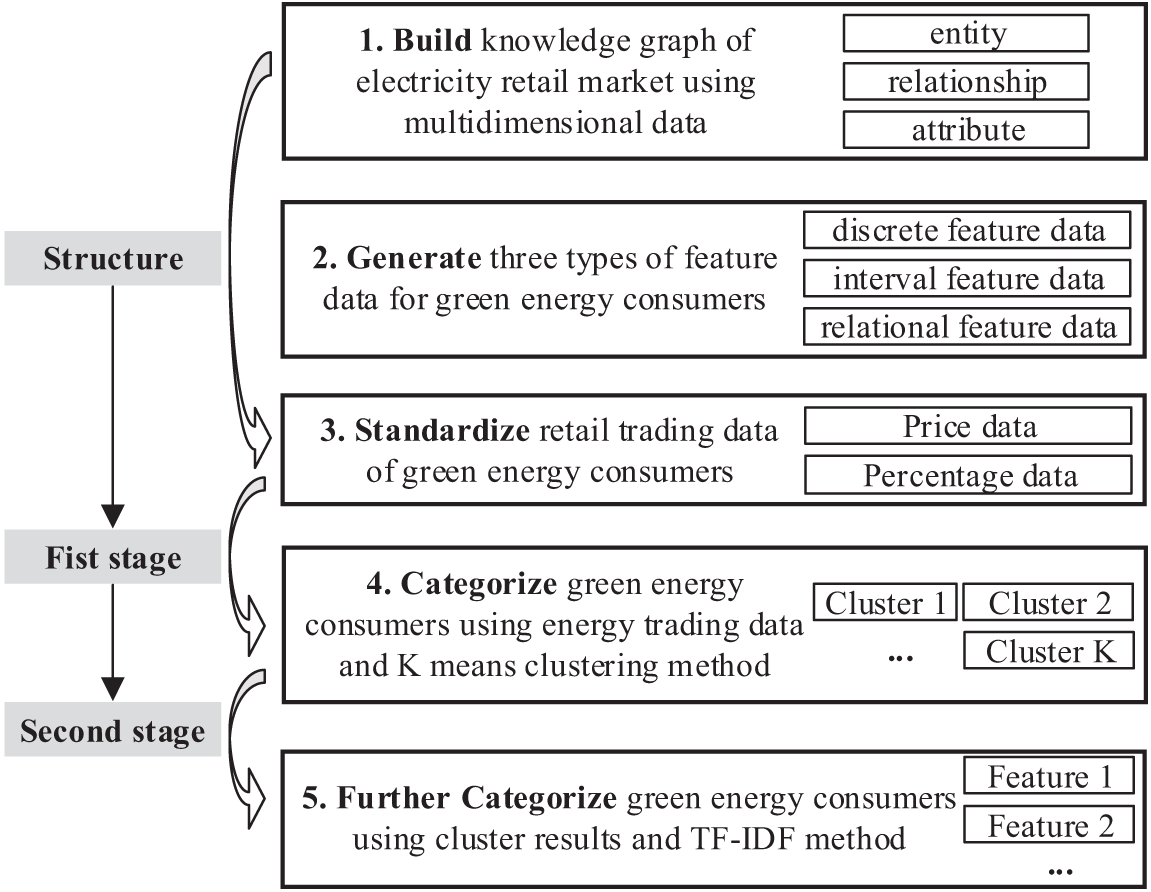
Figure 2: Overall framework of the proposed two-stage feature extraction approach for green energy consumers in retail electricity markets
The remainder of the paper is structured as follows: the first-stage feature extraction method based on clustering algorithm is presented in Section 2. Section 3 provides second-stage feature extraction method using the TF–IDF algorithm. Section 4 conducts the case studies. Section 5 presents the conclusion and discusses future work.
2 First-Stage Feature Extraction of Green Energy Consumers via Clustering
2.1 Multi-Dimensional Data and Knowledge Graph for Green Energy Consumers
Multidimensional data of green energy consumers in the retail electricity market is categorized into basic, retail contract, power consumption, and demand response information, which is depicted in Fig. 3. Specifically, the basic attributes encompass voltage level, settlement account name, and load type, while retail contract information includes details of the electricity retail company, beginning/end times, price, and percentage parameters. Similarly, the multidimensional data of green contracts within the retail electricity market environment are encapsulated into four aspects: electricity retail company, green energy consumer, price, and percentage parameters, which is depicted in Fig. 4.

Figure 3: Multi-dimensional data of green energy consumers in retail electricity markets
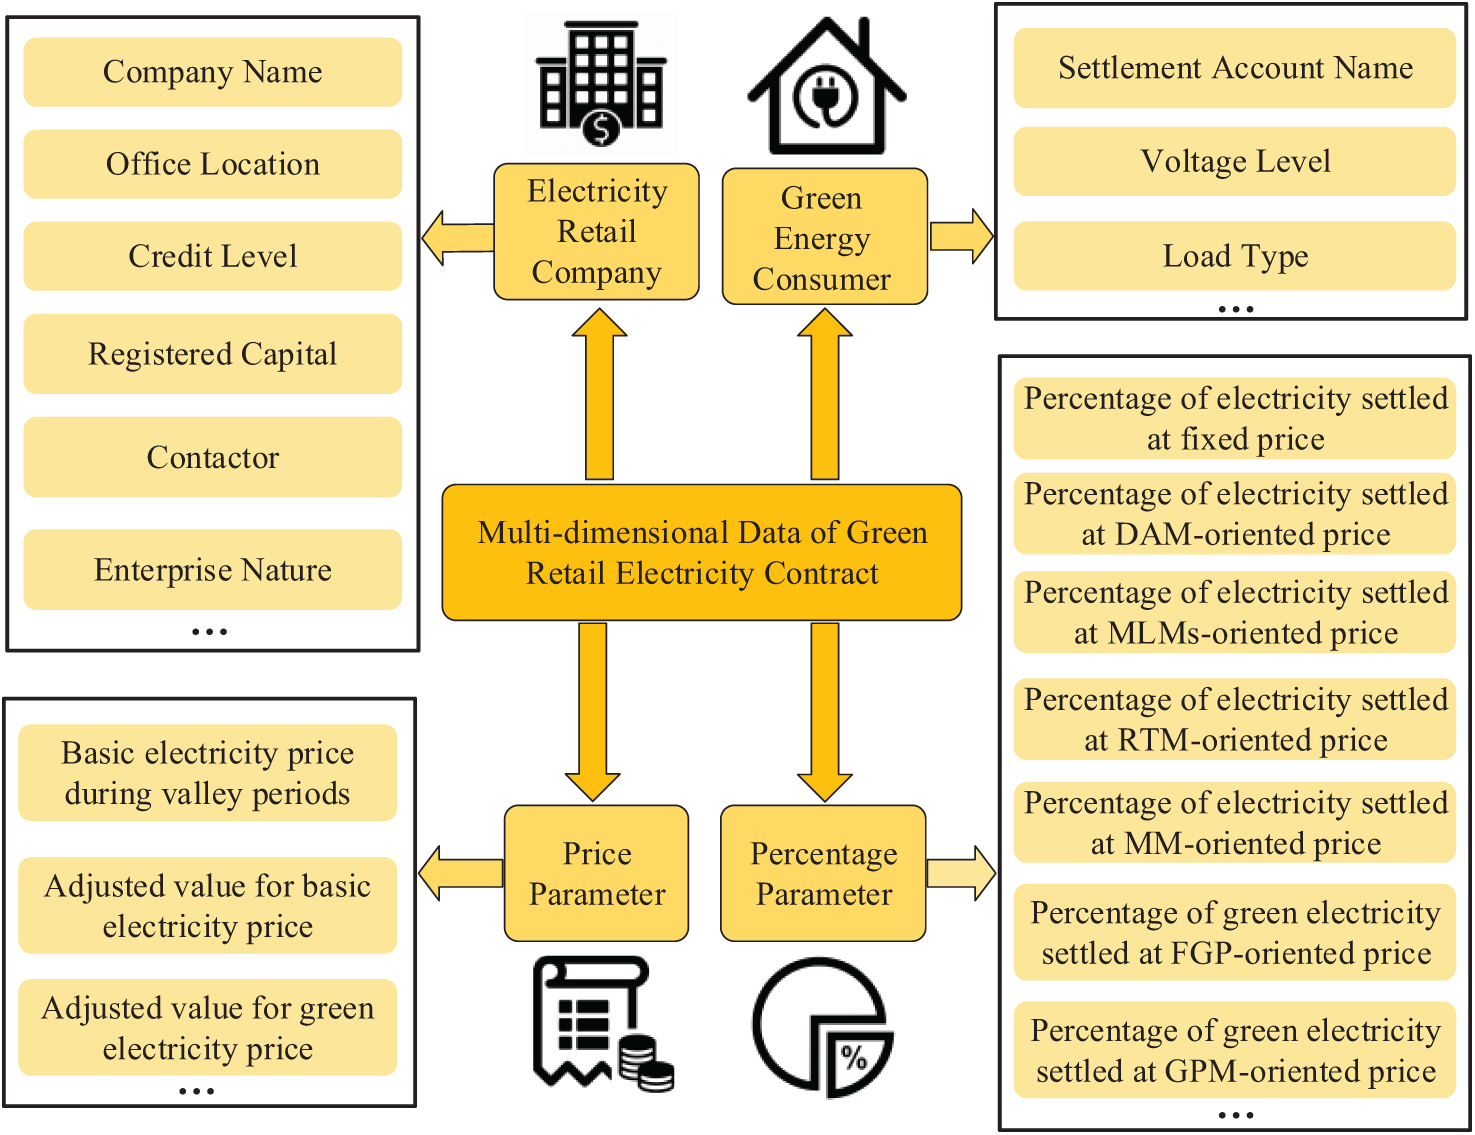
Figure 4: Multi-dimensional data of green retail electricity contracts for green energy consumers
As shown in Figs. 3 and 4, the multi-dimensional data regarding both green energy consumers and green retail electricity contracts are pretty complex, which makes it difficult to extract the important features of the green energy consumers. Therefore, a practical two-stage feature extraction approach is developed in this paper. A clustering algorithm was employed at the first stage to extract features of trading behavior and a TF–IDF algorithm was applied in the second stage to further extract other features, which is easy to be implemented under actual market environments. In this section, clustering algorithm employed at the first stage is illustrated in detail.
As shown in Fig. 5, based on the multi-dimensional data of green energy consumers and electricity retail contracts, a knowledge graph of the electricity retail market is constructed. This graph is expressed in ternary data form, with each element denoted as (x, y, z), where x, y, and z represent the head entity, relationship or attribute, and the tail entity or attribute value, respectively. The entity signifies a specific object, such as an electricity retail company, a green energy consumer, or a retail contract. The relationship denotes the linkage between entities, such as the trading relationship between a retail electricity company and a green energy consumer. The attribute and attribute values denote the parameter names and parameter values associated with an entity or concept, such as the electricity consumption value of a green energy consumer.
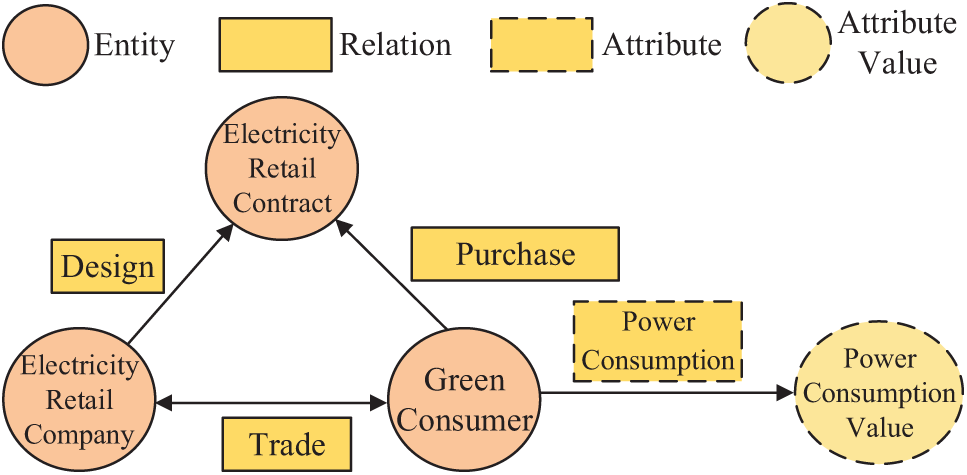
Figure 5: Basic elements of the knowledge graph built for the green energy consumer in the retail electricity market
In the knowledge graph of retail electricity market, entities primarily comprise green energy consumers, electricity retail companies, and electricity retail contracts. Relationships between these entities include the trading relationship between energy consumers and electricity retail companies, the purchase relationship between energy consumers and retail contracts, and the selling relationship between electricity retail companies and retail contracts. For instance, the attributes of green energy consumers encompass voltage level, settlement account name, electricity consumption, registration time, ice storage indicator, peak and valley leveling indicator, user address, and electricity consumption. Attributes of electricity retail companies include credit level, geographic location, industry classification, enterprise nature, number of agency users, and total personnel count. Attributes of retail contracts include various tariff types and electricity share of the power buyer, the power seller, and the retail trading contract. Rule-based reasoning techniques can refine the knowledge graph of the electricity retail market. For instance, if there is a purchasing relationship between green energy consumer A and retail contract B from electricity retail company C, it can be inferred that green energy consumer A and electricity retail company C have a trading relationship.
Based on each type of ternary group data in the knowledge graph of green energy consumers, three types of feature data can be derived: discrete, interval, and relational.
1) Discrete feature data: Attributes of entities are defined using strings or discrete values, generated from discrete attribute value data of green energy consumers in the knowledge graph. For instance, the discrete feature data <Nature of electricity consumers, Large industries> characterizes the corporate nature of a green energy consumer.
2) Interval-type feature data: Attributes of entities fall within specific interval ranges, generated from continuous-type attribute value data of a green energy consumer in the knowledge graph. For instance, the green energy consumer label <average weekday electricity load, [20, 30 kW]> characterizes the varying levels of a green energy consumer’s weekday electricity consumption.
3) Relational feature data: Relationships exist between entities, generated from the knowledge graph’s entity relational triad data for green energy consumers. For instance, <Purchase, Retail contract A> describes a purchase relationship between the green energy consumer and retail contract A.
2.2 Energy Trading Data-Based Clustering
The retail trading data of green energy consumers, i.e., the electricity price data and electricity percentage data of retail contracts, are standardized by employing the extreme difference standardization approach. Since the electricity retail market aims to aid electricity retail companies and electricity consumers realize electricity retail transactions, the retail market data (i.e., retail contract data) are chosen to cluster green energy consumers. Let I be the total number of green energy consumers in the electricity retail market, and P and Q be the price and percentage data, respectively, in the retail contracts. For the i-th green energy consumer, i = 1~I, the vectors of P and Q are denoted as
The polarity standardization method standardizes the retail contract data of green energy consumers, i.e., price and percentage data of retail contracts, as:
where
Consequently, the standardized price and percentage data of the i-th green energy consumer are expressed as
As shown in Fig. 6, the K means clustering method is utilized to classify green energy consumers, as follows:
1) The standardized retail contract data, the classification number K, the threshold v, and the maximum number of iterations U are determined.
2) K clustering centers are initialized and their distance from the contract data of green energy consumers is computed.
3) Green energy consumers are assigned to the classification of cluster center closest to them.
4) The cluster centers are recalculated for each cluster.
5) It is determined whether the K means algorithm converges or reaches the maximum number of iterations U. Failing to converge indicates that the algorithm stops when it reaches the maximum number of iterations.
6) The classification results of green electricity consumers are obtained, i.e., K green power user groups are denoted as
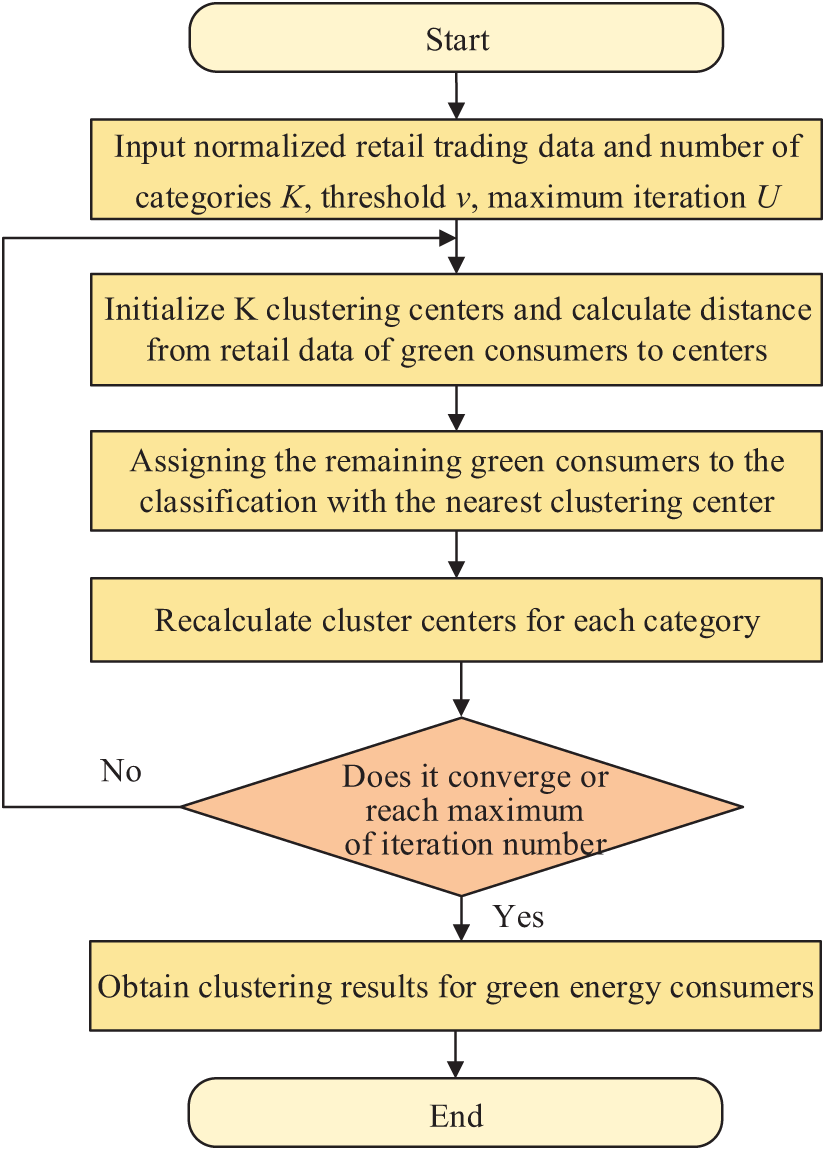
Figure 6: The main procedures of clustering green energy consumers by using retail energy trading data
The performance of the above clustering method is affected significantly by the classification number K, which is determined by using the silhouette algorithm in this paper. Specifically, the silhouette coefficient is a measure of how similar an object is to its own cluster compared to other clusters. The value ranges from −1 to 1, where a high value indicates that the object is well matched to its own cluster and poorly matched to neighboring clusters. To determine an optimal clustering number, silhouette coefficient for each point need be calculated first. Specifically, if the average distance between point i and all other points in the same cluster is
For each clustering, the average silhouette coefficient across all data points can be calculated, and this average value can provide an overall measure of how well the clusters are separated from each other.
3 Second-Stage Feature Extraction of Green Energy Consumers Using the TF–IDF Algorithm
Term frequency–inverse document frequency (TF–IDF) is a weighting technique employed in information retrieval and data mining, which is widely used for keyword mining in articles and text data cleaning. This algorithm is simple and efficient for industrial use, and it holds significant applications in text clustering, text categorization, document retrieval, and automatic abstracting. Specifically, Term Frequency (IF) is the frequency a word appears in a document, while Inverse Document Frequency (IDF) is frequence a word appears in the entire document set. In this circumstance, a lager TF indicates a word appears more frequently in a document and a smaller IDF indicates a word appears less frequently in the entire document set, where the word is considered to have good category differentiation and contributes significantly to the differentiation of the document.
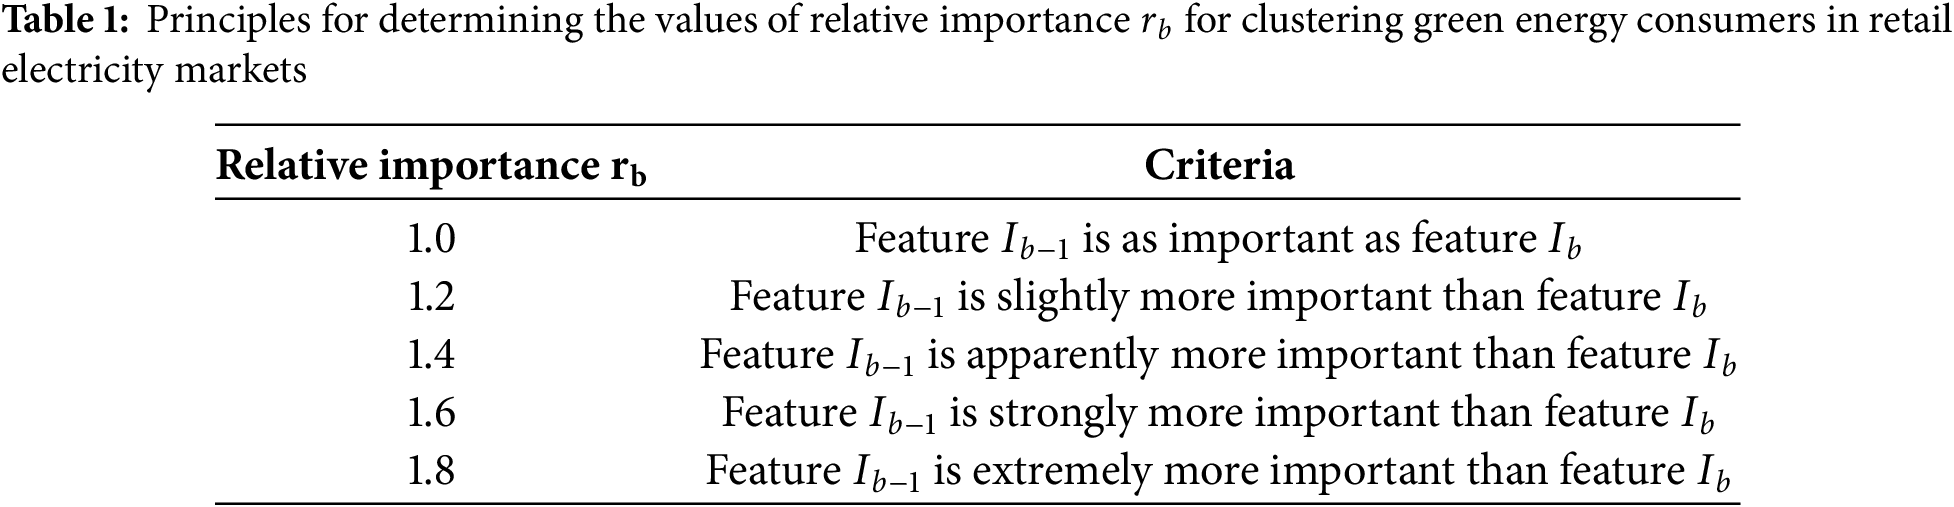
Since the feature extraction of retail market entity labels exhibits a consistent logical relationship with the document keyword selection, the TF–IDF algorithm is employed to screen the labels of green electricity consumers, such as the discrete, interval, and relational feature data of green energy consumers. In this paper, the TF–IDF values considering subjective weights are computed and sorted, and typical features of various categories of green energy consumers are extracted.
As shown in Table 1, assuming that the
1) Following the subjective preference of the decision maker for various feature types, the features of the green power user are ranked by their importance. In one implementation, these features are categorized into five classes, each capable of containing multiple features or being empty.
2) The relative importance
3) Indicators’ weights are normalized. The formula for the subjective weight of the b-th feature (b ≥ 2) is as follows:
where
4) The TF–IDF value is computed based on
where
Under the simulation environment of MATLAB 2019b, the electricity market of a southern province in China serves as an example for conducting case studies, where a typical framework consisting of wholesale and retail electricity markets are adopted. The wholesale electricity market mainly includes real-time market (RTM), day-head (DAM), monthly market (MM) and medium- and long-term market (MLM), and green power market (GPM). The retail electricity market is a bilateral trading market between retail companies and energy consumers, where the prices of retail electricity contracts can be changed with those in RTMs, DAMs, MMs, MLMs. In this dataset, 388 green electricity consumers were categorized into four clusters based on various traded electricity volumes and prices in retail electricity contracts. The K-means clustering algorithm adopted threshold v of 0.01 and the maximum number of iterations U of 100. Standard electricity retail contracts entailed seven percentage parameters and three price parameters. The percentage parameters included percentages of electricity settled at a fixed price, DAM-oriented price, MLM-oriented price, RTM-oriented price, MM-oriented price, fixed green premium (FGP)-oriented price, and GPM-oriented prices. The price parameters included basic electricity price during valley periods, adjusted value for basic electricity price, and adjusted value for green electricity price.
To enhance visualization and analysis of retail contract parameters for green energy consumers in the electricity market, 50 green energy consumers were selected by uniform sampling from the original 388. Price parameters of green energy consumers are illustrated in Fig. 7, while percentage parameters of fixed basic electricity and green electricity are depicted in Fig. 8. The remaining percentage parameters are displayed in Fig. 9.
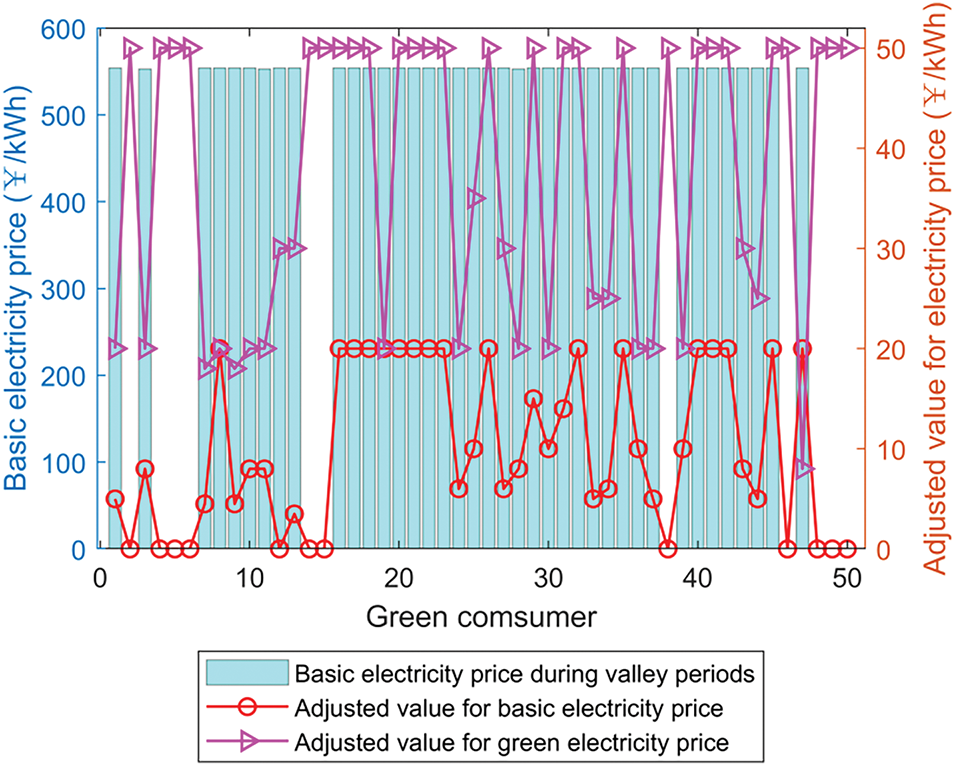
Figure 7: Price parameters of the green retail electricity contracts available for green energy consumers
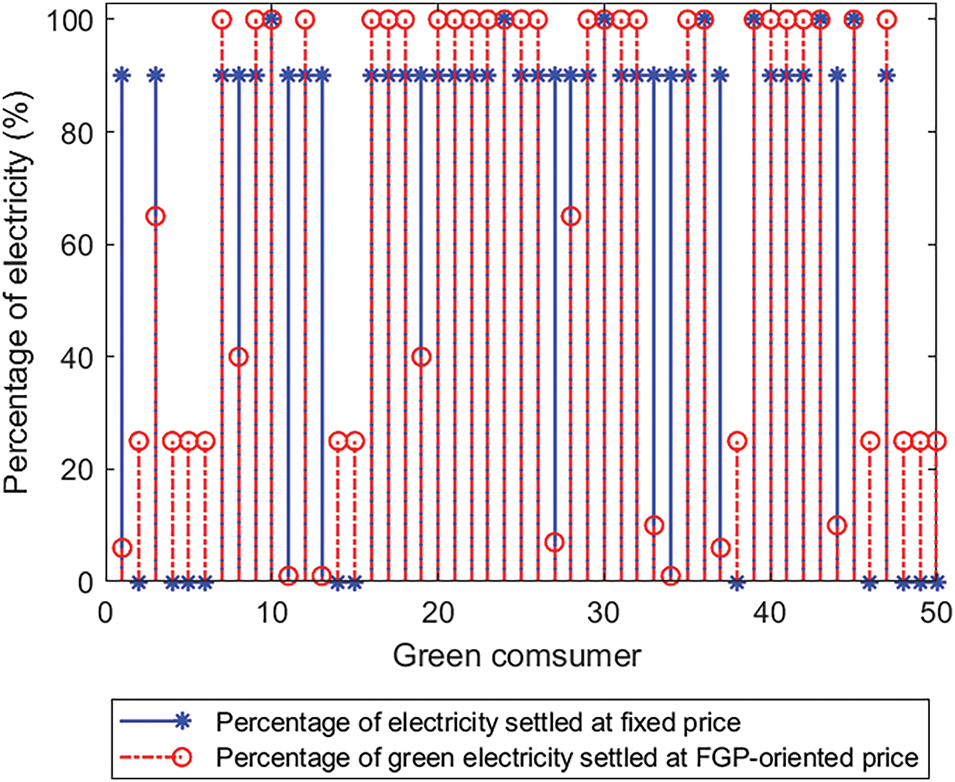
Figure 8: Primary percentage parameters of the green retail electricity contracts available for green energy consumers
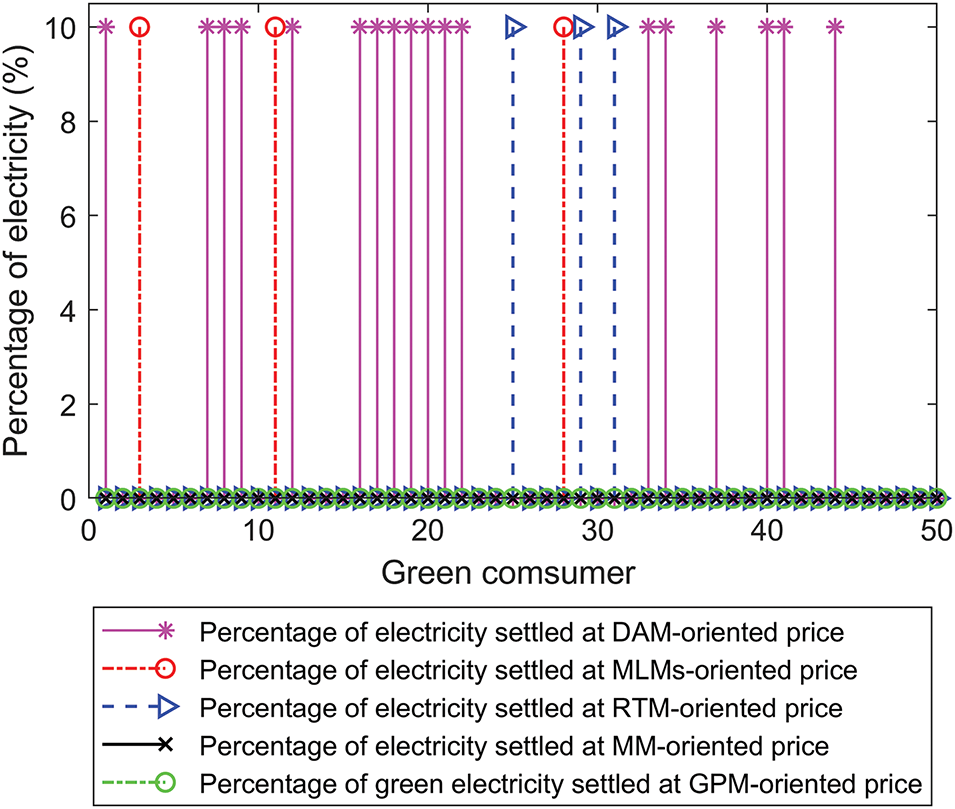
Figure 9: Secondary percentage parameters of the green retail electricity contracts available for green energy consumers
As shown in Fig. 7, most green energy consumers signed the retail electricity contract with a fixed basic electricity price, approximating 550 Li/kWh and falling within the market operator’s set range for basic electricity price [554, 382]. The adjusted value for the basic electricity price may be set to be positive when the electricity retail company deems the actual electricity price should exceed the upper limit of 554. The adjusted value for the green electricity price was specified considering the additional environmental value of renewable power productions.
The primary percentage parameters in the retail electricity contract were the percentages of electricity settled at a fixed price and the green electricity settled at a GPM-oriented price. As shown in Fig. 8, most green energy consumers preferred for 90% of their electricity to be settled at fixed prices and 100% of their green electricity settled at an FGP-oriented price. The other percentage parameters shown in Fig. 9 depict that the maximum value was 10% and the percentage of electricity settled at DAM-oriented price was most widely utilized by green energy consumers.
The proposed feature extraction algorithm was simulated and analyzed within the MATLAB 2019b environment. During the initial stage of K-means clustering, the optimal cluster number was determined by using the criteria of silhouette score shown in Fig. 10, which is served as a metric to assess clustering quality, aiding in the determination of whether data points were accurately assigned to their respective clusters. A higher silhouette score indicates greater similarity among data points within clusters and greater dissimilarity between data points across different clusters, representing favorable clustering outcomes. In the case study, when the cluster number was set to 4, the performance of green energy consumer clustering was optimal.
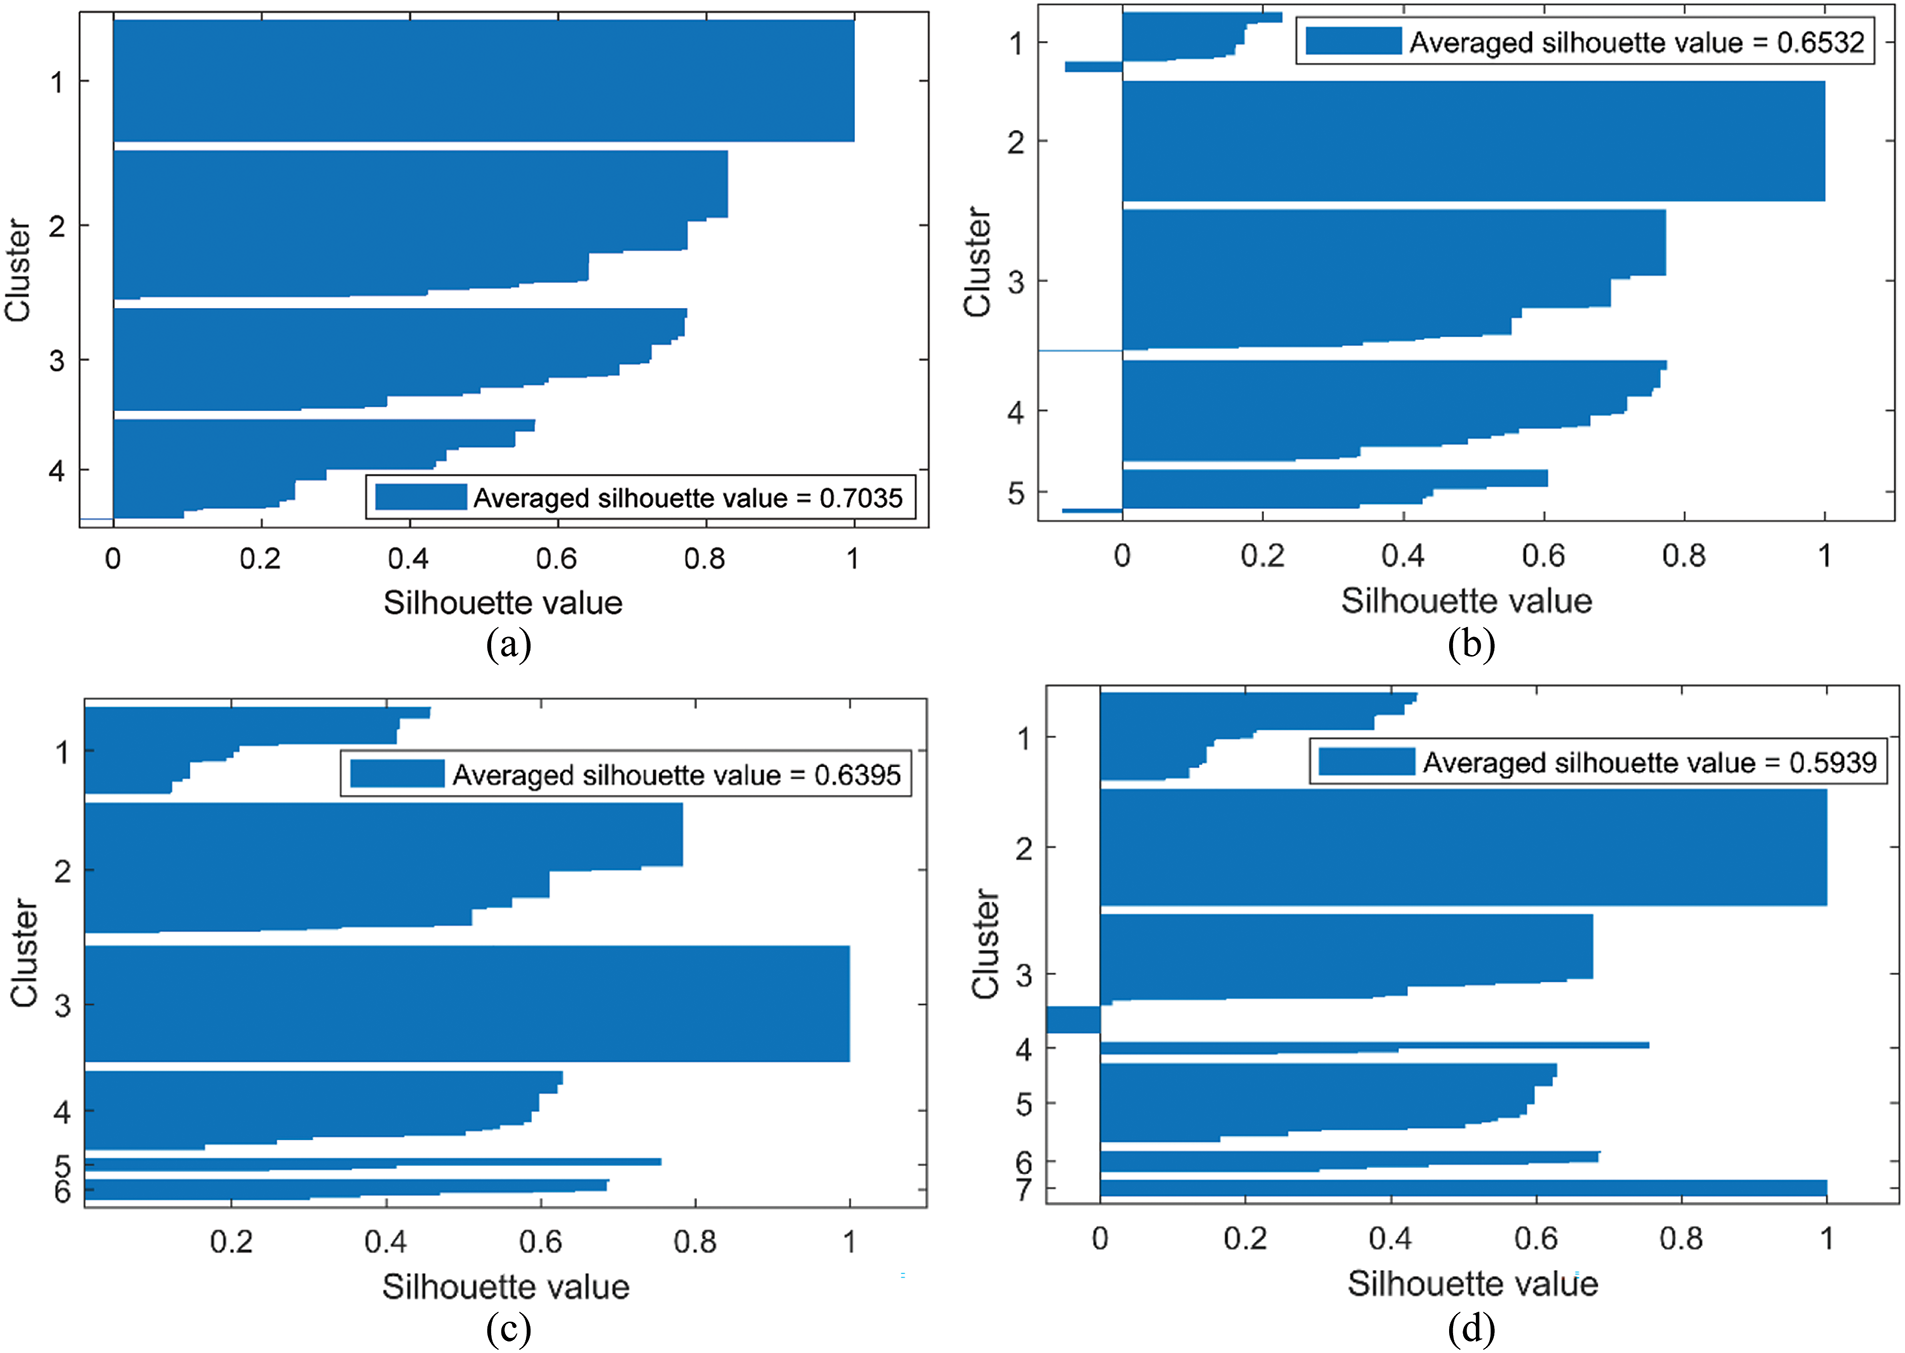
Figure 10: Silhouette values of the clustering results of green energy consumers when cluster numbers are (a) 4, (b) 5, (c) 6, and (d) 7
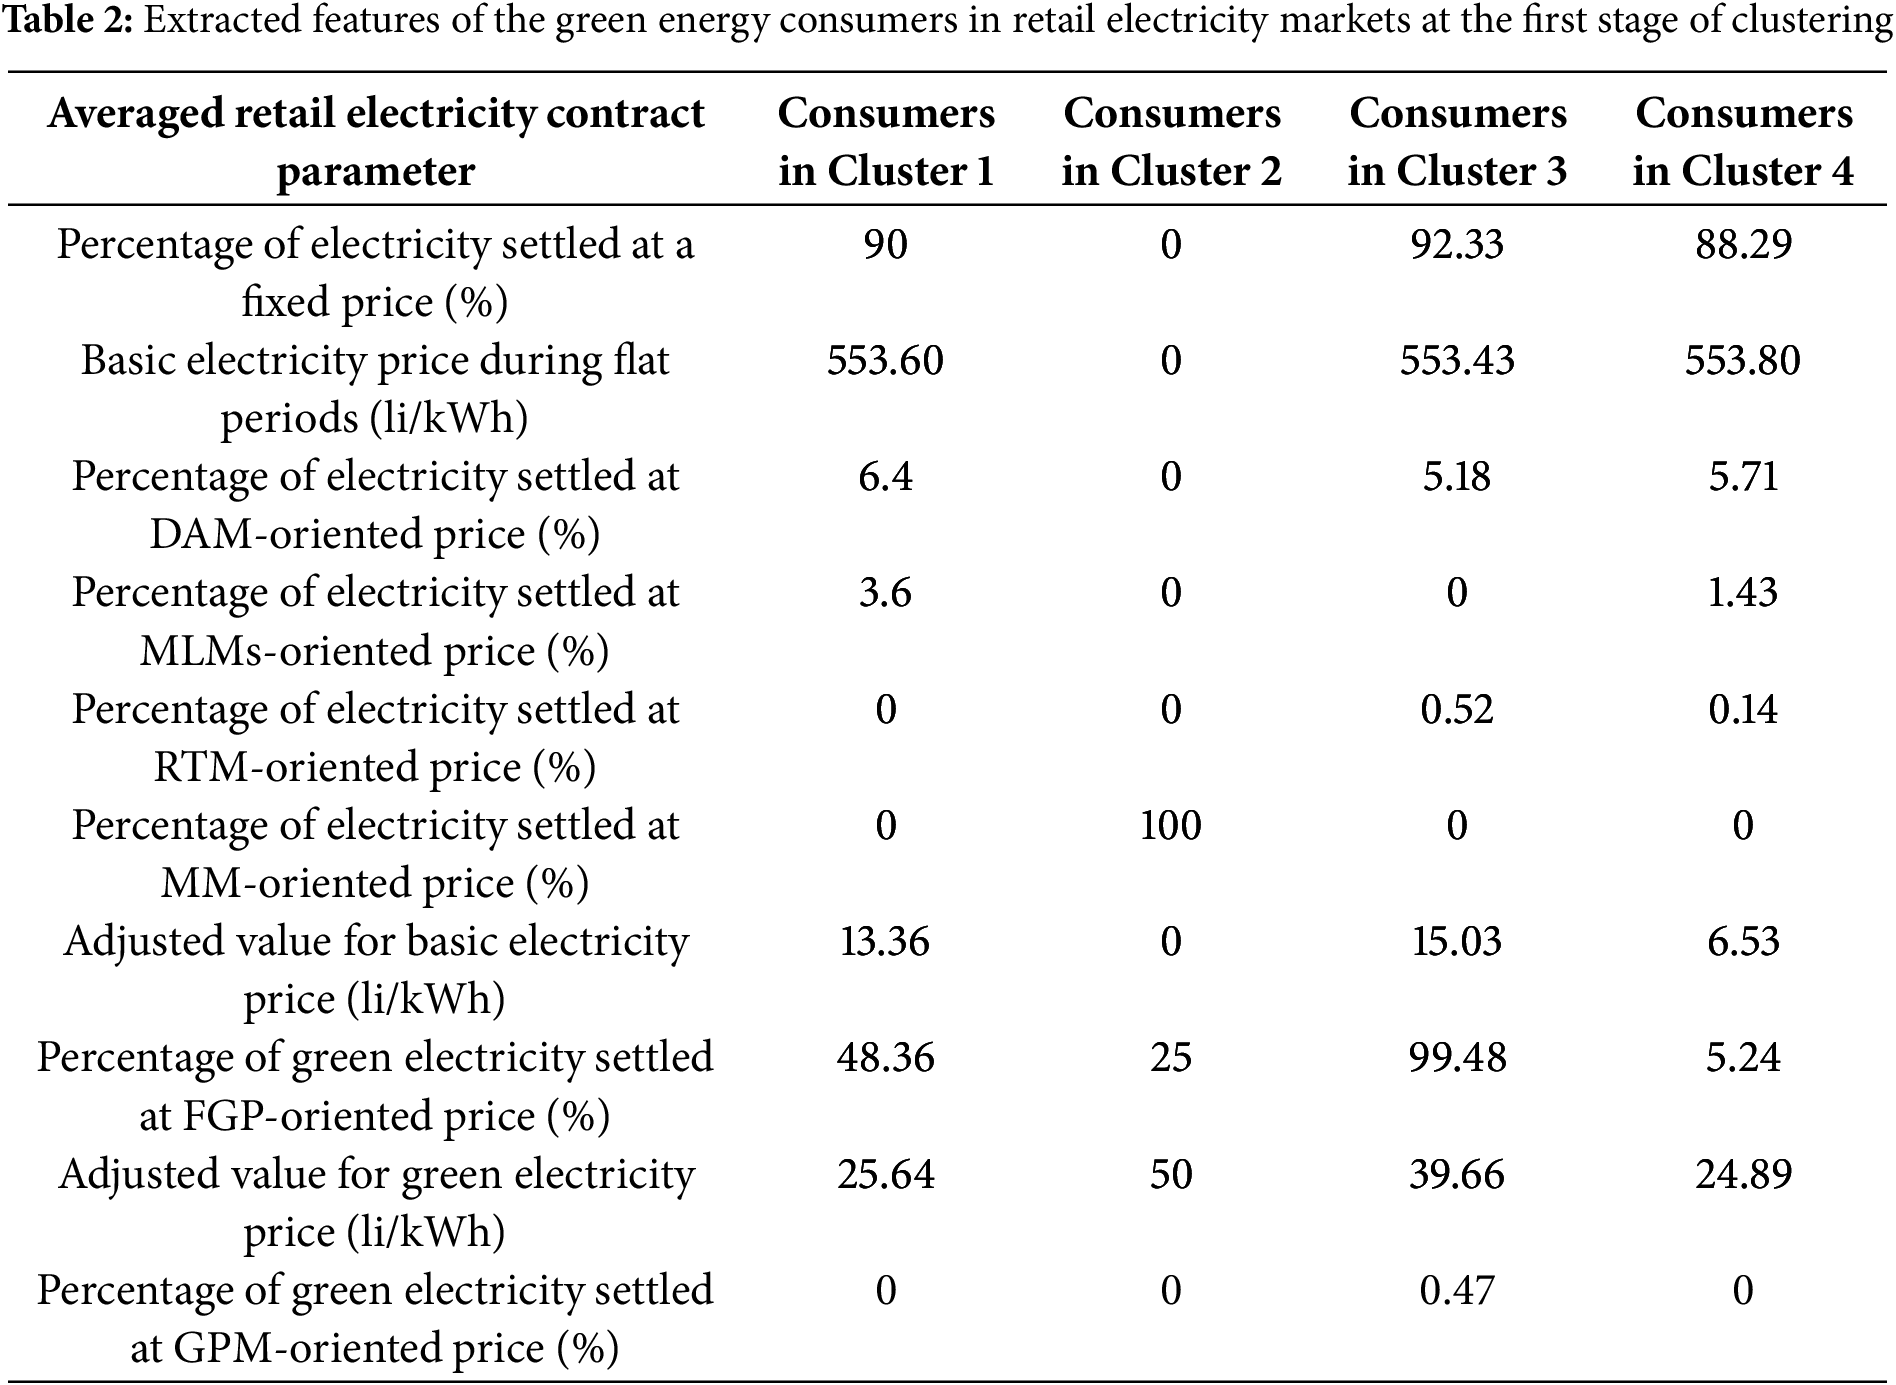
As shown in Table 2, the most significant discrepancy between the retail trading data of the four types of green energy consumers pertained to the power share of green retail packages. The average environmental premium fixed-price power shares of the four types of green electricity consumers in Clusters 1–4 were 25.64%, 50%, 39.66%, and 24.89%, respectively, indicating a pronounced difference. Additionally, the percentage of electricity settled at MM-oriented price for the green energy consumers in Cluster 2 is 100%, while zero for those in Clusters 1, 3 and 4. This indicates that the monthly market is the most important for the electricity bills of green energy consumers in Cluster 2.
Utilizing the TF–IDF algorithm, the second stage of feature extraction for green energy consumers exhibiting different trading behaviors was conducted, and the results are provided in Table 3. The most important features extracted from the four types of green electricity consumers were <Power Supply Bureau, FS Power Supply Bureau>, <Trade, Electricity Retail Company QH>, <Power Supply Bureau, DG Power Supply Bureau>, and <Power Supply Bureau, HZ Power Supply Bureau>. The second important features extracted from the four types of green electricity consumers were <Power Supply Bureau, FS Power Supply Bureau>, <Trade, Electricity Retail Company QH>, <Power Supply Bureau, DG Power Supply Bureau>, and <Power Supply Bureau, HZ Power Supply Bureau>.
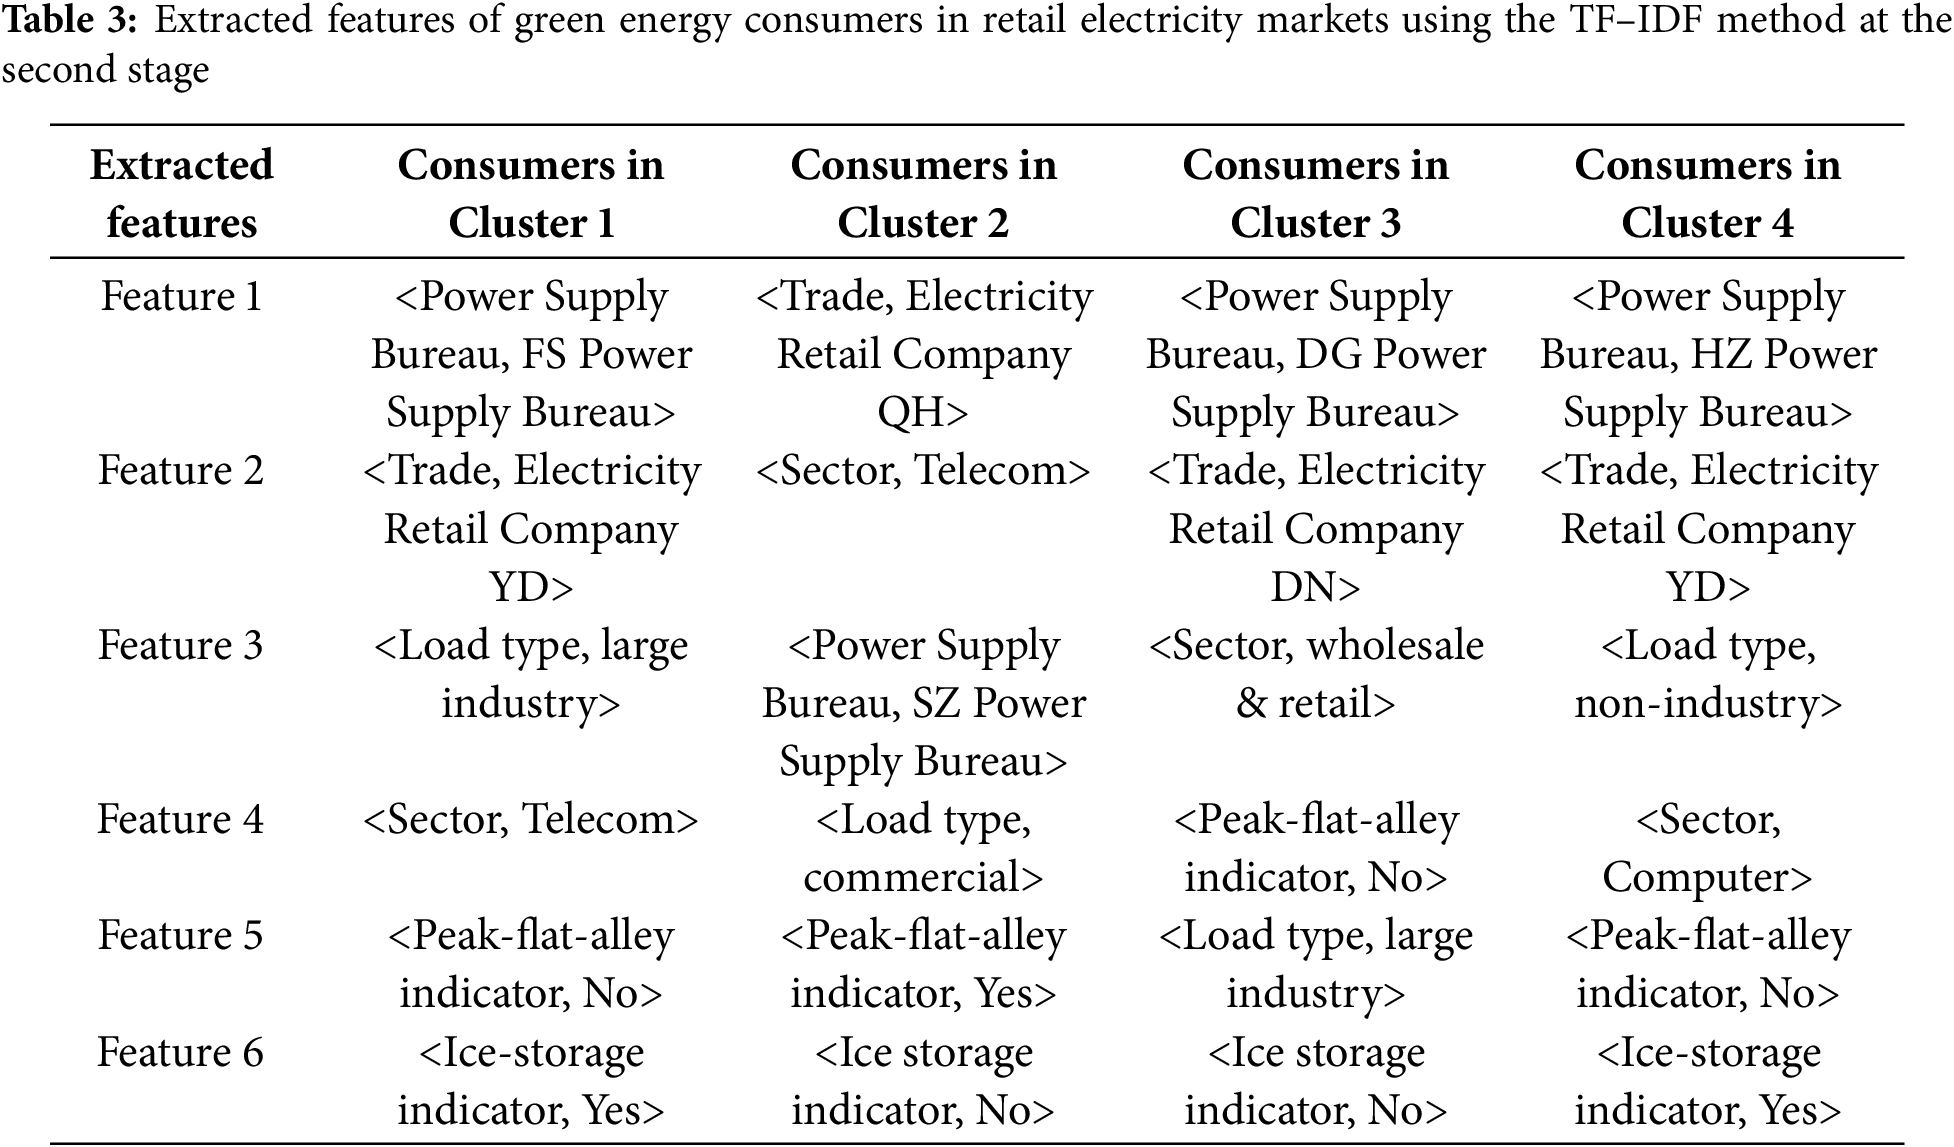
The results in Table 3 suggest that the retail energy trading behavior of green energy consumers was influenced by their geographical locations and retail electricity companies significantly, indicating dissemination of market information among green energy consumers. Specifically, most of the green energy consumers in Clusters 1, 3 and 4 are located at FS, DG and HZ, respectively, and most of the green energy consumers in Clusters 1 and 4 signed retail electricity contracts with the Electricity Retail Companies of YD. Moreover, it seems that the energy consumers in the sectors of telecom, computer and retail & wholesale are more likely to sign green electricity contracts with electricity retail companies. In the case study, the overall operational performance of the retail electricity market warrants further optimization, facilitated by enhancing information disclosure and service levels of the online retail electricity trading platform.
This paper proposed a two-stage feature extraction approach for green energy consumers leveraging clustering and TF–IDF algorithms within a knowledge graph framework to support the green development of the retail electricity market, which was validated and analyzed using operational data of the electricity retail market and profile information of green electricity consumers in a southern province of China. The main conclusions and suggestions in the case study are summarized as follows:
1) The most significant discrepancy between the retail trading behaviors of green electricity consumers is the power share of green retail packages. The average environmental premium fixed-price power shares of the four types of green electricity consumers in Clusters 1–4 were 25.64%, 50%, 39.66%, and 24.89%, respectively.
2) The retail energy trading behavior of green energy consumers in the studied electricity market was influenced by their geographical locations and retail electricity companies most significantly, indicating extensive sharing and dissemination of market information among green energy consumers.
3) To facilitate the decision making of green energy trading in retail electricity markets, it would be helpful if the features of green energy consumers could be analyzed in depth and visualized on the digital online trading platform. This might help the electricity retail company sign green retail contracts with green energy consumers more efficiently, which can promote the low-carbon development of electricity market.
Future research will focus on developing efficient demand response programs considering the features of green energy consumers, such as data centers [32], industrial consumers [33], and residential consumers [34]. Additionally, the impacts of other dynamic variables, such as market regulation policies [35], weather condition [36], and carbon prices [37] on the green energy consumers, can be further investigated to improve the efficiency of the retail electricity market with green energy trading.
Acknowledgement: Not applicable.
Funding Statement: This paper is support by the Science and Technology Project of Guangdong Power Exchange Center Co., Ltd. (No. GDKJXM20222599), National Natural Science Foundation of China (No. 52207104), and Natural Science Foundation of Guangdong Province (No. 2024A1515010426).
Author Contributions: Methodology, Formal analysis: Wei Yang; Writing—review & editing: Weicong Tan and Zhijian Zeng; Data curation: Ren Li, Jie Qin and Yuting Xie; Formal analysis: Yongjun Zhang and Runting Cheng; Supervision, Writing—review & editing: Dongliang Xiao. All authors reviewed the results and approved the final version of the manuscript.
Availability of Data and Materials: Data will be made available on reasonable request.
Ethics Approval: Not applicable.
Conflicts of Interest: The authors declare no conflicts of interest to report regarding the present study.
References
1. Farghali M, Osman AI, Mohamed IM, Chen Z, Chen L, Ihara I, et al. Strategies to save energy in the context of the energy crisis: a review. Environ Chem Lett. 2023;21(4):2003–39. doi:10.1007/s10311-023-01591-5. [Google Scholar] [PubMed] [CrossRef]
2. Østergaard PA, Duic N, Noorollahi Y, Kalogirou S. Renewable energy for sustainable development. Renew Energy. 2022;199:1145–52. doi:10.1016/j.renene.2022.09.065. [Google Scholar] [CrossRef]
3. Olabi AG, Abdelkareem MA. Renewable energy and climate change. Renew Sustain Energ Rev. 2022;158:112111. doi:10.1016/j.rser.2022.112111. [Google Scholar] [CrossRef]
4. Ding X, Xu J, Sun Y, Liao S, Zheng J. A demand side controller of electrolytic aluminum industrial microgrids considering wind power fluctuations. Prot Control Mod Power Syst. 2022;7(1):1–13. doi:10.1186/s41601-022-00270-x. [Google Scholar] [CrossRef]
5. Xiao D, Chen H, Cai W, Wei C, Zhao Z. Integrated risk measurement and control for stochastic energy trading of a wind storage system in electricity markets. Prot Control Mod Power Syst. 2023;8(1):60. doi:10.1186/s41601-023-00329-3. [Google Scholar] [CrossRef]
6. Deng S-J, Oren SS. Electricity derivatives and risk management. Energy. 2006;31(6–7):940–53. [Google Scholar]
7. Ghazvini MAF, Soares J, Horta N, Neves R, Castro R, Vale Z. A multi-objective model for scheduling of short-term incentive-based demand response programs offered by electricity retailers. Appl Energy. 2015;151:102–18. [Google Scholar]
8. Khojasteh M. Multi-objective energy procurement strategy of electricity retail companies based on normalized normal constraint methodology. Int J Electr Power Energy Syst. 2022;135:107281. [Google Scholar]
9. Jacquet Q, Van Ackooij W, Alasseur C, Gaubert S. Quadratic regularization of bilevel pricing problems and application to retail electricity markets. Eur J Oper Res. 2024;313(3):841–57. doi:10.1016/j.ejor.2023.05.006. [Google Scholar] [CrossRef]
10. Luo F, Ranzi G, Wang X, Dong ZY. Social information filtering-based electricity retail plan recommender system for smart grid end users. IEEE Trans Smart Grid. 2017;10(1):95–104. doi:10.1109/TSG.2017.2732346. [Google Scholar] [CrossRef]
11. Lu T, Zhang W, Wang Y, Xie H, Ding X. Medium-and long-term trading strategies for large electricity retailers in China’s electricity market. Energies. 2022;15(9):3342. doi:10.3390/en15093342. [Google Scholar] [CrossRef]
12. Charwand M, Ahmadi A, Heidari AR, Nezhad AE. Benders decomposition and normal boundary intersection method for multiobjective decision making framework for an electricity retailer in energy markets. IEEE Syst J. 2014;9(4):1475–84. doi:10.1109/JSYST.2014.2331322. [Google Scholar] [CrossRef]
13. Feuerriegel S, Neumann D. Measuring the financial impact of demand response for electricity retailers. Energy Policy. 2014;65:359–68. doi:10.1016/j.enpol.2013.10.012. [Google Scholar] [CrossRef]
14. Liu Y, Zhang D, Gooi HB. Data-driven decision-making strategies for electricity retailers: a deep reinforcement learning approach. CSEE J Power Energy Syst. 2020;7(2):358–67. doi:10.17775/CSEEJPES.2019.02510. [Google Scholar] [CrossRef]
15. Lu T, Zhang W, Ding X. Operation strategy of electricity retailers based on energy storage system to improve comprehensive profitability in China’s electricity spot market. Energies. 2021;14(19):6424. doi:10.3390/en14196424. [Google Scholar] [CrossRef]
16. Möst D, Keles D. A survey of stochastic modelling approaches for liberalised electricity markets. Eur J Oper Res. 2010;207(2):543–56. [Google Scholar]
17. Zugno M, Morales JM, Pinson P, Madsen H. A bilevel model for electricity retailers’ participation in a demand response market environment. Energy Econ. 2013;36:182–97. doi:10.1016/j.eneco.2012.12.010. [Google Scholar] [CrossRef]
18. Mahmoudi-Kohan N, Moghaddam MP, Sheikh-El-Eslami MK. An annual framework for clustering-based pricing for an electricity retailer. Elect Power Syst Res. 2010;80(9):1042–8. doi:10.1016/j.epsr.2010.01.010. [Google Scholar] [CrossRef]
19. Yang J, Zhao J, Wen F, Dong Z. A model of customizing electricity retail prices based on load profile clustering analysis. IEEE Trans Smart Grid. 2018;10(3):3374–86. doi:10.1109/TSG.2018.2825335. [Google Scholar] [CrossRef]
20. Zhang C, Qiu J, Yang Y, Zhao J. Residential customers-oriented customized electricity retail pricing design. Int J Electr Power Energy Syst. 2023;146:108766. doi:10.1016/j.ijepes.2022.108766. [Google Scholar] [CrossRef]
21. Nojavan S, Zare K. Optimal energy pricing for consumers by electricity retailer. Int J Electr Power Energy Syst. 2018;102:401–12. doi:10.1016/j.ijepes.2018.05.013. [Google Scholar] [CrossRef]
22. Qin M, Yang Y, Zhao X, Xu Q, Yuan L. Low-carbon economic multi-objective dispatch of integrated energy system considering the price fluctuation of natural gas and carbon emission accounting. Prot Control Mod Power Syst. 2023;8(4):1–18. [Google Scholar]
23. Naseri N, Talari S, Ketter W, Collins J. Dynamic retail market tariff design for an electricity aggregator using reinforcement learning. Elect Power Syst Res. 2022;212:108560. doi:10.1016/j.epsr.2022.108560. [Google Scholar] [CrossRef]
24. Guo Z, Zhou K, Zhang C, Lu X, Chen W, Yang S. Residential electricity consumption behavior: influencing factors, related theories and intervention strategies. Renew Sustain Energ Rev. 2018;81:399–412. [Google Scholar]
25. Huebner G, Shipworth D, Hamilton I, Chalabi Z, Oreszczyn T. Understanding electricity consumption: a comparative contribution of building factors, socio-demographics, appliances, behaviours and attitudes. Appl Energy. 2016;177:692–702. [Google Scholar]
26. Wang Y, Chen Q, Kang C, Xia Q. Clustering of electricity consumption behavior dynamics toward big data applications. IEEE Trans Smart Grid. 2016;7(5):2437–47. [Google Scholar]
27. Hortaçsu A, Madanizadeh SA, Puller SL. Power to choose? An analysis of consumer inertia in the residential electricity market. Am Econ J: Econ Policy. 2017;9(4):192–226. [Google Scholar]
28. Wang S, Lin S, Li J. Exploring the effects of non-cognitive and emotional factors on household electricity saving behavior. Energy Policy. 2018;115:171–80. [Google Scholar]
29. Uppal M, Gupta D, Anand D, Alharithi SF, Almotiri J, Ortega-Mansilla A, et al. Fault pattern diagnosis and classification in sensor nodes using fall curve. Comput Mater Contin. 2022;72(1):1799–814. doi:10.32604/cmc.2022.025330. [Google Scholar] [CrossRef]
30. Bhatti UA, Huang M, Neira-Molina H, Marjan S, Baryalai M, Tang H, et al. MFFCG-Multi feature fusion for hyperspectral image classification using graph attention network. Expert Syst Appl. 2023;229:120496. [Google Scholar]
31. Bhatti UA, Yu Z, Chanussot J, Zeeshan Z, Yuan L, Luo W, et al. Local similarity-based spatial-spectral fusion hyperspectral image classification with deep CNN and Gabor filtering. IEEE Trans Geosci Remote Sens. 2021;60:1–15. [Google Scholar]
32. Zhang Y, Zou B, Jin X, Luo Y, Song M, Ye Y, et al. Mitigating power grid impact from proactive data center workload shifts: a coordinated scheduling strategy integrating synergistic traffic-data-power networks. Appl Energy. 2025;377:124697. [Google Scholar]
33. Xiao D, Lin Z, Wu Q, Meng A, Yin H, Lin Z. Risk-factor-oriented stochastic dominance approach for industrial integrated energy system operation leveraging physical and financial flexible resources. Appl Energy. 2025 Jan 1;377:124347. [Google Scholar]
34. Zhang Y, Qian W, Ye Y, Li Y, Tang Y, Long Y, et al. A novel non-intrusive load monitoring method based on ResNet-seq2seq networks for energy disaggregation of distributed energy resources integrated with residential houses. Appl Energy. 2023;349:121703. [Google Scholar]
35. Li Y, Xiao D, Chen H, Cai W, Campos do Prado J. Analyzing the wind-dominant electricity market under coexistence of regulated and deregulated power trading. Energy Eng. 2024;121(8):2093–127. [Google Scholar]
36. Lai S, Qiu J, Tao Y, Liu Y. Risk hedging strategies for electricity retailers using insurance and strangle weather derivatives. Int J Electr Power Energy Syst. 2022;134:107372. [Google Scholar]
37. Wang G, Wu Y, Qian X, Zhao Y. Distributed robust scheduling optimization of wind-thermal-storage system based on hybrid carbon trading and wasserstein fuzzy set. Energy Eng. 2024;121(11):3417–35. [Google Scholar]
Cite This Article
 Copyright © 2025 The Author(s). Published by Tech Science Press.
This work is licensed under a Creative Commons Attribution 4.0 International License , which permits unrestricted use, distribution, and reproduction in any medium, provided the original work is properly cited.
 Downloads
 Citation Tools