
 Submit a Paper
 Propose a Special lssue
 Open Access
ARTICLE

Optimal Evaluation of Photovoltaic Consumption Schemes in Distribution Networks Based on BASS Model for Photovoltaic Installed Capacity Prediction
1 School of Automation, Guangdong University of Technology, Guangzhou, 510000, China
* Corresponding Author: Chenyang Fu. Email:
Energy Engineering 2025, 122(5), 1805-1821. https://doi.org/10.32604/ee.2025.061172
Received 18 November 2024; Accepted 04 March 2025; Issue published 25 April 2025
 View Full Text
 Download PDF
Abstract
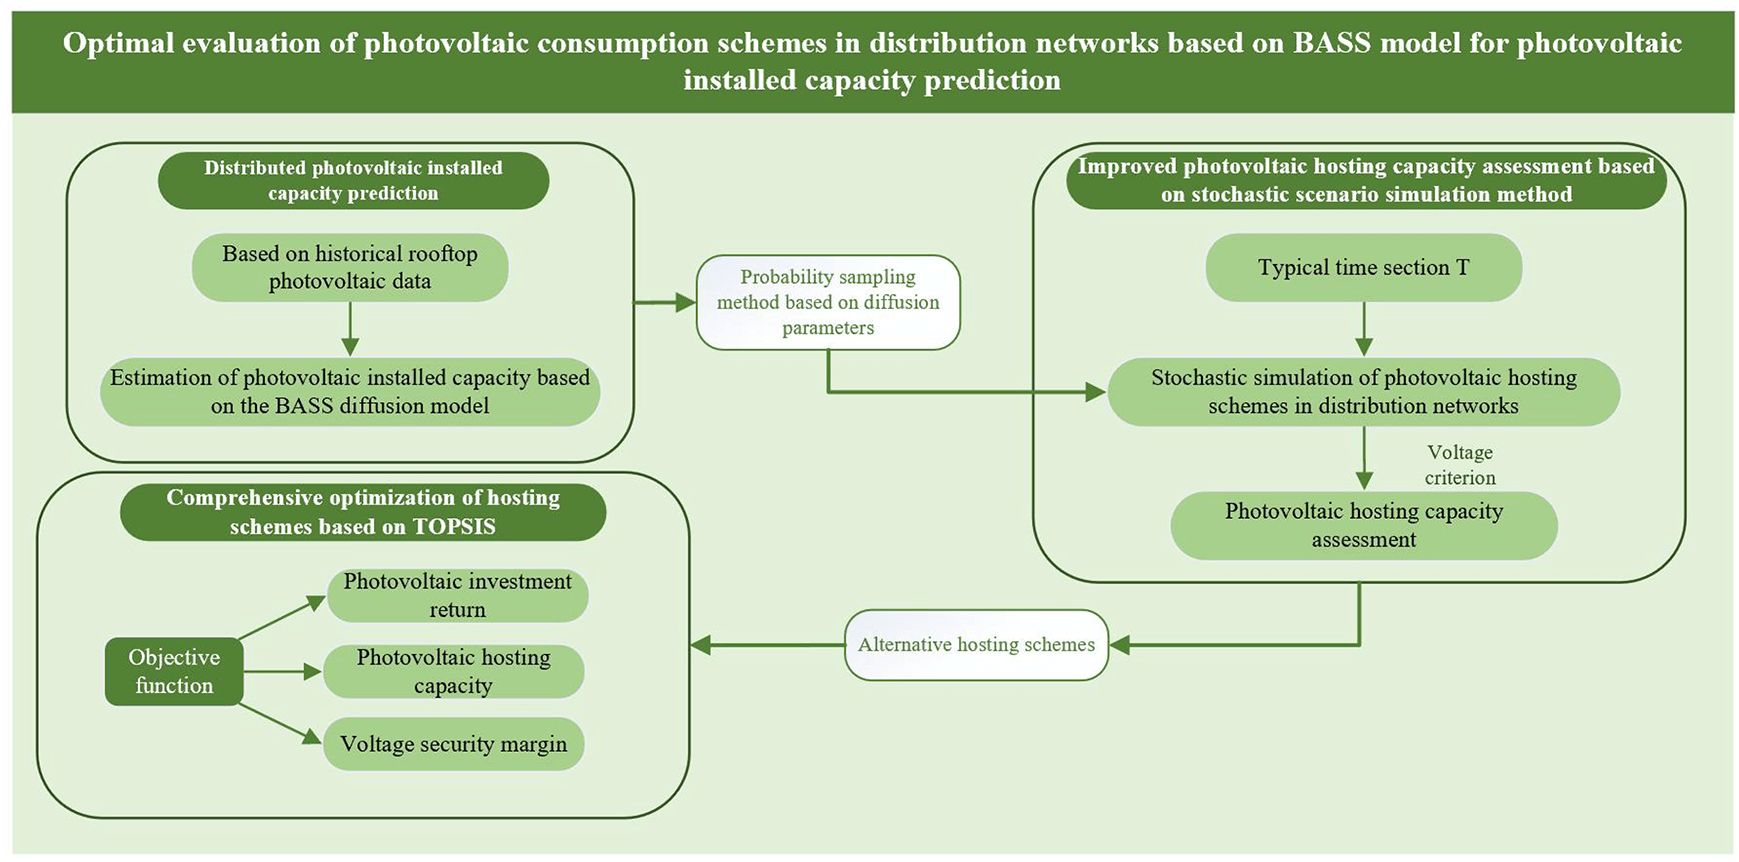
With the large-scale promotion of distributed photovoltaics, new challenges have emerged in the photovoltaic consumption within distribution networks. Traditional photovoltaic consumption schemes have primarily focused on static analysis. However, as the scale of photovoltaic power generation devices grows and the methods of integration diversify, a single consumption scheme is no longer sufficient to meet the actual needs of current distribution networks. Therefore, this paper proposes an optimal evaluation method for photovoltaic consumption schemes based on BASS model predictions of installed capacity, aiming to provide an effective tool for generating and evaluating photovoltaic consumption schemes in distribution networks. First, the BASS diffusion model, combined with existing photovoltaic capacity data and roof area information, is used to predict the trends in photovoltaic installed capacity for each substation area, providing a scientific basis for consumption evaluation. Secondly, an improved random scenario simulation method is proposed for assessing the photovoltaic consumption capacity in distribution networks. This method generates photovoltaic integration schemes based on the diffusion probabilities of different regions and evaluates the consumption capacity of each scheme. Finally, the Technique for Order Preference by Similarity to an Ideal Solution (TOPSIS) is used to comprehensively evaluate the generated schemes, ensuring that the selected scheme not only meets the consumption requirements but also offers high economic benefits and reliability. The effectiveness and feasibility of the proposed method are validated through simulations of the IEEE 33-node system, providing strong support for optimizing photovoltaic consumption schemes in distribution networks.Graphic Abstract
Keywords
With the continuous growth of global energy demand and increasing concerns about carbon emissions, renewable energy has gradually become an important alternative to traditional fossil fuels. Photovoltaic (PV) power generation, due to its cleanliness, renewability, and distributed nature, is gaining widespread adoption globally [1–3]. By the end of 2021, China’s newly installed PV capacity reached 54.88 million kW [4]. However, the large-scale integration of distributed photovoltaics can cause voltage fluctuations, making the assessment of the consumption capacity of distribution networks with high levels of PV integration particularly important [5–7]. Predicting the future installed capacity of photovoltaics in distribution networks is a prerequisite for the evaluation of their consumption capacity.
Literature [8,9] addressed the issue of PV growth in the evaluation of photovoltaic installed capacity by adopting an increase in penetration rate, which does not accurately reflect the actual growth of photovoltaics. Therefore, more realistic predictions of PV capacity growth are needed. Some recent studies have focused on predicting future trends in distributed PV capacity. For example, literature [10] utilized a system dynamics model based on an improved grey wolf optimization algorithm to forecast user PV installations, incorporating factors such as electricity subsidies that directly affect household PV sales. In a similar vein, literature [11] proposed a system dynamics model to predict incentives for PV installation and decision-making models for users regarding grid-connected PV systems. However, both studies focused on objective factors such as dynamic policy evolution, rather than simulating the subjective factors of user purchasing behavior, which limits their accuracy in photovoltaic forecasting. If both subjective and objective factors are considered comprehensively, the prediction of photovoltaic installed capacity can be more accurate.
Currently, methods for assessing PV consumption capacity can be broadly classified into two categories: software simulation methods [12–14] and mathematical optimization algorithms [15–17]. Software simulation methods, such as those using MATLAB and other computational software, build systems for simulation, allowing for real-time calculation and evaluation of various parameters. Literature [12] employs a two-stage adjustable robust optimization to address the uncertainties in load demands and DG outputs, and proposes a robust comprehensive DG capacity assessment method considering three-phase power flow modeling and active network management (ANM) techniques. Literature [13] discussed the photovoltaic consumption capacity under three different scenarios: concentrated at the feeder source, middle point, and end point, and determined the maximum consumption capacity for each location. The second category is mathematical optimization algorithms, including analytical methods, intelligent optimization algorithms, and stochastic scenario simulations, which establish network models and solve them using various algorithms. For instance, literature [15] categorized PV integration into single, multiple, or all nodes and applied an improved simulated annealing-particle swarm optimization algorithm to find the maximum consumption capacity for different distribution network conditions. However, the results obtained from analytical methods and intelligent optimization algorithms are often local or global optima, which may not reflect the true, comprehensive photovoltaic consumption capacity of the distribution network. By using stochastic scenario simulation methods, various photovoltaic integration situations can be simulated, and extensive simulation sampling can be conducted to reflect the actual consumption capacity of the distribution network.
This paper adopts the BASS diffusion model to predict the future growth of distributed photovoltaics in each substation area. Secondly, a photovoltaic integration scenario generation method based on diffusion probabilities is proposed, which simulates photovoltaic integration schemes and evaluates the consumption capacity of all schemes year by year as photovoltaic capacity grows [18]. Finally, the Technique for Order Preference by Similarity to an Ideal Solution (TOPSIS) [19] is applied, which not only evaluates the scheme with the highest maximum photovoltaic consumption capacity under optimal economic efficiency and reliability but also provides the corresponding photovoltaic configuration. Using the IEEE 33-bus system as a benchmark example, simulations are conducted in MATLAB, and the results validate the accuracy and effectiveness of the proposed method.
2 Prediction of Distributed Photovoltaic Installed Capacity Based on the BASS Diffusion Model
The consumption capacity of distributed photovoltaics is influenced by the location of connection substations, the size of rooftop areas, and the progress of development. On one hand, it is necessary to select a tool to simulate the diffusion process, ensuring that the growth of photovoltaics aligns with actual conditions; on the other hand, a development cap needs to be established to constrain growth based on rooftop photovoltaic area.
Building on this, the approximate assessment of photovoltaic installed capacity in distribution networks can illustrate the dynamic evaluation process of annual growth and provide a clear representation of the photovoltaic consumption situation for each year. The Bass Diffusion Model is commonly used to predict the diffusion trends of innovative products and technologies, and it has also been widely applied in the prediction of rooftop photovoltaic installed capacity [20]. The basic form of the BASS diffusion model is as follows:
In the equation,
The diffusion parameters
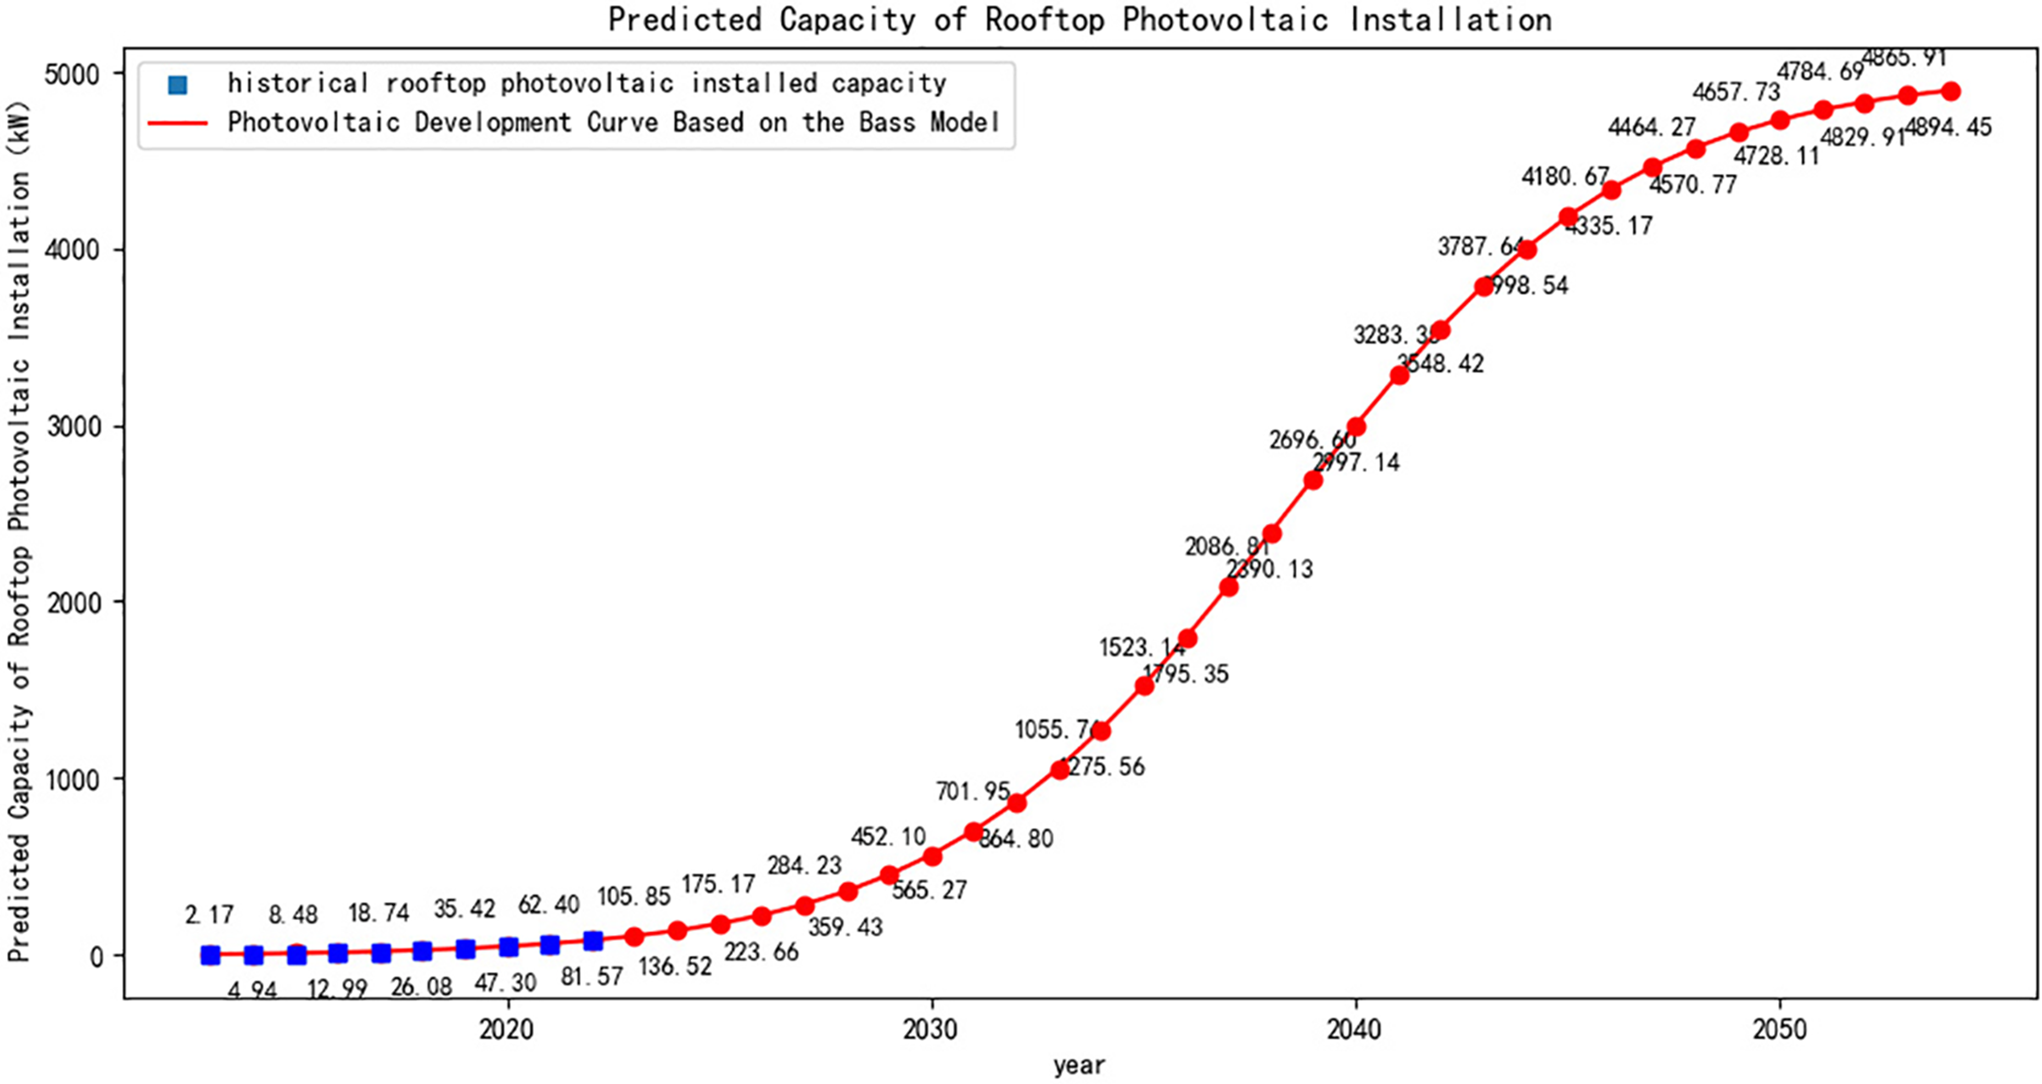
Figure 1: BASS diffusion model distributed photovoltaic installation fitting diagram
The blue squares represent historical rooftop photovoltaic data from 2013 to 2022, while the red circles indicate the photovoltaic installed capacity values predicted based on the BASS model. The overall prediction curve exhibits an S-shaped pattern. In the early stages, the growth is primarily influenced by the innovation coefficient
3 Based on the Improved Stochastic Scenario Simulation Method for Photovoltaic Consumption Capacity Assessment in Distribution Networks
Large-scale integration of distributed photovoltaics may lead to unstable power fluctuations and frequency deviations in the grid, affecting power quality. In severe cases, it can cause reverse power flow issues, potentially resulting in equipment damage or failure, and even triggering system collapse. This paper focuses on the issue of voltage fluctuations by imposing limits on the maximum voltage to facilitate bounded simulations. There is uncertainty in the integration of distributed photovoltaics in substations, influenced by users’ subjective factors. Therefore, this paper adopts a photovoltaic integration scheme generation method based on diffusion parameters, which maintains uncertainty while making the integration choices more realistic. Subsequently, based on the photovoltaic forecasts for each substation area, the photovoltaic growth for all schemes is evaluated under typical load scenarios, thereby providing an approximate assessment of the consumption capacity for each scheme.
3.1 Generation of Typical Scenarios
The load demand of the distribution network and the output of distributed photovoltaics exhibit significant temporal characteristics and fluctuations. This study selects the most common photovoltaic-load scenarios for evaluation. Based on annual load data and solar radiation intensity data, the K-means clustering method is utilized to identify the day with the most typical photovoltaic load variation. The load-photovoltaic difference is then defined as the moment when the absolute value of the load and the photovoltaic output have the greatest disparity, which is analyzed as a typical moment. The formula is as follows:
In the formula,
3.2 Stochastic Scenario Simulation of Photovoltaic Consumption Schemes in Distribution Networks Based on Diffusion Probabilities
3.2.1 Stochastic Scenario Simulation Method Based on Diffusion Probabilities
Since the integration of distributed photovoltaics is not only random but also has a certain degree of subjectivity, using Monte Carlo fully random sampling or uniform sampling methods to simulate distributed photovoltaic access schemes is not accurate. In the previous section, the BASS diffusion model was used to predict photovoltaic installed capacity, resulting in three diffusion parameters (
In the formula,
3.2.2 Improved Stochastic Scenario Simulation Steps
After determining the typical time slice
(1) Determine the number of photovoltaic access nodes. Let the total number of nodes in the distribution network be
(2) Determine the photovoltaic access locations. Based on the access quantity, randomly select
(3) Incremental capacity growth of each photovoltaic node. Each selected photovoltaic node will increase its capacity annually according to the predicted future photovoltaic installed capacity for each substation area, and the total installed capacity will be recorded after each increment.
(4) Power flow calculation. Calculate the power flow results for this consumption scheme year by year, recording voltage data for each year, and determine whether the voltage at each substation meets the voltage constraints.
where
(5) Repeat steps (1) and (2). Multiple photovoltaic access schemes can be randomly generated, saving the access locations, total installed capacity, and voltage results for each scheme.
3.3 Photovoltaic Consumption Capacity Assessment in Distribution Networks
This paper uses the voltage level of the distribution network and photovoltaic capacity limits as the main criteria for approximate evaluation, analyzing the consumption capacity under different distributed photovoltaic access schemes. Fig. 2 shows the scatter plot of the photovoltaic consumption capacity assessment for a distribution network, generated after the Monte Carlo sampling of photovoltaic access schemes. Each “line” in the figure represents a unique random photovoltaic access scheme, indicated by different colors. Based on the BASS diffusion model, the future photovoltaic access capacity for each substation area was predicted, allowing the total photovoltaic access capacity to increase annually according to the forecasted values, resulting in the scattered points on the “line”. Each point on a “line” represents the maximum voltage value of the distribution network and the total photovoltaic access capacity for a given access scheme in different years. The horizontal axis indicates the total photovoltaic access capacity of the random access schemes, while the vertical axis represents the maximum system voltage for each random scheme at different access capacities. A vertical comparison shows significant differences in voltage levels among the schemes at the same photovoltaic access capacity, highlighting the importance of studying the site selection and configuration of photovoltaics in distribution networks.
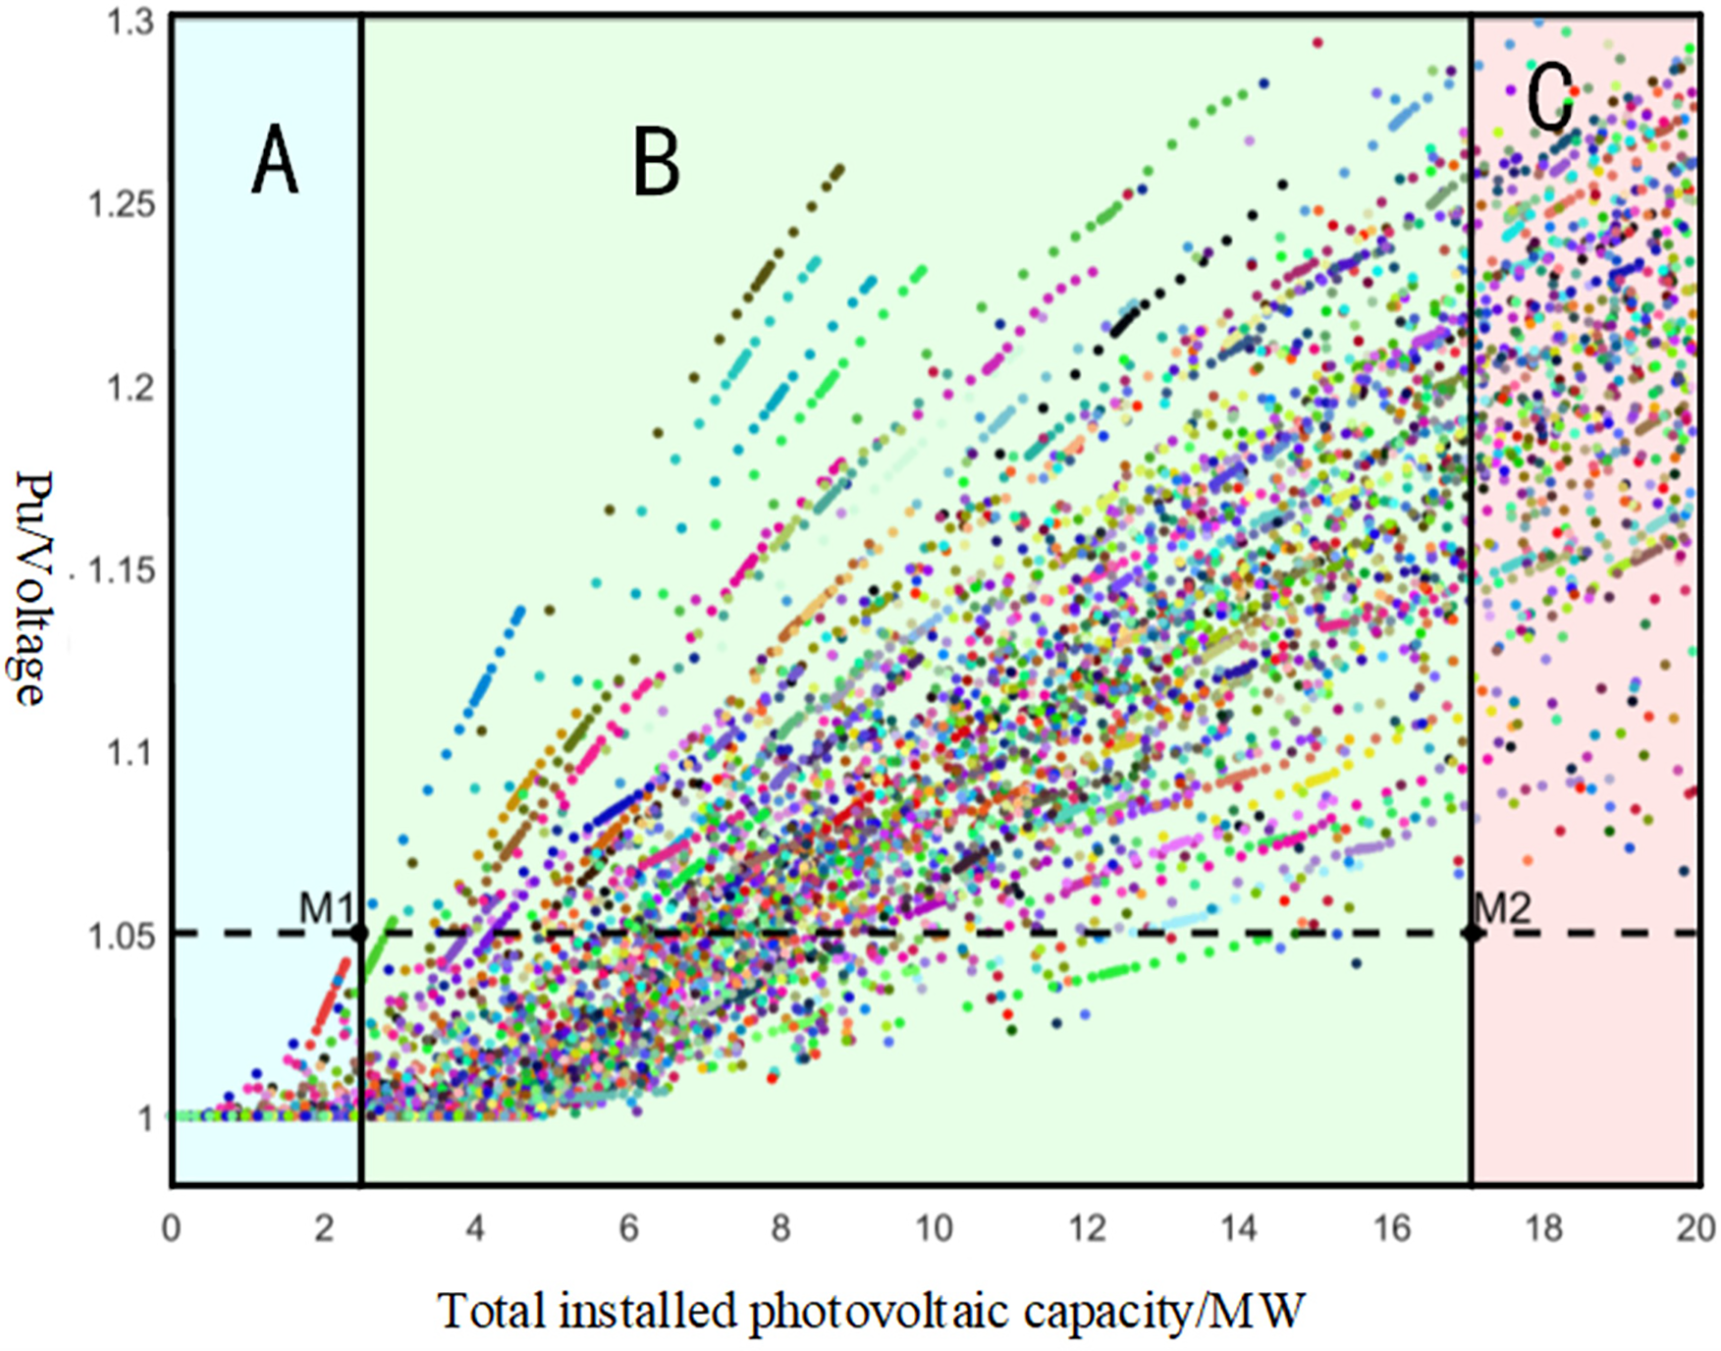
Figure 2: Simulation results of photovoltaic random access scheme
In Fig. 2, the dashed line at a voltage of 1.05 pu represents the voltage constraint of the distribution network. The intersections formed between the voltage constraint dashed line and the various “lines” indicate several points of interest. The labeled intersection points
The area to the left of the horizontal coordinate
The area greater than
The area greater than
The scheme near point
4 Comprehensive Selection of Photovoltaic Consumption Schemes Based on TOPSIS
In the
Good voltage quality is essential for the stable operation of power systems and the normal functioning of equipment. This paper uses the level exceeding the upper voltage constraint as an evaluation metric and establishes a voltage deviation model to assess the voltage quality of photovoltaic access schemes.
In the equation,
4.2 Annual Investment Cost Model
The initial investment for distributed photovoltaic (PV) integration mainly relates to the installation of inverters and PV modules. The mid-term costs primarily include the purchase costs of electricity from higher levels, while the later stage mainly involves the operation and maintenance (O&M) costs of PV generation. This paper establishes an investment cost model for distributed PV integration around these three indicators. The investment cost model for distributed PV is as follows:
In the formula,
The formula for the initial investment cost of distributed PV integration is as follows:
In the formula,
The formula for the higher-level electricity purchase costs is as follows:
In the equation,
Finally, the post-investment primarily consists of the operational and maintenance costs for the equipment, which can be expressed as:
In the equation,
4.3 Comprehensive Selection of Schemes Based on TOPSIS
After determining the candidate consumption schemes and calculating the voltage deviation and investment costs for each scheme, this paper employs the TOPSIS method based on the entropy weighting approach to conduct a comprehensive evaluation of consumption capacity, voltage quality, and investment costs, thereby selecting the optimal consumption scheme. The TOPSIS method [22], also known as the Technique for Order of Preference by Similarity to Ideal Solution, is a multi-attribute decision-making method used to assess the merits of alternative schemes. The entropy weighting method can better reflect the correlation among attributes and the uncertainty of their weights. The steps for selecting the optimal consumption scheme using the entropy-weighted TOPSIS method are as follows:
(1) Select
(2) Calculate the evaluation indicators for each object: total consumption capacity, voltage deviation, and investment cost. Establish the initial multi-objective matrix
(3) Determine the entropy weights for each indicator. Calculate the probability matrix
(4) Calculate the positive and negative ideal solutions
(5) Calculate the proximity of each evaluation object to the ideal solution, resulting in a final score. Normalize the scores to rank the schemes and select the scheme with the maximum score as the optimal consumption scheme.
This study uses the IEEE 33-node distribution network system for simulation, which is divided into four areas: commercial, industrial, residential, and mixed-use zones. The network topology is shown in Fig. 3. The system operates at a voltage level of 12.66 kV, with a base power of 10 MVA and voltage limits set at 1.05 and 0.95 pu. The total system power is 3.175 MW + 2.3 MVar, with node 1 serving as the balancing node, set at a voltage of 1.0 pu, while the remaining 32 nodes are load nodes capable of integrating photovoltaic systems. The residential area includes nodes 1 to 13, represented in green; the mixed-use area consists of nodes 14 to 18, shown in gray; the commercial area encompasses nodes 19 to 25, depicted in blue; and the industrial area includes nodes 26 to 33, illustrated in orange.
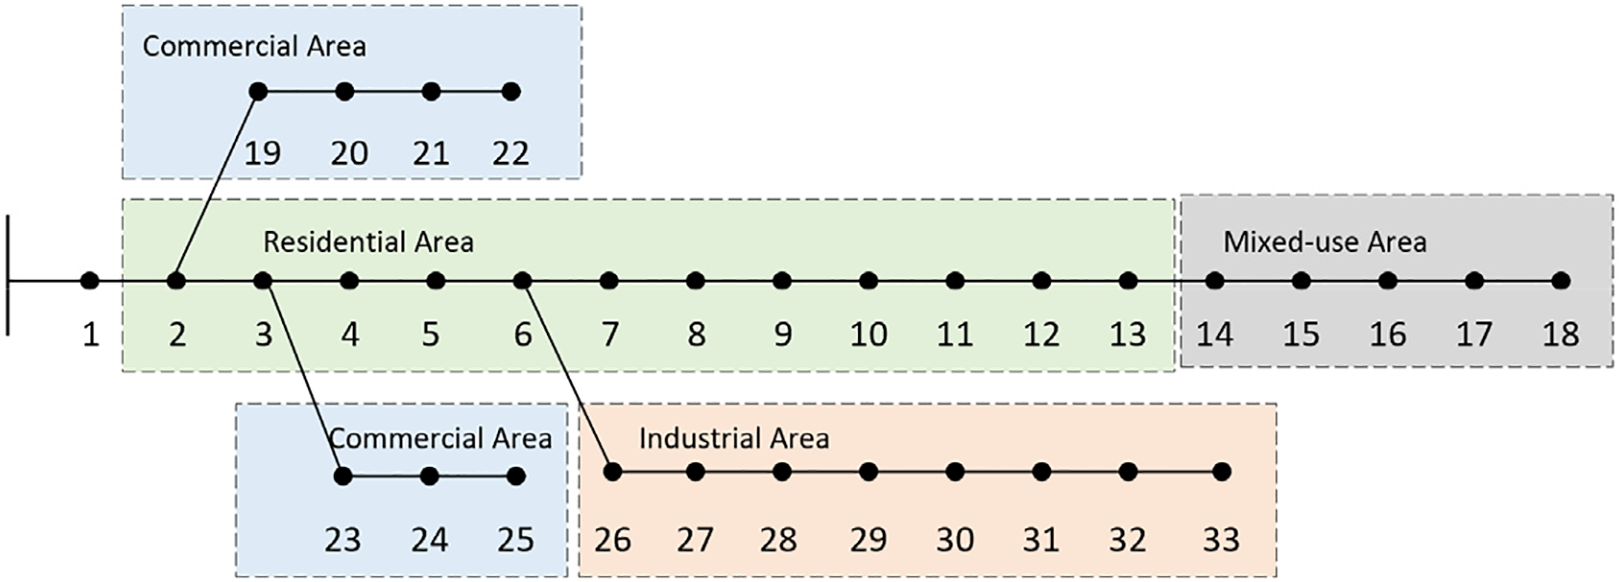
Figure 3: IEEE 33 node distribution network system topology diagram
The photovoltaic capacity estimation for the IEEE 33-node system is conducted by region. Since 2013, the National Energy Administration has published annual data on distributed photovoltaic installed capacity nationwide. The parameters for the Bass diffusion model in this study are derived from the distributed photovoltaic installed capacity data spanning a decade from 2013 to 2022, predicting the future photovoltaic capacity for each area from 2023 to 2055 over the next 33 years. However, the total photovoltaic area will change with urban development. To simulate this incremental change, different areas will see varying total rooftop area increases in different years, as detailed in Table 1. This approach provides a more realistic capacity forecast, ultimately yielding the predicted results for the 33 areas, with a specific area’s prediction illustrated in Fig. 4. In the figure, the blue squares represent historical photovoltaic installed capacity data, while the red curve is the fitted curve of the future photovoltaic installed capacity for each year, showing the trend of photovoltaic capacity changes in the region.
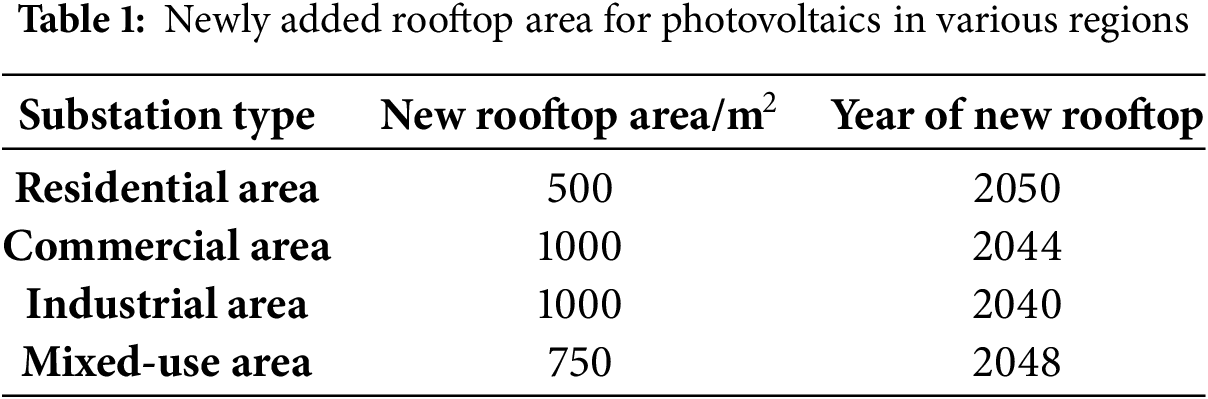
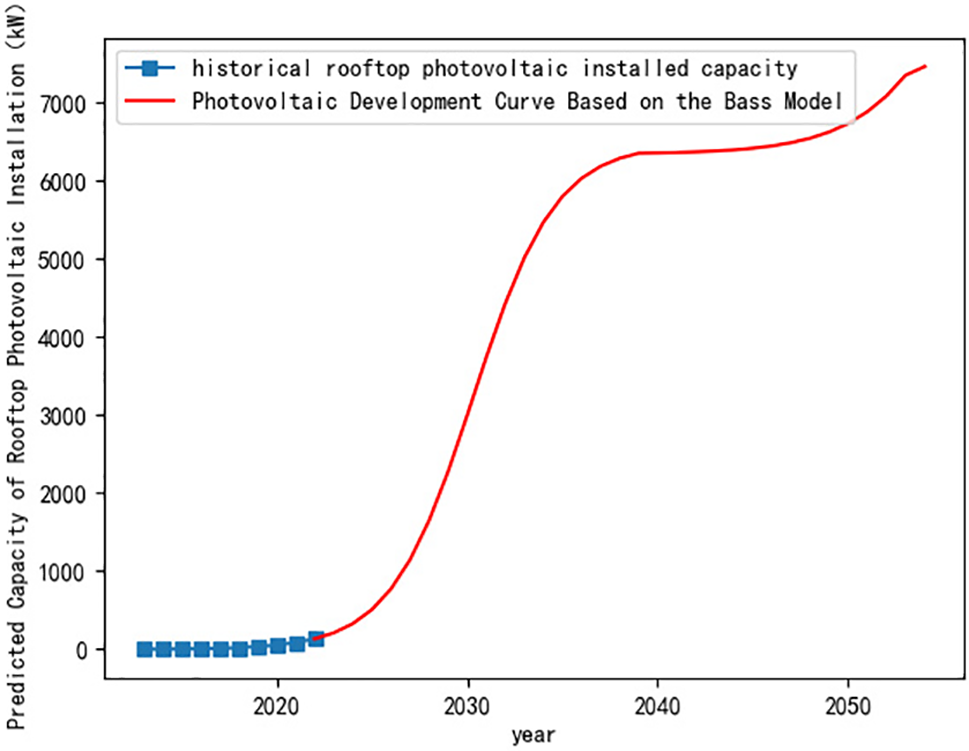
Figure 4: Forecast of distributed photovoltaic installed capacity in a certain district
After reviewing the data, the fixed investment cost for distributed photovoltaic modules is 6 ¥/W; the fixed investment cost and unit capacity cost for photovoltaic inverters are 805.85 yuan and 422 ¥/kW, respectively. The peak, valley, and flat electricity prices for purchased power are 0.904, 0.312, and 0.600 ¥/(kW·h). The unit operation and maintenance cost for distributed photovoltaic systems is 0.1 ¥/(kW·h). Data for solar radiation intensity and load from a city in China is selected, with the corresponding normalized values shown in Fig. 5, illustrating the variation in solar radiation intensity and load over the course of the year (365 days).
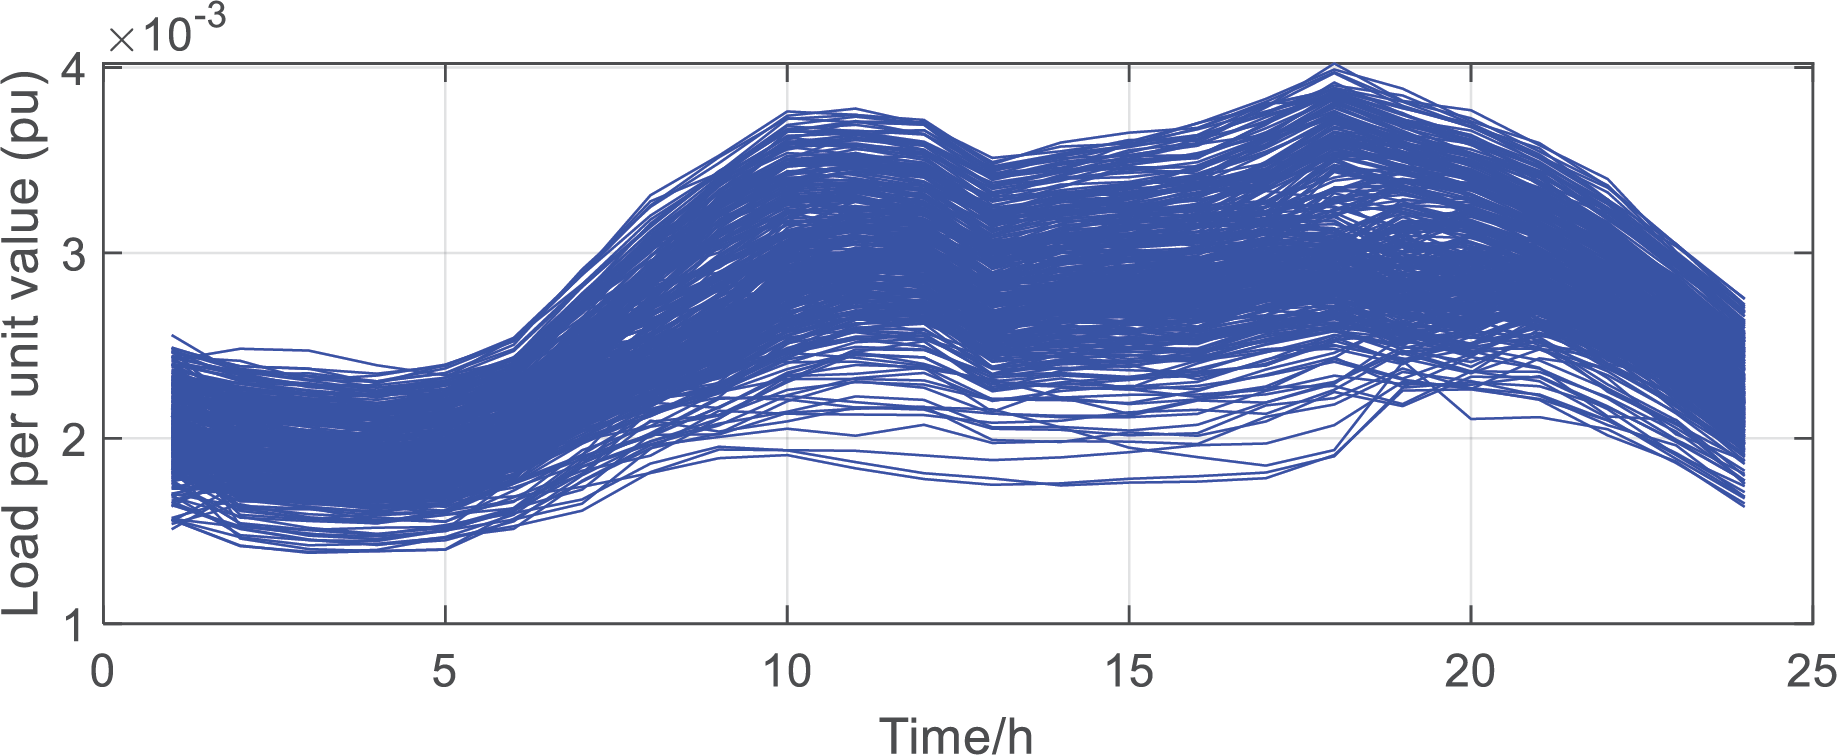
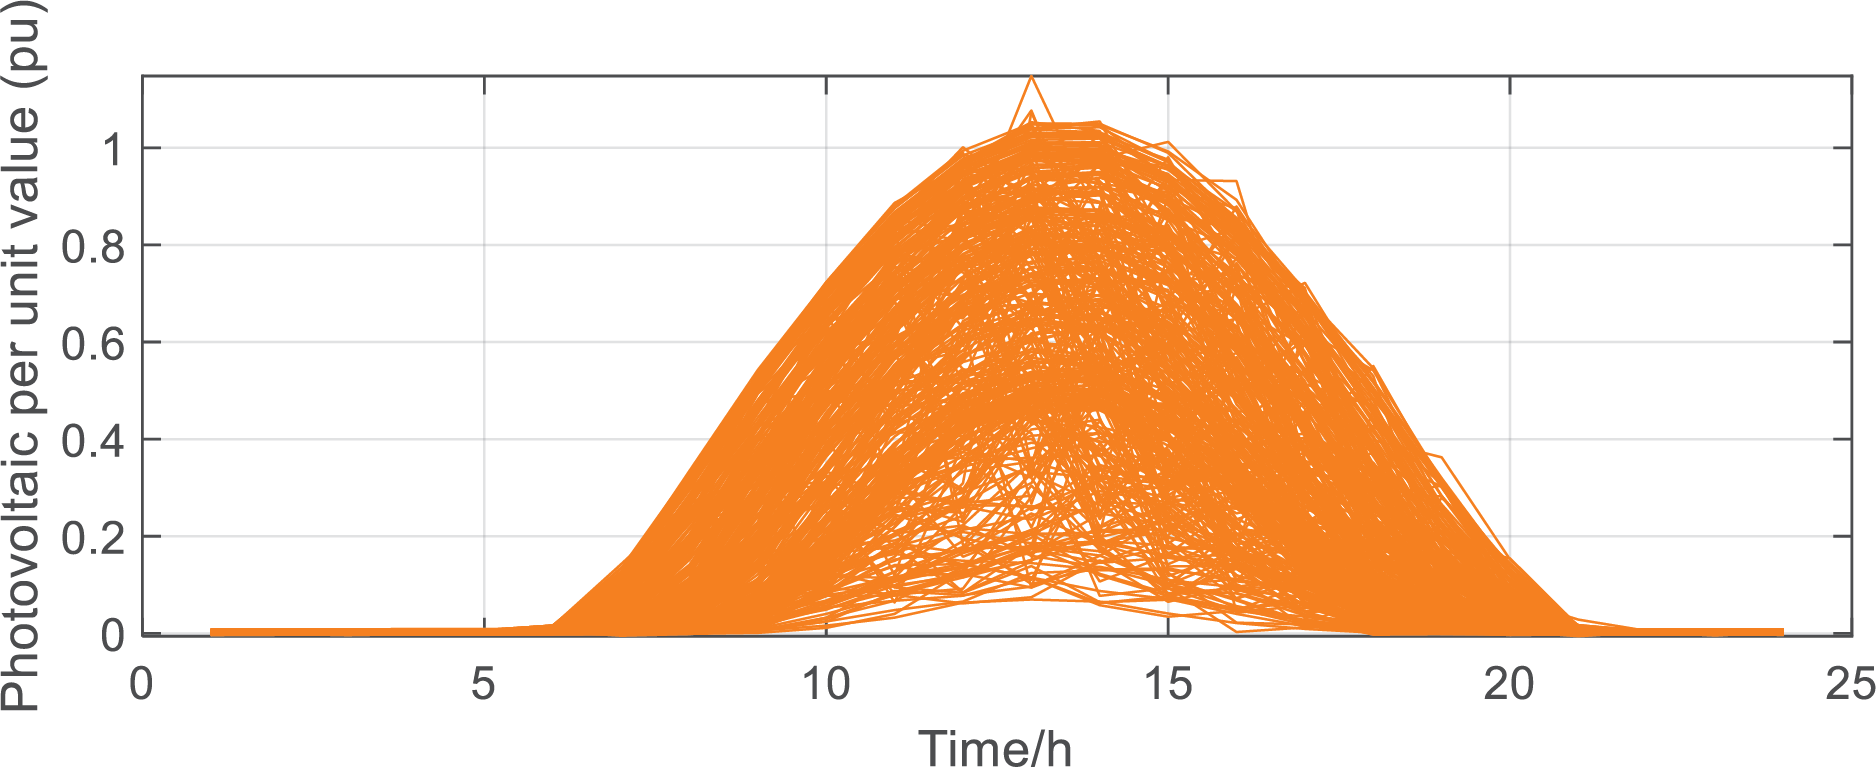
Figure 5: Light radiation intensity and load power per unit value
Based on the annual solar radiation intensity and load data, K-means clustering was performed to identify a typical day that represents the most common combination of solar radiation and load throughout the year, as shown in Fig. 6. According to the method described in Section 3.1, the minimum load-solar radiation difference for the typical day is 0.2693, occurring at 14:00. This moment is designated as the typical time, with a normalized solar radiation intensity value of 0.5018 and a normalized load value of 0.7712.
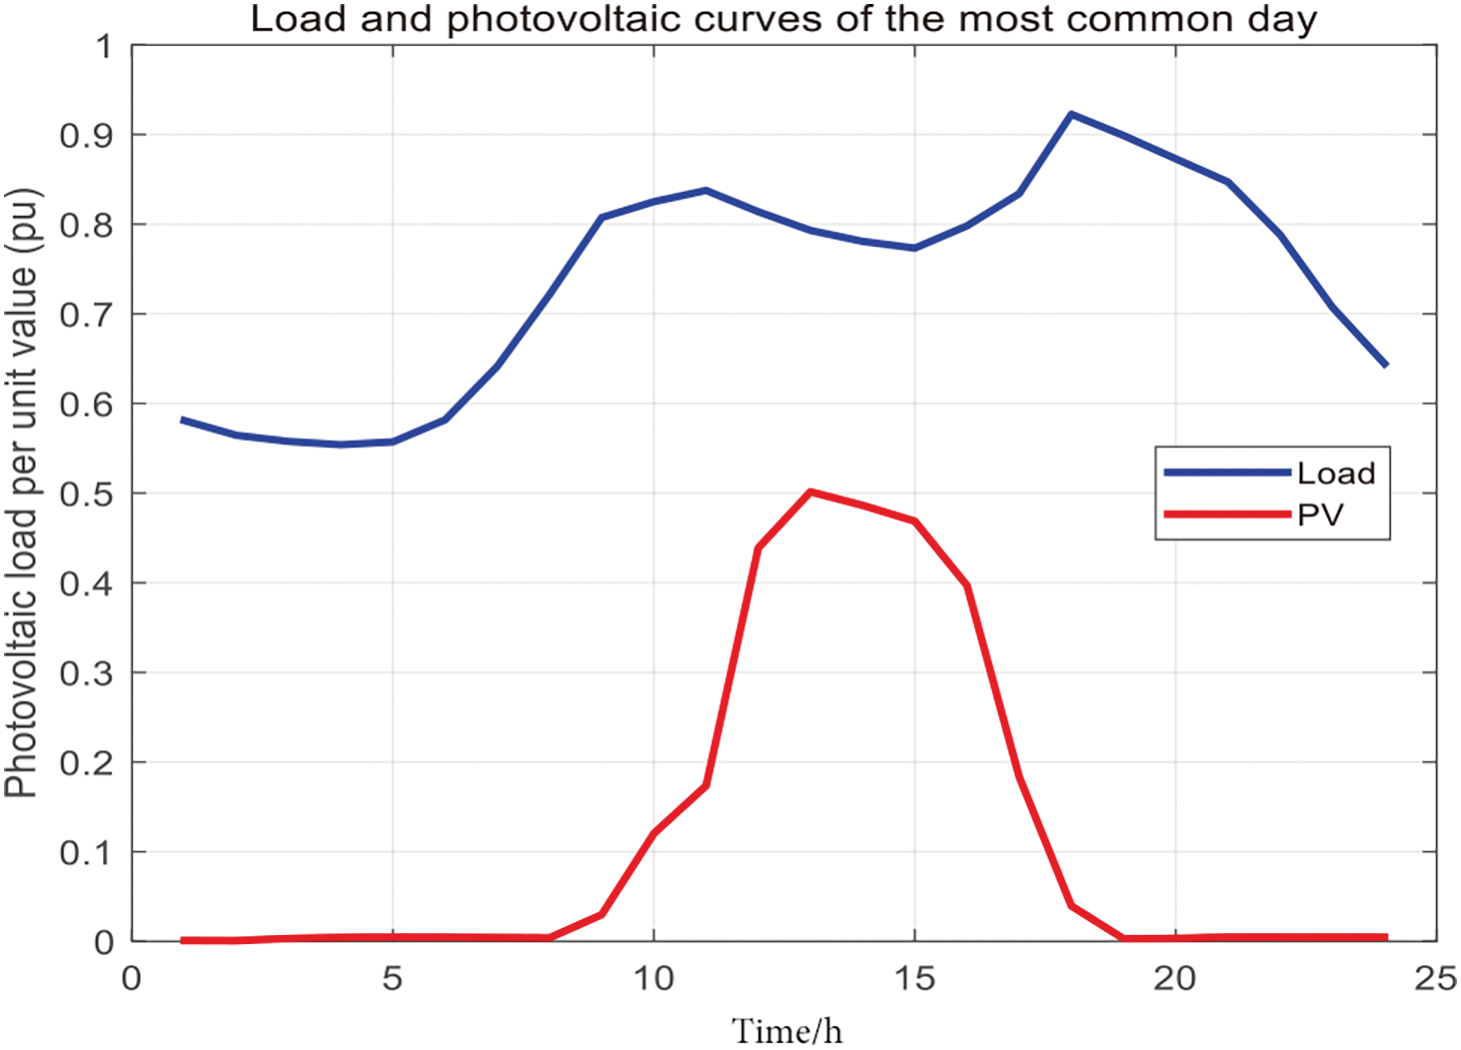
Figure 6: Typical solar radiation and load changes
At this typical time, random simulations of photovoltaic consumption schemes and approximate evaluations of consumption capacity were conducted following the methods outlined in Sections 3.2 and 3.3. First, the weight coefficients of the diffusion parameters were defined as 0.4, 0.3, and 0.3, which provided the sampling probabilities for each feeder node. Based on these diffusion probabilities, 1000 random samples were generated, resulting in 1000 random access schemes. The maximum normalized voltage values and total photovoltaic capacities for each scheme were recorded, as shown in Fig. 7. The approximate maximum consumption capacity for this distribution network system was determined to be 13.61416 MW, with the horizontal coordinates of M1 and M2 being 2.6597 and 14.5692 MW, respectively.
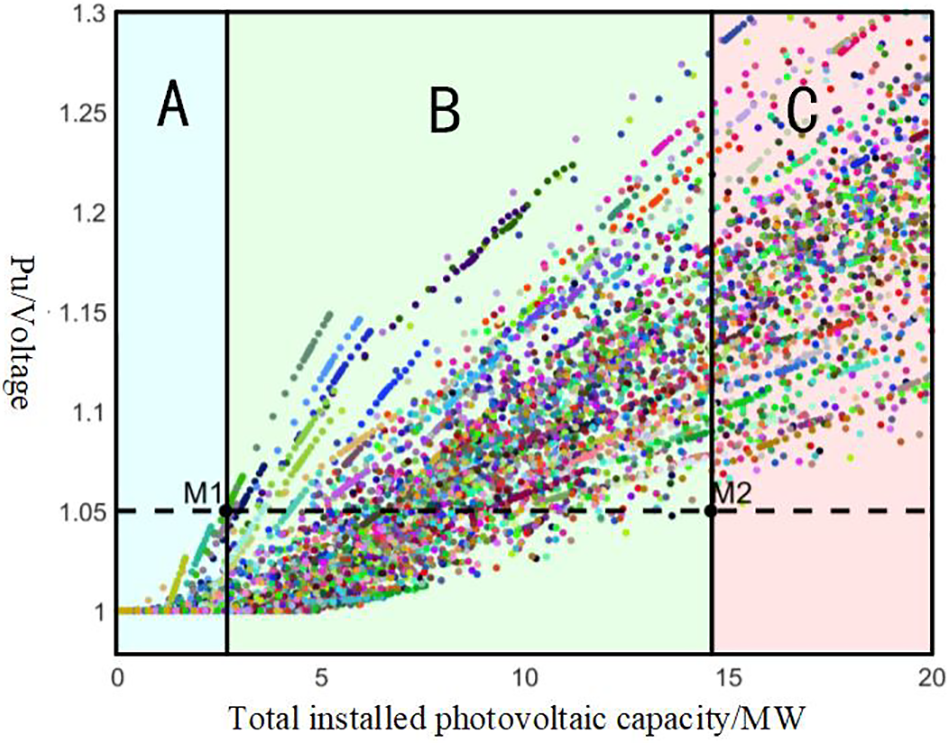
Figure 7: Simulation results of photovoltaic random access scheme
Compared to Fig. 2, the use of the diffusion probability-based sampling method resulted in a denser distribution of the generated random access schemes between
The maximum consumption capacities of the various schemes were ranked, and the top 10 capacity schemes were selected as candidates for evaluation. The scoring results are presented in descending order in Table 2.
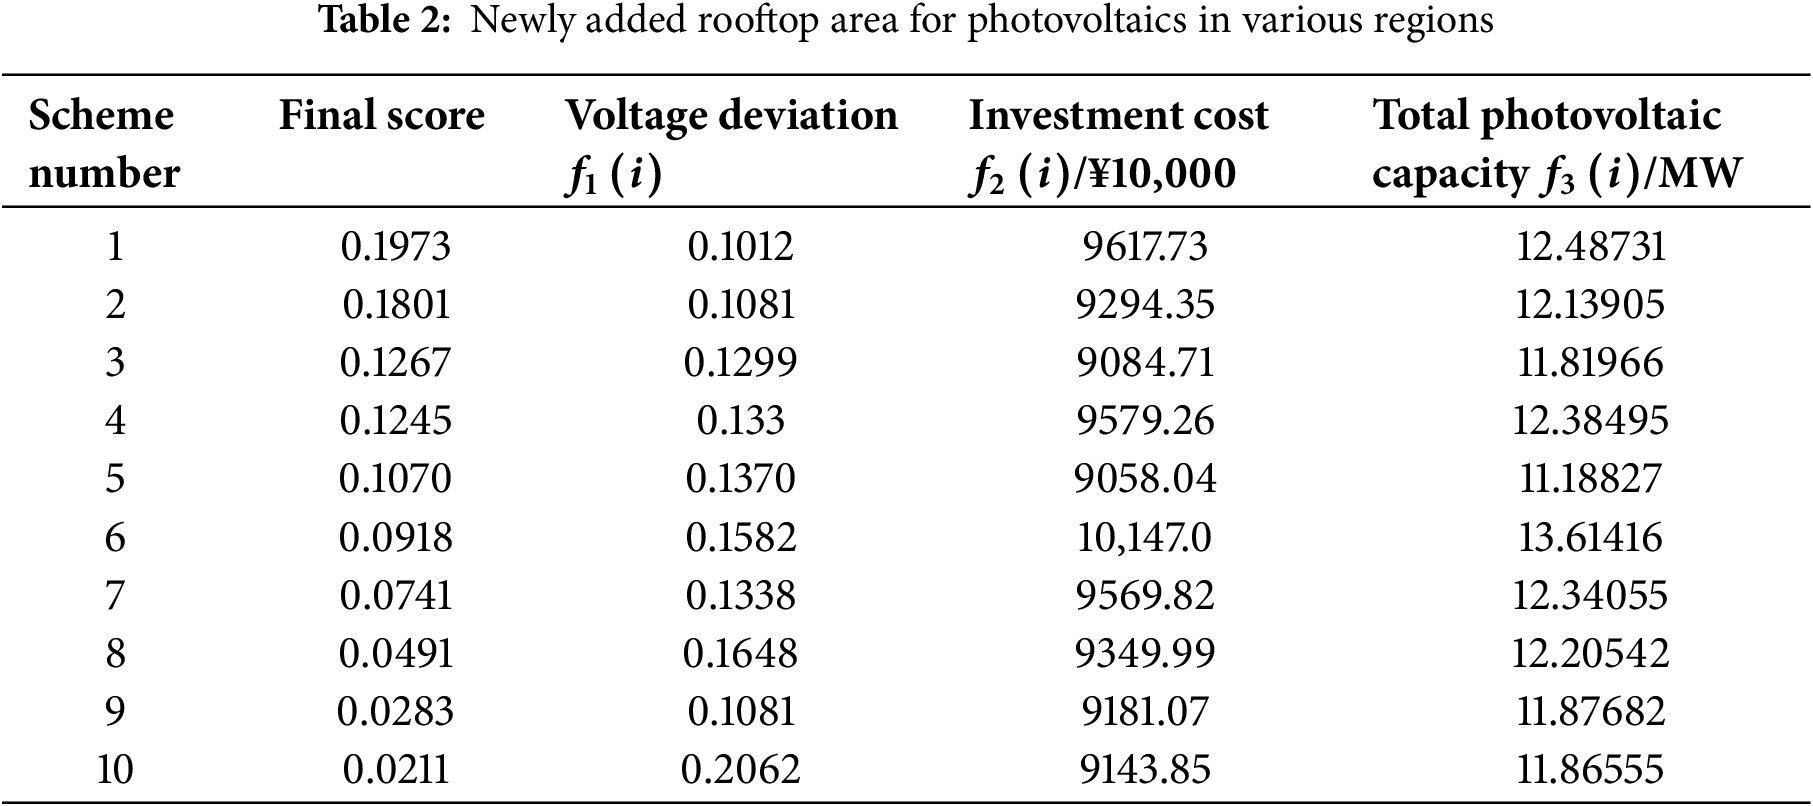
As shown in Table 2, the highest-scoring Scheme 1 has a score of 0.1973, making it the optimal photovoltaic consumption scheme when considering the comprehensive factors of consumption capacity, investment benefits, and voltage quality. Compared to Schemes 2 and 3, although Scheme 1 incurs higher investment costs, it can accommodate more photovoltaic capacity without exceeding voltage limits, while also maintaining a lower voltage deviation during continuous PV integration. The method presented in this paper enables the distribution network to maximize consumption with minimal investment under substantial distributed photovoltaic integration, while ensuring stable voltage quality.
The configuration of distributed photovoltaic integration for Scheme 1 is illustrated in Fig. 8. To validate the rationality of the scheme, it was tested under the most extreme scenario of the year, specifically at the moment when the solar load ratio is maximized, using annual operational data. The results are shown in Fig. 9.
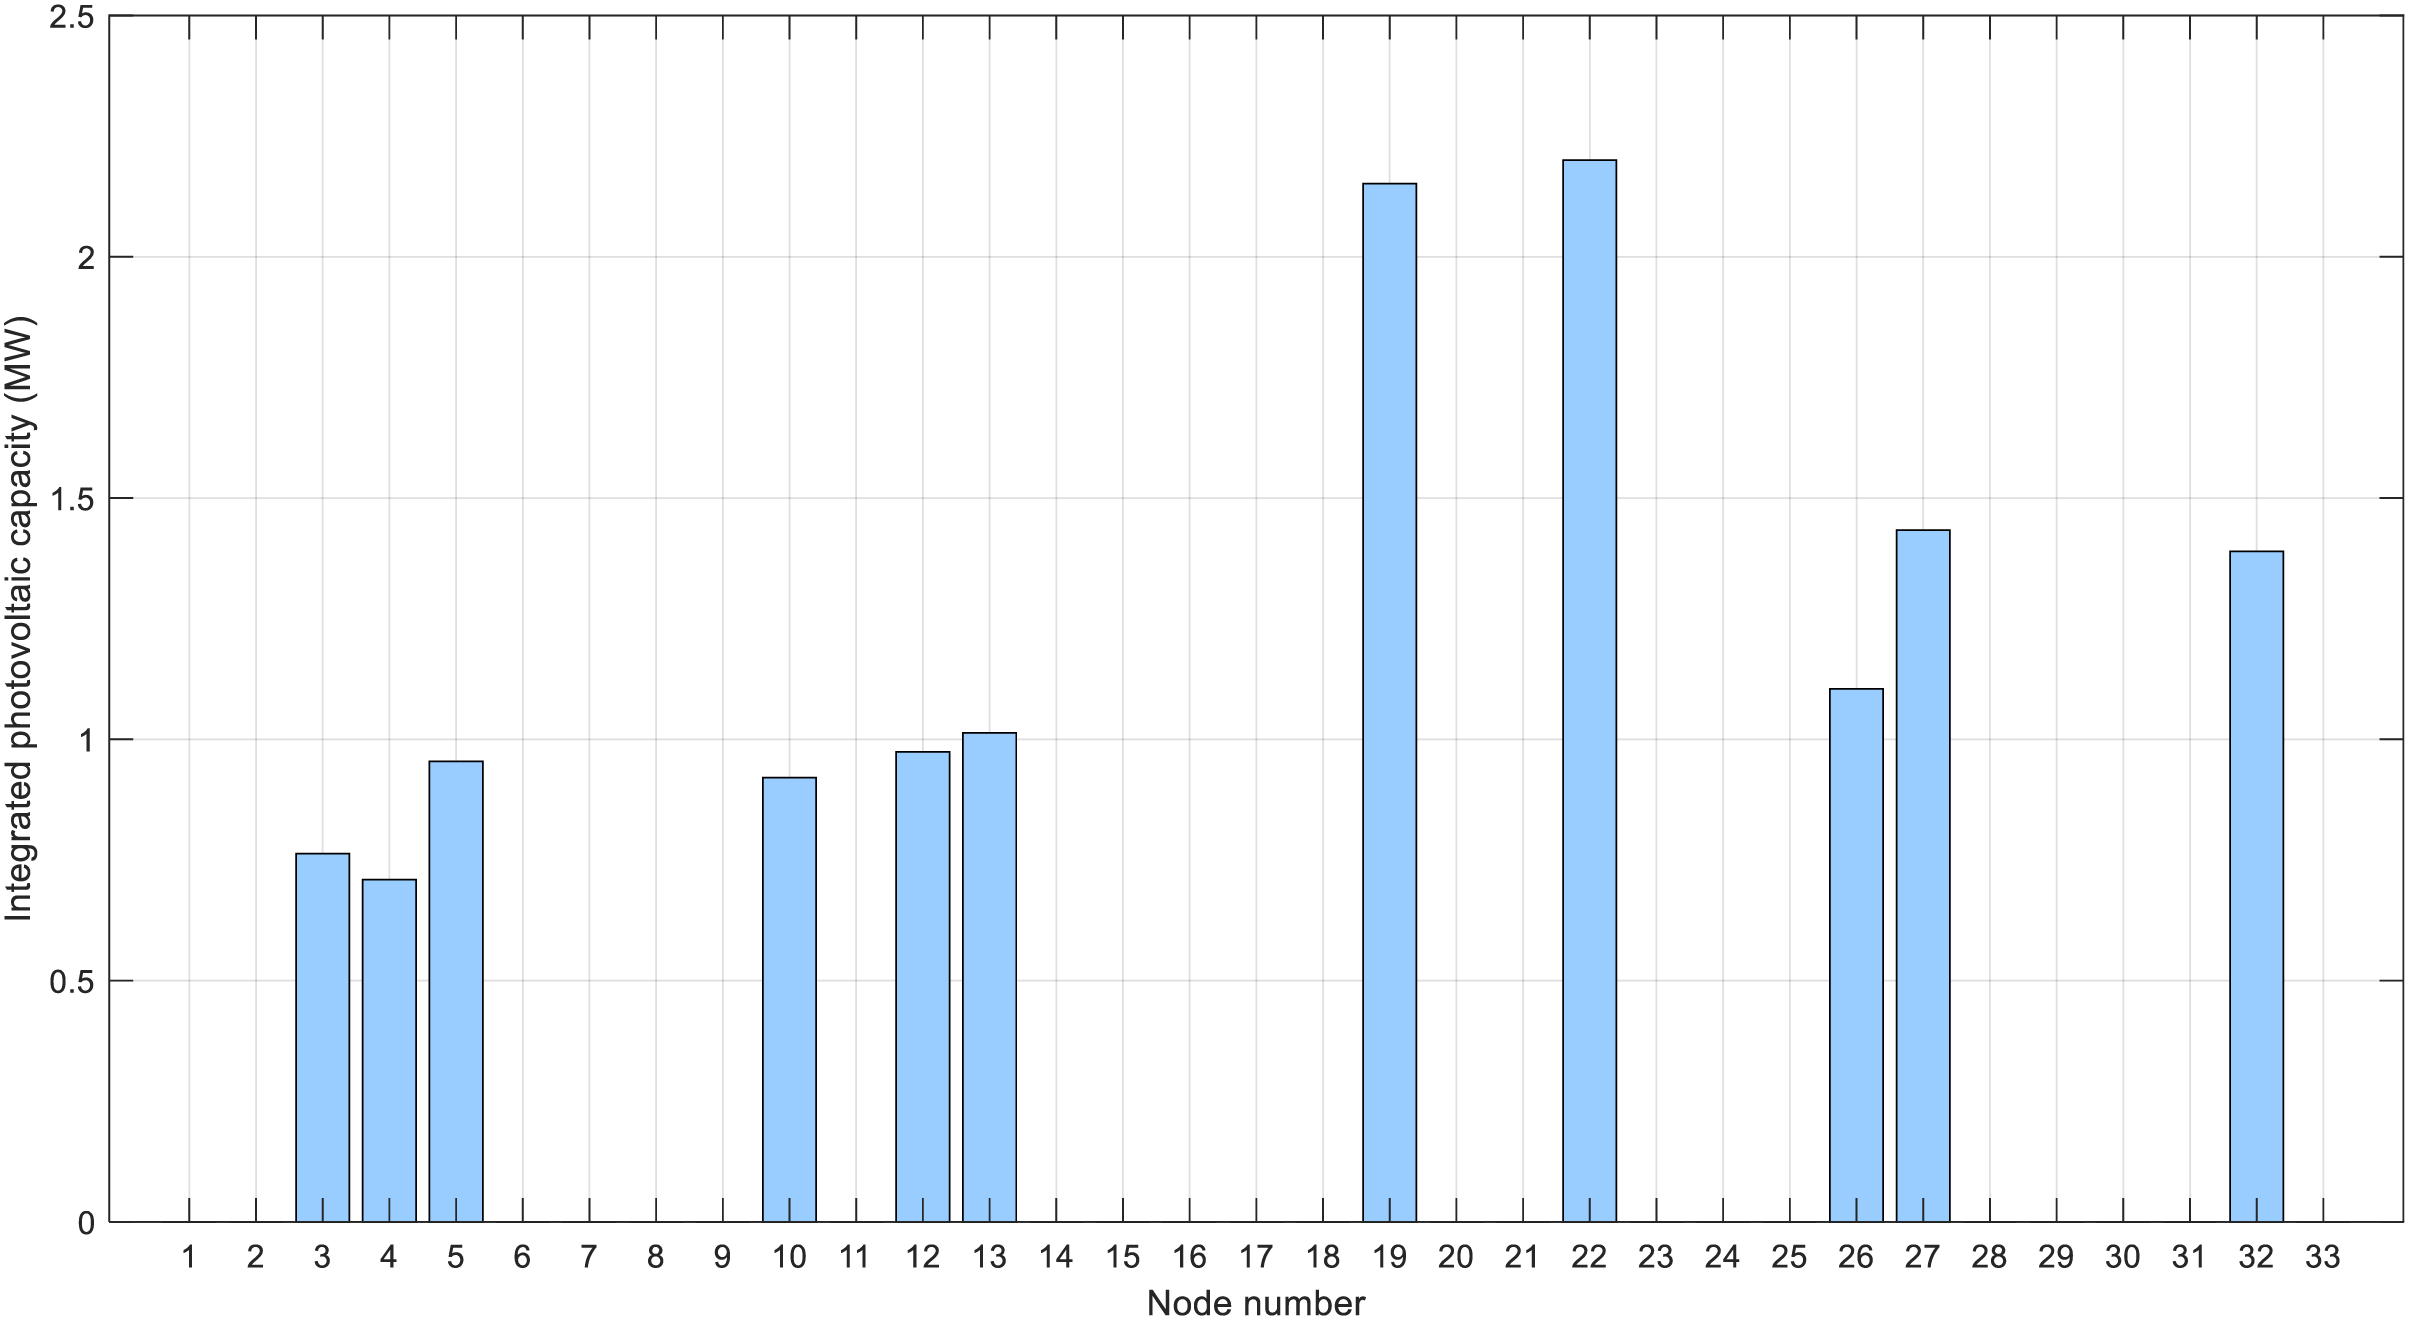
Figure 8: Optimal consumption plan for photovoltaic access configuration
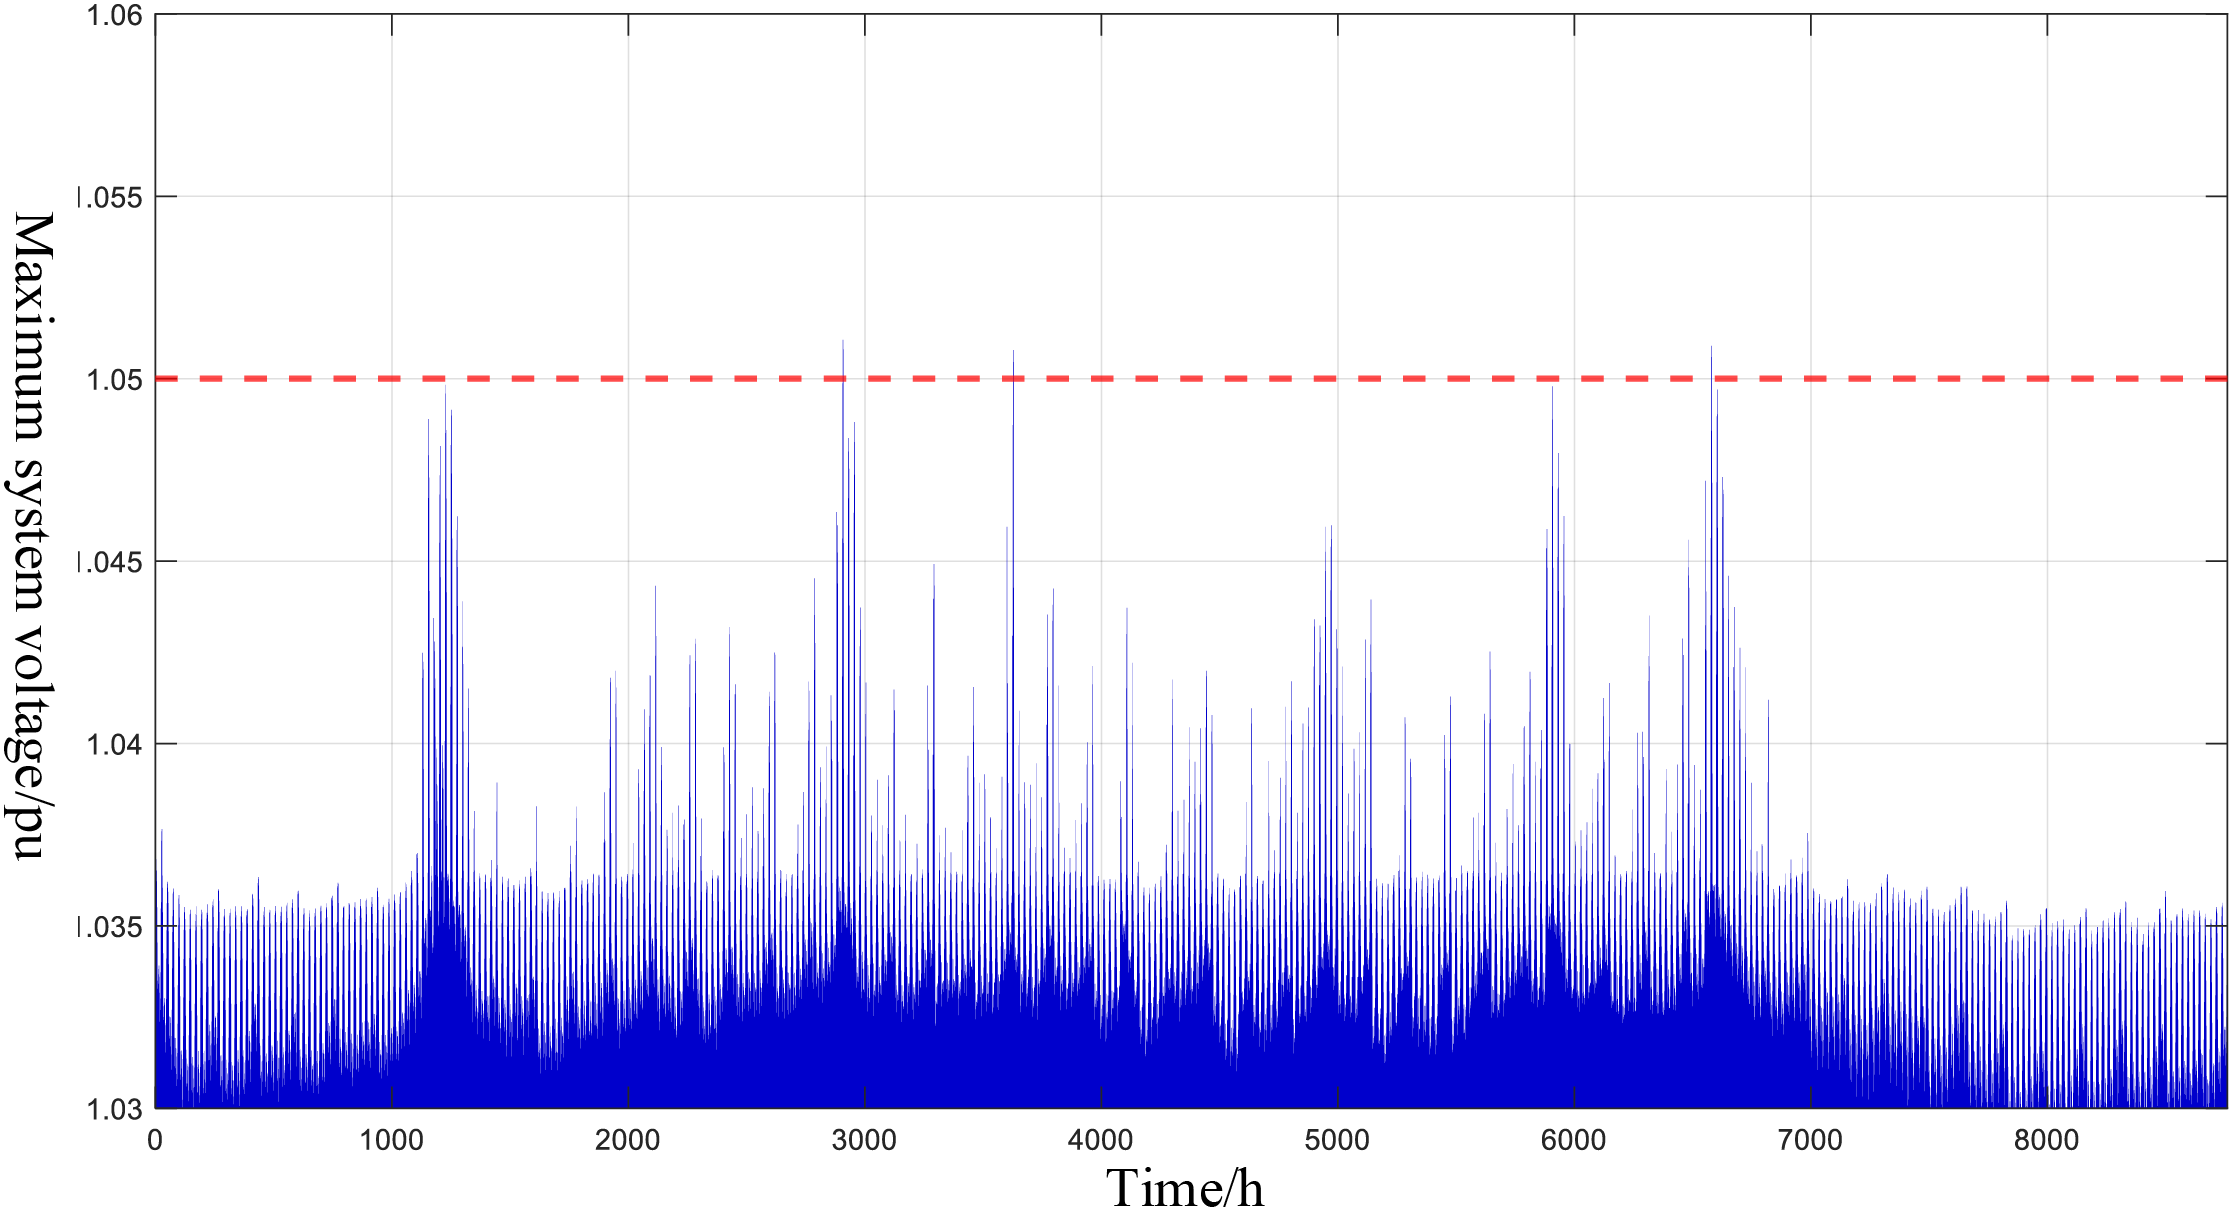
Figure 9: Voltage verification diagram based on annual operating data
As seen in Fig. 9, this integration scheme experiences voltage violations for 8 h during the extreme typical scenario within the annual operational cycle, with minimal violation levels. This indicates the representativeness of the selected typical moment and the rationality of the integration scheme.
Using the improved particle swarm optimization algorithm method from literature [15], this paper solves the example with the objectives of system consumption capacity, voltage deviation, and investment costs. The maximum photovoltaic consumption scheme configuration for the IEEE 33-node system is obtained, as illustrated in Fig. 10.
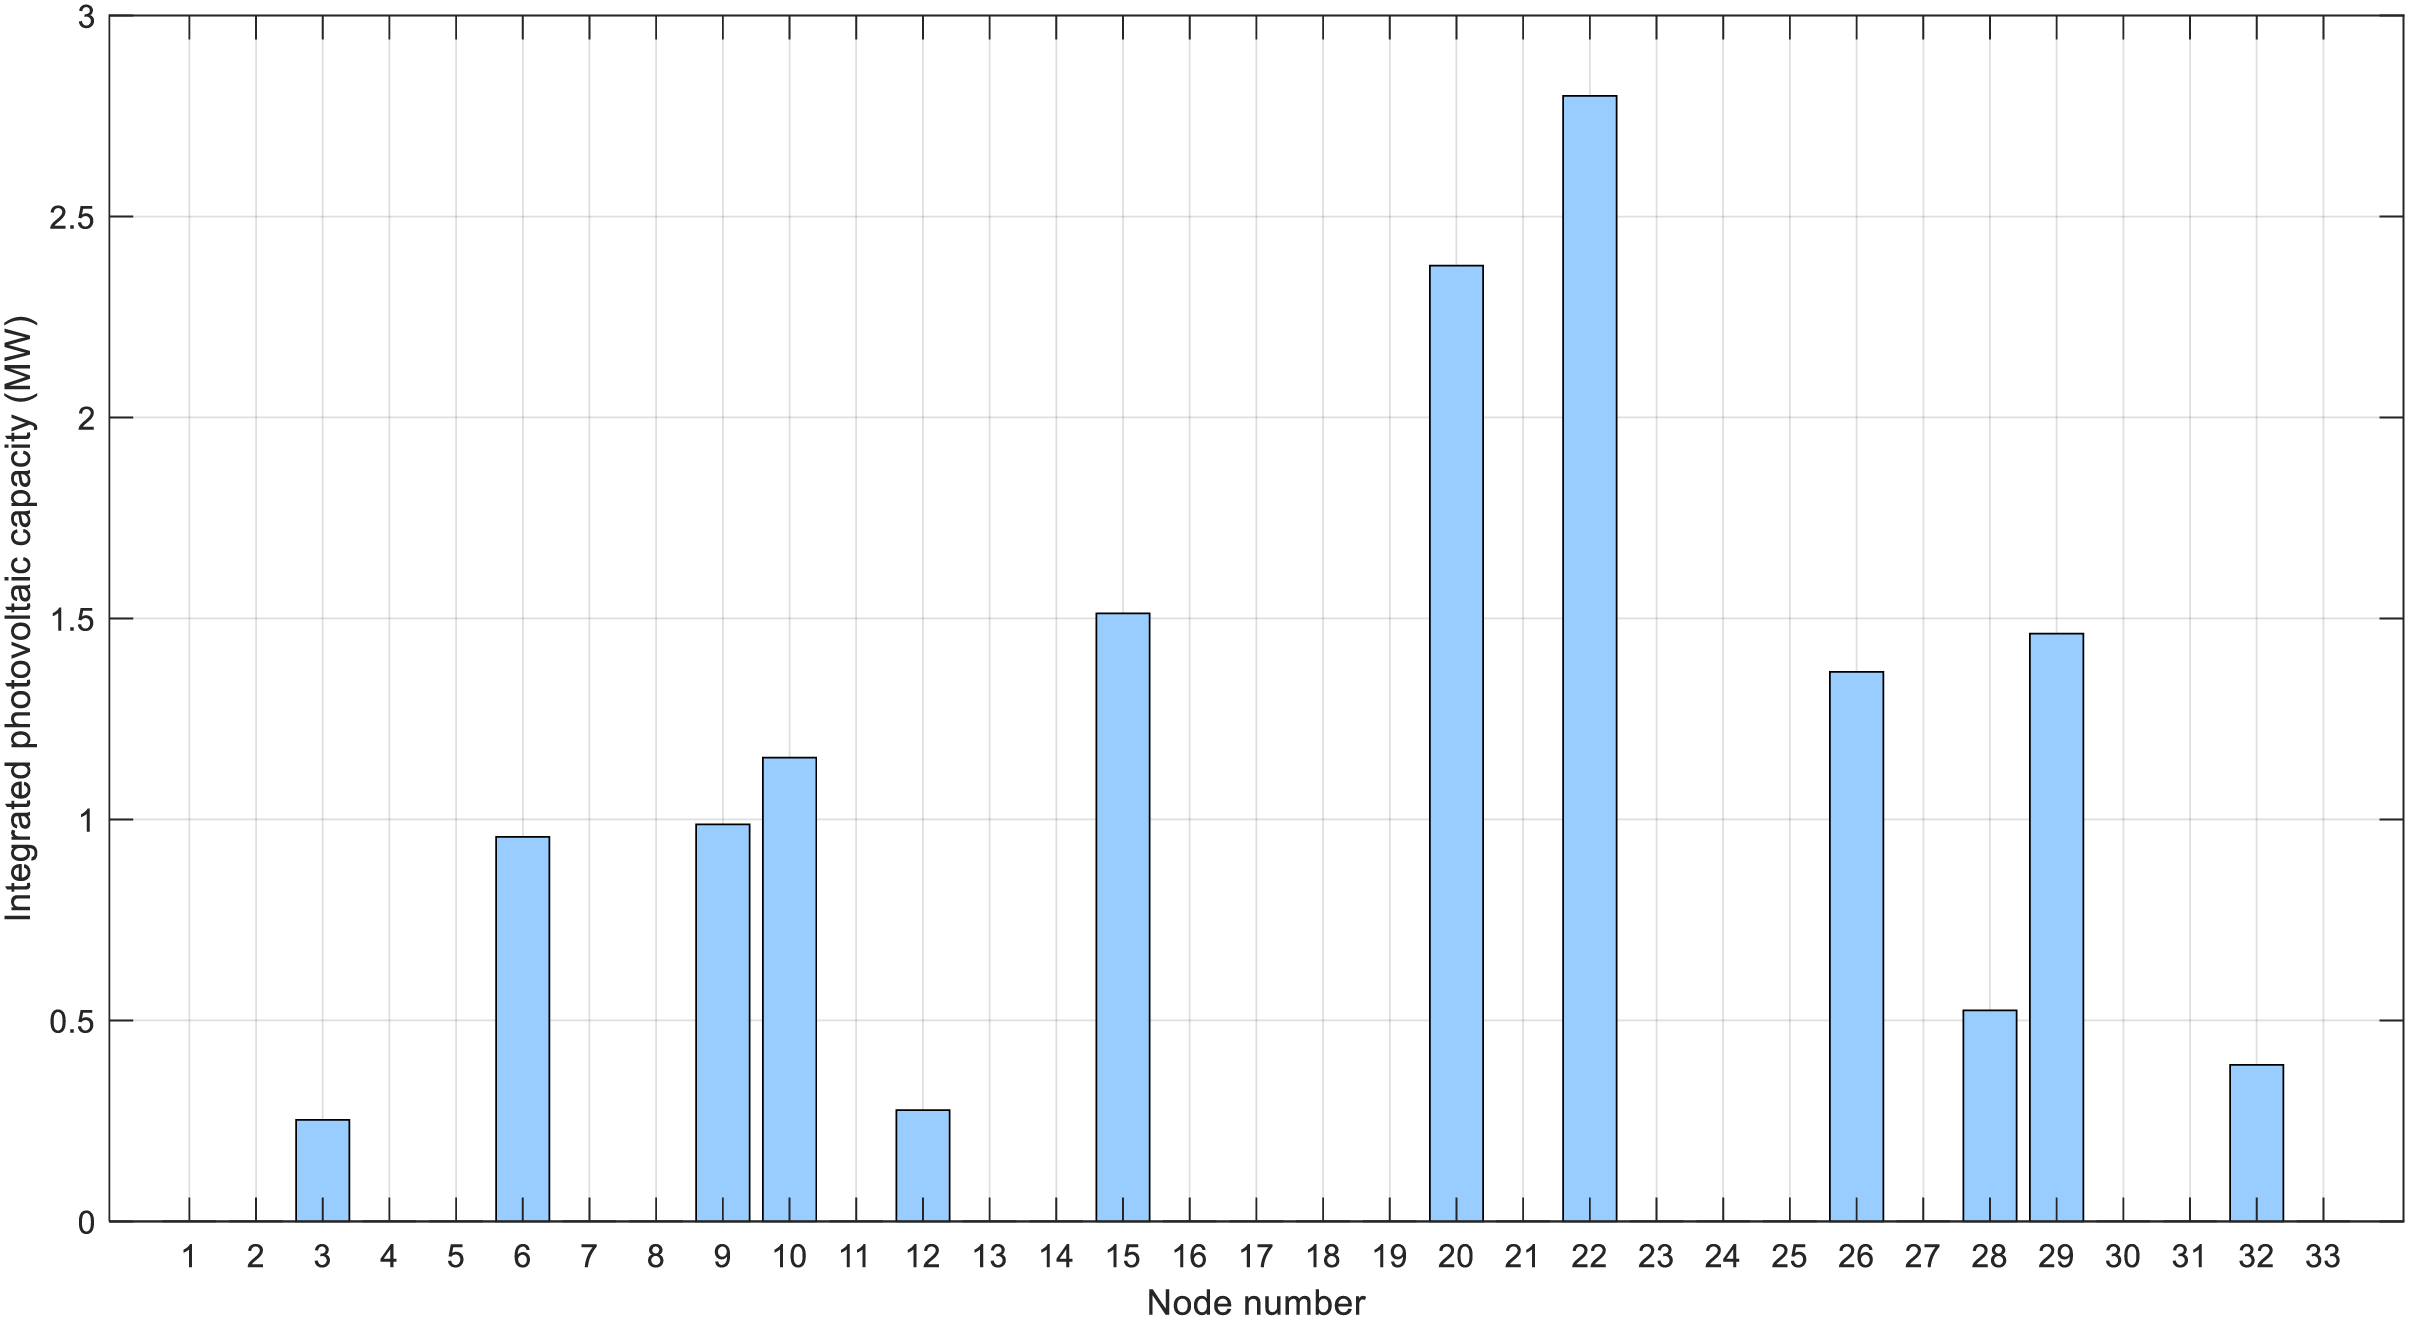
Figure 10: Mathematical optimization algorithm for maximum photovoltaic consumption and access configuration
As shown in this figure, the photovoltaic configuration scenarios obtained in reference [15] are nodes 3, 6, 9, 10, 12, 15, 20, 22, 26, 28, 29, and 32, with a total photovoltaic capacity of 13.89 MW. Although this is higher than the 12.48 MW result obtained by the method in this paper, the photovoltaic capacity at node 22 reaches 2.8001 MW, exceeding its rooftop area limit of 2.5035 MW, which does not comply with practical constraints. In addition, the consumption assessment method based on the improved particle swarm optimization not only fails to provide annual consumption evaluation results but also cannot simulate and compare various photovoltaic integration scenarios, thus failing to reflect the comprehensive photovoltaic consumption capacity of the distribution network. In contrast, the consumption assessment method based on the improved stochastic scenario simulation in this paper simulates various photovoltaic integration scenarios and conducts extensive simulation sampling to reflect the actual consumption capacity of the distribution network.
This study presents an evaluation method for optimizing photovoltaic consumption schemes in distribution networks based on BASS model predictions of installed PV capacity. The method aims to reasonably evaluate the photovoltaic consumption capacity of distribution networks under the considerations of economic efficiency and reliability. The research leads to the following conclusions:
(1) A method based on the BASS diffusion model predicts the future photovoltaic capacity of the distribution network. This approach incorporates both objective and subjective factors to forecast the development trend of photovoltaic installed capacity, ensuring that the predictions align with reality.
(2) A photovoltaic consumption evaluation method is proposed, which uses a photovoltaic random scenario method based on diffusion probabilities to generate photovoltaic access schemes and assess the consumption capacity of these schemes.
(3) The Technique for Order of Preference by Similarity to Ideal Solution (TOPSIS) method is used to evaluate the economic efficiency and reliability of the scheme with the maximum consumption capacity, making the final consumption scheme more reasonable and providing valuable reference for professionals.
In future assessments of the photovoltaic consumption capacity in distribution networks, additional factors such as the integration of solar energy and storage systems (solar-storage synergy), intelligent optimization scheduling, and further refinement of regional differences in consumption capacity should also be considered.
Acknowledgement: Thank you for the information provided by Guangdong Power Grid Co., Ltd.
Funding Statement: This work was supported in part by the The Planning Subject Project of Guangdong Power Grid Co., Ltd. (62273104).
Author Contributions: The authors confirm contribution to the paper as follows: study conception and design: Chenyang Fu and Xinghua Wang; data collection: Chenyang Fu and Zilv Li; analysis and interpretation of results: Chenyang Fu, Xixian Liu and Xiongfei Zhang; draft manuscript preparation: Chenyang Fu and Zhuoli Zhao. All authors reviewed the results and approved the final version of the manuscript.
Availability of Data and Materials: The data presented in this study are available on request from the corresponding author.
Ethics Approval: Not applicable.
Conflicts of Interest: The authors declare no conflicts of interest to report regarding the present study.
Nomenclature
| The installed capacity of distributed photovoltaics at time | |
| The cumulative purchased capacity of distributed photovoltaics | |
| The installation potential of distributed photovoltaics | |
| The innovation coefficient | |
| Denotes the imitation coefficient | |
| The load-photovoltaic difference, indicating the disparity between the absolute value of photovoltaic output and the absolute value of load at time | |
| The moment when this difference reaches its minimum is defined as the typical moment | |
| The photovoltaic output of the distribution network at time | |
| The active power values of the distribution network at time | |
| The voltage value at node | |
| The rated maximum operating voltage | |
| The lower voltage limits of the distribution network system | |
| The sampling probability value for the substation area | |
| Represents the substation number | |
| The weight coefficients | |
| The innovation coefficient and imitation coefficient of the BASS model before the addition of new rooftop area | |
| The innovation coefficient and imitation coefficient of the BASS model after the addition of new rooftop area | |
| The distributed photovoltaic installation capacities at moments before | |
| The distributed photovoltaic installation capacities at moments after | |
| The voltage deviation value of the consumption scheme | |
| The maximum voltage value at the node when the consumption scheme | |
| The initial investment cost of distributed photovoltaic integration | |
| The electricity purchase cost for the distribution network | |
| The fixed investment cost of the photovoltaic inverter | |
| The unit capacity cost of the photovoltaic inverter | |
| A binary variable, where | |
| The photovoltaic capacity connected at the | |
| The total number of nodes | |
| The time-of-use electricity price for a given day | |
| The load power at node | |
| The unit operational and maintenance cost of the photovoltaic system |
References
1. Li J, Chen S, Wu Y, Wang Q, Liu X, Qi L, et al. How to make better use of intermittent and variable energy? A review of wind and photovoltaic power consumption in China. Renew Sustain Energy Rev. 2021;137:110626. doi:10.1016/j.rser.2020.110626. [Google Scholar] [CrossRef]
2. Fan Q, Weng J, Liu D. Low-carbon economic operation of integrated energy systems in consideration of demand-side management and carbon trading. Front Energy Res. 2023;11:1230878. doi:10.3389/fenrg.2023.1230878. [Google Scholar] [CrossRef]
3. Peng L, Mauzerall DL, Zhong YD, He G. Heterogeneous effects of battery storage deployment strategies on decarbonization of provincial power systems in China. Nat Commun. 2023;14(1):4858. doi:10.1038/s41467-023-40337-3. [Google Scholar] [PubMed] [CrossRef]
4. van der Meer DW, Widén J, Munkhammar J. Review on probabilistic forecasting of photovoltaic power production and electricity consumption. Renew Sustain Energy Rev. 2018;81(1):1484–512. doi:10.1016/j.rser.2017.05.212. [Google Scholar] [CrossRef]
5. Zheng Z, Hong B, Yin G, Zhu J. Relative merit of improving network hosting capacity for renewable generation. In: Proceedings of the International Conference on Renewable Power Generation (RPG); 2015 Oct 17–18; Beijing, China. p. 1–4. doi:10.1049/cp.2015.0409. [Google Scholar] [CrossRef]
6. Mi Y, Liu C, Yang J, Liu Z, Zhu H, Wang T. Evaluation method of renewable energy accommodation considering wind-solar correlation. In: 2021 4th International Conference on Energy, Electrical and Power Engineering (CEEPE); 2021 Apr 23–25; Chongqing, China. p. 1205–09. doi:10.1109/CEEPE51765.2021.9475722. [Google Scholar] [CrossRef]
7. Al-Saadi H, Zivanovic R, Al-Sarawi SF. Probabilistic hosting capacity for active distribution networks. IEEE Trans Ind Inform. 2017;13(5):2519–32. doi:10.1109/TII.2017.2698505. [Google Scholar] [CrossRef]
8. Farag HE, El Saadany EF, El Chaar L. A multilayer control framework for distribution systems with high DG penetration. In: 2011 International Conference on Innovations in Information Technology; 2011 Apr 25–27; Abu Dhabi, United Arab Emirates. p. 94–9. doi:10.1109/INNOVATIONS.2011.5893877. [Google Scholar] [CrossRef]
9. Aziz T, Ketjoy N. PV penetration limits in low voltage networks and voltage variations. IEEE Access. 2017;5:16784–792. doi:10.1109/ACCESS.2017.2747086. [Google Scholar] [CrossRef]
10. Argüello A, Lara JD, Rojas JD, Valverde G. Impact of rooftop PV integration in distribution systems considering socioeconomic factors. IEEE Syst J. 2017;12(4):3531–42. doi:10.1109/JSYST.2017.2739022. [Google Scholar] [CrossRef]
11. Hsu CW. Using a system dynamics model to assess the effects of capital subsidies and feed-in tariffs on solar PV installations. Appl Energy. 2012;100(4):205–17. doi:10.1016/j.apenergy.2012.02.039. [Google Scholar] [CrossRef]
12. Chen X, Wu WC, Zhang BM. Robust capacity Assessment on Global of distributed generation in unbalanced distribution networks incorporating ANM techniques. IEEE Trans Sustain Energy. 2018;9(2):651–63. doi:10.1109/TSTE.2017.2754421. [Google Scholar] [CrossRef]
13. Hoke A, Butler R, Hambrick J, Kroposki B. Steady-state analysis of maximum photovoltaic penetration levels on typical distribution feeders. IEEE Trans Sustain Energy. 2013;4(2):350–7. doi:10.1109/TSTE.2012.2225115. [Google Scholar] [CrossRef]
14. Lamedica R, Geri A, Gatta FM, Sangiovanni S, Maccioni M, Ruvio A. Integrating electric vehicles in microgrids: overview on hosting capacity and new controls. IEEE Trans Ind Appl. 2019;55(6):7338–46. doi:10.1109/TIA.2019.2933800. [Google Scholar] [CrossRef]
15. Chen S, Zhang Y, Zheng J. Assessment on global urban photovoltaic carrying capacity and adjustment of photovoltaic spatial planning. Sustainability. 2021;13(6):3149. doi:10.3390/su13063149. [Google Scholar] [CrossRef]
16. Han C, Lee D, Song S, Jang G. Probabilistic assessment of PV hosting capacity under coordinated voltage regulation in unbalanced active distribution networks. IEEE Access. 2022;10:35578–88. doi:10.1109/ACCESS.2022.3163595. [Google Scholar] [CrossRef]
17. Koirala A, Van Acker T, D’hulst R, Van Hertem D. Hosting capacity of photovoltaic systems in low voltage distribution systems: a benchmark of deterministic and stochastic approaches. Renew Sustain Energy Rev. 2022;155(1):111899. doi:10.1016/j.rser.2021.111899. [Google Scholar] [CrossRef]
18. Zavvar E, Pinto TF, Santos RP. Identification of probability distributions of SCFs in three-planar KT-joints. Ocean Eng. 2024;312(P3):119222. doi:10.1016/j.oceaneng.2024.119222. [Google Scholar] [CrossRef]
19. Ding F, Mather B. On distributed PV hosting capacity estimation, sensitivity study, and improvement. IEEE Trans Sustain Energy. 2016;8(3):1010–20. doi:10.1109/TSTE.2016.2640239. [Google Scholar] [CrossRef]
20. Zhang X, Li H, Liu Q, Tan X. A study on the technology diffusion of China’s solar photovoltaic based on bass and generalized bass model. In: 2020 5th International Conference on Materials Science, Energy Technology and Environmental Engineering; 2020 Aug 7–9; Shanghai, China; 2020. Vol. 571. p.012016. doi:10.1088/1755-1315/571/1/012016. [Google Scholar] [CrossRef]
21. Chen X, Cui W, He J, Wu Z, Liu Y, Peng X. Evaluation of photovoltaic utilization potential of urban building roof. In: 2023 6th International Conference on Energy, Electrical and Power Engineering (CEEPE); 2023 May 12–14; Guangzhou, China. p. 1017–22. doi:10.1109/CEEPE58418.2023.10165705. [Google Scholar] [CrossRef]
22. Huang JW, Chen R, Wang XX, Zhou YH. Study on the application of fuzzy TOPSIS to the multi-objective decision making. In: 2010 International Conference on Intelligent Computation Technology and Automation; 2010 May 11–12; Changsha, China. p. 560–3. doi:10.1109/ICICTA.2010.226. [Google Scholar] [CrossRef]
Cite This Article
 Copyright © 2025 The Author(s). Published by Tech Science Press.
This work is licensed under a Creative Commons Attribution 4.0 International License , which permits unrestricted use, distribution, and reproduction in any medium, provided the original work is properly cited.
 Downloads
 Citation Tools