
 Submit a Paper
 Propose a Special lssue
 Open Access
ARTICLE

Optimization Configuration Analysis of Wind-Solar-Storage System Based on HOMER
1 College of Energy and Power Engineering, Inner Mongolia University of Technology, Hohhot, 010051, China
2 College of Electric Power, Inner Mongolia University of Technology, Hohhot, 010080, China
3 POWERCHINA BEIJING Engineering Corporation Limited, Beijing, 100024, China
* Corresponding Author: Yan Jia. Email:
Energy Engineering 2025, 122(5), 2119-2153. https://doi.org/10.32604/ee.2025.061712
Received 01 December 2024; Accepted 27 January 2025; Issue published 25 April 2025
 View Full Text
 Download PDF
Abstract
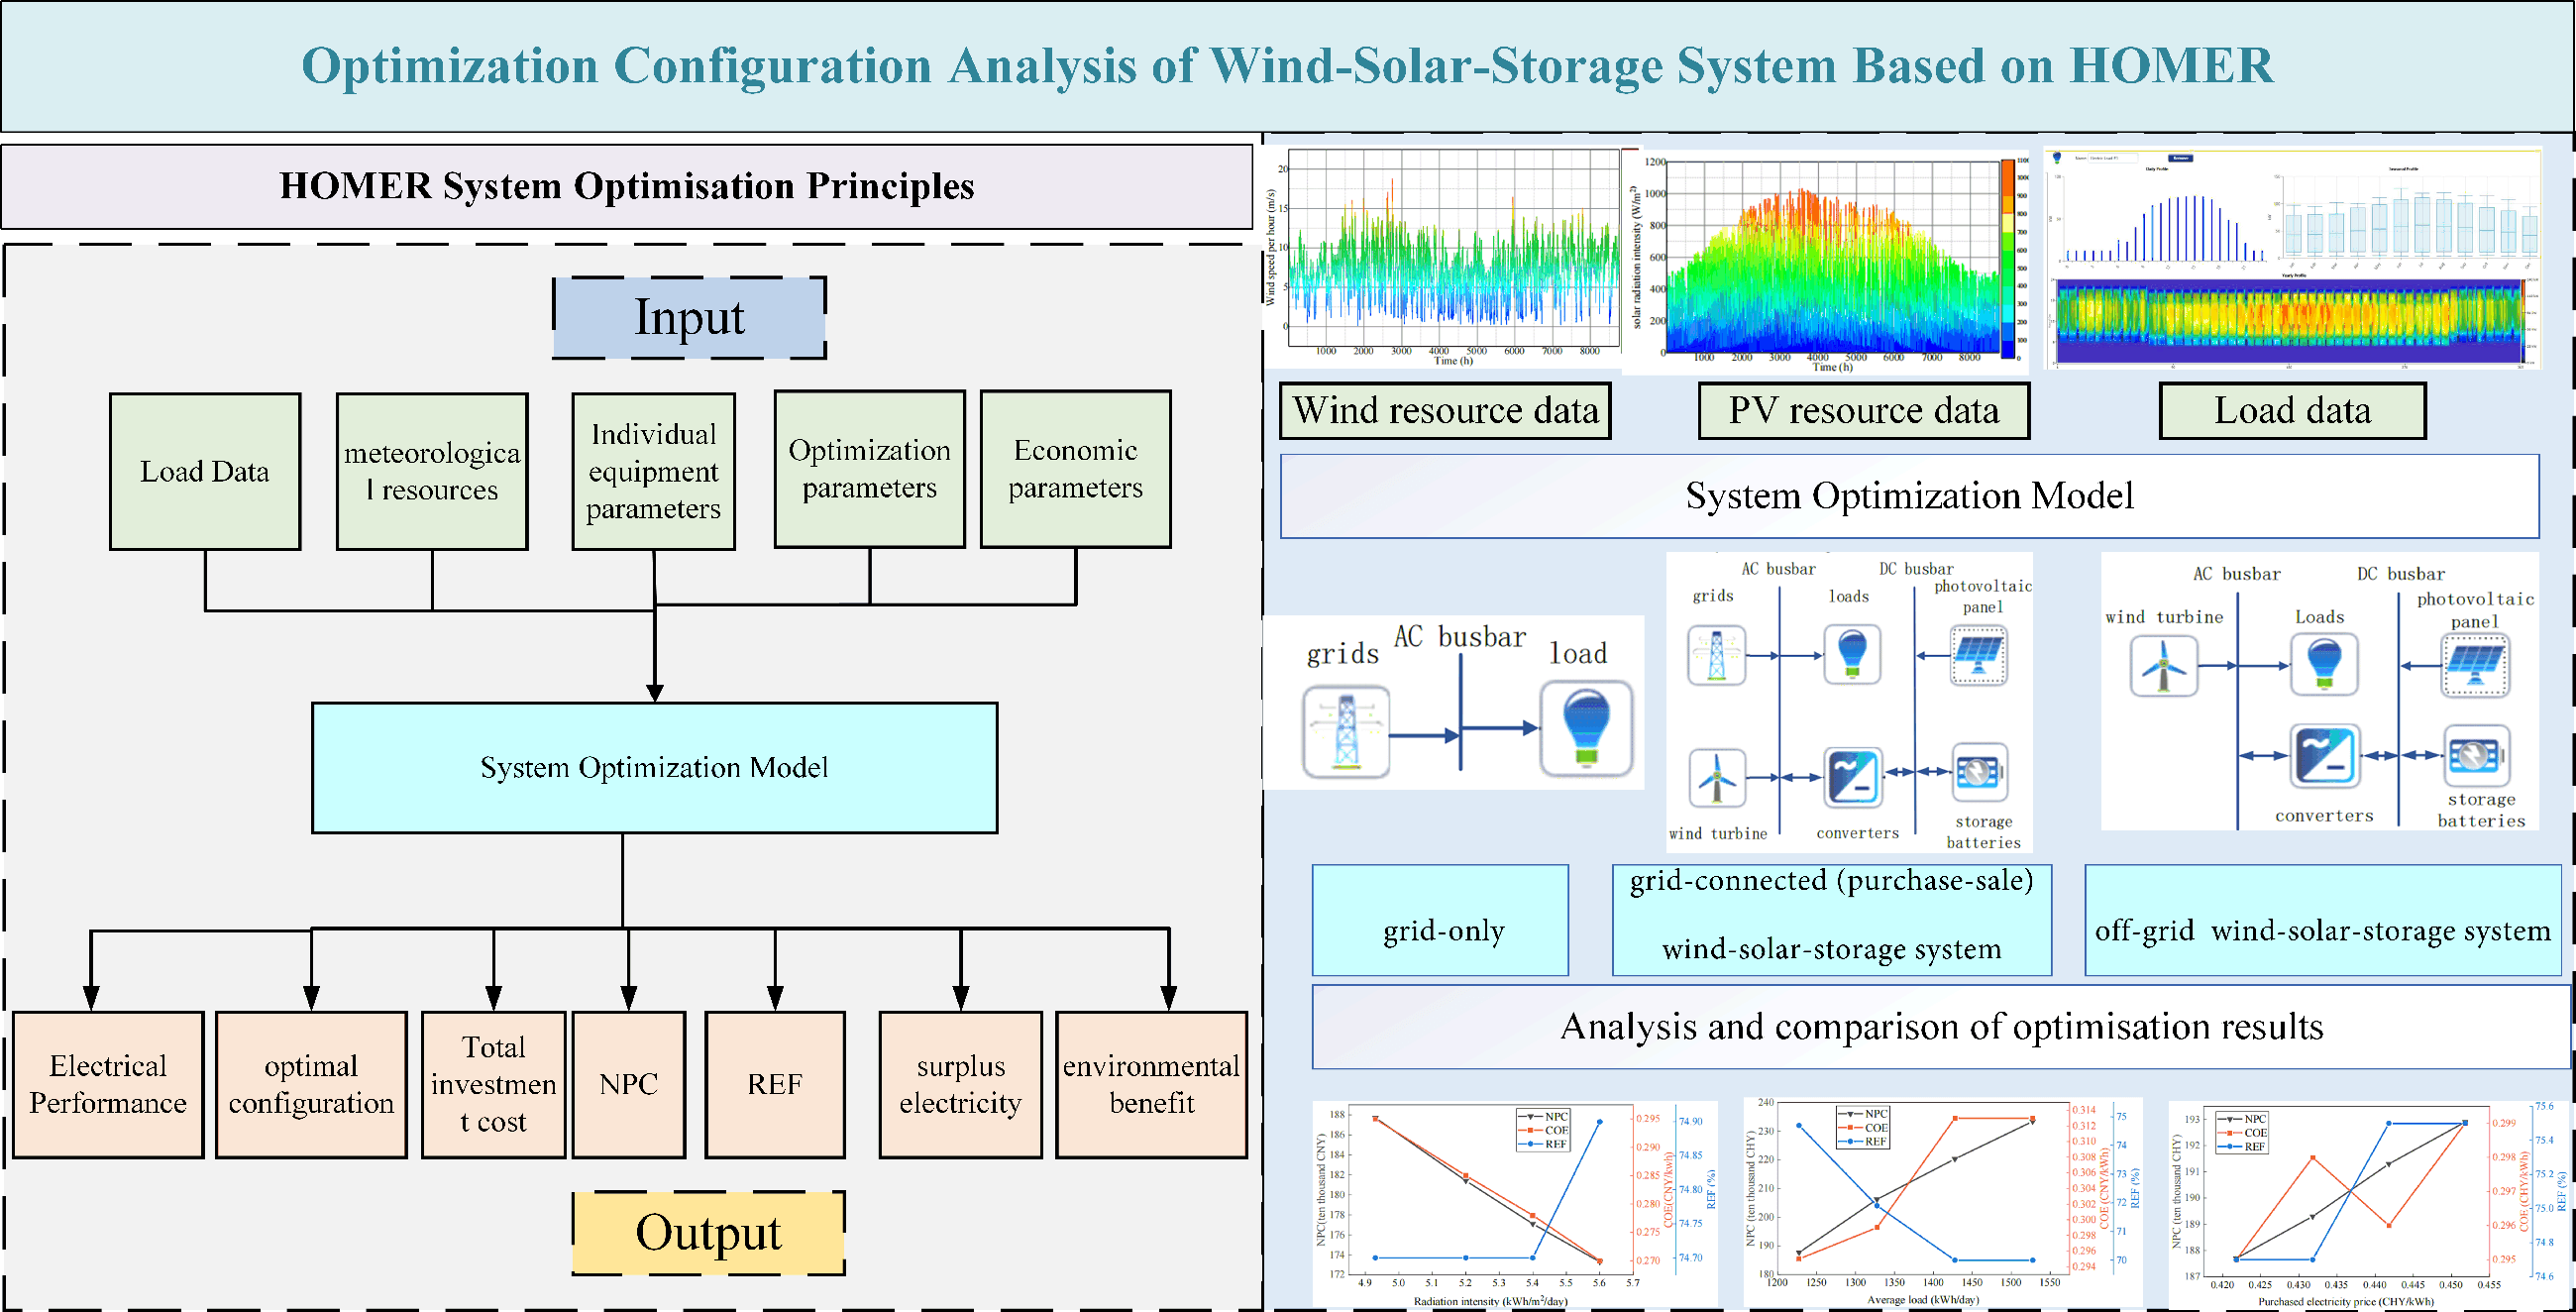
HOMER (Hybrid Optimization Model for Electric Renewables) is an effective simulation and optimization platform for hybrid renewable energy. By inputting specific users’ energy resource data (such as wind speed, solar radiation, etc.) and load data, and by determining the types and models of components selected by the user, HOMER calculates and simulates the operational status of each component at every time step. Ultimately, it computes the energy balance of the system within specified constraints to simulate the overall system operation. This approach enables the reasonable determination of system component capacities, the evaluation of system feasibility, and the calculation of costs over the entire lifecycle of the system. In response to the challenges of matching capacities and high construction costs in wind-solar-storage multi-energy complementary power generation systems, This paper addresses issues such as difficulty in matching component capacities, high construction costs, and low system reliability in multi-energy complementary power generation systems. Using the HOMER hybrid renewable energy simulation and optimization platform, we constructed various hybrid energy systems for a specific region and considered multiple power supply modes. The software was used to solve for the optimal capacities and costs of each system. Four scenarios were analyzed: grid-only, grid-connected (purchase-sale) wind-solar-storage system, grid-connected (sale) wind-solar-storage system, and off-grid wind-solar-storage system. The results were compared and analyzed. HOMER can assess system feasibility and calculate the cost over its entire lifecycle. By inputting 8760 h of wind and solar resource data and load data for a specific region, and considering multiple system structures and power supply modes, the configuration results were evaluated using indicators such as cost and renewable energy utilization ratio. The simulation results indicate that the Net Present Cost (NPC) values across four different scenarios range from 1,877,292 CNY to 3,222,724 CNY, demonstrating significant cost differences. Among these scenarios, the grid-connected (purchase-sell) wind-solar-storage system exhibited the lowest NPC and the highest renewable energy utilization rate. Compared to a system relying solely on the grid, the NPC was reduced by 305,695 CNY, and the renewable energy utilization rate reached 74.7%.Graphic Abstract
Keywords
Solar, wind, and biomass energy, among other renewable energy sources (RES), have been developed to mitigate global warming, enhance energy security, create new business opportunities, and provide other benefits [1]. Solar and wind energy, as promising renewable resources, are typically integrated into grid architectures as distributed energy units. Compared to traditional power supply systems, hybrid energy systems are more cost-competitive due to the use of renewable energy. However, hybrid energy systems also possess characteristics such as structural complexity, high costs, and low reliability, making it difficult to determine the optimal system type and component capacities through simple methods. Additionally, these systems incorporate multiple types of components and equipment, complicating the determination of the ideal component ratios and optimal costs. Furthermore, hybrid energy systems include renewable energy generation devices, which, upon deployment, are influenced by regional resource distribution, leading to significant uncertainty. By conducting effective simulations to study the power generation performance of hybrid energy systems and reasonably assessing their environmental impact, it is possible to further expand the utilization ratio of renewable energy. This approach can significantly reduce regional power supply costs, enhance the stability of hybrid energy systems, and mitigate the environmental impact of power supply systems.
The ideal combination of energy sources varies due to factors such as specific geographical locations and regional energy demands. By combining these different energy sources, the reliability and performance of the system can be significantly improved, maximizing the utilization of renewable resources [2,3]. Therefore, integrated multi-energy systems are more efficient and cost-effective. When constructing hybrid renewable energy systems, the most critical factors to consider are cost and reliability [4].
However, their inherent intermittency, unpredictability, and and random fluctuations of these energy sources pose significant challenges to the efficient and stable operation of the grid [5]. Particularly under high penetration scenarios, the characteristics of renewable energy exacerbate negative effects such as load imbalance, delayed load tracking response, voltage fluctuations, frequency deviation, power quality degradation, and reduced system reliability, posing a severe challenge to the effective integration of renewable energy [6]. Renewable energy technologies can be used for power generation, especially in areas without traditional power grids. Therefore, constructing a rational distributed wind-solar-storage complementary system is crucial. Despite the many advantages of renewable energy, the choice of specific energy supply forms in actual power projects primarily depends on overall costs. Therefore, economic analysis and design optimization are very important. In long-term analysis, the two main indicators of cost-effectiveness for renewable microgrids are net present value (NPC) and levelized cost of energy (LCOE) [7].
For the construction and capacity configuration of distributed hybrid energy systems, numerous scholars have conducted research. Various optimization software tools are available for technical-economic-environmental analysis of energy projects, such as TRNSYS, RETSCREEN, and HOMER. However, HOMER offers a simple optimization process with multiple control strategies, built-in programming functions, various energy forms and energy storage devices, and various types of loads, making it widely used for technical and economic analysis of hybrid energy systems and optimization design of hybrid energy systems, compared to other software [2]. Distributed wind-solar-storage complementary systems commonly face issues such as high costs and low utilization rates of wind and solar resources. Literature [8] designed a microgrid for a region in Colombia, In the HOMER software, the number of solar panels and wind turbines was optimized. The study results showed that after multi-objective optimization using HOMER software, energy utilization and system costs were effectively improved, reducing CO2 emissions and achieving a renewable energy ratio of 95%. Literature [9] used HOMER software to design an optimal solar photovoltaic system for 500 households in Tirumangalam based on real-time load data. A sensitivity analysis was conducted, obtaining construction area costs, including minimum cost of energy (COE), net present value cost (NPC), and annual operation and maintenance costs, which were compared with actual data to prove the effectiveness of the solution. Literature [10] proposed a sensitivity analysis and Bayesian prediction (SABP) method for optimizing the design of hybrid photovoltaic-wind energy systems. The results showed that hybrid photovoltaic and wind energy systems played a beneficial role in increasing power generation and reducing COE. Literature [11] used HOMER to analyze the technical and economic aspects of hybrid energy systems (HES) in five climate zones, both off-grid and grid-connected. The components included photovoltaic/wind/diesel/battery, and it was found that off-grid hybrid energy systems had lower energy and net present value costs, while grid-connected systems had better cost-effectiveness and revenue potential. Compared to off-grid systems, grid-connected HES could save a considerable amount of CO2 emissions annually. Literature [7] used HOMER to establish a hybrid energy system for a commercial community, including solar, wind, and hydropower with battery storage, as an alternative to diesel generator power generation. It was found that over 25 years, there were significant savings in net present value costs and reductions in CO2 emissions. Literature [12] conducted a comprehensive feasibility analysis of different configurations of hybrid energy systems to meet electricity and heat load demands at the University of Southampton campus. The off-grid and grid-connected hybrid energy systems were simulated in Homer Pro software. The results showed that grid-connected HES had higher cost-effectiveness. Literature [13] used HOMER to simulate the configuration with the lowest total net present cost and then initialized the particle swarm with this result, using the load shortage rate as the objective function and the simulated annealing particle swarm algorithm to solve the model, obtaining an optimal configuration that balanced economy and reliability, verifying the superiority of the wind-solar-hydrogen-storage system. Literature [14] used the HOMER software for renewable energy hybrid optimization model simulation analysis, carried out optimization operations on the preliminary capacity configuration of wind-solar-storage power generation systems, and then used genetic algorithms for more refined and in-depth optimization design of hybrid energy storage subsystems including batteries and supercapacitors, to obtain the optimal system capacity configuration.
From the above literature review, most current studies focus on constructing specific multi-energy complementary hybrid energy systems in certain regions, such as single combinations of wind, solar, and diesel generators, and only analyze grid-connected and off-grid scenarios. There is a lack of detailed discussion on grid-connected (purchase-sale) and grid-connected (sell) scenarios, and insufficient consideration of the impact of fluctuating electricity prices on system costs and benefits. Additionally, there is limited sensitivity analysis of how various uncertain factors affect the system. Moreover, there is a lack of comparative analysis of the economic and reliability costs of multiple hybrid energy systems in the same region, and inadequate quantification of the costs and renewable energy ratios of different systems.
To further expand the proportion of renewable energy sources such as wind and solar power in the power supply system, reduce regional pollutant emissions, maximize the utilization of local energy and resources, and lower the costs of regional power supply systems, this study investigates the economic and social benefits of different hybrid energy systems. Specifically, it explores and researches the power supply systems of a particular region using HOMER software to construct three different power supply models of wind-solar-storage systems, as well as one single-mode power supply system. First, the wind and solar resource data of the region were queried and analyzed. Based on these regional resource conditions, appropriate component models were determined in the HOMER software to facilitate the efficient utilization of renewable energy. The annual load data for 8760 h was then inputted, and reasonable hybrid energy system operation strategies were developed. Finally, simulations were conducted in HOMER considering both grid-connected and off-grid scenarios, along with purchase-sell electricity strategies. This process determined the optimal capacities of each component within the hybrid energy system and calculated various system costs, simulating the operational performance of the system over multiple years. This study employs HOMER software to optimize the capacity configuration of distributed wind-solar-storage complementary systems. It specifically models and constructs various hybrid energy systems for a particular region, including grid-connected (purchase-sell) wind-solar-storage systems, grid-connected (sell) wind-solar-storage systems, and off-grid wind-solar-storage systems. These systems are compared and analyzed in detail against a region solely reliant on grid power supply. The aim is to address issues related to energy supply costs, system reliability, and to provide users with continuous, stable, and high-quality energy services. The hybrid energy systems studied include wind and solar renewable energy sources. Given that the Inner Mongolia region of China has abundant wind and solar resources, with consistently high wind speeds and ample solar irradiation, it presents favorable conditions for hybrid energy system construction. Additionally, rural areas in this region face fewer geographical and spatial constraints when deploying renewable energy systems. Therefore, this study focuses on constructing a hybrid energy system in a rural area of Inner Mongolia. When constructing hybrid energy systems, it is crucial to consider the regional resource distribution and geographic limitations. The findings of this study are applicable to regions with abundant renewable energy reserves and sufficient space for equipment installation, making them highly valuable for promotion and utilization.
The contributions of this paper are as follows:
For regions that rely solely on large grids for power supply but face high power supply costs and low utilization of renewable energy, this study effectively investigates the value and specific costs of hybrid energy systems, providing a reference for further increasing the utilization of regional renewable energy and reducing power supply costs.
This paper constructs grid-only, grid-connected (buy-sell) wind-solar-storage, grid-connected (sell-only) wind-solar-storage, and off-grid wind-solar-storage systems using the HOMER platform. The types and parameters of the components in the hybrid energy system were determined, and the relevant renewable energy resources of the construction location were analyzed. The software was used to solve for the optimal capacity configuration that meets the regional load requirements.
Multiple scenarios of grid and user usage were simulated, and the simulation results were compared and analyzed. By building diverse operating strategies, the construction and cost issues of multi-energy complementary power supply systems were explored.
For regions with power supply difficulties, multiple grid construction strategies were proposed. While ensuring reliable power supply to users, the proportion of renewable energy utilization in the system was increased, and the system costs were minimized.
Sensitivity analysis was conducted on the optimal system, i.e., the grid-connected (buy-sell) distributed wind-solar-storage system, from the perspectives of average solar radiation intensity (kWh/m2/day), average power load (kWh/day), and average purchase electricity price (CNY/kWh). The impact of changes in these sensitivity variables on system costs was explored, effectively evaluating the system’s performance under multi-factor fluctuations. The impact of these three factors on NPC, COE, and REF was analyzed and assessed, further proving the stability of the constructed system and providing a certain reference value for users building multi-energy complementary systems.
2 Introduction to HOMER Platform
HOMER, developed by the National Renewable Energy Laboratory in the United States, is capable of calculating multiple system configurations and optimizing design options to enhance cost-effectiveness. It is primarily used for designing hybrid energy systems and estimating lifecycle, installation, maintenance, and operational costs [15]. HOMER software uses component costs, load profiles, resource data (such as solar radiation and wind speeds), and economic constraints (like fuel prices) as input data. The output variables include component sizes (ratings for photovoltaic panels, wind turbines, batteries, diesel generators, and converters based on the considered load profile), net present cost (NPC) associated with component sizes, energy production and consumption, cost of energy (COE), excess power, and energy consumption [16].
During the optimization analysis using HOMER, key performance evaluation metrics are economic benefits and power supply stability, specifically the net present cost of the system and the loss of power supply probability (LPSP). Economic indicators encompass the NPC and COE of the simulated system. When optimizing equipment, installation, operation, maintenance, and replacement costs of individual devices are considered. Additionally, optimization takes into account factors such as inflation rates, discount rates, system and equipment lifespans, effectively simulating the full lifecycle costs and payback periods of the system.
Fig. 1 shows the simulation principle diagram, and Fig. 2 presents a schematic diagram of the input-output structure of the model built in this paper.
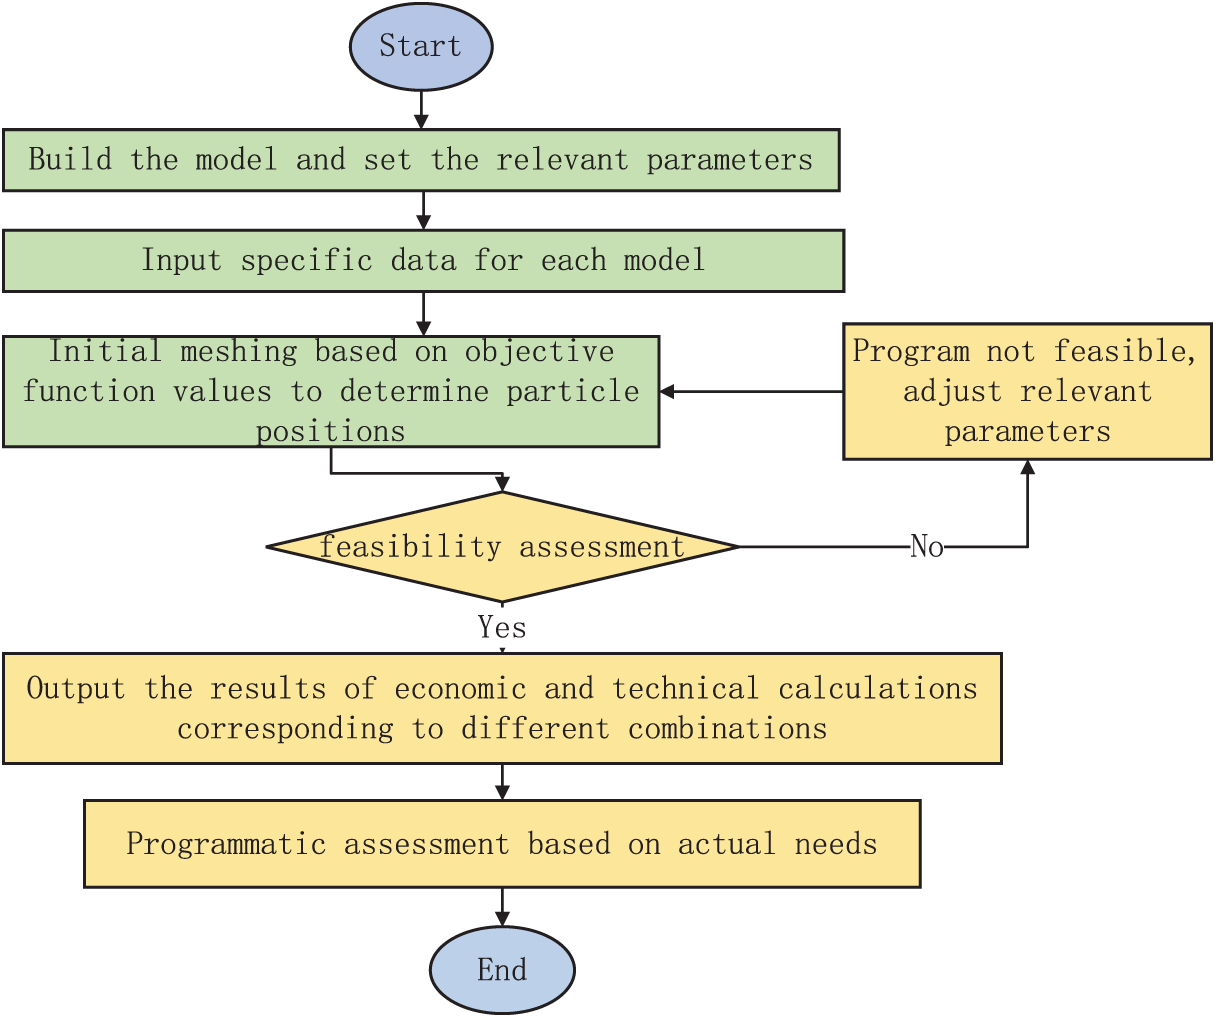
Figure 1: HOMER platform calculation principle flow
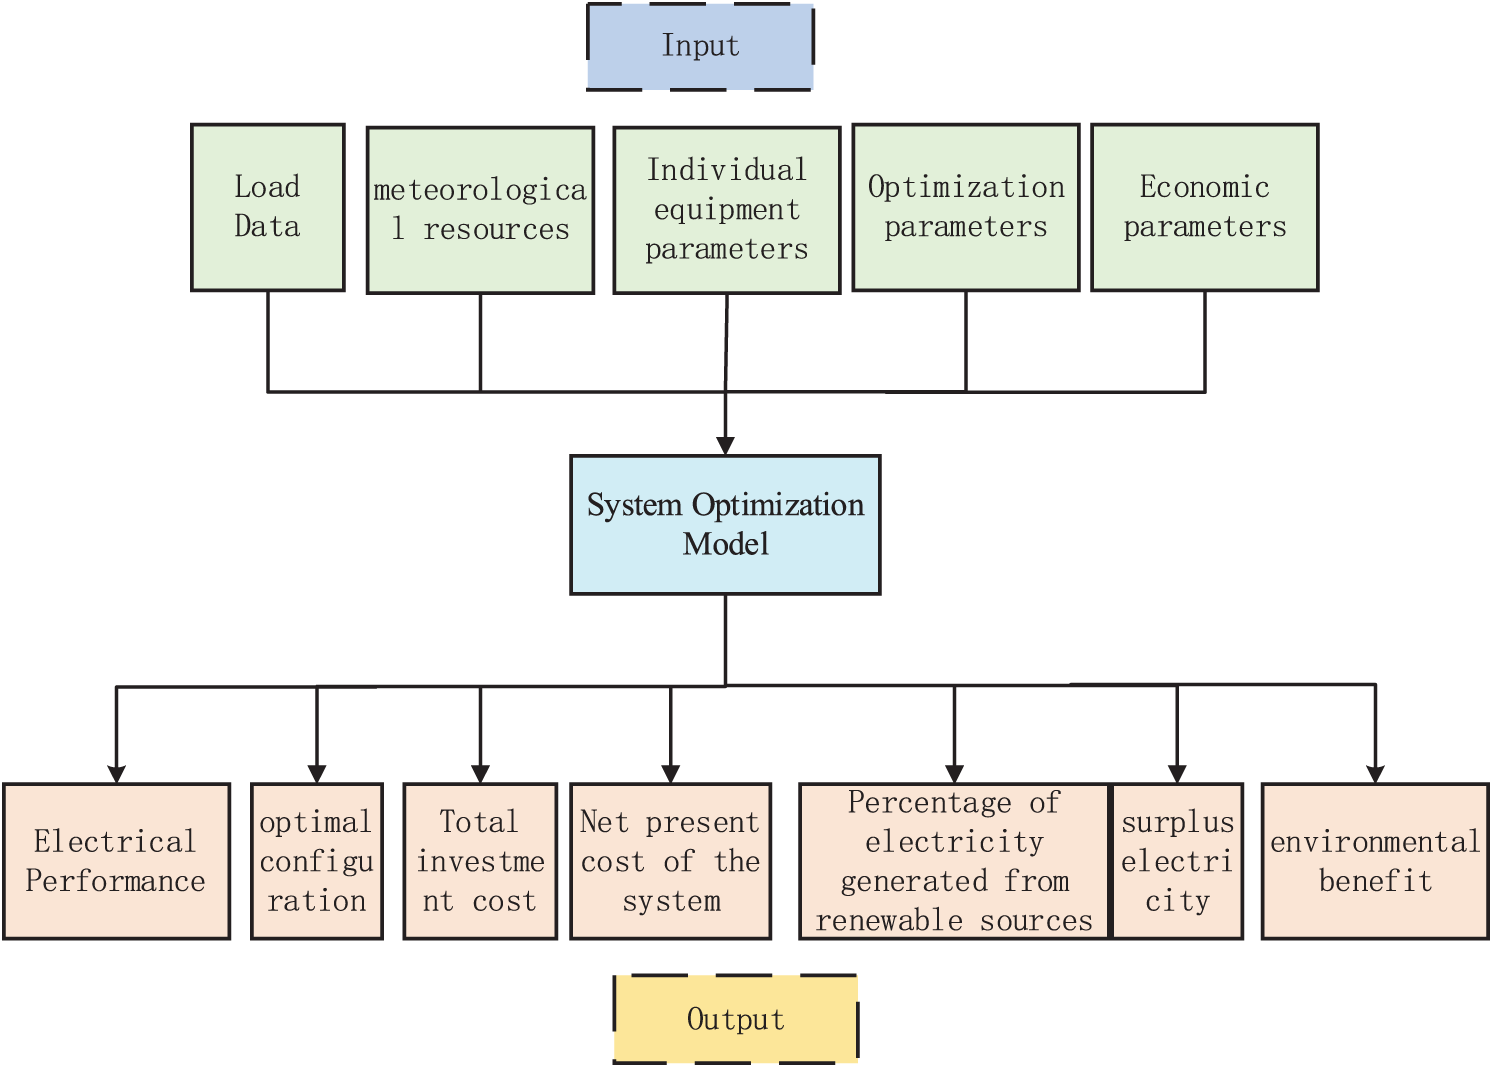
Figure 2: System optimization model structure diagram
Using the simulation, optimization, and sensitivity analysis functions of this modeling platform [17], multi-energy complementary systems are modeled. Constraints are set according to requirements, including equipment capacities, LPSP, solar and wind resource data, and load demand data. As shown in the figure above, detailed resource data for various distributed energy sources, load demands, specific parameters of each device, and system operation constraints are first input into the optimization model. This process then simulates and solves for the optimal configuration of a wind-solar-storage hybrid energy system. The optimization objectives are to minimize the NPC and the COE. Ultimately, a comprehensive and in-depth analysis is conducted on the obtained optimized configuration, including the annual total electricity generation and its proportion for each type of equipment, overall NPC and COE, annual total operational costs of the system, and various indicators of power supply reliability. Compared to other platforms, the HOMER platform offers several advantages, including flexibility, ease of use, and result visualization.
(1) Flexibility
The core feature of this platform lies in its high degree of flexibility, which significantly enhances the simplicity and efficiency of designing and evaluating off-grid and grid-connected hybrid power systems. At the same time, it can flexibly simulate the mixed operation of different energy components, such as photovoltaic panels, wind turbines, hydropower, and biomass [18]. HOMER can simulate and optimize hybrid energy systems in both standalone and grid-connected configurations, evaluating various configurations of hybrid energy systems and providing convenience for system designers’ decision-making. The software also enhances system design by minimizing costs and improving reliability, offering a comprehensive perspective for the most economical and successful system setups [12]. Additionally, compared to other software, it can more conveniently handle different specific input data, such as automatically recognizing monthly and hourly solar irradiance, load, temperature, and wind speed data, thereby providing high flexibility.
(2) Ease of Use
HOMER software is user-friendly, featuring a simple and convenient modeling process. Various components within the system have extensive model libraries, making it easy for users to directly select and use them. Users can also design models and input parameters based on their own characteristics. When users build systems that include wind turbines, photovoltaics, etc., HOMER software can download corresponding wind speed, irradiance, temperature, and other data based on specific locations, while also allowing users to import data. Furthermore, the linking process between various components is straightforward, saving modeling time.
(3) Result Visualization
HOMER stands out with its intuitive user interface, ability to design grid-connected and off-grid systems, and optimization simulation capabilities across multiple energy sources. Additionally, HOMER Pro can simulate various application scenarios, including diverse optimization result schemes and conducting optimization analysis. It provides powerful graphical presentations, making it very intuitive to use [19]. Moreover, HOMER Pro can iterate its optimization process for each value of variables in sensitivity analysis, visually simulating and demonstrating their impact on results. HOMER Pro performs simulations every hour, covering all 8760 h of the year. Calculations rely on energy balance. After optimization calculations, users can intuitively view component outputs and energy flows between components at different times. It also allows users to compare and analyze multiple optimization schemes, with clear and easy-to-read result interfaces, enabling users to easily view the optimization results of constructed systems.
Meanwhile, HOMER software is also widely used in engineering practice and has been fully utilized and valued by researchers. It has achieved excellent results in multiple engineering constructions and planning projects, providing ample validation of its simulation and optimization effectiveness. In 2019, Alternative Power Enterprises (APE) used HOMER to design an off-grid microgrid power supply system in a remote mountain village in Colorado. The system included photovoltaic arrays and generators. To date, this microgrid is one of the largest off-grid systems in the region, operating smoothly and safely with significantly reduced power supply costs [20]. In 2018, Sandbar Solar designed an off-grid microgrid to power their newly built company headquarters in downtown Santa Cruz. Using HOMER Pro for modeling and simulation calculations, they obtained the optimal system capacity configuration, which could reasonably meet the needs of the building’s power system [21]. Sigora Hait used HOMER Pro software for microgrid system planning and simulated the impact of renewable energy on the cost of microgrids in Haiti. Engineers found that using HOMER Pro for modeling effectively demonstrated the rationale for adding renewable energy and calculated the cost savings from introducing renewable energy [22]. PowerGen microgrid engineer Elisha Chesir used HOMER Pro to create simulations for new systems, determining the optimal size for solar and battery systems and finding the levelized cost of energy (LCOE) for customers. Chesir successfully designed dozens of African microgrids for PowerGen using HOMER Pro [23].
3 Wind-Solar-Storage Multi-Energy Complementary System Modeling
3.1 System Composition Structure
To carry out the capacity optimization configuration of the distributed wind-solar-storage multi-energy complementary system, a distributed wind-solar-storage multi-energy complementary system composed of renewable energy systems such as wind turbines and photovoltaic panels is established in the HOMER platform to operate in conjunction with the power grid. The functional structure principle diagram of the grid-connected wind-solar-storage multi-energy complementary system is shown in Fig. 3. Wind turbines and the power grid are connected to the AC bus, and the photovoltaic array and battery unit are jointly connected to the DC bus. The energy output from the DC bus is then converted into AC form by an inverter to provide additional power support for the load in addition to the main and backup bus outputs.
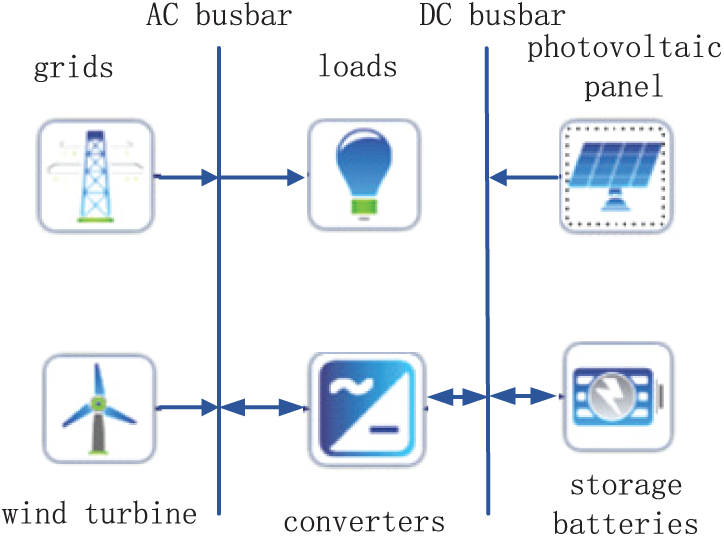
Figure 3: Schematic diagram of microgrid system simulation
Wind energy and solar energy have strong complementarity. When sunlight is abundant but wind is weak, solar energy can generate power independently; under conditions of strong wind, wind power becomes the primary source of electricity. The hybrid wind-solar system combines the utilization of wind and solar energy. When one type of energy is affected by weather or other factors, the other can compensate for its insufficiency, reducing the system’s reliance on a single energy source and improving overall system stability. For example, solar energy only generates power when there is sunlight, so it does not produce electricity at night. Meanwhile, wind turbines only start generating power when wind speeds reach the required startup speed. Additionally, wind power equipment utilizes high-altitude wind energy, while photovoltaic (PV) systems can harness ground-level solar energy beneath the wind turbines, allowing the hybrid system to make more efficient use of land resources. Furthermore, the system is equipped with energy storage devices. When wind and solar power generation exceeds load demand, excess electricity is stored in batteries. When power generation does not meet load requirements, the batteries supply power to the load.
3.2 Wind Turbine Modeling and Wind Energy Resource Data
(1) Equipment Selection
When selecting wind turbines, factors such as technical specifications, lifespan, and power output are considered. After carefully considering various types of wind turbines, this paper selects a wind turbine model with a rated power of 30 kW. The wind turbine is set up with a hub height of 20 m and a cut-in speed of 3 m/s, and a cut-out speed of 25 m/s. Detailed information on wind turbine model parameters is listed in Table 1.
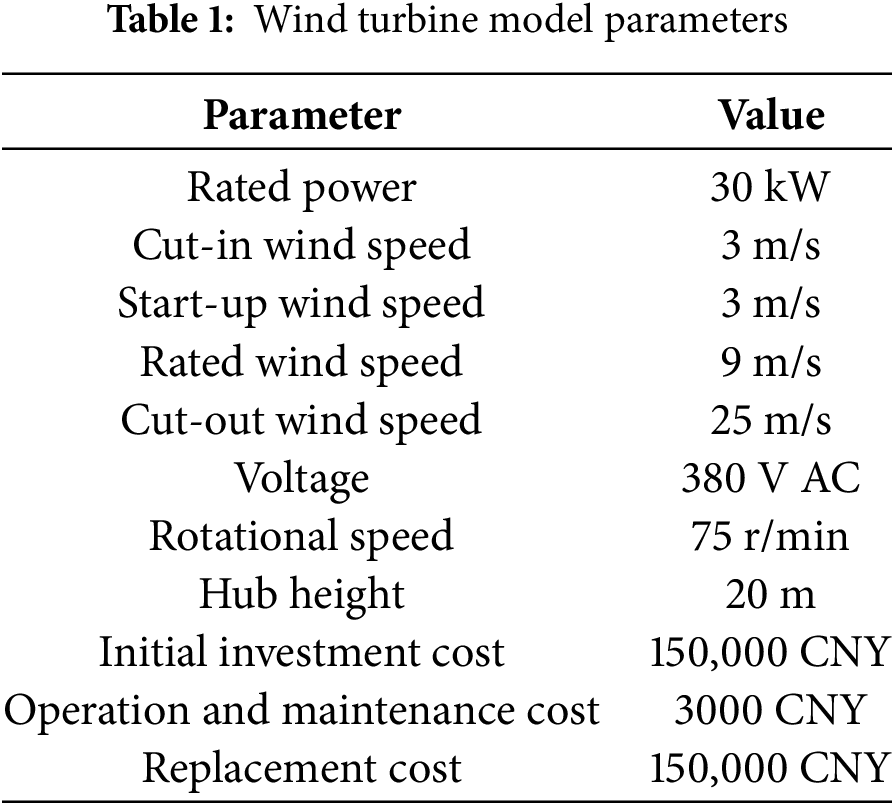
Fig. 4 depicts the power curve of the wind turbine, indicating a synchronous growth trend in output power with the increase of wind speed. When the wind speed exceeds 9 m/s and is less than the cut-out wind speed, the output of the wind turbine is maintained at its maximum level.

Figure 4: Power curve for a 30 kW wind turbine
(2) Wind Resource Data
Wind resource data is sourced from the NASA Surface meteorology and Solar Energy database, a centralized storage center for historical weather simulation data. One year’s hourly wind speed data for a specific region is selected, with the highest wind speed recorded in April at 8.396 m/s and the lowest in August at 5.466 m/s, resulting in an annual average wind speed of 7 m/s. Figs. 5 and 6 present the monthly average wind speed and the hourly wind speed for the region, respectively.

Figure 5: Monthly average wind speed in a region

Figure 6: Wind speeds in an area for 8760 h a year
(3) Wind Turbine Output Power
A phased approach is employed in this study to calculate the output power of the wind generator at various time intervals, which includes the following steps: first, deduce the wind speed at the height of the wind turbine hub at the corresponding time; then, based on this wind speed value, calculate the theoretical power that the wind turbine can generate under the assumption of standard atmospheric density; finally, to improve calculation accuracy, adjust the theoretical power according to the actual air density. In each time step, the wind speed at the height of the wind turbine hub is calculated using the logarithmic law, as shown in Eq. (1),
where
After calculating the specific wind speed at the hub height, refer to the power characteristic curve of the wind turbine to further deduce the expected power output of the wind turbine under standard temperature and pressure conditions at this wind speed. If the wind speed measured at the wind turbine hub height exceeds the effective range defined by the power curve, i.e., when the wind speed is below the start-up wind speed threshold or above the cut-out wind speed threshold, the wind turbine will not produce effective power. Since the power curve usually specifies the performance of the wind turbine under standard temperature and pressure conditions, the predicted power value from the power curve is multiplied by the air density ratio for adaptation to actual conditions, as corrected by the following formula:
where PWTG is the output power of the wind turbine (kW);
3.3 Photovoltaic Modeling and Solar Energy Resource Data
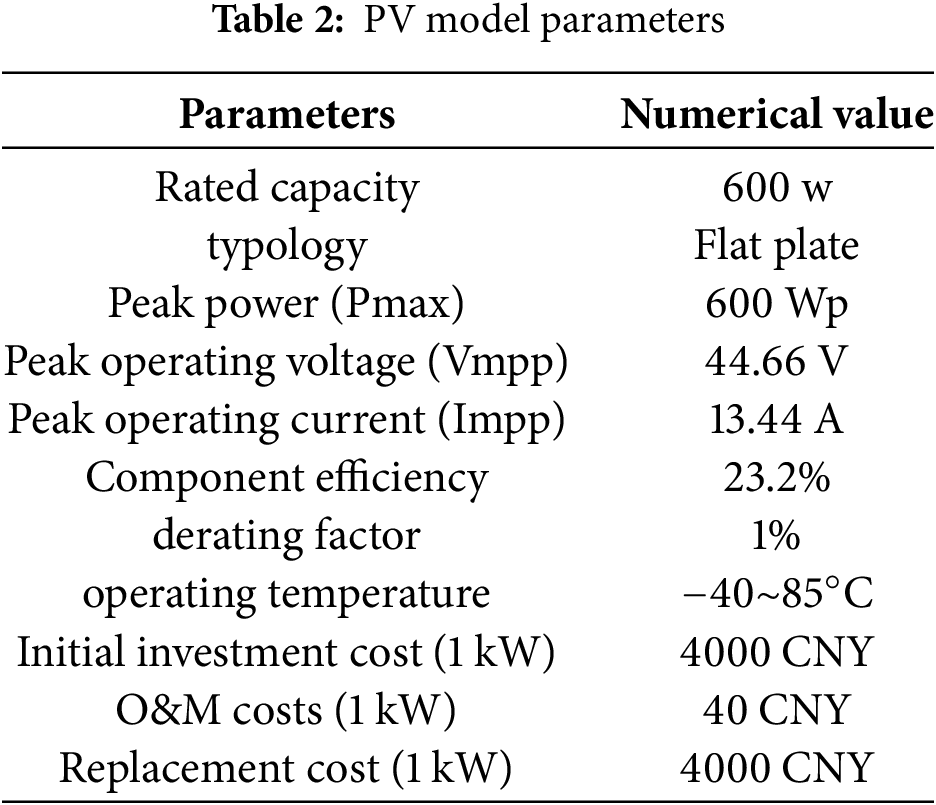
Commonly used types of photovoltaic modules include monocrystalline silicon, polycrystalline silicon, and amorphous silicon. Among them, monocrystalline silicon PV module is a device that works based on the principle of photovoltaic effect, and its core function is to effectively extract solar energy and convert it into electricity. The PV module selected in this paper is monocrystalline silicon PV module and its system parameters in Table 2.
(1) Solar Radiation Intensity
This paper utilizes solar energy resource measurement data from NASA. The time step for calculating the energy output of solar photovoltaic panels is 1 h, with global horizontal solar radiation intensity being a key parameter. Fig. 7 shows the monthly average daily radiation intensity (kW/m2/day) and clearness index for the region. Fig. 8 presents the hourly solar radiation for the entire year.
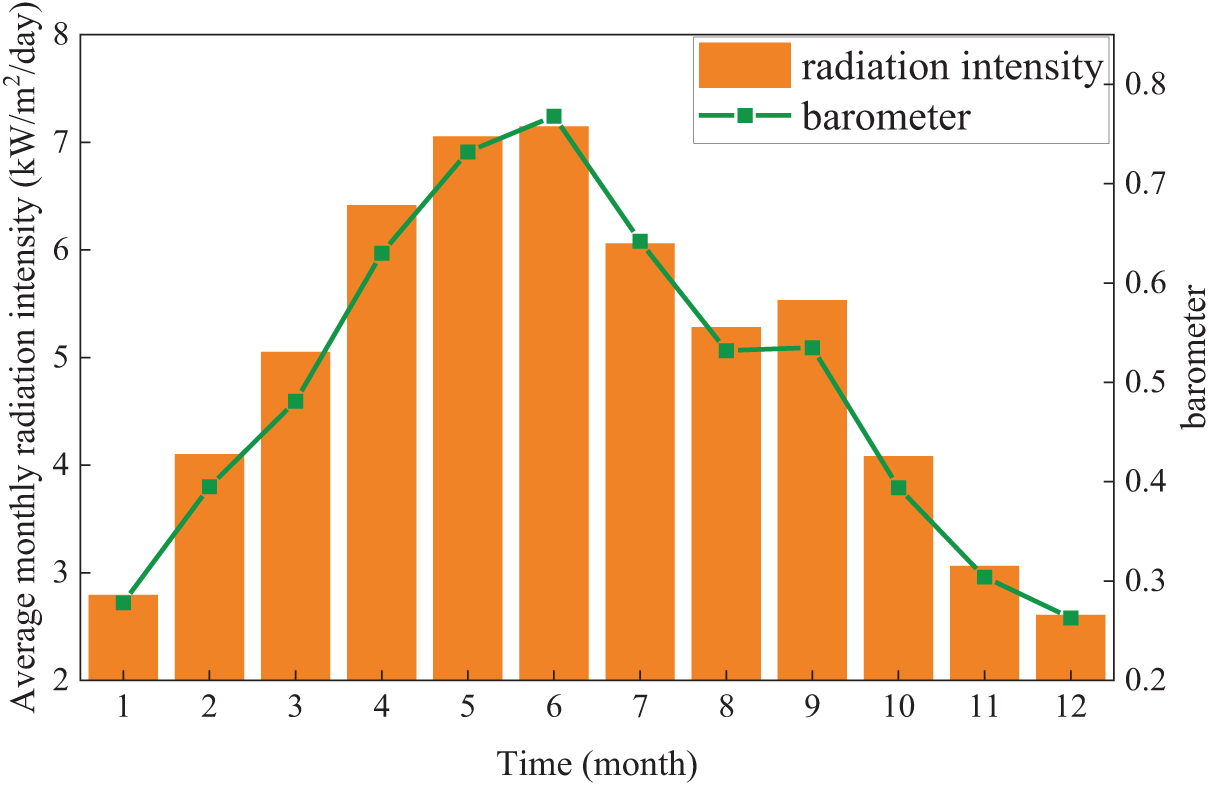
Figure 7: Monthly average daily radiation intensity and the clearness index

Figure 8: Solar radiation intensity values at 8760 h
From these charts, it can be observed that the average radiation intensity is higher from April to July, with values of 6.415, 7.053, 7.148, and 6.059 kWh/m2/day, respectively; while the lowest radiation intensity in winter is in December, reaching a minimum value of 2.608 kWh/m2/day.
(2) Photovoltaic Output Power Calculation
The formula for calculating the output power of photovoltaic panels is as follows:
where
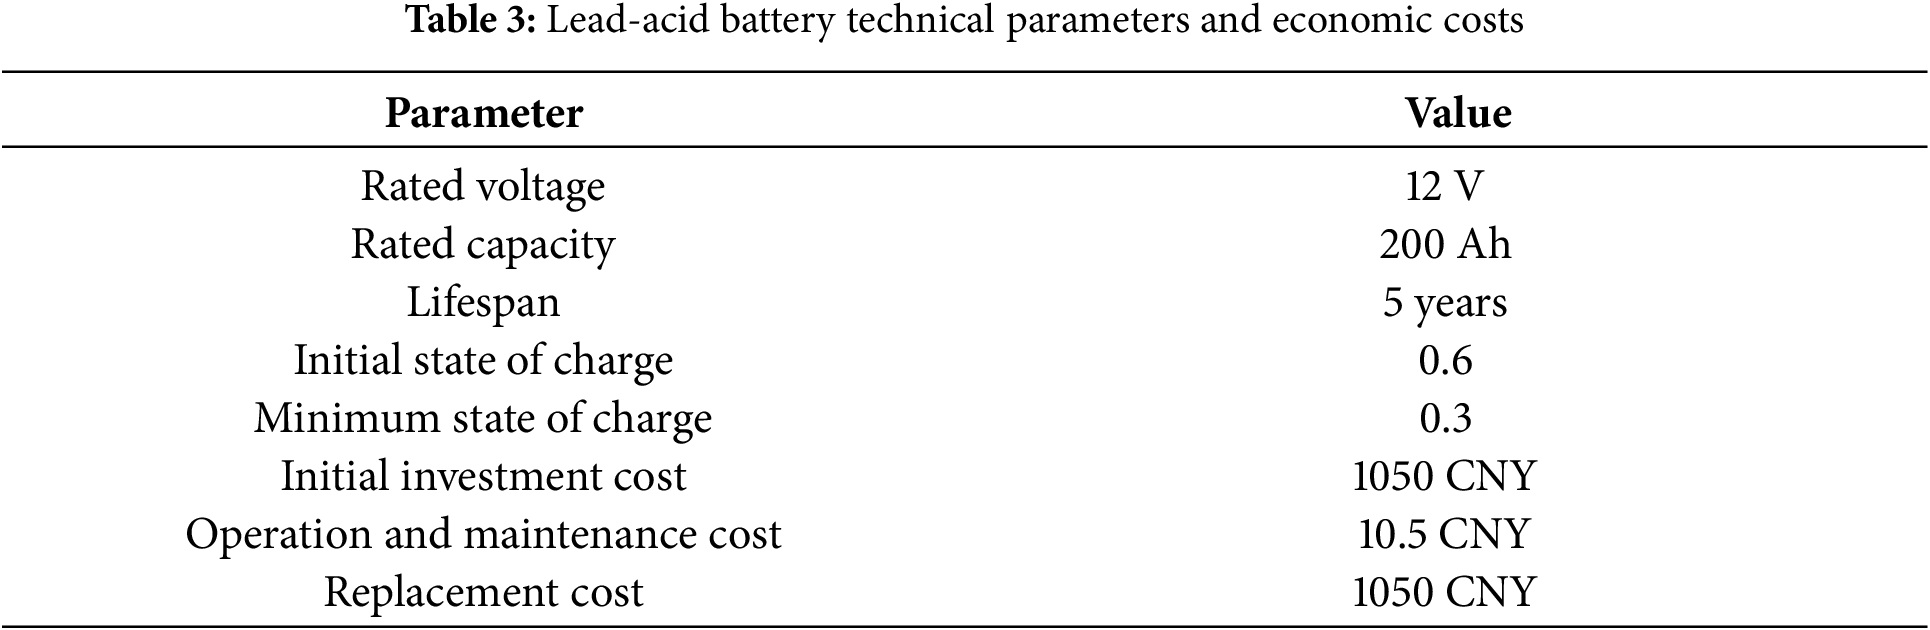
In power systems, the most commonly used device for storing electrochemical energy is the energy storage battery. The battery is a key component of the system, storing excess electricity and supplying power when there is a shortage, thereby maintaining the operation of the distributed system. Lead-acid batteries, compared to other types of batteries such as lithium-ion batteries, have lower manufacturing costs, and their performance and reliability have been verified over a long period. Therefore, this paper selects lead-acid batteries as the research subject, with a cost of 5.25 CNY/Ah. The technical parameters and economic costs of the batteries used are shown in Table 3.
In this study, the selected region is a rural area in Inner Mongolia. Having obtained 8760 h of load usage data for the year from area customers, and the hourly, monthly, and annual load situations are shown in Fig. 9. From the load data, it can be seen that the load usage in the region fluctuates a lot, in which the load usage is less after 0:00–6:00 and 21:00, and load usage the high value of hours is located between 11:00 and 18:00. The demand in July is the highest, approximately 60.68 kW/h, and the demand in December is the lowest, at 42.50 kW/h. The total annual energy consumption is 448,066 kW, with an estimated average daily energy consumption of 1227.5 kW/day.
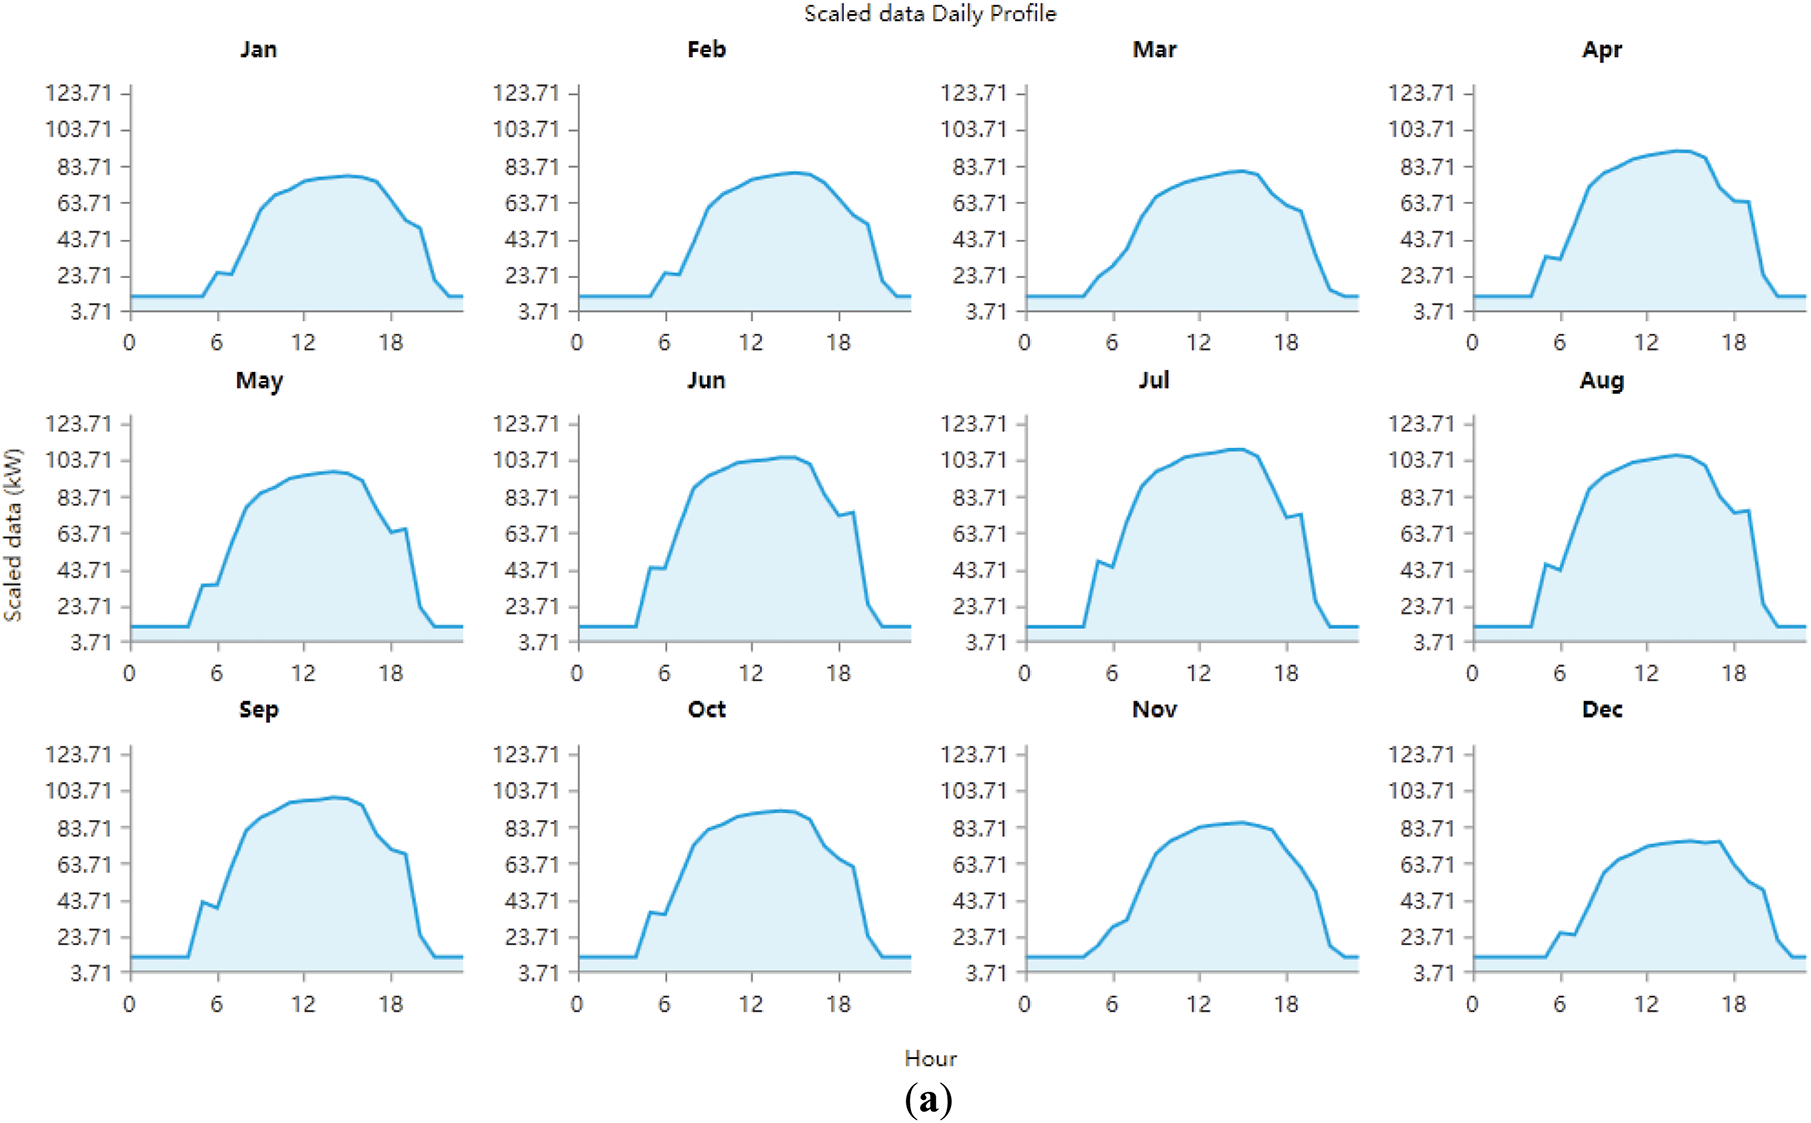
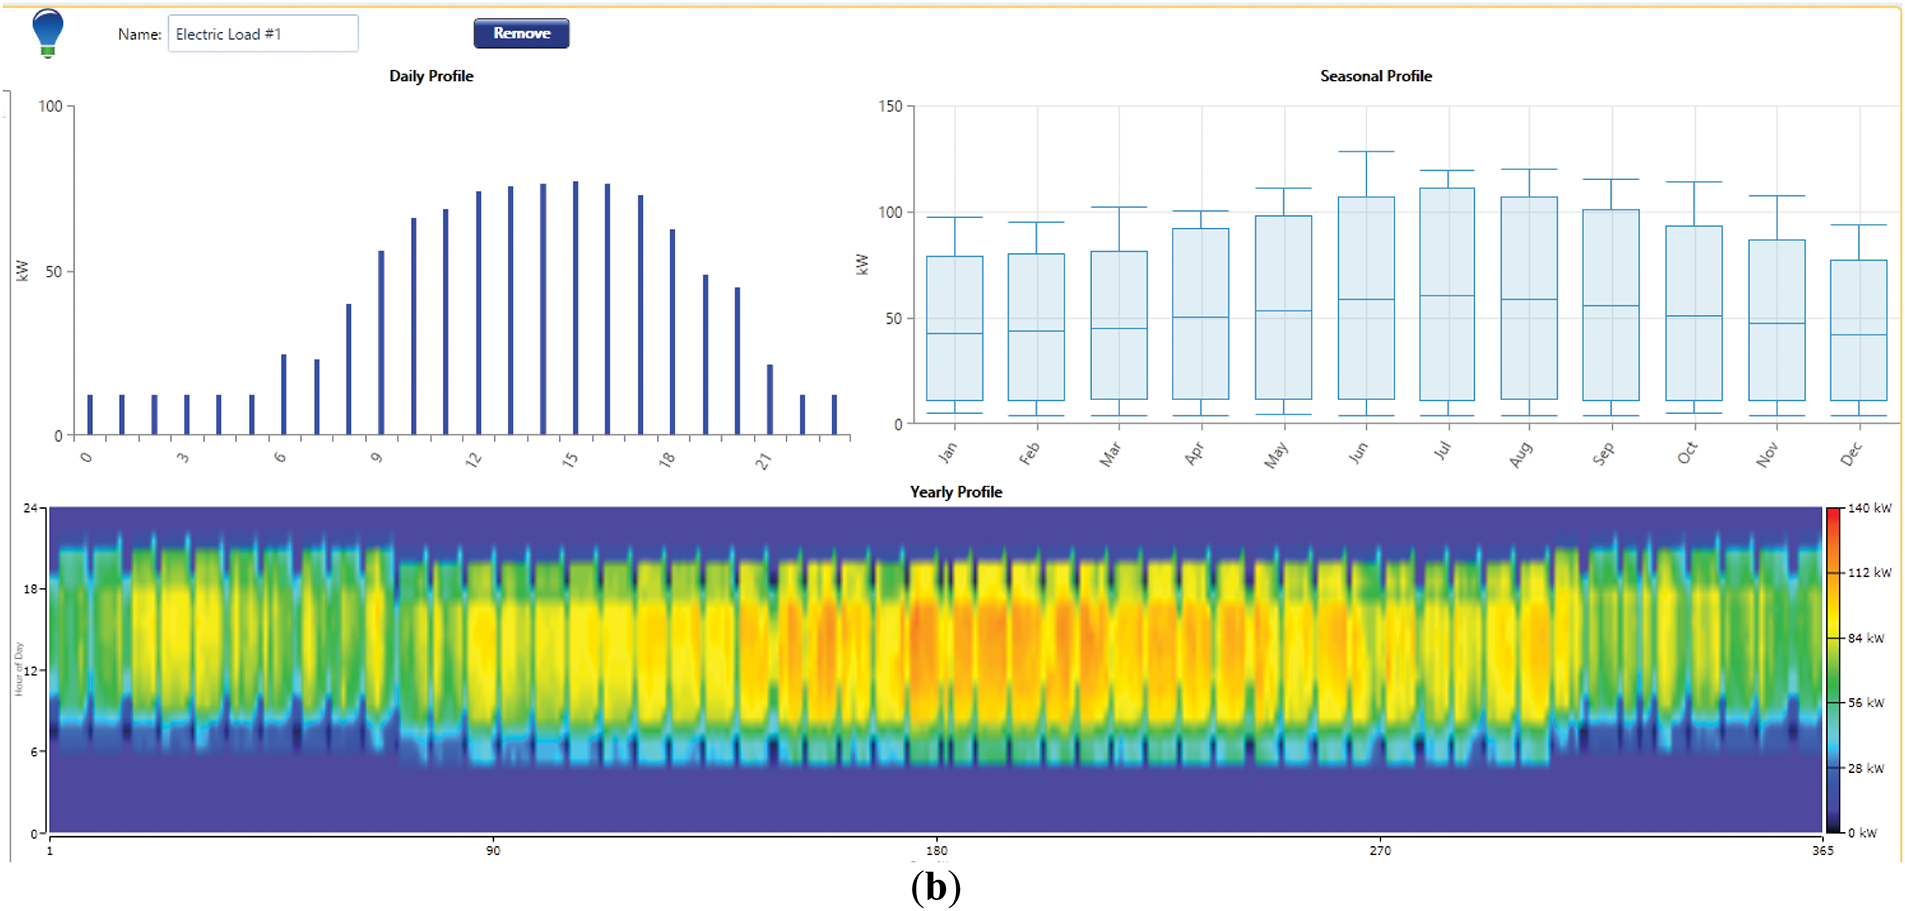
Figure 9: Load distribution for a day, month and year. (a) Monthly load profiles; (b) Daily, monthly and annual load profiles
(1) Converter
In the multi-energy complementary system, a direct current power source from the photovoltaic power generation system is introduced, and the battery is also connected to the direct current bus. To match the alternating current load, a power converter is required.
(2) Power Grid
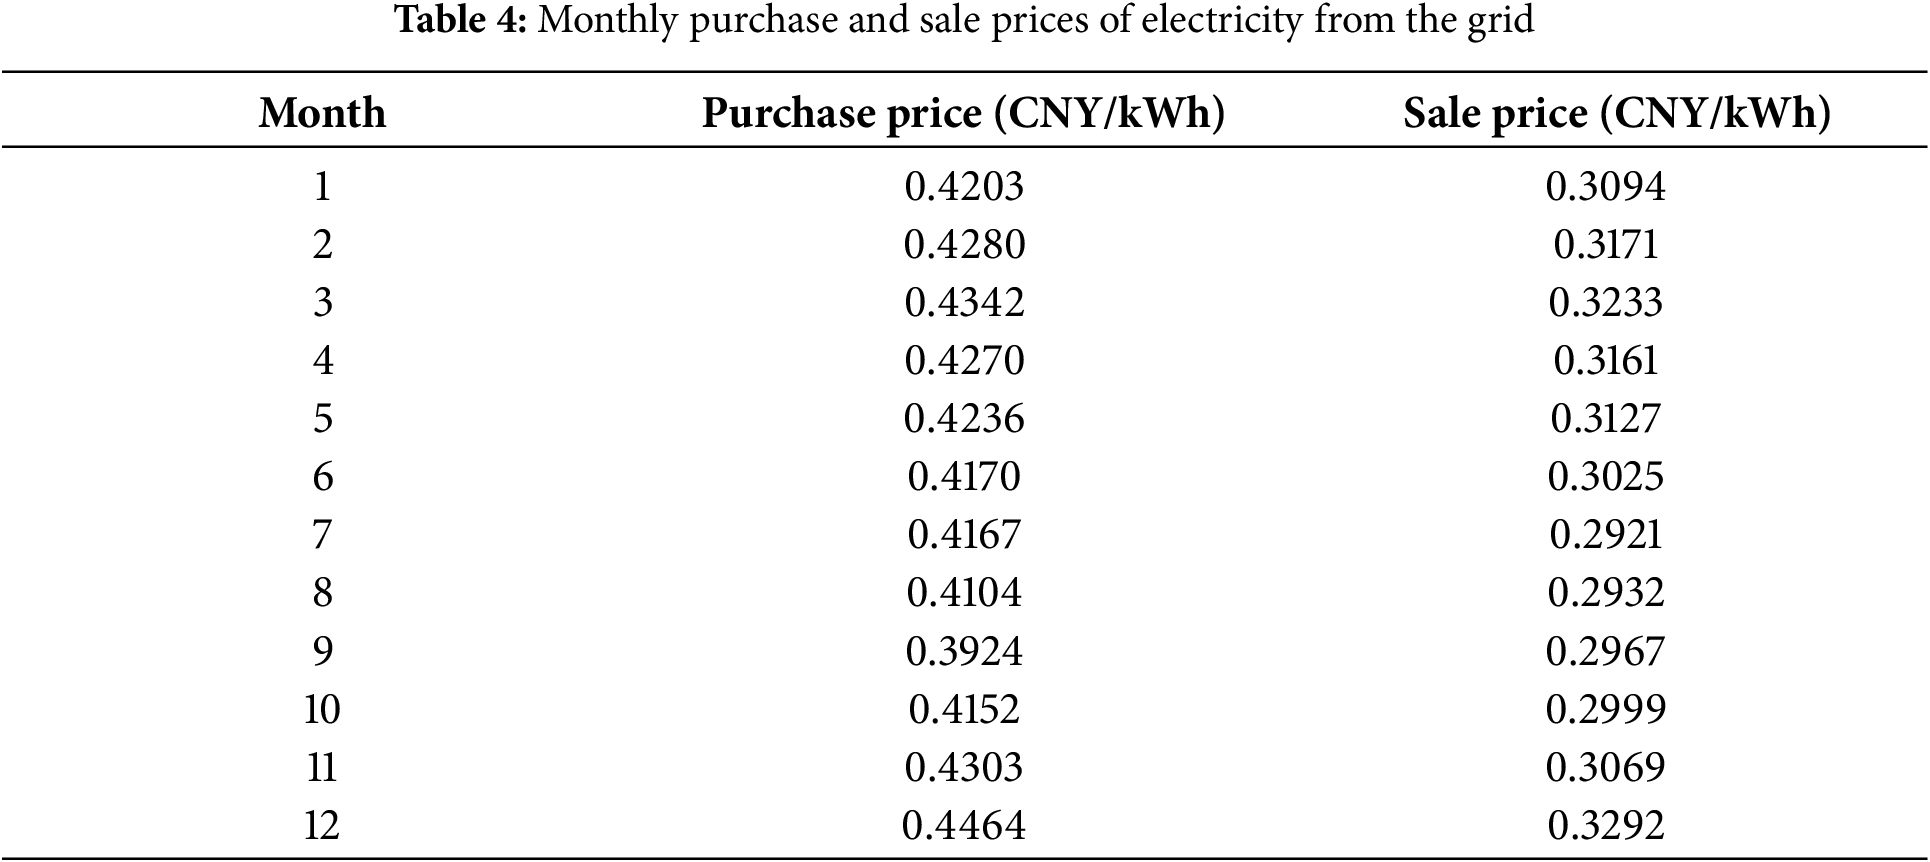
Considering the scenario of connection to the power grid, it is necessary to clarify the parameters related to the power grid. Purchase and sale prices were checked with power companies in Inner Mongolia. The electricity prices for purchasing and selling electricity from the grid each month are formulated as shown in Table 4.
3.7 System Control and Constraints
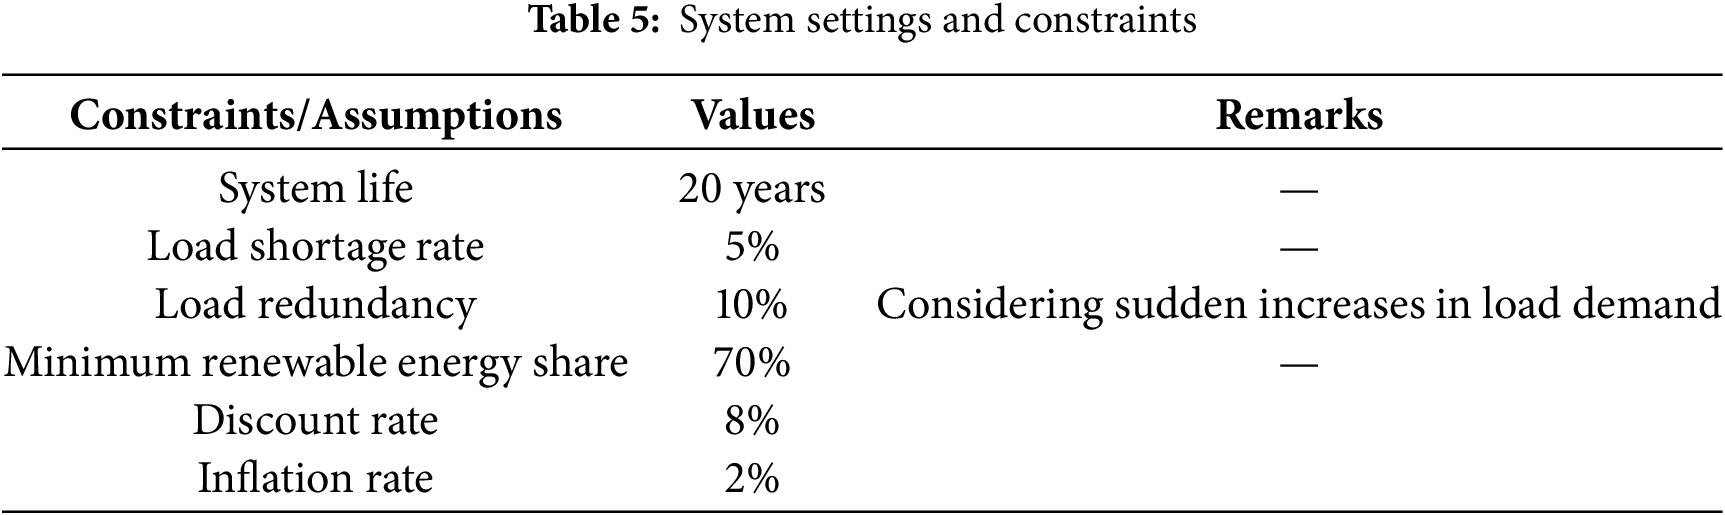
The time step for simulation calculations in this paper is 1 h, assuming that the power output of the components remains constant within a time step. When the renewable energy generation in the system exceeds the load demand, the surplus power can be stored in the energy storage battery or sold to the grid. When the system’s wind and solar output cannot meet the load demand, the missing power will be provided by the energy storage battery or the grid. The constraints considered in this paper are listed in Table 5.
3.8 Optimization Method and System Operation Strategy
HOMER simulates system operation by performing energy balance calculations for each time step over the course of a year. For each time step, HOMER compares the electricity and thermal demands with the energy that the system can provide at that time step and calculates the energy flow for each component of the system. For systems that include batteries or diesel generators, HOMER also determines how to operate the generators and whether to charge or discharge the batteries at each time step. HOMER performs these energy balance calculations for every system configuration it sets up for simulation.
HOMER Pro employs a derivative-free algorithm to search for the system with the lowest cost. Subsequently, it performs simulation optimization on the constructed systems using an optimization algorithm. Ultimately, HOMER presents a list of configurations, which are sorted by default according to Net Present Cost (NPC) values. This list can be used to compare the outcomes of different system designs and to filter and sort other optimization results, such as Levelized Cost of Energy (COE) values.
In the optimization process, it is critical to select appropriate energy allocation strategies to achieve effective control and adjustment of system operations. This involves regulating the energy flows between different system components, defining which devices must operate and their target output power at specific times. Such strategies form a set of guidelines aimed at directing the operation modes of generators and storage units when the electricity production from renewable resources is insufficient to meet load demands. The energy dispatch scheme is closely related to the operational supervision of hybrid energy systems and the optimal capacity planning of system components.
HOMER Pro offers users two distinct operating strategies: Cyclic Charging (CC) and Load Following (LF) [25]. In the Cyclic Charging (CC) strategy, during each time interval, the most economical combination of power sources—including generators, storage systems, and external grids—is calculated first to ensure both the satisfaction of primary electrical and thermal load requirements and compliance with established operating reserve standards. This initial phase is achieved through a comprehensive evaluation of the cost-effectiveness of various power sources, aiming to identify the least-cost solution. Following the fulfillment of core load requirements, the system reallocates any surplus electricity generated by the power plants to auxiliary uses, such as charging storage devices or serving flexible non-critical demands. This approach not only ensures that generators can operate at optimal efficiency when needed but also promotes the effective utilization of excess energy, thereby reducing fuel consumption and enhancing the efficiency of storage systems. The entire process is designed to optimize energy utilization while minimizing operational costs and ensuring the reliability and flexibility of the system.
The Load Following (LF) strategy is an energy dispatch method designed to ensure that power generation units produce only the minimum necessary electricity to meet critical load demands during operation. Under this framework, renewable energy sources are prioritized for secondary objectives, such as charging storage facilities or addressing non-immediate, flexible demand responses. When economically viable, power generation units can increase their output to supply additional electricity to the external grid. The core objective of this strategy is to minimize overall operational costs by optimizing service to primary electrical and thermal demands within each time interval while ensuring the system has sufficient reserve capacity to handle unexpected situations. The total cost calculation encompasses various expenses, including fuel consumption, daily operations and maintenance, and equipment upgrades or replacements. Additionally, the LF strategy takes into account maintaining adequate operating reserves to ensure the reliability and stability of the system. The scheduling strategies for hybrid energy systems considered in this context are built upon the concept of the Load Following strategy, which is typically applicable to systems with a high proportion of renewable energy [26].
In this study, due to the system’s high share of renewable energy and the need to enhance the stability of power usage for loads, the system flexibly adopts both Cyclic Charging (CC) and Load Following (LF) energy management strategies during optimization. This approach aims to optimize the use of renewable resources while ensuring the stability and reliability of the system.
3.9 Environmental Impact of Components
Wind turbines generate electricity by harnessing wind energy, while photovoltaic (PV) systems produce electrical power through the reception of solar radiation via PV panels. Both wind and solar energy are crucial renewable resources that play a significant role in improving atmospheric conditions and reducing greenhouse gas emissions. These sources are characterized by their wide distribution and minimal geographical constraints, addressing challenges such as difficulties in accessing electricity and high usage costs in certain regions. By integrating distributed energy resources into the energy system, this approach facilitates the development and improvement of power infrastructure. Moreover, both wind and solar energy are clean and non-polluting. The construction of hybrid energy systems using wind turbines and PV equipment can reduce greenhouse gas emissions during operation, effectively utilizing regional renewable resources. This not only decreases the environmental impact of electricity consumption but also reduces dependence on the grid. Consequently, the deployment of such systems contributes to sustainable development and environmental protection, promoting a cleaner and more efficient energy future.
In 2024, four 6.7 MW wind turbines in Weifang, Shandong, China were successfully connected to the grid on September 30th, with an annual available power generation exceeding 70 million kWh and reducing CO2 emissions by 57,000 t. By establishing a hybrid wind-solar-hydrogen energy system, a 3.3 peak MW photovoltaic (PV) power station was built, generating 3.6132 million kWh annually. The hydrogen refueling station can store up to 300 kg of compressed hydrogen daily. Additionally, 46 charging stations were constructed to meet the charging needs of electric vehicles and machinery within the port area. After operation, it saves approximately 8500 t of standard coal annually and reduces CO2 emissions by about 21,200 t, successfully creating China’s first “zero-carbon port” [27]. In 2021, State Grid Corporation of China designed a comprehensive energy system for industrial parks integrating wind, solar, storage, and charging. This system includes a 2.2 MW PV power generation system, a 10 kW wind power generation system, a 4.02 MW/12.6 MWh lithium iron phosphate battery, and a 70 kW/307.2 kWh reused power battery. The project has cumulatively generated 1.17 GWh of renewable energy, with the energy storage system cumulatively charged 5.26 GWh and discharged 4.98 GWh. It saves about 665 t of standard coal annually and reduces CO2 emissions by approximately 1760 t and harmful gas emissions by about 1.8 t [28]. These examples demonstrate that the development and application of hybrid energy systems can effectively reduce the environmental impact of power supply systems.
Meanwhile, the development of new energy industries is closely related to metal resources, such as copper and neodymium used in wind turbines and indium and gallium used in PV panels. In response to the urgent need for green and low-carbon transformation, ensuring the security of clean energy supply chains and strategic mineral resources through various channels has become an international consensus [29,30]. Similarly, waste from PV panels contains basic metals like aluminum, copper, and silicon, precious metals like silver, and toxic metals like lead, cadmium, chromium, and tellurium. If improperly handled, these discarded metals can not only result in resource wastage but also pollute soil and water sources, posing threats to ecosystems and human health [31]. Research on material requirements and waste quantities in the new energy sector primarily involves bulk materials and rare earth materials [32]. Wind turbine towers and foundations extensively use steel and concrete. Therefore, when utilizing wind and solar energy resources and vigorously developing wind power and PV power generation, it is essential to evaluate the reserves of various metal resources, reduce resource consumption during utilization, and enhance emerging solid waste recycling technologies. Establishing research and development projects for the circular utilization of decommissioned wind and PV equipment will strengthen technological support.
Based on the built simulation system, the requirements are low cost and high renewable energy utilization rate. The system configuration can be evaluated from both cost and renewable energy generation proportion perspectives, with the main evaluation indicators including the system’s annualized total cost, cost of electricity, and renewable energy supply proportion.
The Net Present Cost (NPC) is an indicator used to evaluate the total lifecycle cost of a system. The NPC considers all costs incurred throughout the project’s lifecycle, including initial investment costs, operation and maintenance, replacement costs, and discounted future expenses. The calculation of NPC is shown in Eq. (4),
where
where
where
The annualized total cost can be calculated by Eq. (7), which measures the relative contribution of each component to the total net present value cost and allows for comparison of costs between different parts of the system,
The Cost of energy (COE) represents the cost of generating 1 kWh of effective electrical energy by the system and can be calculated by Eq. (8), which divides the annual generation cost by the total electrical load,
where
4.3 Renewable Energy Supply Proportion
In grid-connected systems, the power required to meet the load demand is partly from the grid and partly from renewable energy generation. The renewable energy supply proportion (REF) is calculated by Eq. (9),
where
5 System Model Simulation Results and Analysis
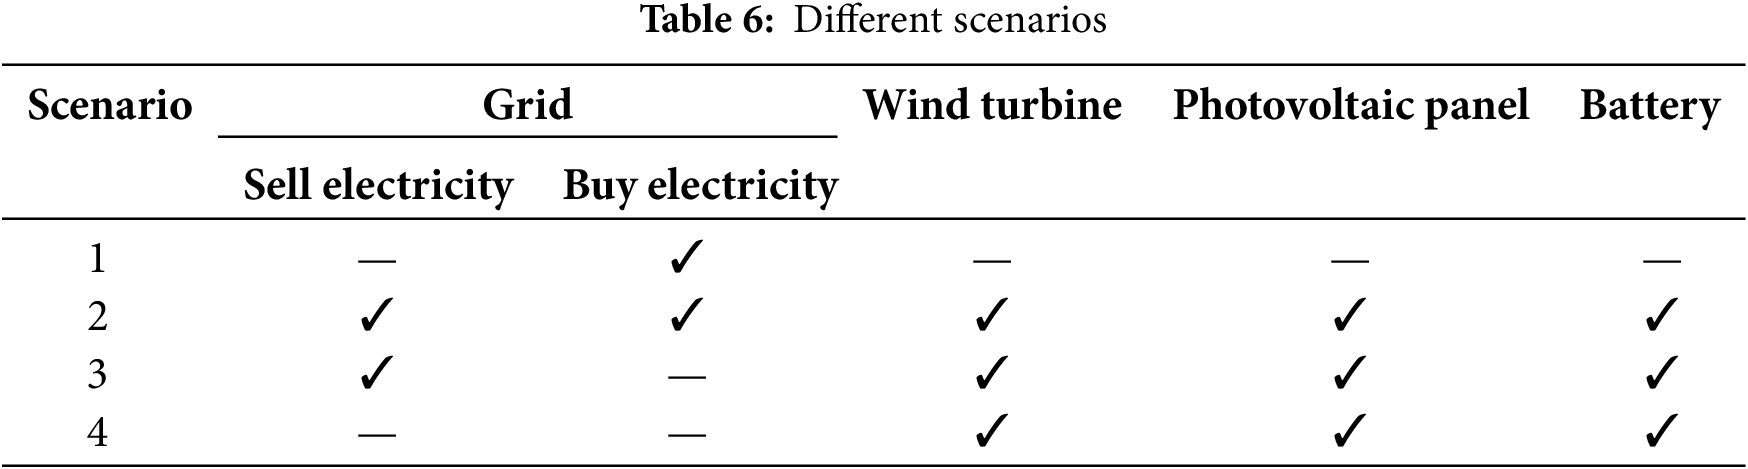
To meet the load demand, this paper simulates four different scenarios and compares them with the basic scenario of being connected only to the grid. Table 6 shows the different configurations of the multi-energy complementary system. Due to the inherent volatility of renewable energy and the importance of increasing the utilization rate of renewable energy [34], energy storage devices, such as batteries, are included in the configurations containing renewable energy output. This section will discuss the technical and economic optimization results of the proposed distributed wind-solar-storage multi-energy complementary system under different scenarios to meet load demands.
5.1 Optimization Results and Analysis of Different System Scenarios
This paper utilizes HOMER software to construct various renewable energy-based wind-solar-storage systems. Specifically, it builds models for systems that rely solely on grid supply, grid-connected (Purchase-Sale) wind-solar-storage systems, grid-connected (Sale) wind-solar-storage systems, and off-grid wind-solar-storage systems. By studying and discussing the expansion of renewable energy’s share in power supply systems, the research simulates and evaluates the costs and pollutant emissions of power supply systems after introducing renewable energy as a power source. The aim is to build integrated regional energy supply systems that fully leverage the region’s abundant renewable energy resources, thereby further reducing power supply costs and pressures, decreasing dependence on external grids, and effectively lowering pollutant emissions. Ultimately, this approach aims to achieve cost savings in regional power supply through the integration of renewable energy.
(1) Grid-Only Power Supply for Load
In this scenario, the load demand is entirely dependent on purchasing from the grid, with no renewable energy components included in the system configuration. The configuration schematic is shown in Fig. 10.

Figure 10: Schematic diagram of the grid-only power supply system
According to the electricity prices set in Table 4, the total annual electricity purchased from the grid is 448,066 kWh, with an NPC of 2.182988 million CNY over the entire project lifecycle, and an annualized total cost of 188,509 CNY. The electricity purchase from the grid obtained through HOMER is shown in Table 7 below, with the highest purchase in July at 45,145 kWh, and the carbon dioxide emission is 372.791 t/year. The optimization results are plotted in Fig. 11.
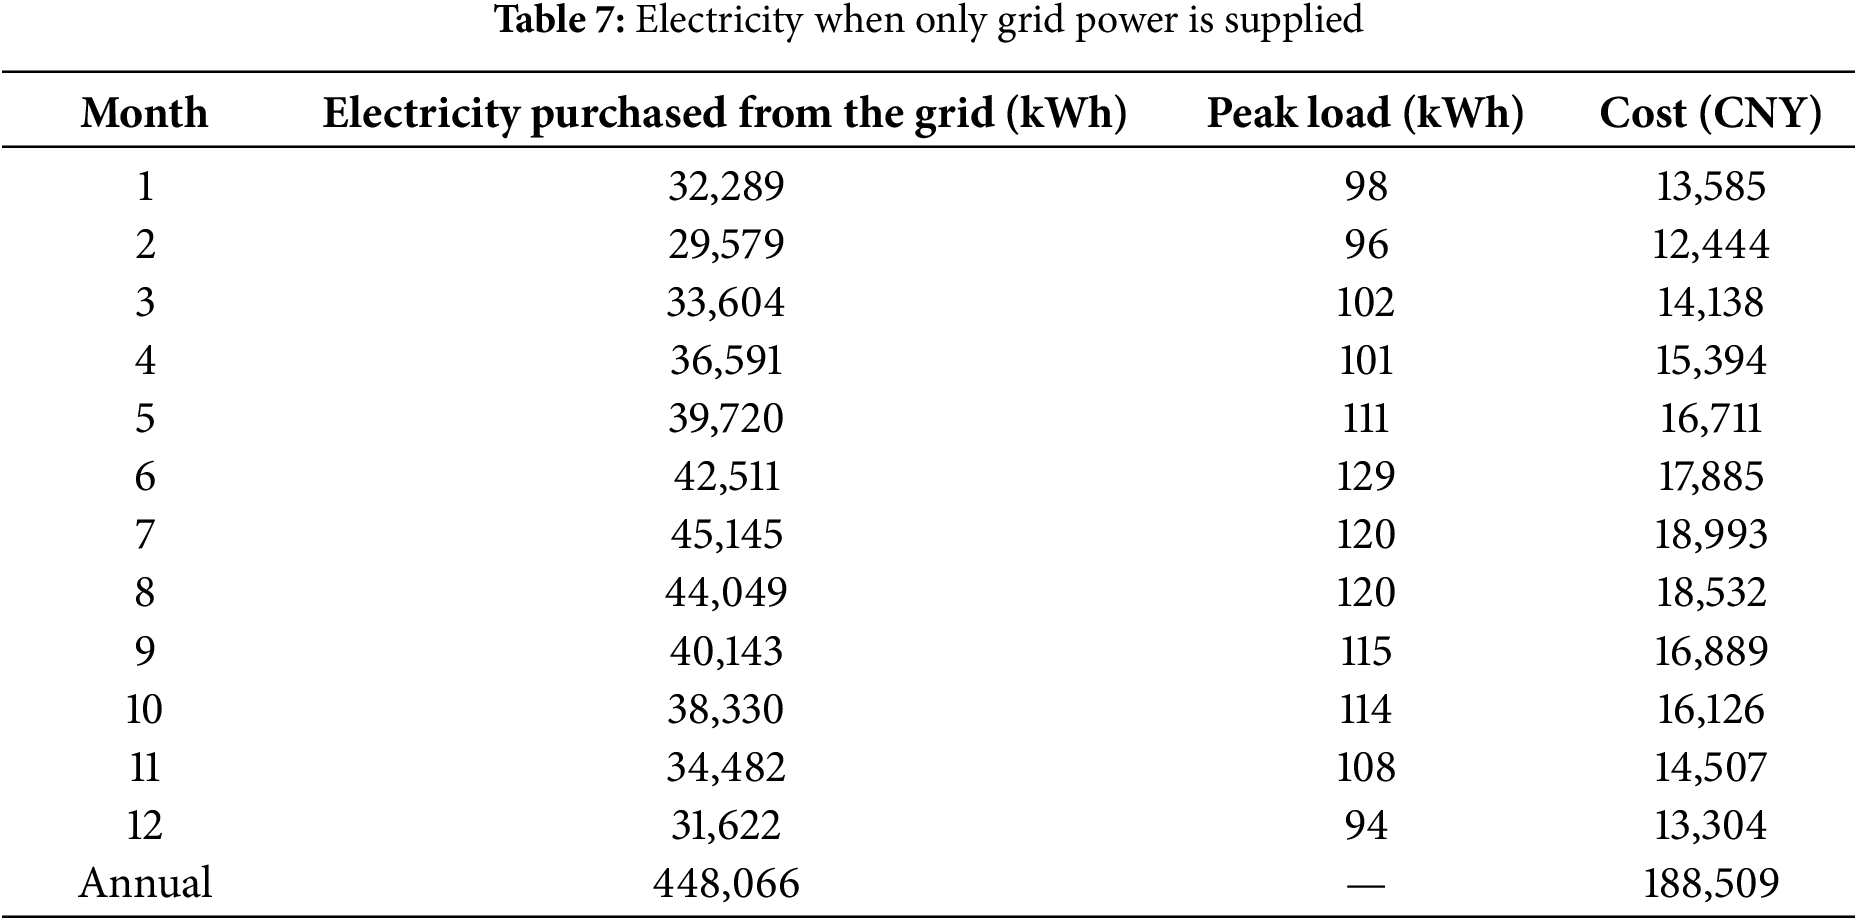

Figure 11: Optimization results of a grid-only power supply system. (a) Results of capacity configuration optimization; (b) Distribution of monthly power purchases
(2) Grid (Selling and Buying Electricity), Wind Turbine, Photovoltaic Panel, and Battery
In this scenario, the constructed system is a grid-connected distributed wind-solar-storage multi-energy complementary system, as shown in Fig. 12, composed of renewable energy components, batteries, and converters. The load electricity demand in this system will be directly provided by solar and wind energy. When renewable energy generation is insufficient to meet the demand, the battery discharges and electricity is purchased from the grid; conversely, when renewable energy generation produces excess electricity, this surplus is charged into the battery and sold to the grid.
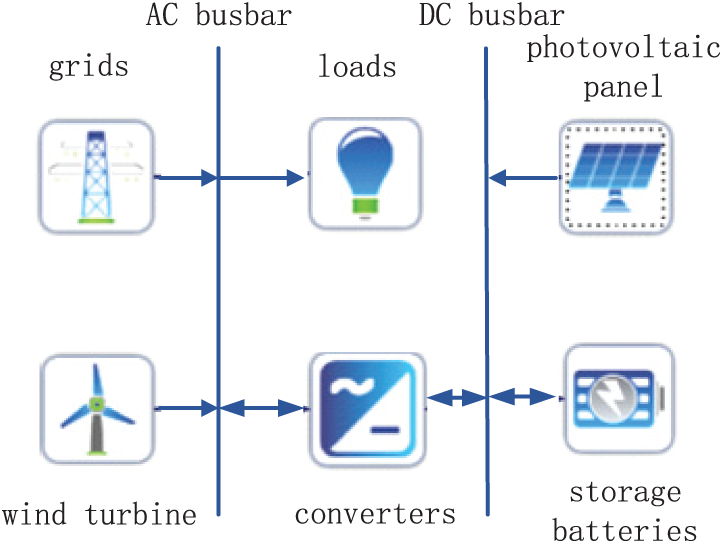
Figure 12: Schematic diagram of grid-connected system structure
The optimal capacity of the distributed wind-solar-storage multi-energy complementary system includes a 30 kW wind turbine connected to the AC bus, 303 kW photovoltaic panels connected to the DC bus, and 20 sets of 12 V·200 Ah energy storage batteries. The cost of electricity for this configuration is 0.295 CNY/kWh, which is 30% lower than the system that purchases electricity solely from the grid.
Furthermore, compared to the grid-only power supply system, the NPC of this multi-energy complementary system is 1.877292 million CNY, a reduction of 13.9%. The wind turbine generates 31,133 kWh of electricity annually, and the solar photovoltaic panels generate 426,323 kWh annually, achieving a renewable energy supply proportion of 74.7% for this grid-connected system. Annually, the system feeds 112,393 kWh of electricity into the grid while consuming 139,220 kWh from the grid. The initial investment cost and annual operation and maintenance cost of the system are 1.38399 million CNY and 456,755 CNY/year, respectively. The results of the software optimisation are shown in Fig. 13 below. The cash flow of each component of the system is detailed in Table 8.

Figure 13: Optimisation results of the grid-connected wind energy storage system. (a) Results of capacity configuration optimization; (b) Power output of each component

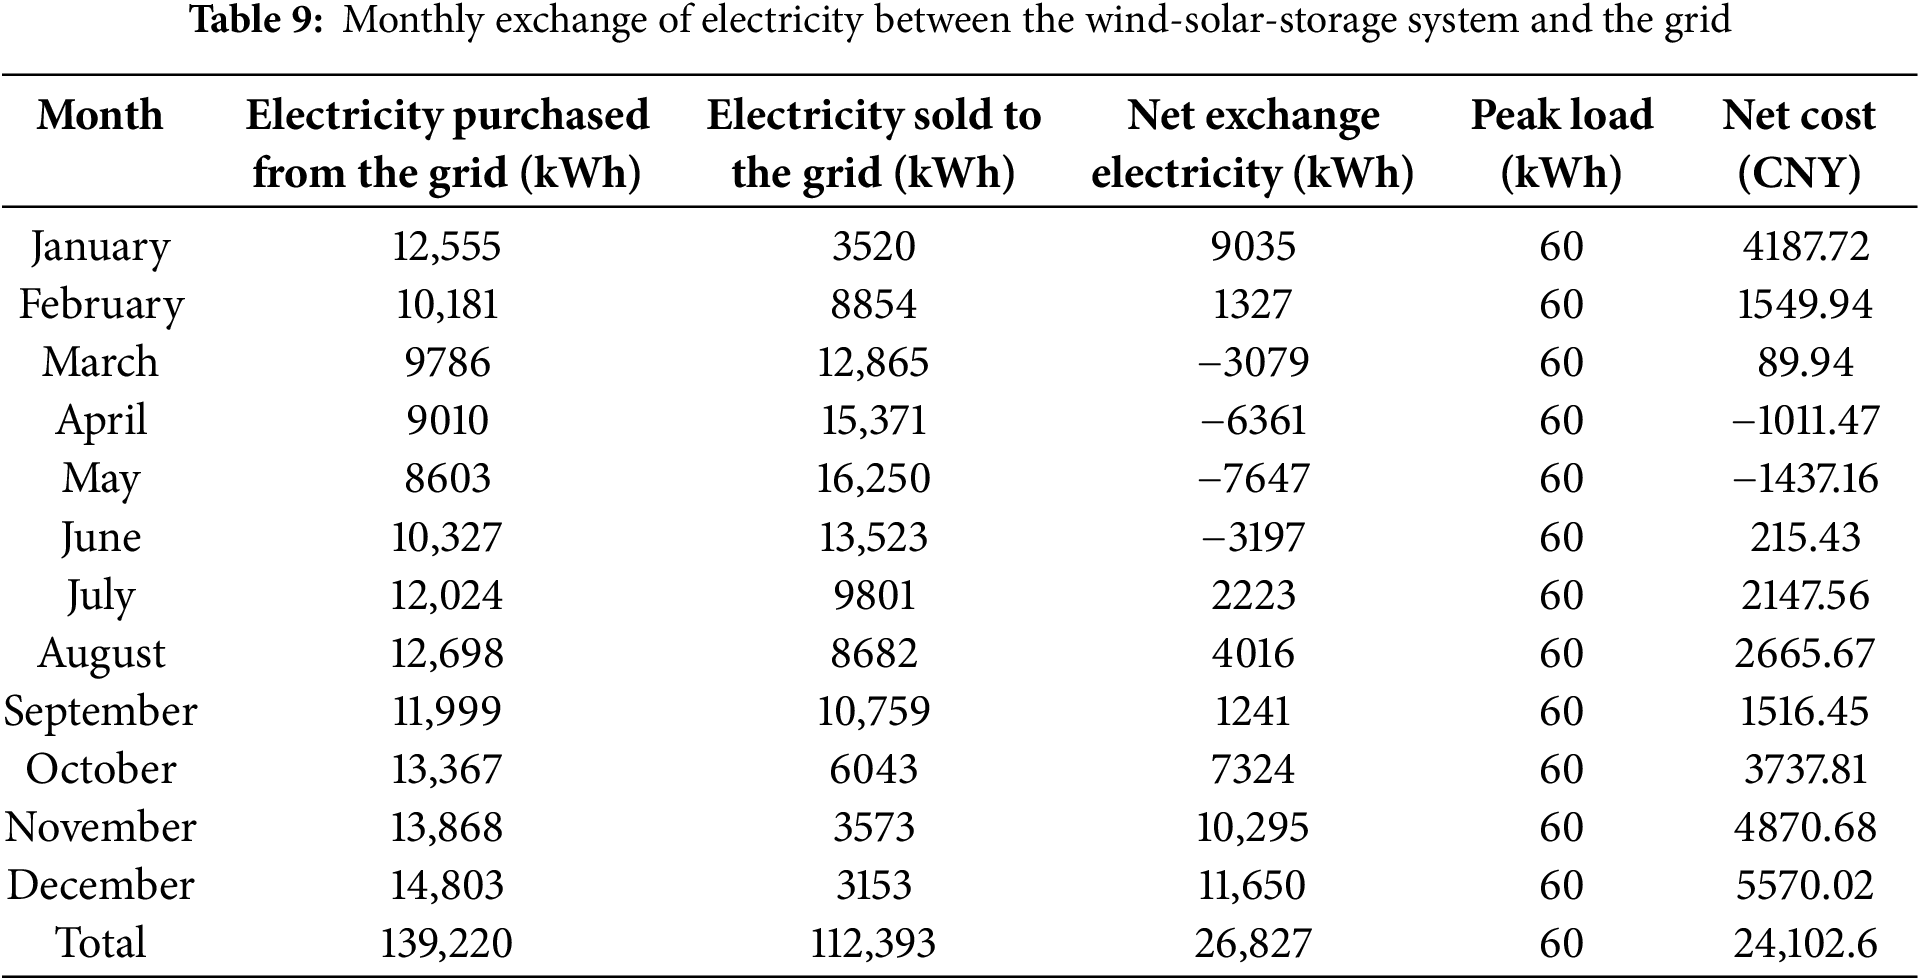
Through this configuration, the total electricity demand is met without any surplus or unmet power load. Ultimately, the system generates 115.831 t of carbon dioxide annually, a 68.9% reduction compared to the pure grid system. Table 9 shows the monthly electricity exchange of the system, with the net exchange electricity being the difference between the electricity purchased from the grid and the electricity sold back to the grid at the prices shown in Table 4.
(3) Grid (Selling Electricity), Wind Turbine, Photovoltaic Panel, and Battery
In this configuration, the distributed power generation system is connected to the grid, and the power supply of the region entirely relies on wind and solar energy, with a renewable energy supply proportion of 100%. Any excess electricity is fed back into the grid without the need to purchase electricity from the grid. To maximize the utilization of solar photovoltaic and wind power generation and address the inherent intermittency of renewable energy, the configuration includes an energy storage system. The wind turbine is directly connected to the AC bus network, and the photovoltaic array and battery are integrated into the DC bus system. By adding a converter to transform the DC bus electricity into AC and introducing batteries as energy storage devices, this helps prevent system instability issues caused by a high proportion of renewable energy.
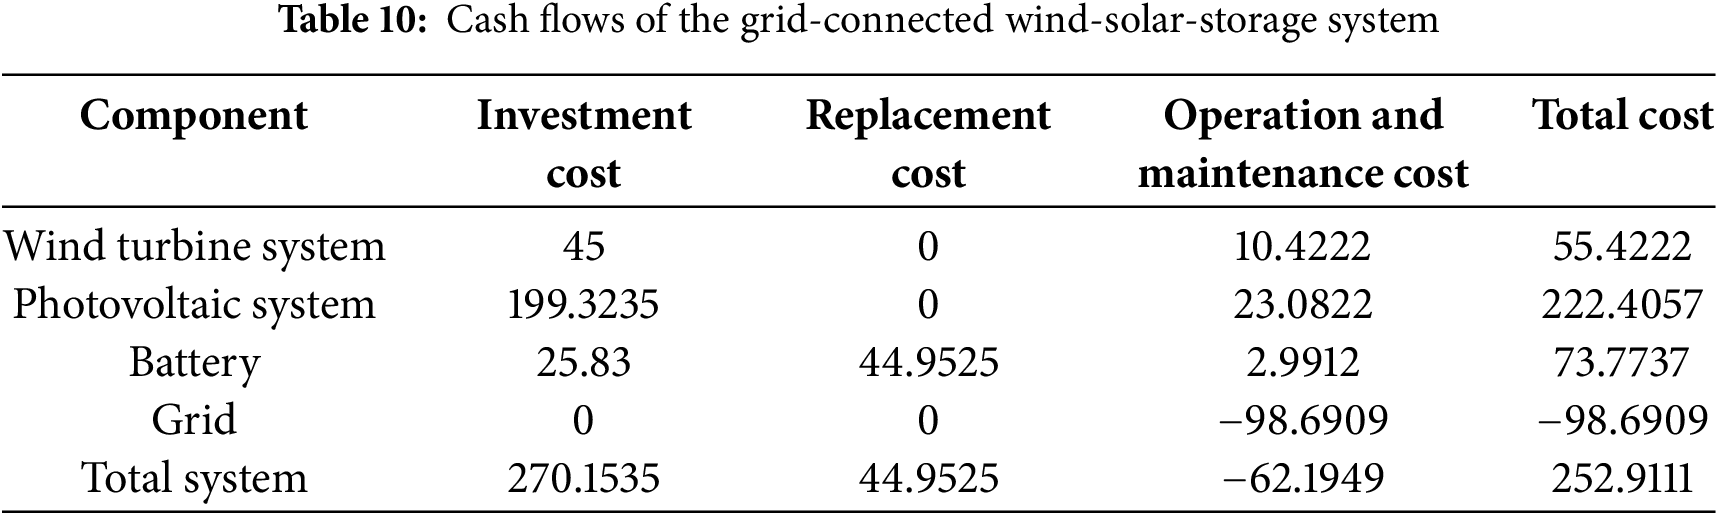
The HOMER-optimized grid-connected (selling electricity) wind-solar-storage system configuration includes 498 kW photovoltaic panels, 150 kW wind turbines, and 246 sets of 12 V·200 Ah batteries. The NPC of this system is 2.529111 million CNY, the annualized total cost is 218,398 CNY, and the COE is 0.309 CNY/kWh. The initial investment capital is 2.70153 million CNY, and the operation and maintenance cost is −621,949 CNY, meaning the revenue from selling electricity to the grid exceeds the operation and maintenance cost of the wind-solar-storage system. The results of the optimisation are shown in Fig. 14 below. The cash flow of each component of the system is detailed in Table 10.
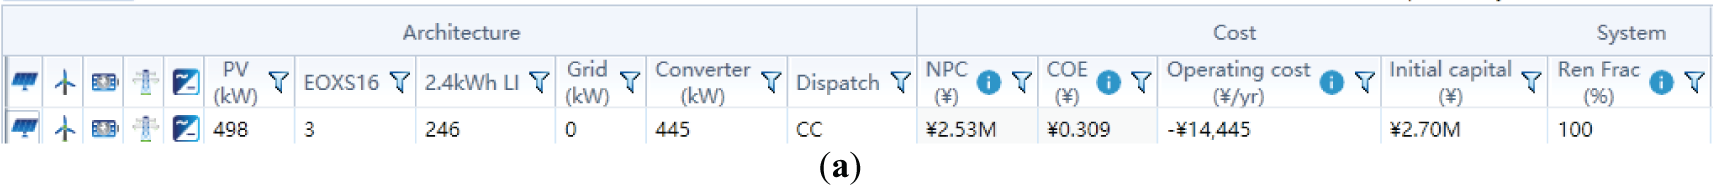

Figure 14: Optimisation results for grid-connected (selling electricity) wind-solar-storage system. (a) Results of capacity configuration optimization; (b) System and component costs; (c) Power output of each component
The wind turbine generates 93,399 kWh of electricity annually, the solar photovoltaic panels generate 700,535 kWh annually, and the battery’s annual energy input is 133,964 kWh, with the battery outputting 120,736 kWh of energy. The system’s total annual electricity generation is 793,934 kWh, of which 277,269 kWh is sold to the grid. Ultimately, the system achieves 100% renewable energy supply with no greenhouse gas emissions and carbon dioxide emissions.
(4) Wind Turbine, Photovoltaic Panel, and Battery
In this scenario, the off-grid system structure diagram is shown in Fig. 15.

Figure 15: Schematic diagram of off-grid system structure
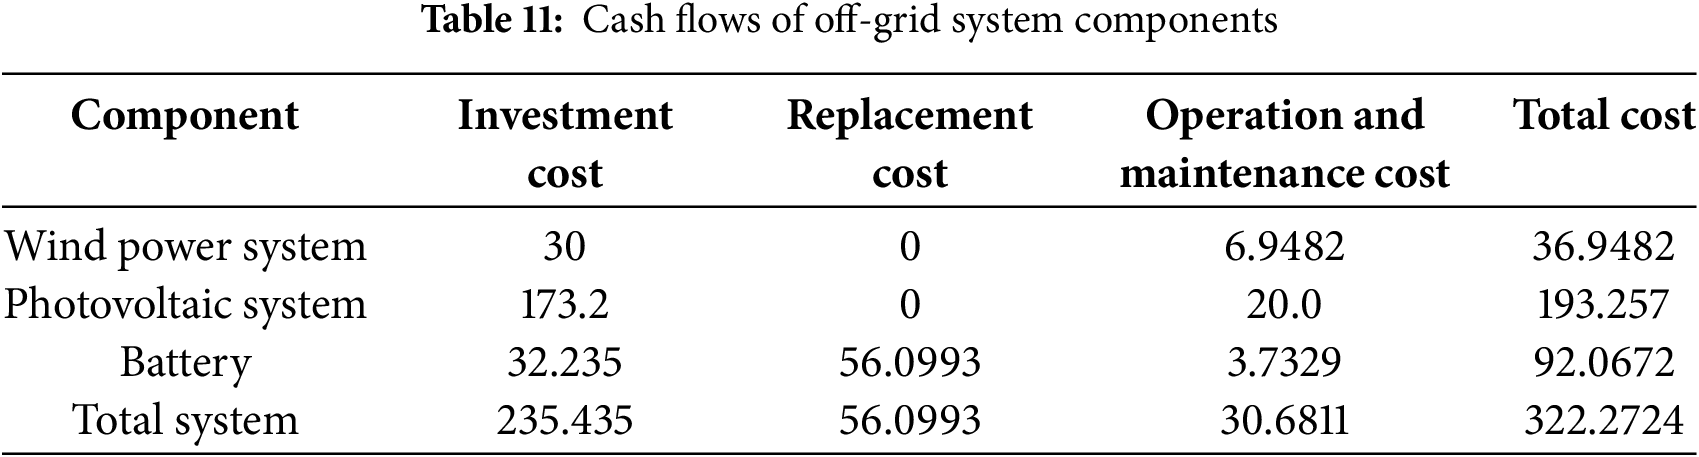
This system entirely relies on renewable energy (wind and solar) to meet all electricity demands, with surplus electricity being stored in batteries. The optimized system includes a 60 kW wind turbine, 433 kW photovoltaic panels, and 307 sets of 12 V·200 Ah batteries. Under this configuration, the NPC is 3.222724 million CNY, the annualized total cost is 278,294 CNY, and the COE is 0.646 CNY. The initial investment cost is 2.35435 million CNY, and the operation and maintenance cost is 307,381 CNY. The results of the software optimisation are shown in Fig. 16 below. The cash flow of each component of the system is detailed in Table 11. The system’s total annual electricity generation is 647,346 kWh/year, with the wind turbine generating 62,266 kWh/year and the solar photovoltaic panels generating 585,079 kWh/year. During operation, after charging the batteries, there is still a surplus of 158,479 kWh/year, which will be wasted.
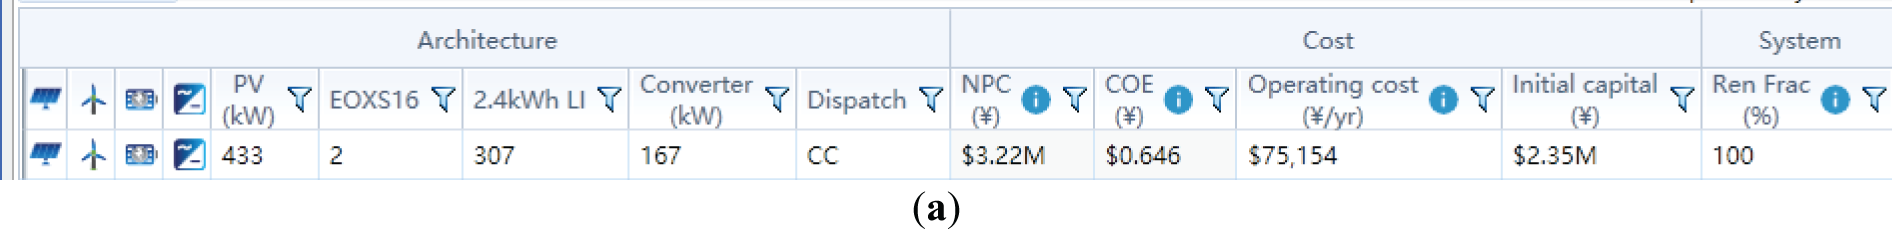
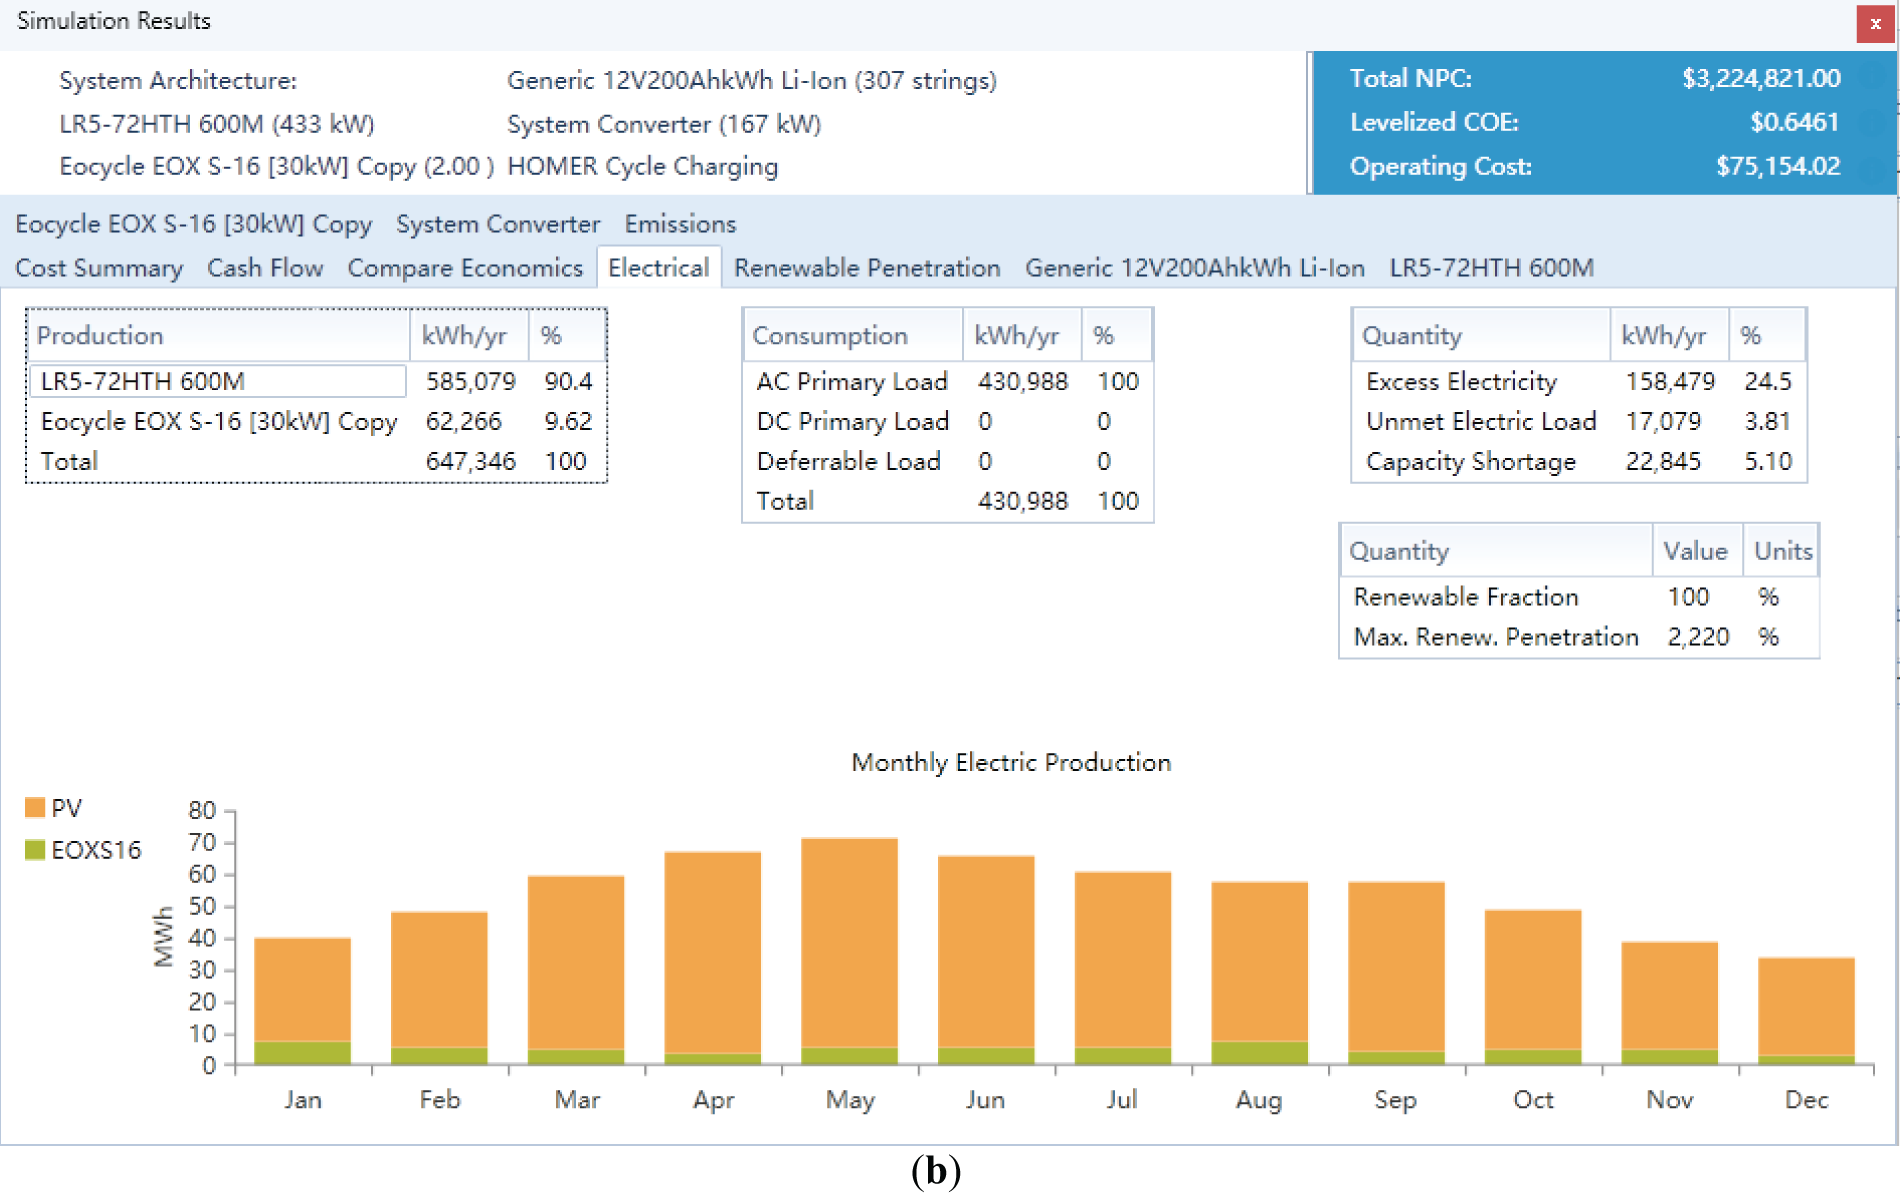
Figure 16: Optimisation results of off-grid wind energy storage system. (a) Results of capacity configuration optimization; (b) Power output of each component
5.2 Simulation Scenario Comparison
In response to the configuration optimization of different scenarios in the previous section, this section compares different plans from various perspectives. Table 12 shows the optimal capacity configurations of the four simulation scenarios in HOMER.
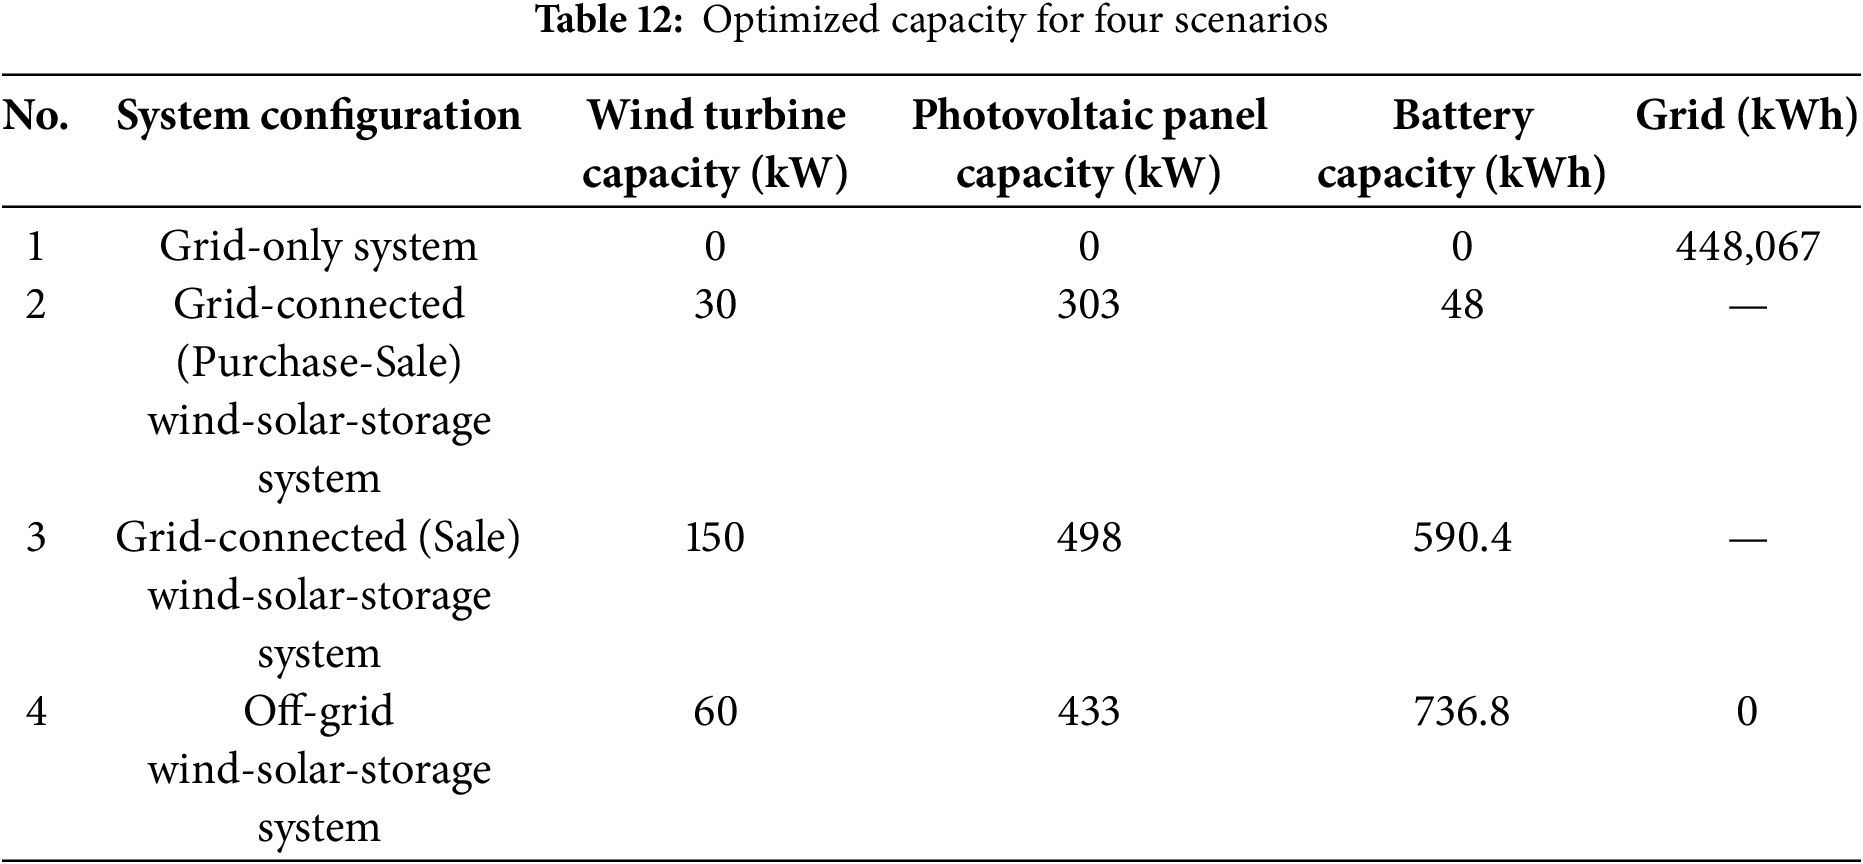
Table 13 presents the economic data of the four simulation scenarios under the optimal capacity configurations, arranged in ascending order of NPC and COE. The off-grid wind-solar-storage system has relatively higher system costs and LCOE compared to other systems. Although in this case, the share of renewable energy reaches 100%, with all electricity supplied by wind turbines and photovoltaic panels, resulting in no emission of pollutants, the system operates independently without exchanging power with the grid. Therefore, when wind and solar power generation cannot meet load demand, the system must rely entirely on battery storage for load supply. Given that constraint conditions were set before optimization (Section 3.7), a power shortage rate of 5% was specified, meaning only 5% of annual load demand can be unmet. Consequently, during optimization, if the total power generated by the wind-solar-storage system is insufficient for load requirements, the system will increase the number of power sources, thereby raising system costs to ensure stable power supply. As shown in Table 12, the off-grid wind-solar-storage system has the largest battery capacity. For the grid-connected (Sale) wind-solar-storage system, excess electricity is sold back to the grid, reducing waste of generated power. In this scenario, the optimization process fully utilizes local renewable energy resources for power generation, and the energy storage system is also efficiently used. Beyond supplying its own needs, surplus electricity is sold to generate additional revenue. Thus, compared to other systems, the grid-connected (Sale) wind-solar-storage system has higher capacities for wind turbines and PV panels. However, because all components’ energy can be fully utilized, the system’s cost is significantly lower than that of the off-grid wind-solar-storage system. Throughout the project lifecycle, the grid-connected (purchase-sale electricity) wind-solar-storage system outperforms other configurations in meeting load demands, with the lowest NPC and COE. In contrast, the standalone off-grid wind-solar-storage power generation system has relatively higher NPC and COE values. The grid-connected (sale electricity) wind-solar-storage system and the off-grid wind-solar-storage system are relatively more environmentally friendly among these four systems, with 100% of load demands provided by renewable energy.

Additionally, since the system includes wind power generation and photovoltaic power generation, it increases the utilization of wind and solar resources, effectively achieving energy cost savings and reducing multiple types of pollutant emissions. The pollutant emission scenarios for the four cases are shown in Table 14 below.
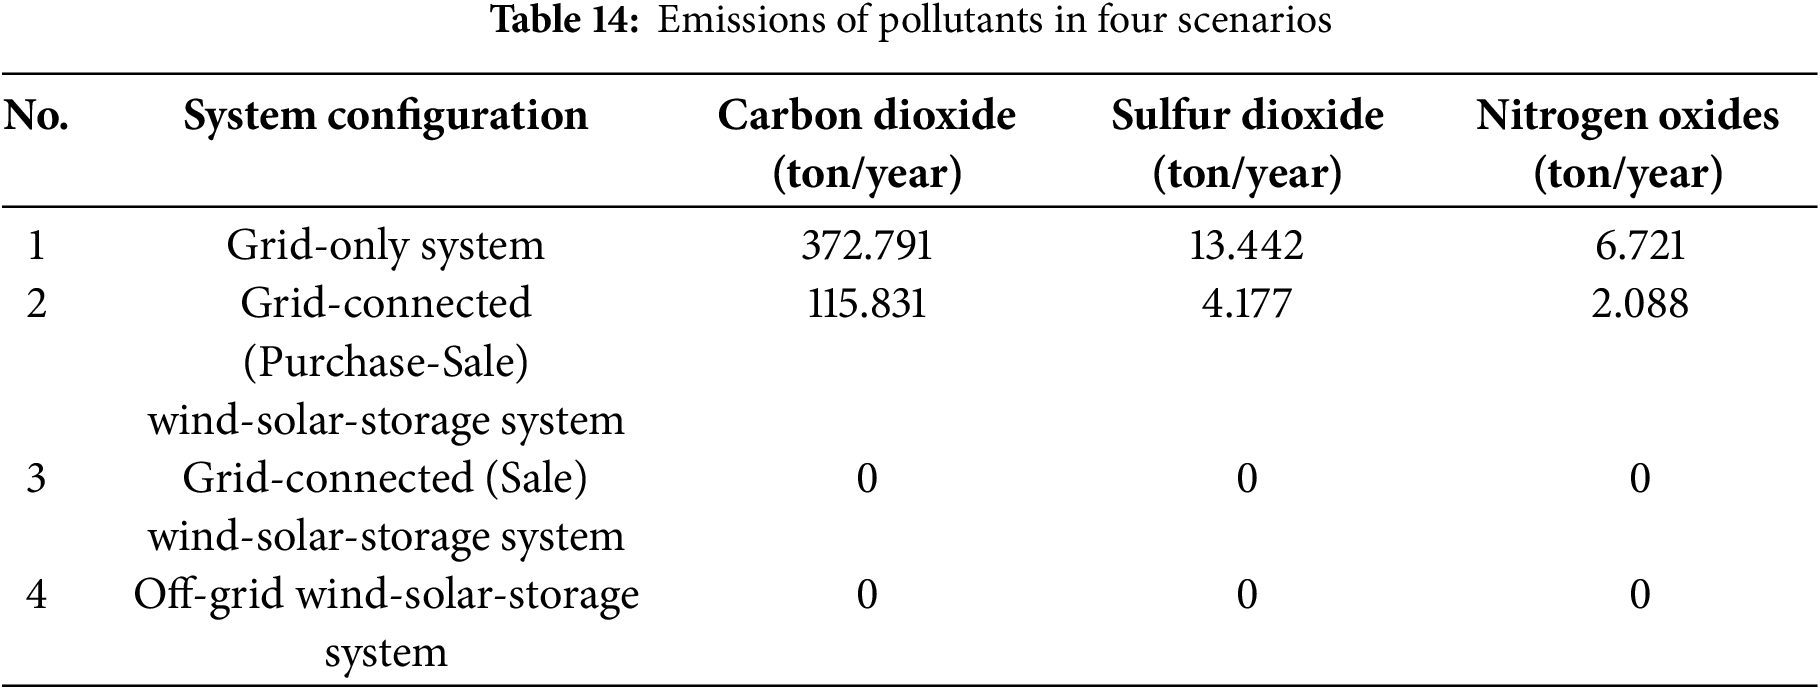
This paper studies and constructs grid-connected (Purchase-Sale) wind-solar-storage systems, grid-connected (sell-only) wind-solar-storage systems, and off-grid wind-solar-storage systems compared to a single grid-only power supply system. The annual CO2 emissions (tons/year) for these systems are 115.831, 0, and 0, respectively; SO2 emissions (tons/year) are 4.177, 0, and 0, respectively; and NOx emissions (tons/year) are 2.088, 0, and 0, respectively. In contrast, the grid-only power supply system has annual CO2 emissions of 372.791 t, SO2 emissions of 13.442 t, and NOx emissions of 6.721 t. By incorporating renewable energy generation systems into the energy framework, greenhouse gas emissions can be effectively reduced. Constructing hybrid energy systems significantly lowers CO2 and other pollutant emissions.
Specifically, the grid-connected (Purchase-sell) wind-solar-storage system reduced CO2 emissions by 68.9% compared to the grid-only system. Both the grid-connected (sell-only) and off-grid wind-solar-storage systems, which rely on wind and solar power for electricity generation, significantly increased the proportion of renewable energy in the system. This not only promotes the implementation of energy conservation and emission reduction strategies but also plays a crucial role in environmental protection. The findings highlight the importance of integrating renewable energy sources into the power supply mix to mitigate climate change impacts and support sustainable development. The deployment of such hybrid systems is essential for reducing reliance on fossil fuels and achieving long-term environmental sustainability.
5.3 System Sensitivity Analysis
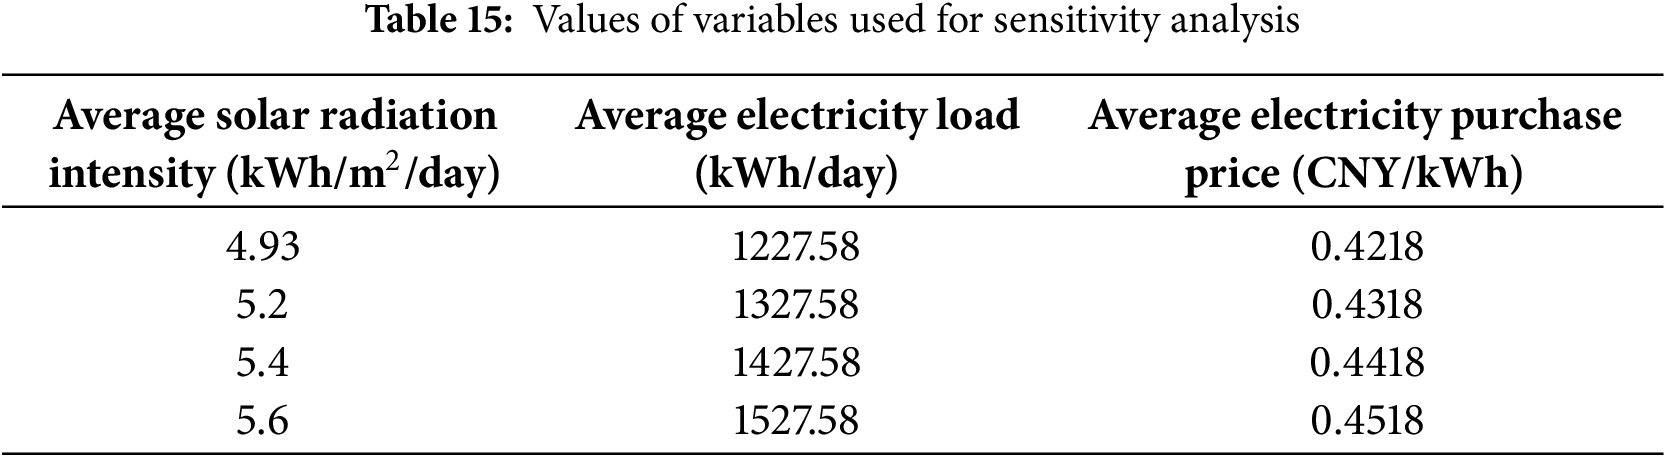
Sensitivity analysis helps to better understand the impact of variables used in the model on system performance, including solar radiation intensity, wind speed, and grid electricity prices. The power generation components in the systems constructed in this paper include wind turbines and PV panels. Due to the high randomness, volatility, and uncertainty of wind and solar power generation, which are influenced by various factors, PV panels generate electricity by receiving solar radiation. When solar irradiance changes, the amount of electricity generated by the PV panels also varies. Similarly, wind turbines convert wind energy into mechanical energy, and when wind speeds change, the power output from wind turbines fluctuates. Additionally, although this paper uses a year’s worth of regional load data for system construction and optimization, daily load variations can occur, with some days experiencing significant deviations from the average load. Furthermore, grid electricity prices are set by operators and may fluctuate within a certain range due to various influencing factors. Solar irradiance, wind speed, and grid electricity prices are all uncertain factors in the system that can significantly impact the system’s stability and economic performance. It is important to note that sensitivity analysis is not only used to deal with uncertainty factors but also to assess the impact of various variables on optimization objectives. In this paper, considering that the grid-connected (purchase-sale electricity) distributed wind-solar-storage system configuration is optimal among the simulated scenarios, sensitivity analysis is conducted. This analysis covers multiple variables, including average solar radiation intensity, electricity prices, and load. Table 15 details the variables used for sensitivity analysis and their values.
(1) Impact of Solar Radiation Intensity Variation
The average solar radiation intensity in the region is about 4.93 kWh/m2/day, with the variable ranging from 4.93 to 5.6 kWh/m2/day. The impact of this variation on the renewable energy supply proportion and net present value cost was studied, with the results shown in Fig. 17. It was observed that the total net present value cost varied from 1.877 million to 1.733 million CNY, the COE varied from 0.295 CNY to 0.27 CNY, and the renewable energy proportion remained between 74.7% and 74.9%. When the regional average solar irradiance increased from 4.93 to 5.4, the optimization results showed that the NPC and COE decreased, while the Renewable Energy Fraction (REF) remained unchanged. In this scenario, the originally installed PV panels were previously limited by the lower radiation intensity and did not reach their maximum efficiency. Therefore, when solar irradiance increased, the electricity generation from the existing PV panels improved, leading to an increase in system output without adding more PV capacity. Consequently, NPC and COE were effectively reduced. When the average solar irradiance further increased from 5.4 to 5.6, the software considered increasing the installed capacity of PV panels during optimization to reduce system costs. Additionally, as the optimization process increased the PV capacity, the share of renewable energy in the system was also enhanced.

Figure 17: Effect of solar radiation intensity on NPC, COE and REF
(2) Impact of Load Variation
By analyzing the obtained load data, the average load demand in the region is 1227.58 kWh/day. To accommodate fluctuations in supermarket demand, the annual average load varies from 1227.58 to 1527.58 kWh/day. The impact of this variable on NPC and COE was studied, with the results shown in Fig. 18. It can be seen from the figure that as the load increases, the NPC rises from 1.877 million to 2.334 million CNY. Additionally, the COE fluctuates between 0.295 and 0.313 CNY, and the renewable energy generation proportion decreases from 74.7% to 70%. When the average load continuously increases, the software optimization adopts strategies such as increasing the capacity of system components or purchasing more electricity from the grid to meet the increased load demand. Consequently, both the NPC and the COE of the system further increase.

Figure 18: Effect of average load variation on NPC, COE and REF
(3) Impact of Electricity Price
In this paper, the average value of electricity purchase price is considered to vary from 0.4218 to 0.4518 CNY. The impact of this variation on the total NPC and COE was studied, with the effects shown in Fig. 19. It was observed that the NPC increased from 1.877 million to 1.929 million CNY, while the COE increased from 0.295 to 0.299 CNY, and the renewable energy generation proportion increased from 74.7% to 75.5%, indicating that the rise in electricity prices significantly affects the economic viability of the system. When the electricity purchase price increases, the cost of purchasing electricity from the grid also increases. During system optimization, there is a tendency to use a higher proportion of renewable energy. The COE fluctuates with changes in the electricity purchase price, while the NPC increases steadily as the electricity purchase price rises. Therefore, when users consider system costs in response to changes in electricity prices, they typically find that system costs increase further as electricity prices rise.

Figure 19: Impact of changes in electricity prices on NPCs and COEs
This paper conducts a feasibility analysis and economic evaluation of multi-energy complementary systems, utilizing the HOMER platform to model and simulate four scenarios. The optimized grid-connected (purchase-sale electricity) distributed wind-solar-storage system reduces NPC and COE by 14% and 30% compared to the pure grid system, respectively, and reduces greenhouse gas carbon dioxide emissions by 68.9% compared to the pure grid system. Through the construction and analysis of hybrid energy systems, this study compared these systems with a single grid-only power supply system using the HOMER platform to simulate the entire project lifecycle. The findings revealed that hybrid energy systems can effectively reduce electricity costs for regional users. A lower NPC indicates that hybrid energy systems possess significant investment and utilization value, enabling effective cost recovery and achieving substantial economic returns over their entire lifecycle. A lower COE implies that the system can achieve reduced electricity supply costs, allowing users to meet their power load demands at a lower price compared to relying solely on grid-supplied electricity. Furthermore, the introduction of wind turbines and PV panels as power sources significantly decreased greenhouse gas emissions. The proportion of renewable energy utilization was notably increased, thereby substantially reducing the environmental impact of the power supply system. This approach not only promotes sustainable development but also supports global efforts to mitigate climate change by minimizing reliance on fossil fuels. The results highlight the advantages of hybrid energy systems in terms of both economic efficiency and environmental sustainability, demonstrating their potential to serve as a viable alternative to traditional grid-only power supply systems.
The paper also provides sensitivity analyses of solar radiation intensity, electrical load, and electricity purchase price, Sensitivity analysis results show that a 13.6% increase in solar radiation intensity reduces the total NPC from 1.877 million to 1.733 million CNY, and the renewable energy proportion increases by 0.2%; meanwhile, the variation of electricity load from 1227.58 to 1527.58 kWh/day increases the total net present value cost and cost of electricity; an increase in the electricity purchase price leads to an increase in the renewable energy supply proportion, and the total net present value cost and cost of electricity also increase. The results of the sensitivity analysis show that when the solar irradiance resources at the system construction site are favorable, the performance of the PV power generation system can be more effectively utilized. Similarly, when the regional electricity load increases from its original level, the power supply cost of the system will further increase. Additionally, electricity prices are a significant factor affecting system costs, and as electricity prices rise, so do system costs. Users should fully consider the impact of changes in uncertain factors within the system when constructing multi-energy complementary systems. Sensitivity analysis should be used to further validate the stability and cost of the system.
HOMER often uses cost minimization as the sole objective function, with limited economic indicators, which is not conducive for investors to fully understand the economic value of the system. In the future, more detailed analyses and determination of evaluation metrics for system economics and reliability should be conducted. For instance, studying investment costs, annualized costs, capital recovery factor (CRF), levelized cost of energy (LCOE), net present value (NPV), internal rate of return (IRR), and other metrics [35]. Consideration should also be given to cost recovery mechanisms and risk mitigation capabilities of the system. Through comprehensive economic and environmental impact assessments, investor confidence can be further enhanced. Additionally, the software has limited constraint settings, which, while ensuring overall power supply reliability, does not adequately address personalized user requirements, such as setting specific time-of-day power supply and fine-tuned operational control strategies between systems. This can result in oversized optimization configurations, leading to higher rates of energy waste. Future studies could consider using the MATLAB link feature in the software to write custom dispatch algorithms for HOMER Pro using MATLAB. By connecting HOMER with MATLAB software and running MATLAB functions during simulations, more refined results can be obtained using personalized system dispatch strategies.
In recent years, intelligent optimization algorithms have been widely applied and studied, demonstrating good multi-objective solving capabilities. Many researchers use programming to model and solve hybrid energy systems, offering advantages in controllability. These algorithms can delve into the redundancy rate and self-balancing rate of system configurations and adjust operating strategies according to needs, adding evaluation metrics and constraints. The programs are easy to modify and provide higher accuracy, capable of optimizing more than three objective functions, making them more flexible compared to the HOMER platform. However, implementing intelligent optimization algorithms through programming involves higher complexity, and obtaining diverse configuration solutions typically requires repeated program execution, leading to longer computation times. Future research could explore combining optimization algorithms with the HOMER platform to improve and customize the software’s optimization algorithms. By using user-designed optimization algorithms and programming, users can formulate diverse objective functions and constraints, as well as customize control strategies. By comparing the simulation results of both methods, the optimal system capacity can be effectively determined. Additionally, the optimization algorithm code can be linked with HOMER, preventing issues such as poor result rationality due to a single optimization approach or insufficient researcher experience. Based on the actual needs of researchers, appropriate methods can be chosen to flexibly optimize the capacity of distributed systems, resulting in more reliable and effective hybrid energy system capacity configurations.
Acknowledgement: Not applicable.
Funding Statement: This paper is supported in part by the Inner Mongolia Autonomous Region Science and Technology Project Fund (2021GG0336) and Inner Mongolia Natural Science Fund (2023ZD20).
Author Contributions: The authors acknowledge their contributions to this article as follows: study conception and design: Daixuan Zhou, Yan Jia; data collection: Zhichao Wang; literature search and organization: Kaile Xi; analyzing and interpreting the results: Daixuan Zhou, Chong Zuo, Yan Jia; manuscript writing: Daixuan Zhou, Chong Zuo. All authors reviewed the results and approved the final version of the manuscript.
Availability of Data and Materials: Not applicable.
Ethics Approval: Not applicable.
Conflicts of Interest: The authors declare no conflicts of interest to report regarding the present study.
References
1. Khezri R, Mahmoudi A. Review on the state-of-the-art multi-objective optimisation of hybrid standalone/grid-connected energy systems. IET Gener Transm Distrib. 2020;14(20):4285–300. doi:10.1049/iet-gtd.2020.0453. [Google Scholar] [CrossRef]
2. Khan T, Ullah Z, Agyekum EB, Hasanien HM, Yu M. Multi-objective optimization of combined heat and power system integrated with multi-energy storage systems for rural communities. J Energy Storage. 2024;99:113433. doi:10.1016/j.est.2024.113433. [Google Scholar] [CrossRef]
3. Tayyab Q, Qani NA, Elkholy MH, Ahmed S, Yona A, Senjyu T. Techno-economic configuration of an optimized resident microgrid: a case study for Afghanistan. Renew Energy. 2024;224(3):120097. doi:10.1016/j.renene.2024.120097. [Google Scholar] [CrossRef]
4. Pérez UDA, de León Aldaco SE, Aguayo AJ. Trends in hybrid renewable energy system (HRES) applications: a review. Energies. 2024;17(11):2578. doi:10.3390/en17112578. [Google Scholar] [CrossRef]
5. Liu Y, Zhang Z, Ma L, Jia Y, Yin W, Liu Z. Short-term prediction of photovoltaic power based on DBSCAN-SVM data cleaning and PSO-LSTM Model. Energy Eng. 2024;121(10):3019–35. doi:10.32604/ee.2024.052594. [Google Scholar] [CrossRef]
6. Zhou D, Liu Y, Wang X, Wang F, Jia Y. Research progress of photovoltaic power prediction technology based on artificial intelligence methods. Energy Eng. 2024;121(12):3573–616. doi:10.32604/ee.2024.055853. [Google Scholar] [CrossRef]
7. Odetoye OA, Olulope PK, Olanrewaju OM, Alimi AO, Igbinosa OG. Multi-year techno-economic assessment of proposed zero-emission hybrid community microgrid in Nigeria using HOMER. Heliyon. 2023;9(9):e19189. doi:10.1016/j.heliyon.2023.e19189. [Google Scholar] [PubMed] [CrossRef]
8. Budes FAB, Ochoa GV, Obregon LG, Manrique AA, Álvarez JRN. Energy, economic, and environmental evaluation of a proposed solar-wind power on-grid system using HOMER Pro®: a case study in Colombia. Energies. 2020;13(7):1662. doi:10.3390/en13071662. [Google Scholar] [CrossRef]
9. Jayasankar N, Sathia SCR, Paramasivam V, Santiago AEX, Muthusamy S, Tirugatla SK. Techno-economic feasibility analysis of an on-grid IOT-based rooftop solar photovoltaic system for prosumers with a real-time implementation: a detailed case study and analysis using HOMER software. Electr Eng. 2024;106(5):6615–35. doi:10.1007/s00202-024-02438-0. [Google Scholar] [CrossRef]
10. Jiang F, Xie H, Ellen O. Hybrid energy system with optimized storage for improvement of sustainability in a small town. Sustainability. 2018;10(6):2034. doi:10.3390/su10062034. [Google Scholar] [CrossRef]
11. Mokhtara C, Negrou B, Bouferrouk A, Yao Y, Settou N, Ramadan M. Integrated supply-demand energy management for optimal design of off-grid hybrid renewable energy systems for residential electrification in arid climates. Energy Convers Manag. 2020;221:113192. doi:10.1016/j.enconman.2020.113192. [Google Scholar] [CrossRef]
12. Aktas IS. Techno-economic feasibility analysis and optimisation of on/off-grid wind-biogas-CHP hybrid energy system for the electrification of university campus: a case study. Renew Energy. 2024;237:121792. doi:10.1016/j.renene.2024.121792. [Google Scholar] [CrossRef]
13. Wang K, Zhao Z, Liu H, Luo J. Optimal matching of wind-hydrogen storage system based on HOMER and SA-PSO algorithms. Hydropower Energy Sci. 2020;38(5):207–10. [Google Scholar]
14. Yu D, Zhang J, Wang X, Gao Y. Optimal capacity allocation of grid-connected wind-solar-storage complementary power generation system. J Power Syst Autom. 2019;31(10):59–65. [Google Scholar]
15. Kahwash F, Maheri A, Mahkamov K. Integration and optimisation of high-penetration Hybrid Renewable Energy Systems for fulfilling electrical and thermal demand for off-grid communities. Energy Convers Manag. 2021;236(4):114035. doi:10.1016/j.enconman.2021.114035. [Google Scholar] [CrossRef]
16. Hoarcă IC, Bizon N, orlei IS, Thounthong P. Sizing design for a hybrid renewable power system using HOMER and iHOGA simulators. Energies. 2023;16(4):1926. doi:10.3390/en16041926. [Google Scholar] [CrossRef]
17. Malanda C, Makokha AB, Nzila C, Zalengera C. Techno-economic optimization of hybrid renewable electrification systems for Malawi’s rural villages. Cogent Eng. 2021;8(1):1910112. doi:10.1080/23311916.2021.1910112. [Google Scholar] [CrossRef]
18. Iqbal R, Liu Y, Zeng Y, Zhang Q, Zeeshan M. Comparative study based on techno-economics analysis of different shipboard microgrid systems comprising PV/wind/fuel cell/battery/diesel generator with two battery technologies: a step toward green maritime transportation. Renew Energy. 2024;221:119670. doi:10.1016/j.renene.2023.119670. [Google Scholar] [CrossRef]
19. Al Garni HZ, Awasthi A, Ramli MA. Optimal design and analysis of grid-connected photovoltaic under different tracking systems using HOMER. Energy Convers Manag. 2018;155:42–57. doi:10.1016/j.enconman.2017.10.090. [Google Scholar] [CrossRef]
20. Francklyn L. Mountain microgrid: alternative power enterprises designs an off-grid ranch system with HOMER Pro. [cited 2025 Jan 9]. Available from: https://microgridnews.com/alternative-power-enterprises-designs-off-grid-ranch-system-with-homer-pro/. [Google Scholar]
21. Francklyn L. Santa Cruz solar company moves off the grid, using HOMER pro to design new microgrid. [cited 2025 Jan 9]. Available from: https://microgridnews.com/santa-cruz-solar-company-uses-homer-pro-to-design-new-microgrid/. [Google Scholar]
22. Francklyn L. Sigora microgrid provides affordable, 24/7 power to Haiti’s impoverished communities. [cited 2025 Jan 9]. Available from: https://microgridnews.com/sigora-microgrid-provides-affordable-24-7-power-haitis-impoverished-communities/. [Google Scholar]
23. Francklyn L. Nigerian minigrids improve power reliability and utility revenues for communities under the grid. [cited 2025 Jan 9]. Available from: https://microgridnews.com/powergen-minigrids-under-the-nigerian-grid/. [Google Scholar]
24. Dai Y, Liu F, Zeng Y. Optimised configuration study of regional integrated energy system based on hybrid energy supply of light, gas and electricity. Energy-Sav Technol. 2022;40(2):110–7. [Google Scholar]
25. Energy H. Homer energy, HOMER pro version 3.7 user manual. [cited 2025 Jan 5]. Available from: https://homerenergy.com/pdf/HOMERHelpManual.pdf. [Google Scholar]
26. Ramli MAM, Bouchekara HREH, Alghamdi AS. Optimal sizing of PV/wind/diesel hybrid microgrid system using multi-objective self-adaptive differential evolution algorithm. Renew Energy. 2018;121(3):400–11. doi:10.1016/j.renene.2018.01.058. [Google Scholar] [CrossRef]
27. China MoTotPsRo. China’s first ‘zero-carbon harbour’ completed in Weifang. [cited 2025 Jan 9]. Available from: https://www.mot.gov.cn/jiaotongyaowen/202410/t20241018_4157986.html. [Google Scholar]
28. Dou Z. Comprehensive energy system solutions and typical cases for industrial parks based on wind, light, storage and charging systems. [cited 2025 Jan 9]. Available from: https://max.book118.com/html/2024/0104/8114103062006023.shtm. [Google Scholar]
29. Tong YD, Huynh TDX, Khong TD. Understanding the role of informal sector for sustainable development of municipal solid waste management system: a case study in Vietnam. Waste Manag. 2021;124:118–27. doi:10.1016/j.wasman.2021.01.033. [Google Scholar] [PubMed] [CrossRef]
30. Liang YY, Liu LL, He KB, Huang F, Gómez M, Li JH. Analysis of key metal supply in China’s new energy industry under the ‘dual-carbon’ target. Chin Acad Eng Sci. 2024;26(3):131–41. doi:10.15302/J-SSCAE-2024.03.018. [Google Scholar] [CrossRef]
31. Luo JH, Chen L, Cai GT, Bai HJ. Forecasting end-of-life and recyclable resource potential of household photovoltaic in China under the perspective of spatio-temporal heterogeneity. Environ Sci. 2024:1–29 (In Chinese). doi:10.13227/j.hjkx.202409310. [Google Scholar] [CrossRef]
32. Fishman T, Graedel TE. Impact of the establishment of US offshore wind power on neodymium flows. Nat Sustain. 2019;2(4):332–8. doi:10.1038/s41893-019-0252-z. [Google Scholar] [CrossRef]
33. Singh P, Pandit M, Srivastava L. Multi-objective optimal sizing of hybrid micro-grid system using an integrated intelligent technique. Energy. 2023;269(7):126756. doi:10.1016/j.energy.2023.126756. [Google Scholar] [CrossRef]
34. Zhao X, Wang Y, Liu C, Cai G, Ge W, Zhou J, et al. Low carbon scheduling method of electric power system considering energy-intensive load regulation of electrofused magnesium and wind powerfluctuation stabilization. Appl Energy. 2024;357:122573. doi:10.1016/j.apenergy.2023.122573. [Google Scholar] [CrossRef]
35. Zhang L, Chai J, Xin H, Zhao Z. Evaluating the comprehensive benefit of hybrid energysystem for ecological civilization construction inChina. J Clean Prod. 2021;278:123769. [Google Scholar]
Cite This Article
 Copyright © 2025 The Author(s). Published by Tech Science Press.
This work is licensed under a Creative Commons Attribution 4.0 International License , which permits unrestricted use, distribution, and reproduction in any medium, provided the original work is properly cited.
 Downloads
 Citation Tools