
 Submit a Paper
 Propose a Special lssue
 Open Access
ARTICLE

Application of a Regional Data Set of the Housing Sector for Hydrogen Storage-Supported Energy System Planning
1 Department of Engineering and Communication (IWK), Institute for Technology, Resource and Energy-efficient Engineering (TREE), Hochschule Bonn-Rhein-Sieg, University of Applied Science, Sankt Augustin, 53757, Germany
2 International Centre for Sustainable Development (IZNE), Hochschule Bonn-Rhein-Sieg, University of Applied Science, Sankt Augustin, 53757, Germany
3 Fraunhofer Institute for Algorithms and Scientific Computing SCAI, Schloss Birlinghoven, Sankt Augustin, 53754, Germany
* Corresponding Author: Steffen Schedler. Email: .h-brs
(This article belongs to the Special Issue: Selected Papers from the SDEWES 2024 Conference on Sustainable Development of Energy, Water and Environment Systems)
Energy Engineering 2025, 122(5), 1755-1770. https://doi.org/10.32604/ee.2025.061962
Received 06 December 2024; Accepted 10 March 2025; Issue published 25 April 2025
 View Full Text
 Download PDF
Abstract
Germany aims to achieve a national climate-neutral energy system by 2045. The residential sector still accounts for 29% of end energy consumption, with 74% attributed to the direct use of fossil fuels for heating and hot water. In order to reduce fossil energy use in the household sector, great efforts are being made to design new energy concepts that expand the use of renewable energies to supply electricity and heat. One possibility is to convert parts of the natural gas grid to a hydrogen-based gas grid to deliver and store energy for urban quarters of buildings, especially with older building stock where electrification of heat via heat pumps is difficult due to technical, acoustical, and economic reasons. A comprehensive dataset was generated by a bottom-up analysis with open governmental and statistical data to determine regional building types regarding energy demand, solar potential, and existing grid infrastructure. The buildings’ connections to the electricity, gas, and district heating networks are considered. From this, a representative sample dataset was chosen as input for a newly developed energy system model based on energy flow simulation. The model simulates the interaction of hydrogen generation (HG) (from excess solar energy by electrolysis), storage in a metal-hydride storage (MHS) tank, and hydrogen use in a connected fuel cell (FC), forming a local PVPtGtHP (Photovoltaic Power-to-Gas-to-Heat-and-Power) network. Next to the seasonal hydrogen storage path (HSP), a battery will complete the system to form a hybrid energy storage system (HESS). Paired with seasonal time series for PV power, electricity and heat demand, and a model for connection to grid infrastructure, the simulation of different hydrogen applications and MHS placements aims to analyze operating times and energy share of the systems’ equipment and existing infrastructure. The method to obtain the data set together with the simulation model presented can be used by energy planners for cities, communities, and building developers to analyze the potentials of a quarter or region and plan a transition towards a more energy-efficient and sustainable energy system.Keywords
Many studies try to find solutions for the sectoral energy transition in the world [1], Europe [2], and nationwide, including Germany [3]. A lot of them have already analyzed several sectors and their possible coupling, so-called energy exchange. As an upcoming non-fossil energy carrier across all sectors, hydrogen is favored by governmental and industrial decision-makers. Hydrogen as a gas has the advantage of carrying a reasonable amount of energy per kg, being storable, and being directly usable. The main disadvantages of hydrogen include its low density at normal conditions, its fast diffusion through some materials, and safety concerns [4]. Under normal conditions, hydrogen is a gas and can therefore, with manageable effort, be implemented and transported in existing natural gas pipelines. Hydrogen would then also be accessible for the residential sector and can offer an alternative and/or support for the necessary electrification of this sector. According to data from the German Federal Ministry for Economic Affairs and Climate Action (BMWK) [5], the residential sector still accounts for almost one-third of end energy consumption in Germany in 2022. Most of the primary resources are used to provide heating and hot water, with fossil fuels accounting for 70%–75%. To reduce the overall energy demand in the residential sector, solar home systems are being subsidized by the government, leading to an increase in local production of residential photovoltaic (PV) energy [6]. PV energy production depends on geographical location and weather conditions, whereas residential consumption depends on the occupants’ lifestyles and ambient temperature. As both PV energy production and residential energy consumption are not sufficiently aligned, the need for energy storage to improve local self-consumption increases. Hydrogen as an energy carrier is a viable option as a storage element [7] and can complement the commonly used battery storage bank for long-term storage across seasons. Surplus renewable electricity can be converted into hydrogen through the electrolysis of water by a hydrogen generator (HG). This so-called green hydrogen will play a significant role in the energy transition. Hydrogen can be fed into a converted gas grid (GG), which provides an additional infrastructure for storing and delivering energy on a seasonal scale. This can be used to provide energy to households connected to the gas grid. An existing gas grid will be the first choice for hydrogen storage, as no additional infrastructure is needed. Without a gas grid, compact and safe metal-hydride storage (MHS) systems will be an option for long-term hydrogen storage. Some metals and alloys can absorb hydrogen atoms and embed them in the metal lattice; together they form a stable metal hydride. In this state, a significant amount of hydrogen can be stored in a relatively small volume at moderate pressures and low temperatures [8]. Residential hydrogen storage systems are still a subject of ongoing research [9], with only a few projects [10], but their potential to safely store energy across seasons with very low energy losses is promising. When needed, hydrogen can be used for both electricity and heat production, depending on the local demand, which is influenced by the building type and the access to a near heat network or gas grid infrastructure. A dual storage system, including a short-term storage option such as batteries and a long-term stoage option such as hydrogen, has its challenges in sizing, building, and controlling [11]. These so-called hybrid energy storage systems (HESS) can help to raise the self-consumption of locally produced energy and take part in the energy transition.
For energy system planning, data-driven bottom-up approaches are commonly used, such as those presented in [12,13]. In [14], a citywide analysis of residential buildings was conducted to evaluate the potential of hydrogen gas production, use, and storage. Open-source data from GIS and CENSUS [15,16] for the exemplary city of Cologne, Germany, was used as an input for this classification procedure. Under the premises of three scenarios, the buildings were categorized and clustered by building type. For the main building types, a related data set was identified to describe the buildings’ energy behavior. These data sets can serve as input parameters for energy system models, e.g., in this case; investigating the interaction of a specific hydrogen storage path (HSP). The hydrogen generation from excess solar energy by electrolysis, storage in a MHS tank, and hydrogen consumption in a connected fuel cell (FC) together form a local PVPtGtHP (Photovoltaic Power-to-Gas-to-Heat-and-Power) network.
In general, the simulation of a HESS varies greatly in depth and complexity of its components and often depends on its intended use, such as performance testing [17], economic viability [18], economical optimal operation [19,20], for model predictive control strategies to optimize control on basis of predictive time series like weather forecast [21] or for input for a life-cycle analysis [22]. This work combines a detailed HESS simulation with a data set of energy parameters of the identified building types, with the future aim of estimating the potential of hydrogen storage in residential areas and their influence on existing energy grids.
Complex building energy systems need an advanced energy management system (EMS). These EMS handle multiple inputs and outputs for managing the energy supply and demand, as well as checking security parameters, ensuring a reliable and efficient energy supply. An EMS has an underlying control strategy that organizes the power flow. An overview of the basic classes of HESS energy management concepts can be found in [23], including deterministic, rule-based, and predictive approaches. Rule-based EMS concepts are reliable and easy to implement. A good example of such an HESS system with a control strategy based on the battery’s and hydrogen tank’s state-of-charge (SOC) is presented in [24]. In research, there are also rule-based approaches based on fuzzy rules [25], which become more complex with the number of inputs and outputs involved. More advanced control strategies use predictive methods to optimize the system with forecasted time series [26], for example with machine learning and AI [27].
The sizing of HESS is always dependent on the assumed time series and includes a range of power and energy levels [28] as optimal sizing of both storages is interdependent [29]. Optimal sizing of the components is therefore challenging, and in the future, we will utilize a metamodel approach currently in development [30].
In this paper, we show the basic implementation of an HESS in the simulation environment MEgy [31], as the first test for an extended application of dynamic simulation for different building types and scenarios. The assumptions for storage sizing and power levels of the HSP, along with a suitable control algorithm to handle power flow to all components, are explained in Section 2. These are generic to fulfill the criteria of different scenarios, building types, and time series. The first simulation results in Section 3 show the system’s behavior and the overall function of the building’s energy system. Section 4 discusses these results and provides an outlook for future work with this simulation model and the data set used.
To facilitate the simulation of the HESS, several data collections and pre-processing of data are used. An overview of the data flow is presented in Fig. 1. The outer left branches in the picture generate the so-called framework data set with the aim of determining a subset of typical local building types and their energy gain and use. The other branches include the data flow of time series creation, the adaptation of the model characteristics to laboratory measurements, and the design of the control algorithm.
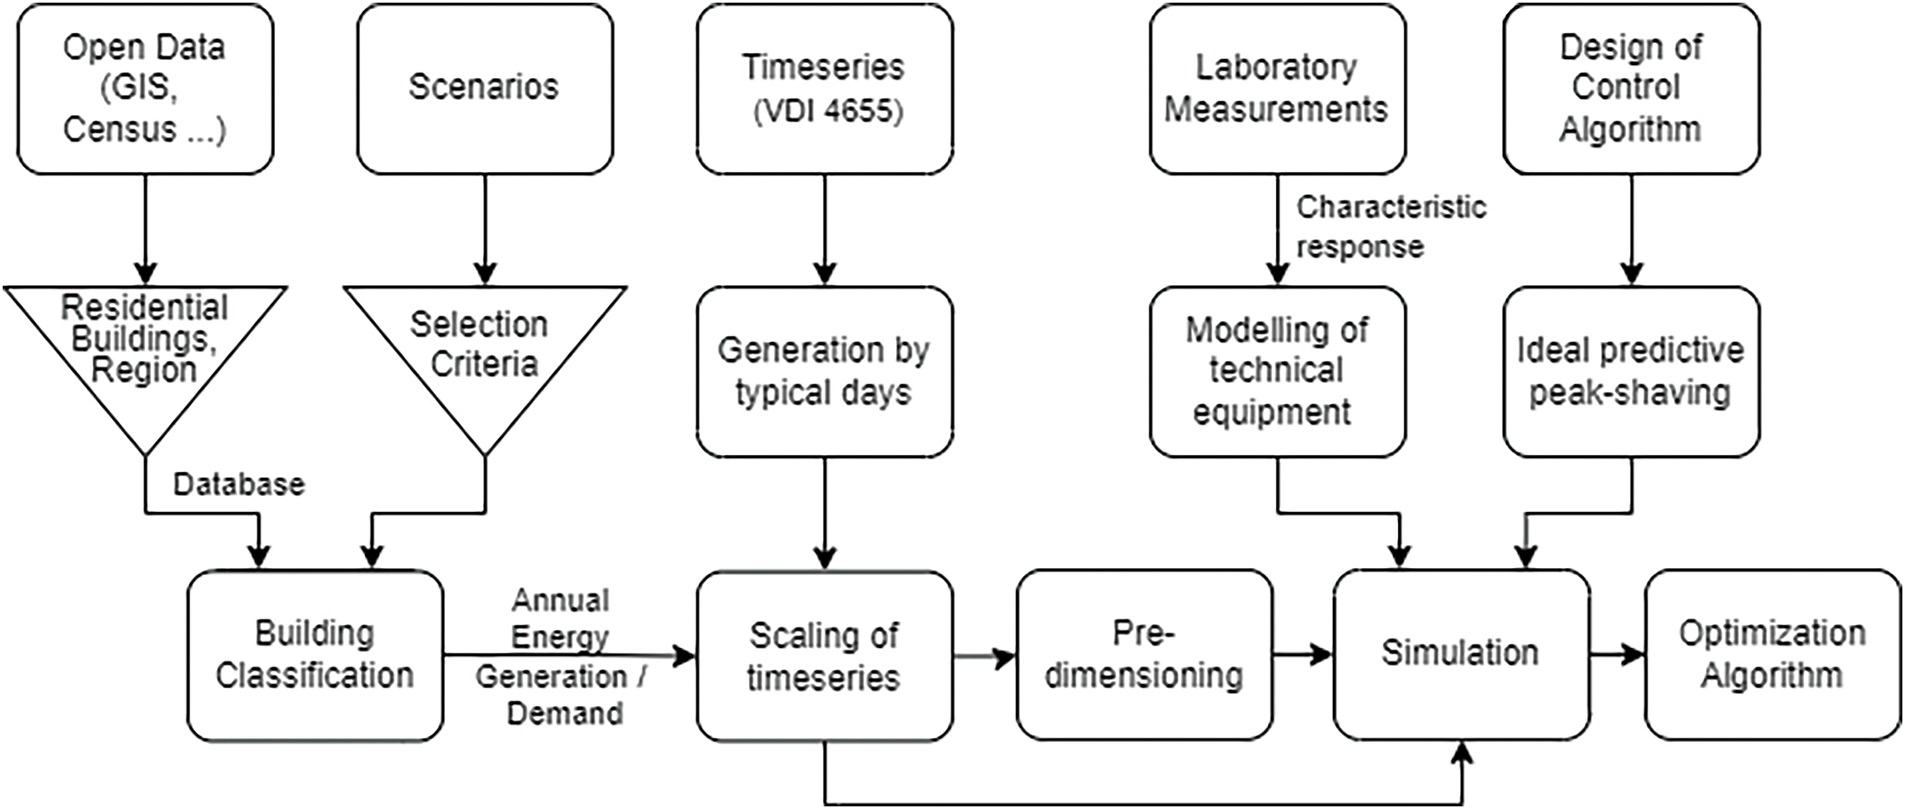
Figure 1: Data flow for simulation basis
The framework data set is generated by a method presented in [14]. In this method, several open data sources are combined to generate a comprehensive data set of building types and their energy needs for the Cologne city area. The buildings’ main characteristics are obtained from a federal GIS data set [15] to calculate the building’s living surface and from Census data [16] to estimate statistical occupation. From solar roof potential maps [32], the photovoltaic solar generation potential of the building’s roof surfaces is extracted. The building’s characteristic is further combined with its location and distance to a district heating network [33] or gas grid [34] to estimate the connectivity to these energy grids. All buildings connected to each grid are then assigned to predefined building types [35]. The building types are Single Family House (SFH), Double Family House (DFH), Apartment Building (AB), Big Apartment Building (BAB), and Living Quarter (LQ). The energy needs for each building are then calculated according to its estimated living surface, the assumed number of residents, the construction year, and neighboring buildings.
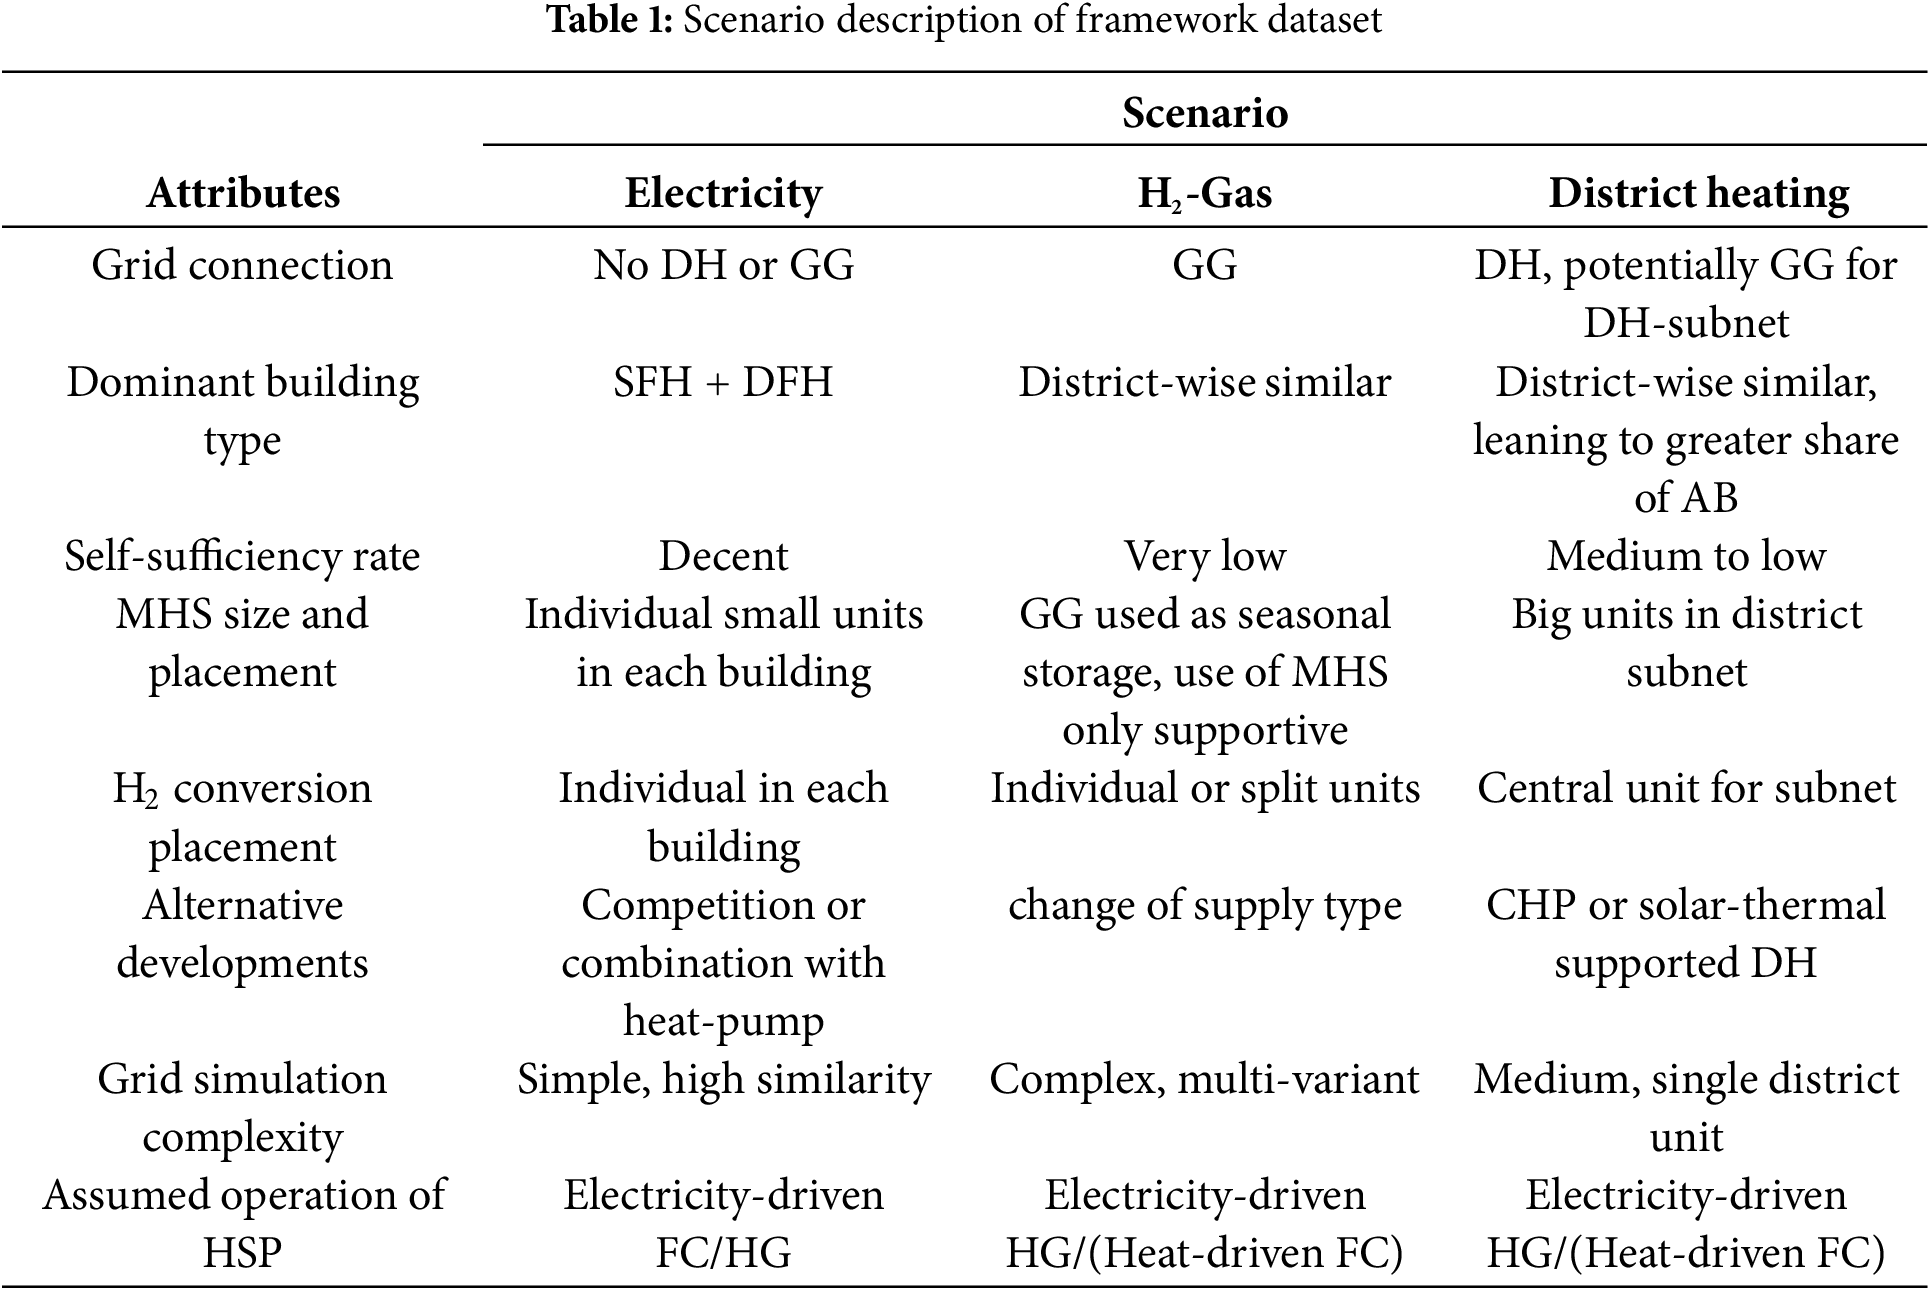
The buildings are categorized and distinguished in three framework scenarios. The main difference is the building’s energy network connectivity; therefore, the scenarios are named ‘Electricity’, ‘H2 Gas Grid’, and ‘District Heating’ (DH). A description with attached assumptions for each scenario is displayed in Table 1. It is assumed that an urban building is connected only to the electricity grid or to the electricity grid and the GG or a DH network. In Germany, the connectivity rate of buildings to the electricity grid is close to 100%. However, DH networks are limited in expansion and concentrated in the city centers due to their installation cost and effort. The GG usually is more widespread. In the case of Cologne, the GG reaches into almost every suburb. Buildings connected to the different grids will have different HESS configurations, especially taking into consideration the use of excess heat from the HG and the FC. Buildings connected to the DH can benefit from a centralized HSP using the DH to transport excess heat to the buildings. Buildings connected to the GG can use the grid itself as hydrogen storage, but the generation of hydrogen is likely to be centralized. The use of individual FC in the buildings, supporting the heating system, will allow heat recovery on cold days and support the electricity grid by reducing the power needs or feeding electricity into the grid. Buildings connected only to the electricity grid will have to implement the whole HSP and manage their seasonal energy storage to benefit by increasing their self-consumption.
The representative building for the simulation is chosen due to its representative state within the data set. For this, all buildings are evaluated according to their electrical annual self-sufficiency rate
In Fig. 2, the distribution of the self-sufficiency rate of each building type is shown in three box plot figures, one for each framework scenario. Buildings with a self-sufficiency rate outside the confidence interval of three standard deviations from the mean value, as well as without PV potential or recognized heating needs, are seen as outliers.
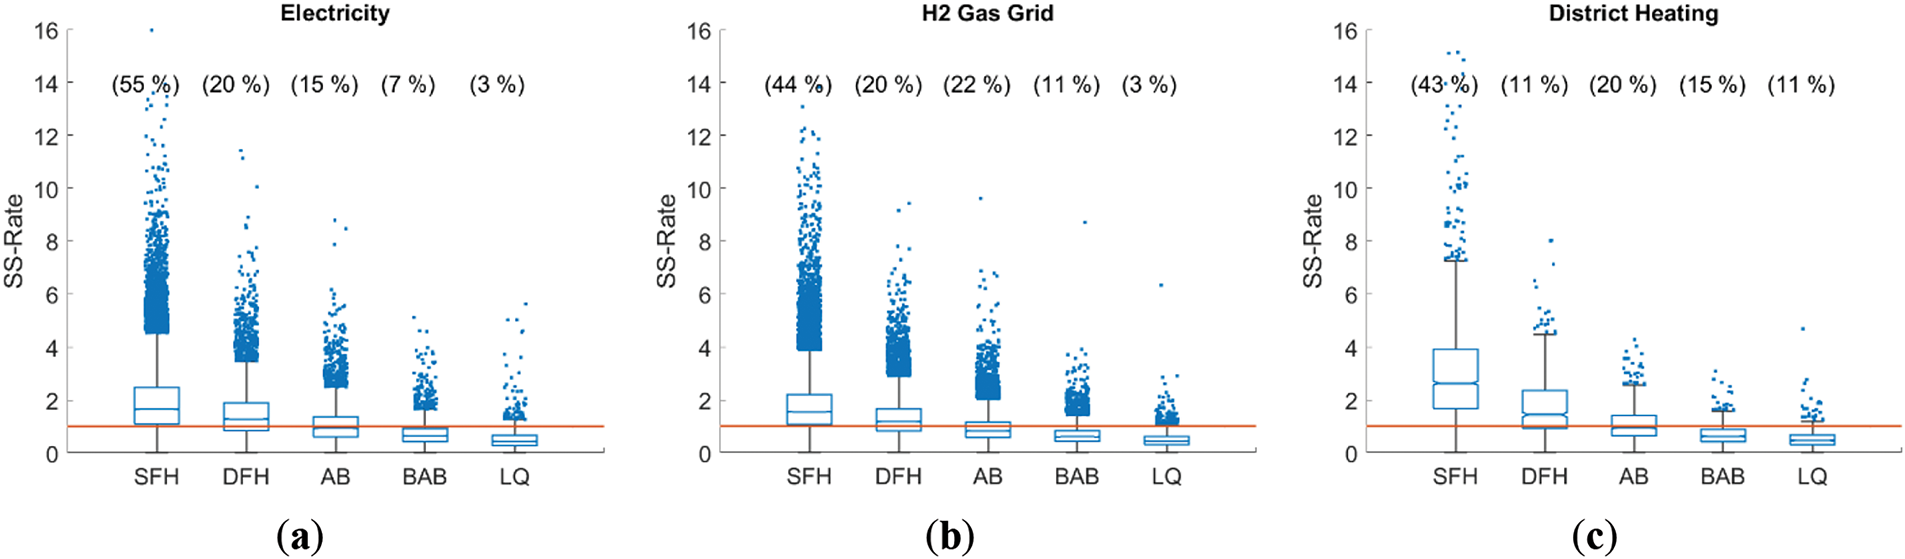
Figure 2: Distribution of annual self-sufficiency rate per building type in each scenario. Box plots of the scenarios from left to right: (a) Electricity, (b) H2 gas grid, (c) district heating. The box represents the data range of the inner quartile data point range, with the median as the middle line. The whiskers are set as three scaled median absolute deviations, with the outliers as point clouds, the red line indicates annual self-sufficiency of one
Each framework scenario has a different number of buildings connected to the grid. While in the scenarios ‘Electricity’ and ‘H2 Gas Grid’ the number of buildings is numerous with approx. 39,000 and 89,000 respectively, the scenario ‘District Heating’ accounts only for about 5800 buildings connected to the heating grid. The distribution of building types is similar in each scenario. The scenario ‘Electricity’ has a slight shift to more SFH with 55% instead of 43% and 44% in the other two scenarios.
For explaining the implementation process for the HESS simulation, the SFH building type of the ‘Electricity’ scenario is used as the most occurring building type. The median building regarding its self-sufficiency rate serves as a representative building, of which its data set is exemplarily used in this paper. The simulation of other building types with different time series and system parameters can be applied accordingly. To estimate energy needs and gains from various buildings connected to energy grid parts, the energy can be accumulated. By choosing the ‘Electricity’ scenario, we set the focus on the most complex simulation due to the use of components, while in the other scenarios, the interaction of buildings connected to the grid forms another degree of complexity. From the data set, we use the estimated annual energy needs per building as well as the annual gain from the PV system to build up power time series in the process; see Section 2.3.
Model simulations of the HESS are realized in the own-built simulation environment MEgy, which was presented in [31]. It uses a set of differential equations for conservation of mass, momentum, and energy along with algebraic equations, describing the behavior of each component. The components can be connected in electric or thermodynamic nodes to form a network.
Each component, such as a MHS tank, HG, FC, electrical converters, or battery, is described in separate classes. The components can be connected in any order and number to form a network via defined interfaces. A single component can be represented in more than one network, e.g., the HG has a connection to the electrical network as well as the mass flow network. The control of the components is achieved by a superimposed accompanying algorithm. It knows the power inputs and outputs of the PV and load components, as well as the SOC of both storages. Using idealized DC-DC converters, the power flows to the HSP and the grid can be controlled. The grid serves as an unlimited power source and sinks without feedback to the system and is therefore not further specified.
The basic network structure and main components are adopted from [31]. Each component is modeled after known substitute models. The main components are shown in Fig. 3 followed by their representation as edges in the MEgy network in Fig. 4. The hydrogen subsystem of the HESS model consists of a HG and a FC as described in [31], with their parametrized differential and algebraic equations adapted to literature values or measured curves to fit the equipment in the university’s hydrogen lab. The MHS is modeled after a 0-D model described in [36]. The battery model is based on the Matlab Simscape generic battery model and is also fitted to the devices of the university’s hydrogen lab. Additionally, a simple idealized power converter model is used to connect devices in the electrical subsystem with different voltages. The PV and electrical load are modeled by a time-series-dependent ideal power source and sink.
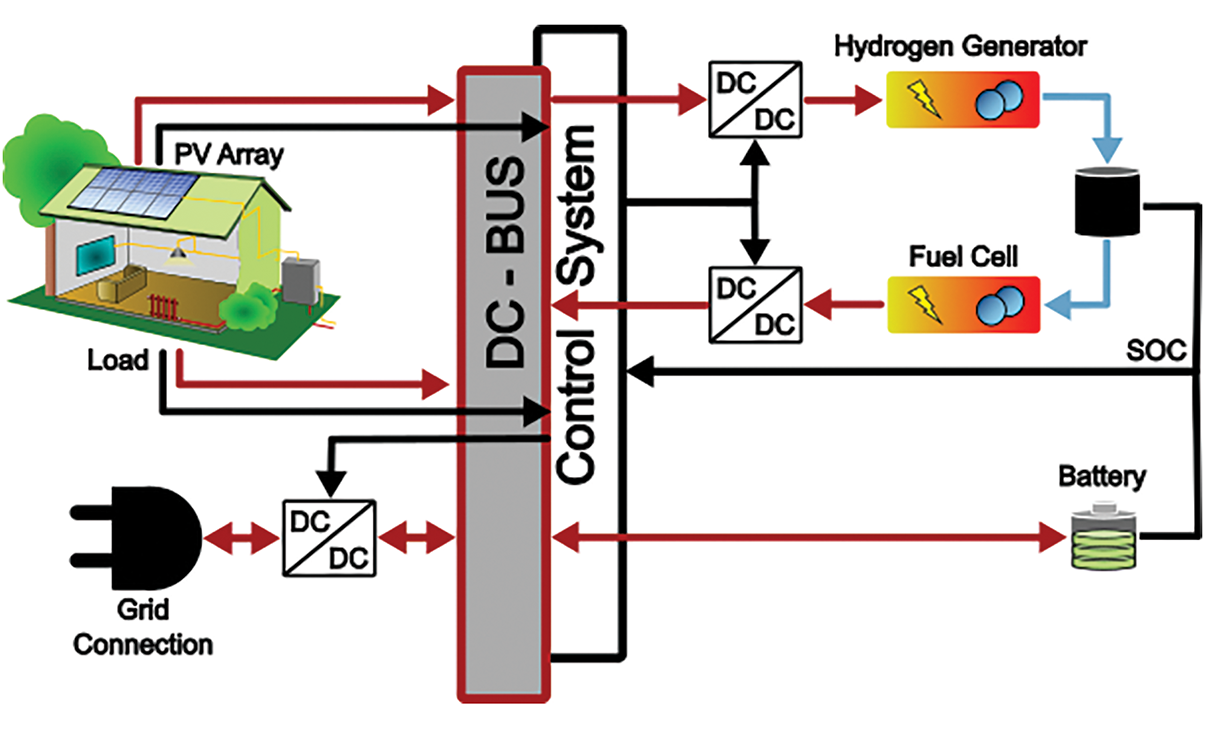
Figure 3: Hybrid energy storage system—all components are connected via an DC-bus and HG, FC, and grid are controlled via idealized DC-DC converters
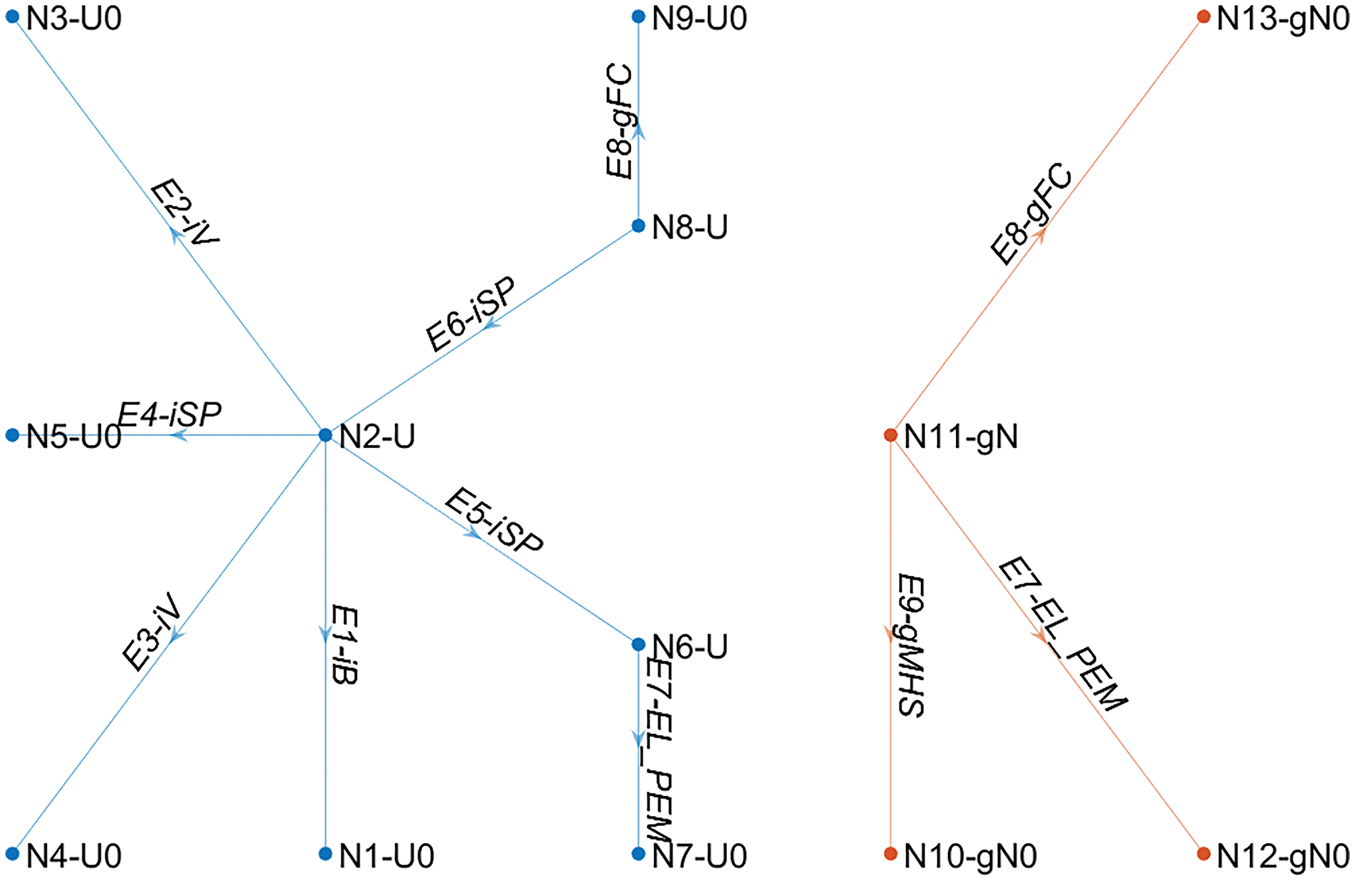
Figure 4: MEgy networks with electric part in blue and the thermodynamic part in orange. The nodes that hold the potential are abbreviated with an (N) and the edges for flow analysis with an (E)
The energy generation and demand curves are created according to VDI Guideline 4655 [37]. The guideline provides demand time series for electricity, heat, and hot water demand, as well as time series for solar energy gain of a PV rooftop system. These time series are based on typical days within a year, provided on a regional basis for Germany. Here we used the standard demand profiles for the lower Rhine valley as the example city, Cologne, is located in this region. The time series are scaled to meet the building’s annual energy demands for electricity, heat, and PV, based on the annual energy allocation determined by the database
2.4 Battery Storage and HSP Sizing
The storage sizing is primarily determined by its function as daily or seasonal storage. The battery is used as daily energy storage, while the MHS is used as seasonal storage. To separate daily from seasonal influences, a simple ‘half-day’ moving average is used to split the storage cycle curve into a base and peak share. The base power share and peak power share are calculated (see Fig. 5). The latter is used to calculate a daily storage need. For this, the power is integrated over time, resulting in a daily energy curve. The useful daily energy storage per day is determined by the maximum point of this curve subtracted by its end value. To find an estimation for the battery storage size, these daily values were sorted and multiplied with the number of days below that value to get energy days for each battery size. The maximum of these energy days is chosen as the battery size for this singular case.
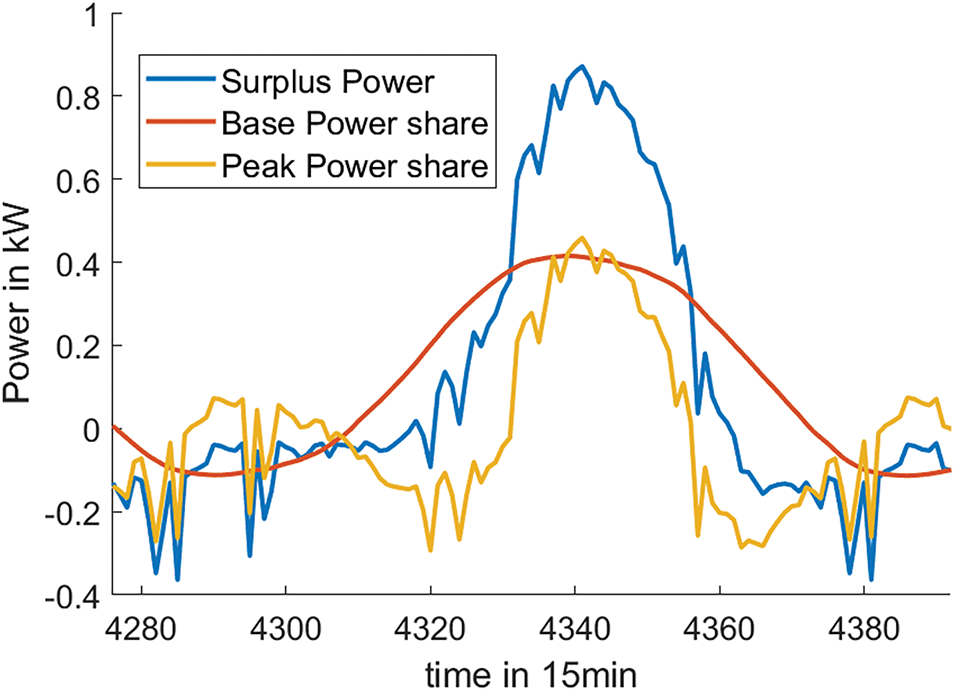
Figure 5: Example of surplus power curve (blue), split in peak (yellow) and base (red) share
With the given battery size, each day is now analyzed by peak shaving the surplus curve (in this case PV−Load) to charge and discharge the battery, resulting in a positive and a negative power limit per day. Neglecting the highest 10% of days with the highest peaks as unnecessary power effort, we estimate the power limits for the HG and the FC.
The sizing of the hydrogen storage is estimated by the residual integral of the surplus power curve. Both charging and discharging power are diminished by 30% to account for the charging and discharging losses of the HG and the FC, resulting in a base energy curve. Similar to the daily energy curve for the battery, the annual base energy curve is now analyzed to estimate the hydrogen energy storage. The hydrogen storage is oversized intentionally to calculate the actual energy amount that can be stored in the MHS tank.
For the simulation, a deterministic, rule-based control strategy is favored due to its speed, reliability, and repetitiveness. A simple control strategy solely dependent on SOC would greatly underestimate the potential of a dual storage system. To benefit from the total power potential, a similar approach as made by [26] is realized.
The control algorithm handles the charging and discharging of both the battery and the MHS separately. While the battery is mainly used for daily storage, the MHS is used for seasonal storage. Therefore, the amount of energy required to charge or discharge the battery is calculated for a whole day in advance, based on the current SOC of the battery. The algorithm identifies the energy amount in the peaks of the surplus curve when to charge or discharge the battery. The power limits are determined according to the procedure shown in Fig. 6.
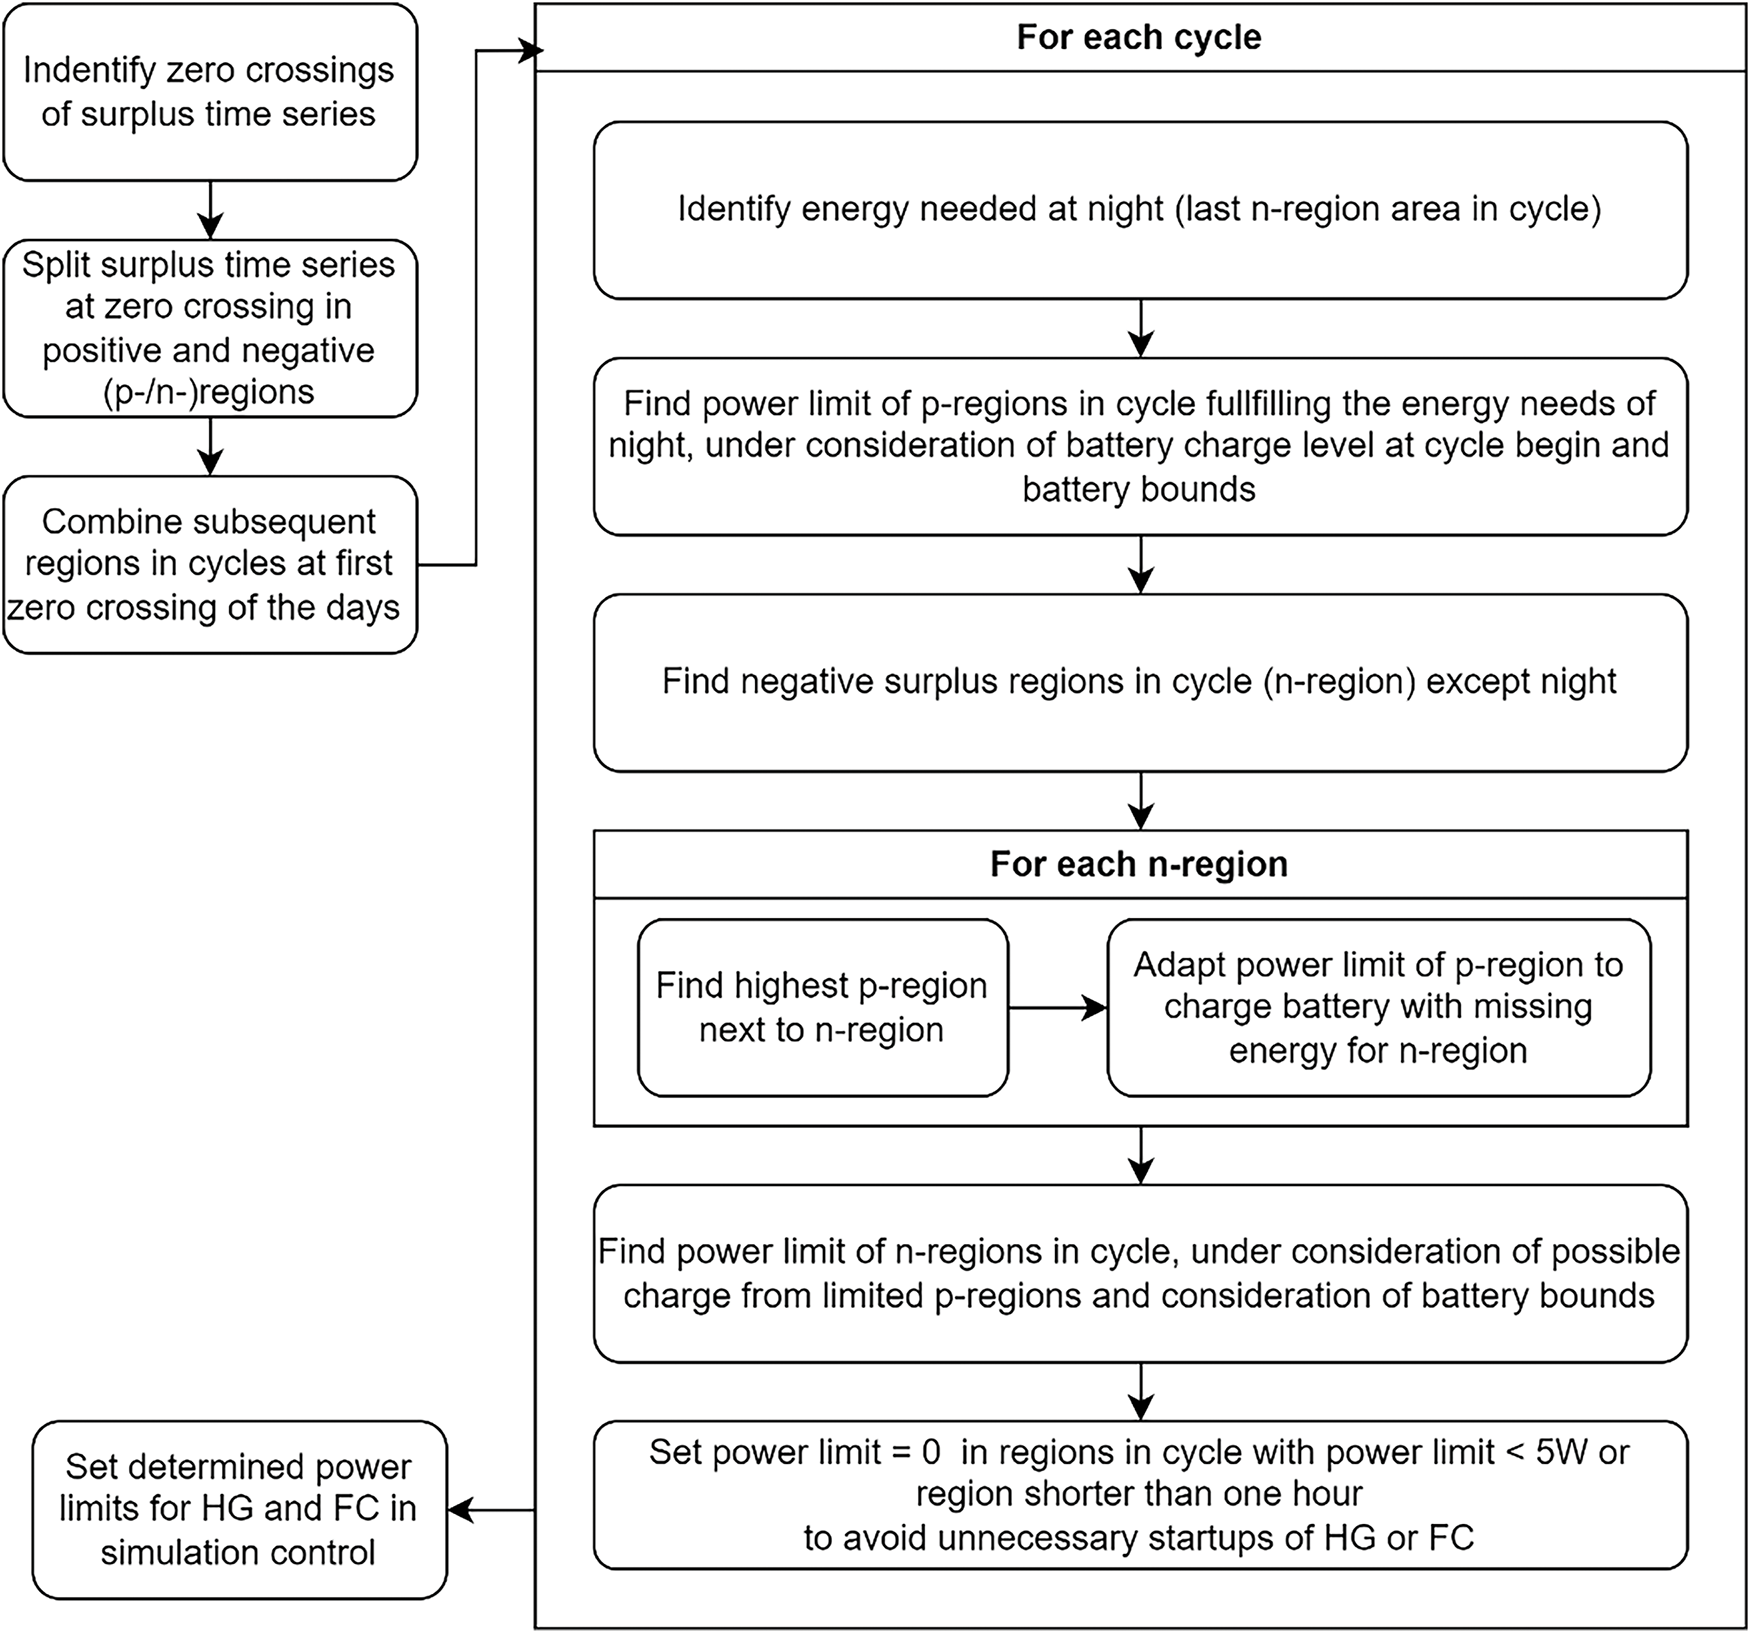
Figure 6: Procedure of HG and FC power limit determination
The battery charging and discharging take priority and set the limits for the utilization of the HSP. This is only possible by knowing the surplus curve in advance, with all the influence of weather and clouds on the PV panels and all demand consumed. With an analysis of the known daily surplus curve, all zero-crossings are identified, splitting the curve into a production and demand section. In each section, a simple optimization function is used to find the power limit that satisfies the aim of maximum battery usage within the usable SOC limits between 30% and 90%. An example of the surplus curve with different power levels identified by the algorithm for each zero-crossing section is shown in Fig. 7 followed by the usable SOC level of the battery for this case in Fig. 8.
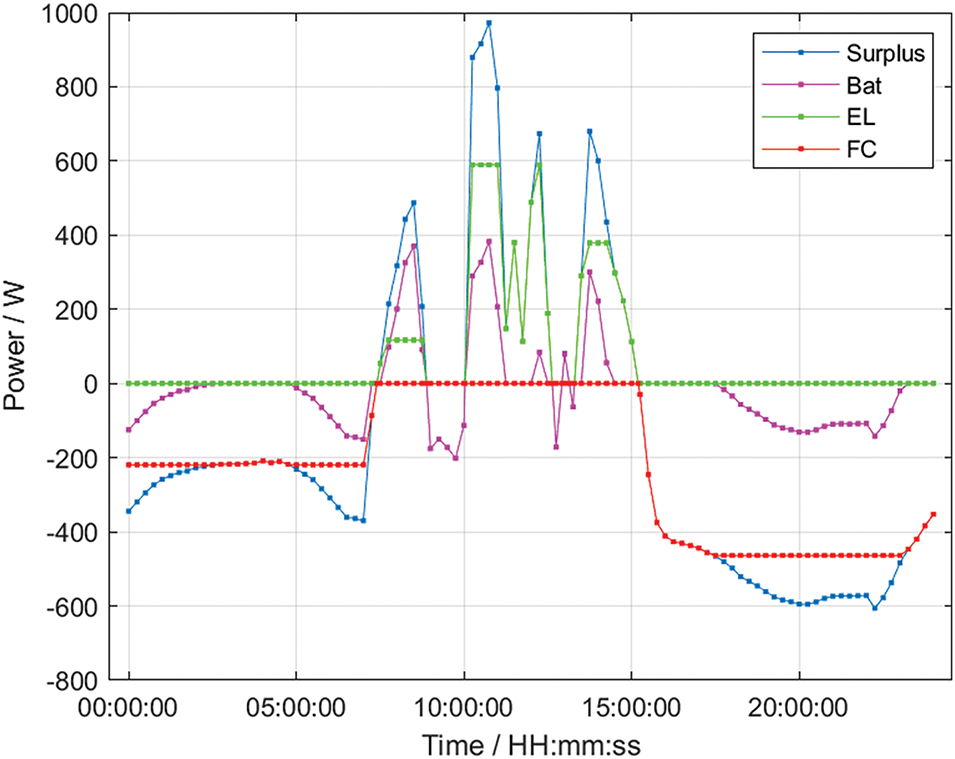
Figure 7: Exemplary day of setting the power limits by the algorithm. The surplus power curve (blue) is divided in battery use (pink) and HSP use (HG green and FC red)
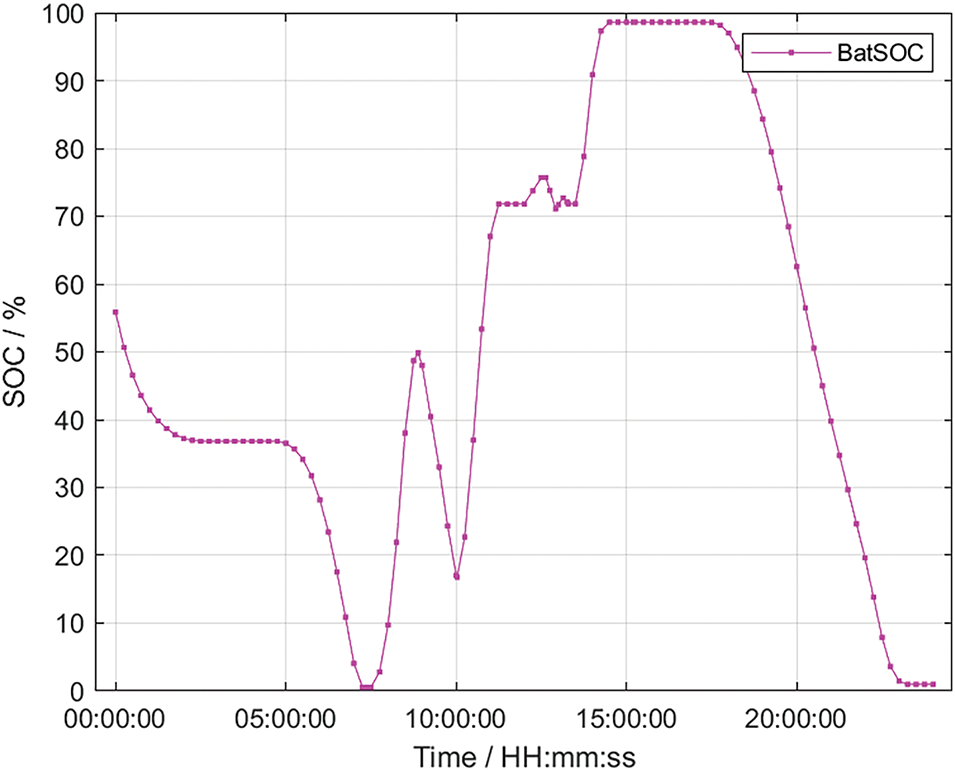
Figure 8: Evaluated usable SOC of battery during setting of the power limits
Using the battery storage to manage peak gain and demand makes the system ‘grid friendly’. Additionally, the use of the total energy is higher, as the power supply and the power demand of the system can be combined by using the battery and HG/FC simultaneously. This is a major advantage in comparison to serial charging of the storages. In addition to the pre-set power levels of the HG and the FC, some control and safety events are defined to manage the energy flow of the system, such as the maximum and minimum levels of battery and MHS tank. In the event of overpowering or underpowering, the grid connection is set to provide an equilibration. A diagram of the control process is shown in Fig. 9.
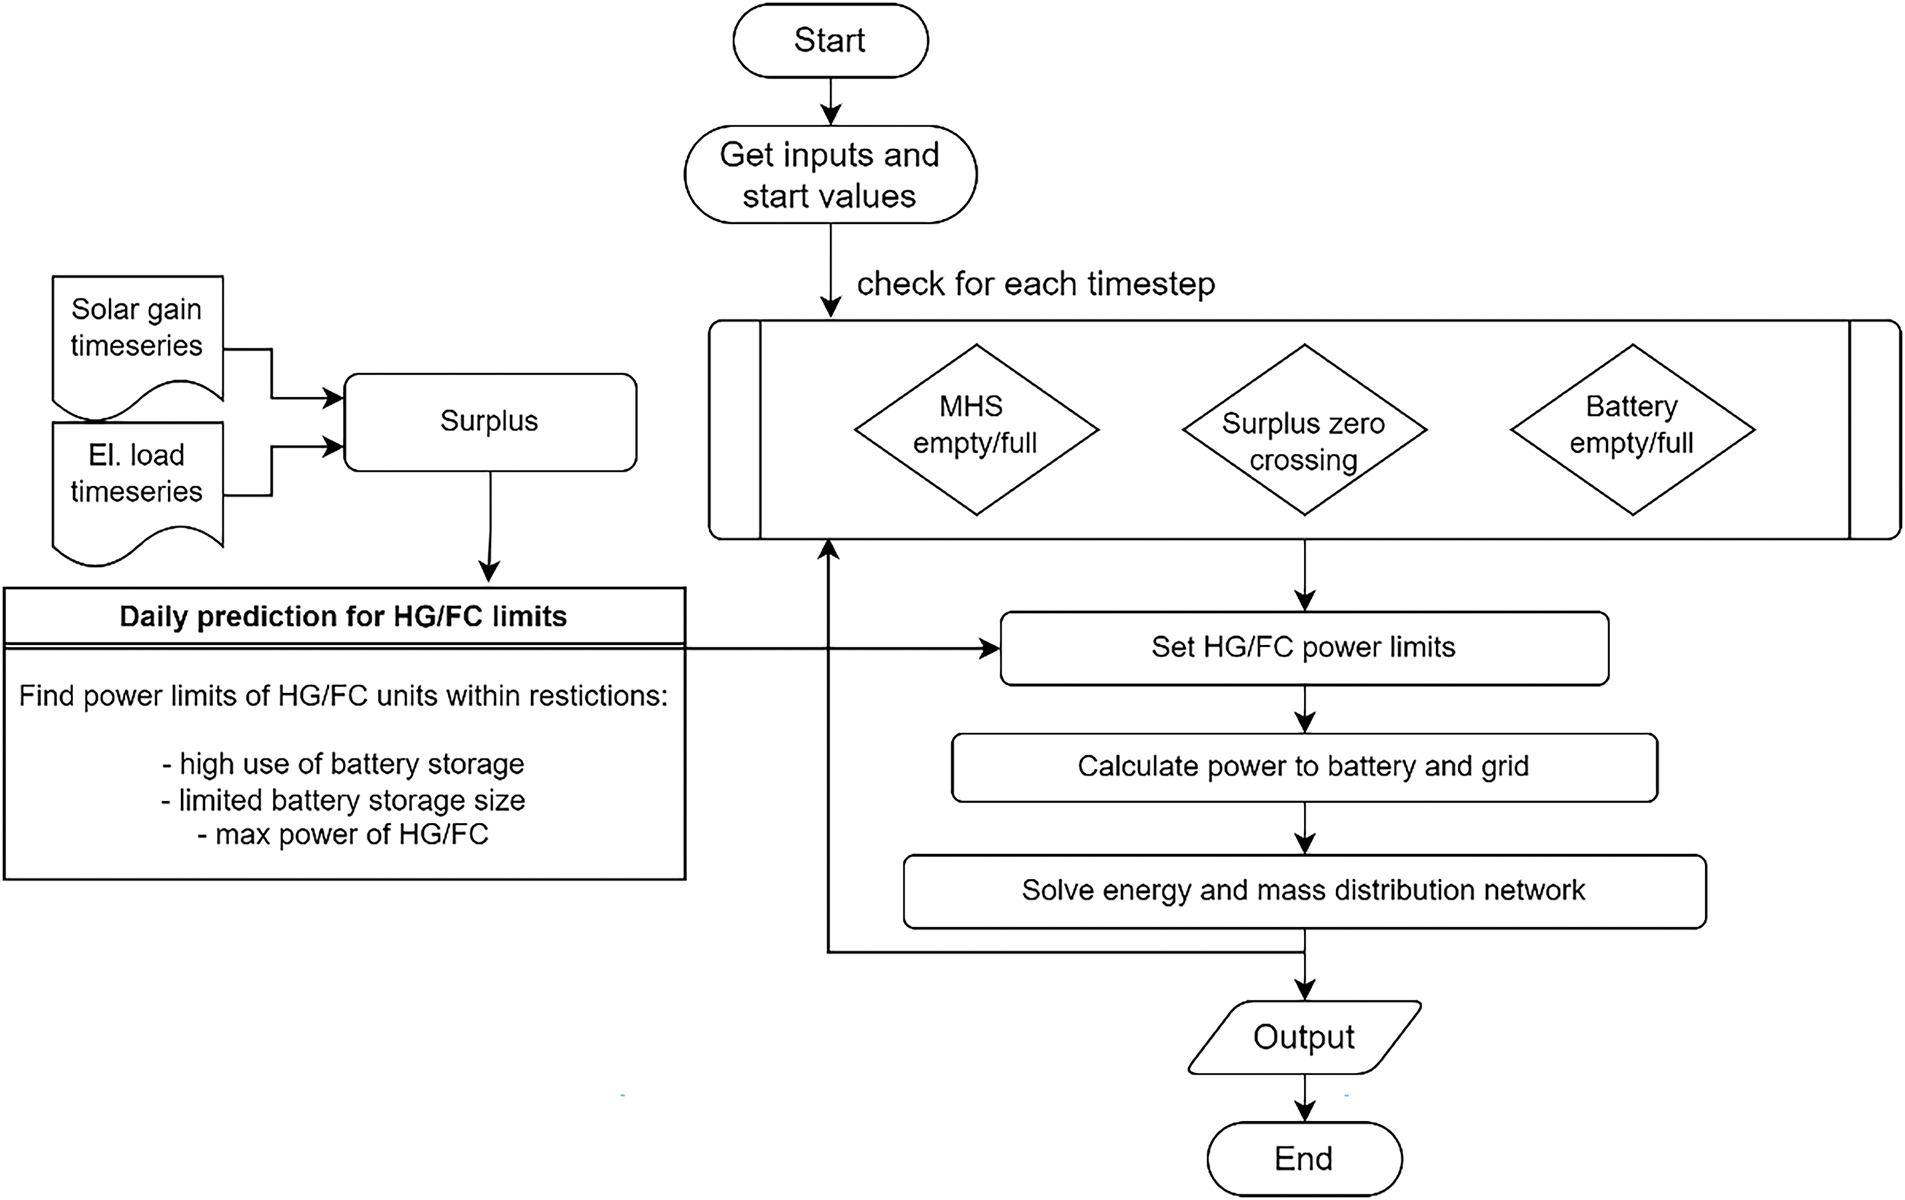
Figure 9: Control process for charging and discharging the storage system as implemented in the simulation model
In the simulation model, the power limits are set in the DC/DC converters. These converters are not modeled in depth but are idealized modules that set the power flow to connected equipment and simultaneously adapt the needed potential.
From the framework dataset, the SFH used for illustration is a two-story, attached building. Its living surface is estimated at about 100 m2 and houses 2.3 inhabitants. The solar roof potential assigned to the roofs building is 7.4 kWpeak with a calculated annual energy gain of 6500 kWh. Electrical energy use is estimated at 4000 kWh per year. The annual electrical self-sufficiency rate is therefore 1.65. Additional energy needs assigned to the building but not used in this work are 12,000 kWh and 1900 kWh of heating needs and hot water, respectively. The heating needs are on the upper limits for a small house but are accounted to this building due to its estimated age somewhere around 1950. In an extended simulation model, the heating needs of the building could be supported by excess heat from the HG and the FC, which will reduce the external energy needs of the building.
The time series generated with the VDI Guideline is shown in Fig. 10. The use of typical days can be identified by similar patterns of a day within the year.
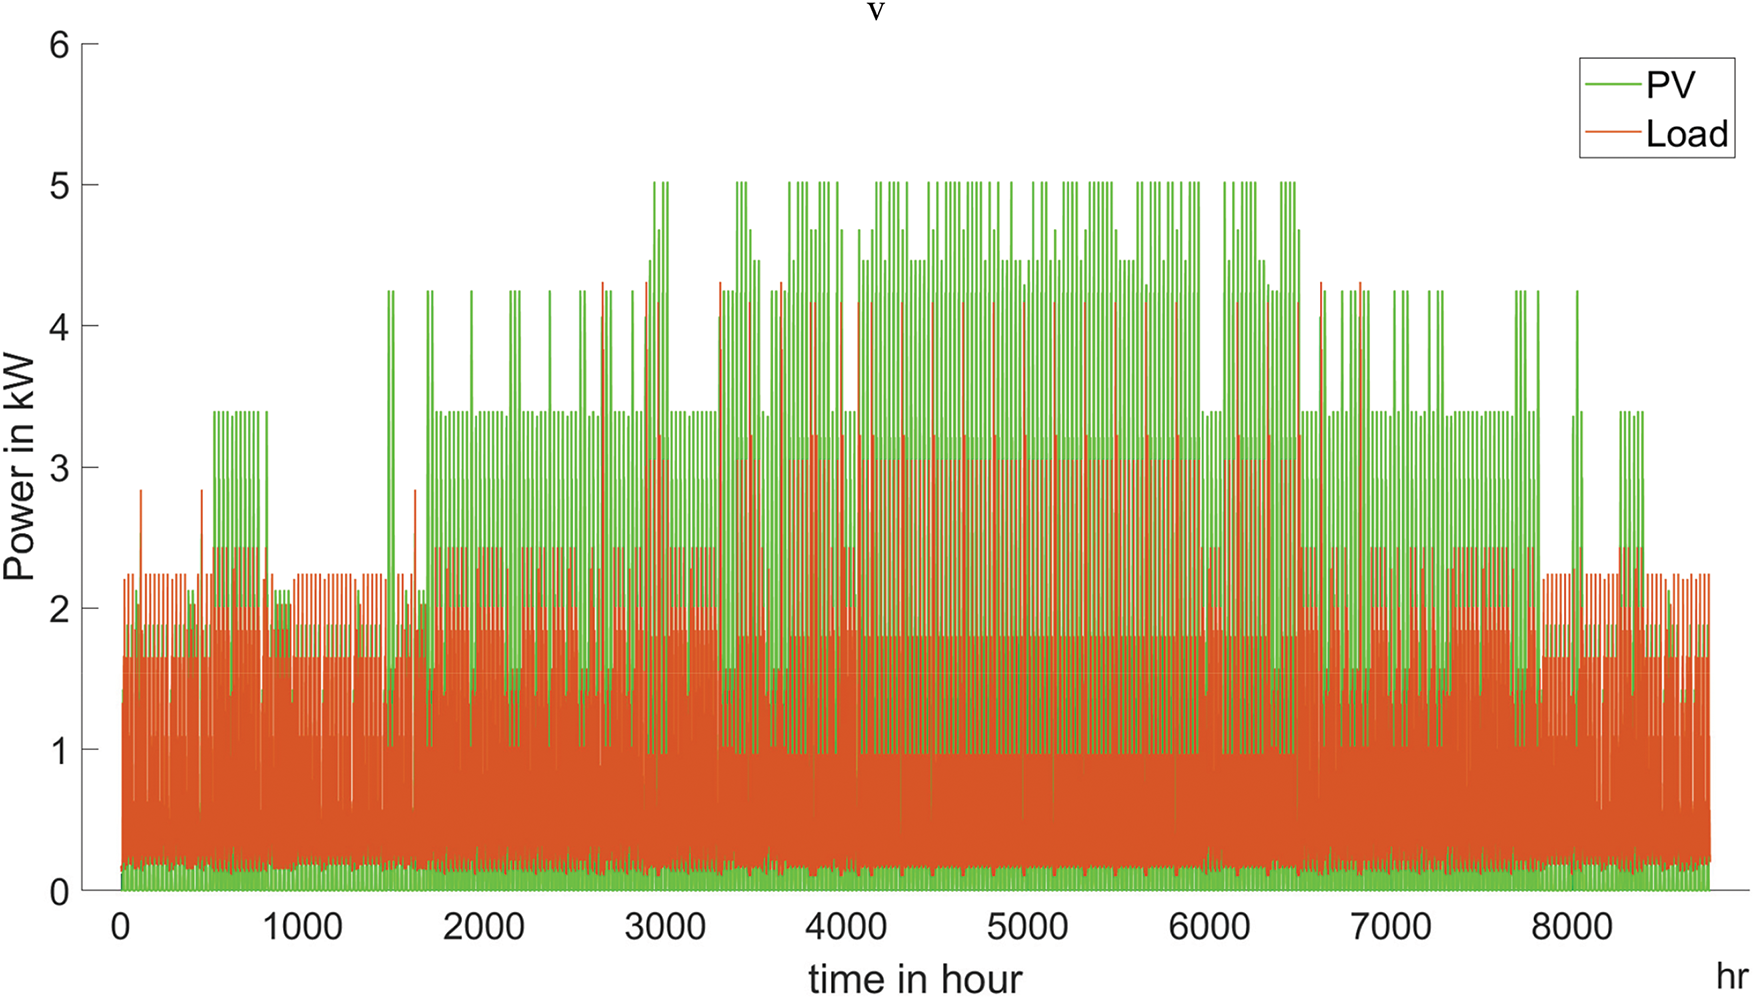
Figure 10: Generated time series for domestic load (orange) and PV generation (green) of the chosen typical SFH in Cologne, Germany
The sizing of the battery as a determining parameter is set to 4.7 kWh based on the calculation described in Section 2.4. In comparison with the VDI Guideline for storage sizing (No. 4657), the sizing stays in a similar range. The guideline, however, does not consider the option of a second storage. Due to the residual loads calculated from the surplus curve and a possible charging and discharging energy amount to the battery, the power limits of the HG and the FC were identified as described in Section 2.4 to 1 kW and 110 W, respectively.
These limits are set to show the functionality of the simulation model, but in future use of the model, an optimization of the components power limits as well as the storage sizes is foreseen.
We show simulation results for exemplary days in January and July (German winter and summer) to illustrate the functionality and general behavior of the overall system and its components. To evaluate the output of the simulation, the equipment’s power curves and their SOC are shown in Fig. 10. Secondary results like current, potential, pressure, mass flow, and so on are also available.
In Fig. 11, the power curves of selected days in January and July are presented. Easily recognizable are the start-up and shut-down of the individual components due to changes in the surplus curve and the given limits of the control strategy. On summer days (a), the start-up of the HG follows as soon as the surplus curve is positive, followed by giving surplus to the grid as soon as the maximum power of the HG is reached. Then the battery is charged in the surplus peaks of the day, reaching a SOC of 86% (b). The positive surplus during the day, provided by the PV, is therefore divided into three levels. The lower part is entirely admitted to the HG to produce hydrogen to store in the MHS tank. Since the HG power limit is set to 1 kW, power above this limit is directed to the battery and the grid. Due to the known energy amount of the power peaks, the battery is preferably charged with the fluctuating power peaks. Hence, the middle energy band remains for the grid. During wintertime (c), with insufficient battery storage to fulfill all the electrical energy needs of the day, the FC operates at night mainly in a baseband and is supported by the battery, which will handle all load peaks. If needed, as shown in the example, the grid will also step in to handle electrical needs if the power of the FC and battery cannot handle the load. In (d), the SOC of the battery and the MHS tank for those particular days are shown. The battery operates that day in the whole given 30% to 90% range. On the slopes of the PV peak curve, the battery holds its charge.
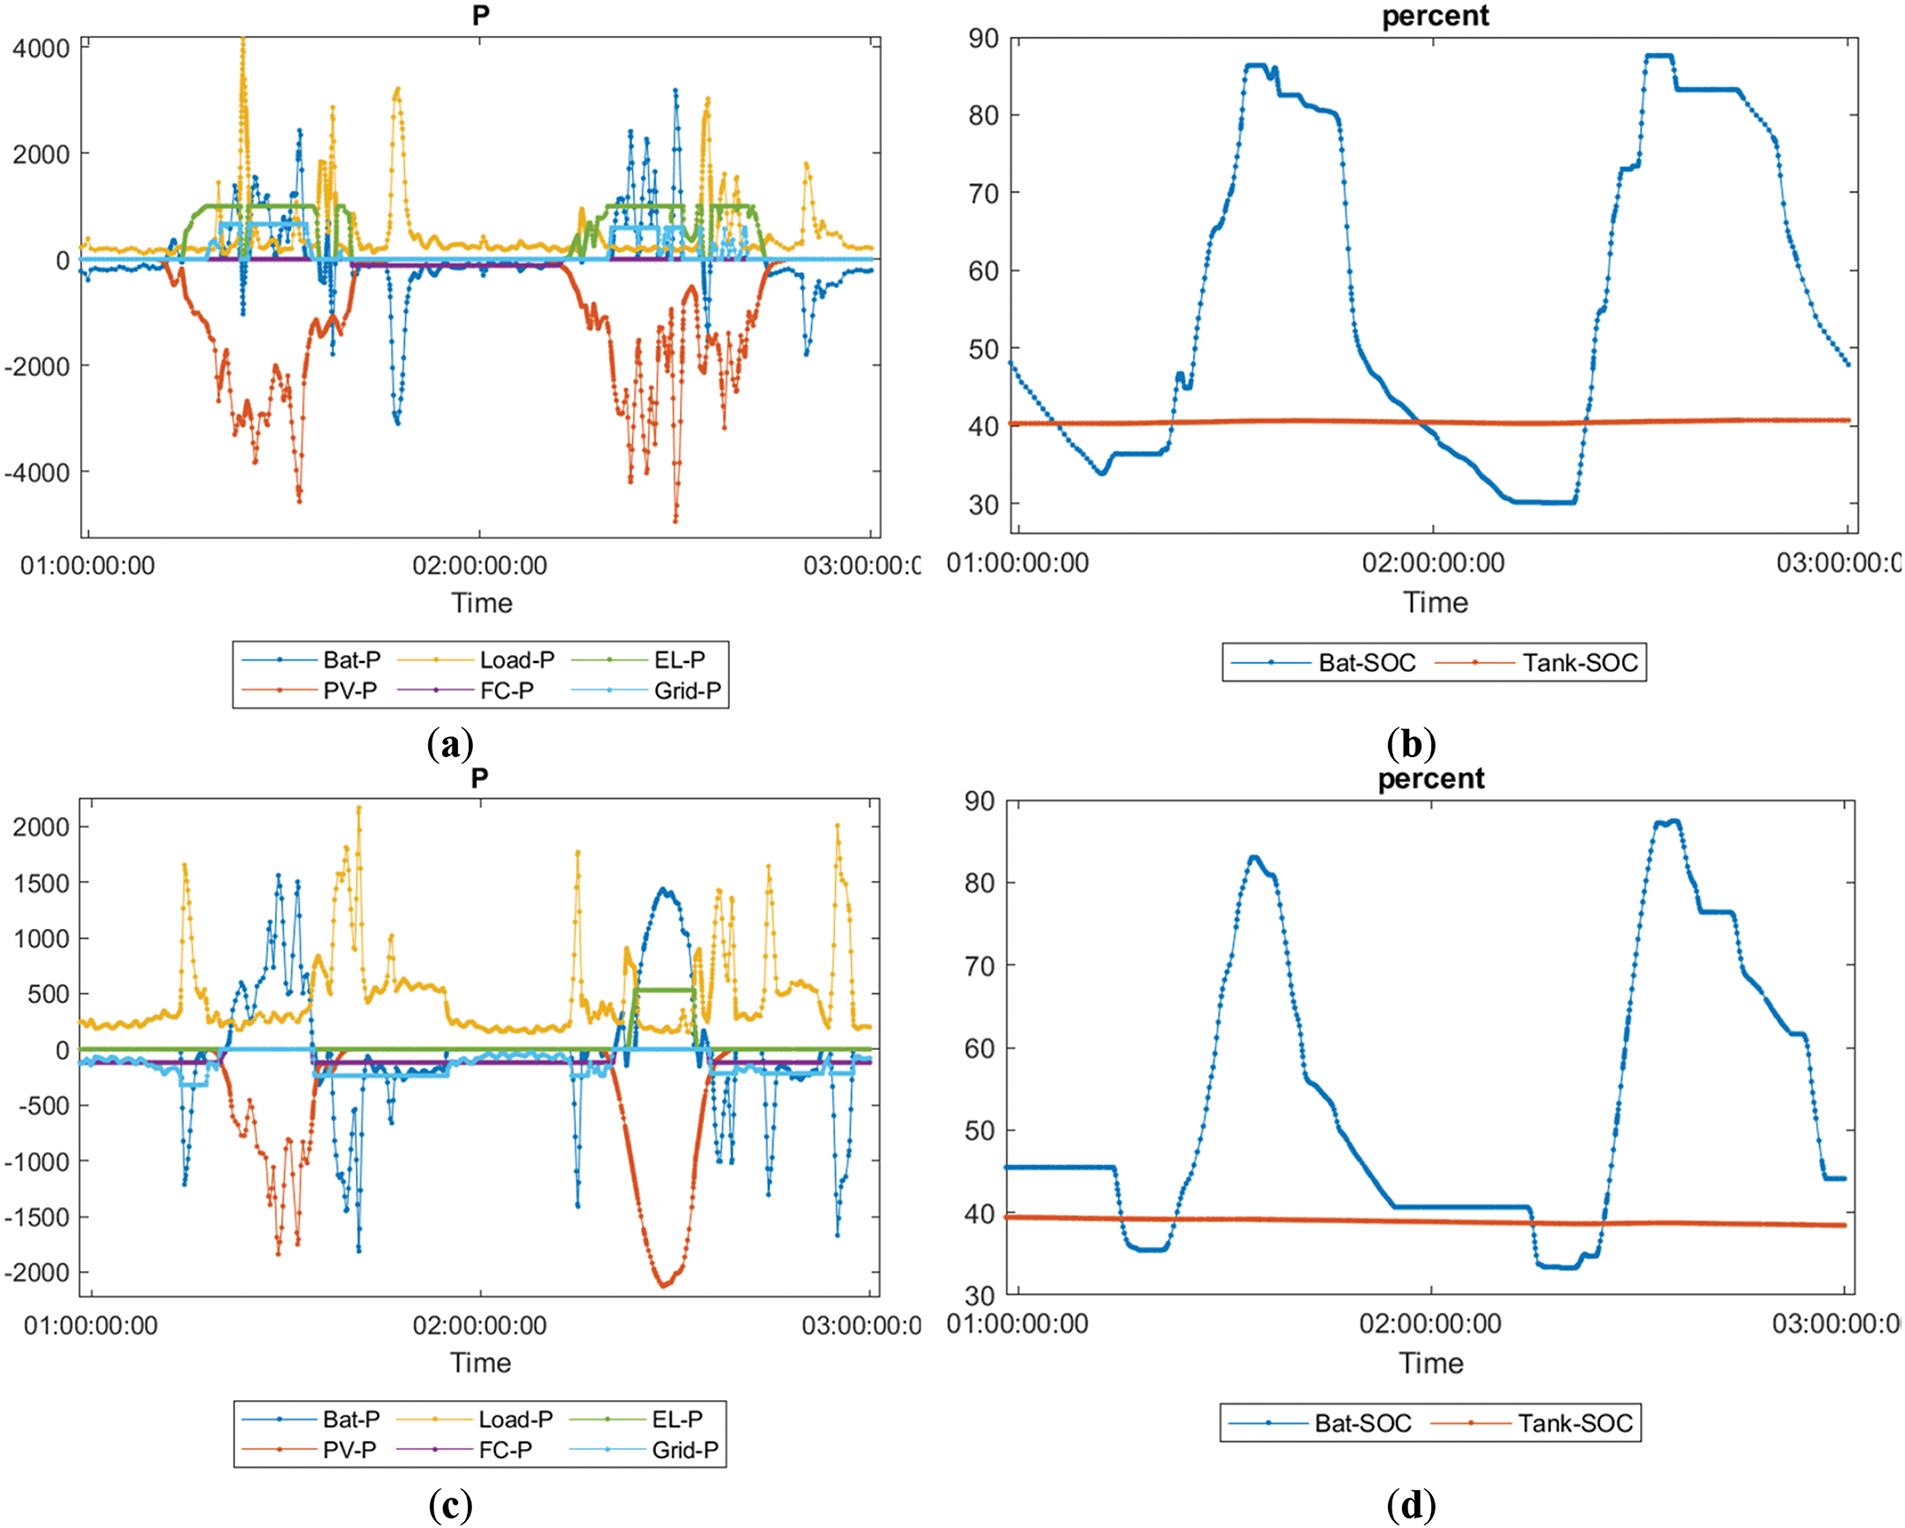
Figure 11: Power curves in W (a,c) with battery in blue, load in yellow, HG in green, PV in red, FC in lilac and grid in cyan. Two consecutive days are shown from 14th of July (a) and 15th of January (c). Respectively the SOC curves (b,d) are shown with battery in blue and MHS tank in red
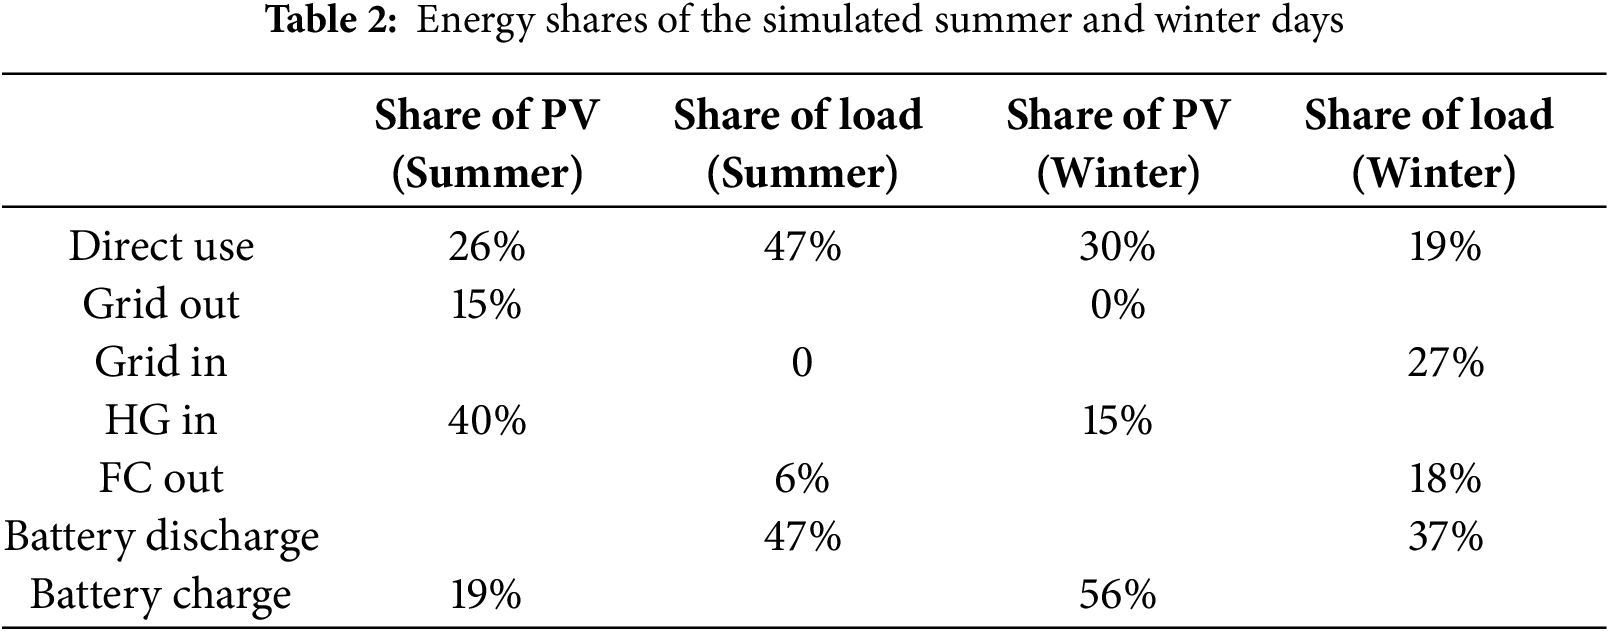
In the given configuration and for the example of summer/winter days, the simulated energy distribution is presented in Table 2 in shares of PV energy and shares of Load energy.
As the presented scenarios differ mainly by their sizes of PV potential and load, but as SFH share the same time series structure, the main difference occurs through the sizing of the storages and their allocated power levels due to the control algorithm.
The created simulation model with the implemented control of the HESS is an adequate tool to optimize the power limits of the HSP equipment and the storage size. The chosen optimal control, using a peak-shaving algorithm, will especially help with the inter-comparability of the results. By combining the simulation model with a dataset of regional building types, this study aims to evaluate the potential of a hydrogen storage system and its influence on the infrastructural gas and heating grids. For this, extensive simulation efforts are needed to assess the range of buildings or building types present in the cityscape. Further knowledge about storage sizes and power limitations of the HSP equipment enables research on grid interactions such as peak load reductions or feedback loops to the energy market.
With the simulation model, work is needed on reliability and performance to extend the simulation periods to a whole year with input time series of a minimum 15-min resolution. With optimization of both storage sizes and power limits of the HSP, the model can also be used to simulate different building types and give information about grid use, storage usage, the building’s self-consumption rates, and their energy inputs and outputs to connected grids.
As heat recovery of the HG and the FC can support a building’s heating demand, the models of the HSP equipment need to be expanded to obtain additional data. The model of the MHS does not include a temperature-sensitive dynamic hydrogen uptake or release yet. Currently, the MHS is set to a constant temperature of 300 K, which can be achieved with a simple heat-controlled water basin. Charging and discharging the MHS would heat or cool the water, which acts as a heat buffer and can actively be controlled to specific temperature needs. However, as the dynamic behavior of the MHS relies on the temperature, an adaptation of the model is needed. A new control is required to handle the heat-driven operation for different scenarios.
Acknowledgement: This research was supported by the German Federal Ministry for Economic Affairs and Climate Action.
Funding Statement: This research was supported by the German Federal Ministry for Economic Affairs and Climate Action [BMWK SimBench-Sektor project, grant number 03EI1058C].
Author Contributions: The authors confirm contribution to the paper as follows: study conception and design: Steffen Schedler, Tanja Clees, Stefanie Meilinger; data collection: Steffen Schedler; analysis and interpretation of results: Michael Bareev-Rudy, Steffen Schedler; draft manuscript preparation: Steffen Schedler. All authors reviewed the results and approved the final version of the manuscript.
Availability of Data and Materials: Data available on request from the authors.
Ethics Approval: Not applicable.
Conflicts of Interest: The authors declare no conflicts of interest to report regarding the present study.
References
1. World Energy Council. World energy scenarios: exploring innovation pathways to 2040. London, UK: World Energy Council; 2019. [Google Scholar]
2. Wang A, van der Leun K, Peters D, Buseman M. European hydrogen backbone. Utrecht, Netherlands: Guidehouse; 2020. [Google Scholar]
3. Hebling C, Ragwitz M, Fleiter T, Groos U, Härle D, Held A, et al. Eine Wasserstoff-Roadmap für Deutschland. Freiburg, Germany: Fraunhofer; 2019. [Google Scholar]
4. Ball M, Weeda M. The hydrogen economy—vision or reality? Int J Hydrogen Energy. 2015;40(25):7903–19. doi:10.1016/j.ijhydene.2015.04.032. [Google Scholar] [CrossRef]
5. Bundesministerium für Wirtschaft und Klimaschutz. Energiedaten: Gesamtausgabe [Internet]. [cited 2025 Jan 1]. Available from: https://www.bmwk.de/Redaktion/DE/Artikel/Energie/energiedaten-gesamtausgabe.html. [Google Scholar]
6. Wirth H. Aktuelle Fakten zur Photovoltaik in Deutschland. Freiburg, Germany: Fraunhofer; 2020. [Google Scholar]
7. Züttel A. Hydrogen storage methods. Naturwissenschaften. 2004;91(4):157–72. doi:10.1007/s00114-004-0516-x. [Google Scholar] [PubMed] [CrossRef]
8. Rusman NAA, Dahari M. A review on the current progress of metal hydrides material for solid-state hydrogen storage applications. Int J Hydrogen Energy. 2016;41(28):12108–26. doi:10.1016/j.ijhydene.2016.05.244. [Google Scholar] [CrossRef]
9. Maclay JD, Brouwer J, Samuelsen GS. Experimental results for hybrid energy storage systems coupled to photovoltaic generation in residential applications. Int J Hydrogen Energy. 2011;36(19):12130–40. doi:10.1016/j.ijhydene.2011.06.089. [Google Scholar] [CrossRef]
10. Yilanci A, Dincer I, Ozturk HK. A review on solar-hydrogen/fuel cell hybrid energy systems for stationary applications. Prog Energy Combust Sci. 2009;35(3):231–44. doi:10.1016/j.pecs.2008.07.004. [Google Scholar] [CrossRef]
11. Hajiaghasi S, Salemnia A, Hamzeh M. Hybrid energy storage system for microgrids applications: a review. J Energy Storage. 2019;21:543–70. doi:10.1016/j.est.2018.12.017. [Google Scholar] [CrossRef]
12. Ali U, Shamsi MH, Bohacek M, Purcell K, Hoare C, Mangina E, et al. A data-driven approach for multi-scale GIS-based building energy modeling for analysis, planning and support decision making. Appl Energy. 2020;279(6):115834. doi:10.1016/j.apenergy.2020.115834. [Google Scholar] [CrossRef]
13. Greif S, Limmer T, Mayer F. Potential of air-source heat pumps complying with sound immission limits in the German building stock. In: ETG Congress 2021; 2021 Mar 18–19; Online. [Google Scholar]
14. Schedler S, Meilinger S, Clees T. A new bottom-up method for classifying a building portfolio by building type, self-sufficiency rate, and access to local grid infrastructure for storage demand analysis. Appl Energy. 2024;371(8):123502. doi:10.1016/j.apenergy.2024.123502. [Google Scholar] [CrossRef]
15. ALKIS/ATKIS. 3D-Gebäudemodell LoD2 (CityGMLDatenlizenz Deutschland-Zero-Version 2.0 [Internet]. Köln, Germany: Bezirksregierung Köln; 2022 [cited 2025 Jan 1]. Available from: www.opengeodata.nrw.de. [Google Scholar]
16. Statistische Ämter des Bundes und der Länder. Zensus 2011—Gebäude und Wohnungen: Übersicht über Merkmale und Merkmalsausprägungen, Definitionen. Wiesbaden, Germany: Statistische Ämter des Bundes und der Länder; 2014. [Google Scholar]
17. Zhang L, Xiang J. The performance of a grid-tied microgrid with hydrogen storage and a hydrogen fuel cell stack. Energy Convers Manag. 2014;87(3):421–7. doi:10.1016/j.enconman.2014.07.045. [Google Scholar] [CrossRef]
18. Knosala K, Langenberg L, Pflugradt N, Stenzel P, Kotzur L, Stolten D. The role of hydrogen in German residential buildings. Energy Build. 2022;276(2098):112480. doi:10.1016/j.enbuild.2022.112480. [Google Scholar] [CrossRef]
19. Ren H, Wu Q, Gao W, Zhou W. Optimal operation of a grid-connected hybrid PV/fuel cell/battery energy system for residential applications. Energy. 2016;113(8):702–12. doi:10.1016/j.energy.2016.07.091. [Google Scholar] [CrossRef]
20. Rouholamini M, Mohammadian M. Energy management of a grid-tied residential-scale hybrid renewable generation system incorporating fuel cell and electrolyzer. Energy Build. 2015;102(Part A):406–16. doi:10.1016/j.enbuild.2015.05.046. [Google Scholar] [CrossRef]
21. Kneiske TM, Braun M, Hidalgo-Rodriguez DI. A new combined control algorithm for PV-CHP hybrid systems. Appl Energy. 2018;210(1):964–73. doi:10.1016/j.apenergy.2017.06.047. [Google Scholar] [CrossRef]
22. Zhang Y, Hua QS, Sun L, Liu Q. Life cycle optimization of renewable energy systems configuration with hybrid battery/hydrogen storage: a comparative study. J Energy Storage. 2020;30(1):101470. doi:10.1016/j.est.2020.101470. [Google Scholar] [CrossRef]
23. Bocklisch T. Hybrid energy storage systems for renewable energy applications. Energy Proc. 2015;73:103–11. [Google Scholar]
24. Carapellucci R, Giordano L. Modeling and optimization of an energy generation island based on renewable technologies and hydrogen storage systems. Int J Hydrogen Energy. 2012;37(3):2081–93. [Google Scholar]
25. Gerlach L, Bocklisch T. Experts versus algorithms? Optimized fuzzy logic energy management of autonomous PV hybrid systems with battery and H2 storage. Energies. 2021;14(6):1777. [Google Scholar]
26. Struth J, Kairies KP, Leuthold M, Aretz A, Bost M, Gährs S, et al. PV-benefit: a critical review of the effect of grid integrated PV-storage-systems. In: Proceedings of the International Renewable Energy Storage Conference (IRES); 2013 Nov 18–20; Berlin, Germany. [Google Scholar]
27. Samende C, Fan Z, Cao J, Fabián R, Baltas GN, Rodriguez P. Battery and hydrogen energy storage control in a smart energy network with flexible energy demand using deep reinforcement learning. Energies. 2023;16(19):6770. [Google Scholar]
28. Günther S, Bensmann A, Hanke-Rauschenbach R. Theoretical dimensioning and sizing limits of hybrid energy storage systems. Appl Energy. 2018;210:127–37. [Google Scholar]
29. Monforti FA, Bartolini A, Comodi G, McPhail SJ, Segura Manzano F, Andujar JM, et al. Optimal sizing of battery and hydrogen energy storage systems configurations in a hybrid renewable microgrid. E3S Web Conf. 2021;238:09002. doi:10.1051/e3sconf/202123809002. [Google Scholar] [CrossRef]
30. Bareev-Rudy M, Schedler S, Clees T. Sizing optimization of H2 hybrid energy storage systems: a metamodel-based approach. In: Conference Sustainable Development of Energy, Water and Environment Systems (SDEWES) 2024; 2024 Sep 8–12; Rome, Italy. [Google Scholar]
31. Bareev-Rudy M, Meiswinkel S, Pfennig M, Schedler S, Schiffer B, Steinebach G, et al. Analysis of power-to-gas-to-X systems with metal hydride storage based on coupled electrochemical and thermodynamic simulation. Energy Convers Manag. 2024;314(7):118694. doi:10.1016/j.enconman.2024.118694. [Google Scholar] [CrossRef]
32. Landesamt für Natur, Umwelt und Verbraucherschutz Nordrhein-Westfalen. Energieatlas NRW: Verwendung von Daten von [Internet]. [cited 2025 Jan 1]. Available from: https://open.nrw/dataset/solarkataster-nrw-potenzialdaten-dachflachen-photovoltaik-geo-nrw. [Google Scholar]
33. Rheinenergie AG. Map district heating [Internet]. [cited 2022 Aug 26]. Available from: https://www.rheinenergie.com/de/privatkunden/waerme___wasser/waerme/fernwaerme_beziehen/fernwaerme_beziehen.html. [Google Scholar]
34. Stadt Köln (City of Cologne). Datenbereitstellung zur Vergabe von Gaskonzessionen—Köln—Netzkarte [Internet]. [cited 2022 Jan 28]. Available from: www.stadt-koeln.de. [Google Scholar]
35. Institut Wohnen und Umwelt. Tabula: further development of the german residential building typology [Internet]. [cited 2025 Jan 1]. Available from: www.building-typology.eu. [Google Scholar]
36. Dreistadt DM, Puszkiel J, Bellosta von Colbe JM, Capurso G, Steinebach G, Meilinger S, et al. A novel emergency gas-to-power system based on an efficient and long-lasting solid-state hydride storage system: modeling and experimental validation. Energies. 2022;15(3):844. doi:10.3390/en15030844. [Google Scholar] [CrossRef]
37. VDI Guideline 4655. Reference load profiles of residential buildings for power, heat and domestic hot water as well as reference generation profiles for photovoltaic plants. Düsseldorf, Germany: GVDI-Gesellschaft Energie und Umwelt; 2021. [Google Scholar]
Cite This Article
 Copyright © 2025 The Author(s). Published by Tech Science Press.
This work is licensed under a Creative Commons Attribution 4.0 International License , which permits unrestricted use, distribution, and reproduction in any medium, provided the original work is properly cited.
 Downloads
 Citation Tools