
 Submit a Paper
 Propose a Special lssue
 Open Access
ARTICLE

Adaptive Multi-Objective Energy Management Strategy Considering the Differentiated Demands of Distribution Networks with a High Proportion of New-Generation Sources and Loads
1 China Electric Power Research Institute, State Grid Corporation of China, Beijing, 100080, China
2 State Grid Hunan Electric Power Company Marketing Service Center (Metering Center), Changsha, 410000, China
3 College of Information and Electrical Engineering, China Agricultural University, Beijing, 100080, China
* Corresponding Author: Yetong Hu. Email:
Energy Engineering 2025, 122(5), 1949-1973. https://doi.org/10.32604/ee.2025.062574
Received 21 December 2024; Accepted 05 March 2025; Issue published 25 April 2025
 View Full Text
 Download PDF
Abstract
With the increasing integration of emerging source-load types such as distributed photovoltaics, electric vehicles, and energy storage into distribution networks, the operational characteristics of these networks have evolved from traditional single-load centers to complex multi-source, multi-load systems. This transition not only increases the difficulty of effectively classifying distribution networks due to their heightened complexity but also renders traditional energy management approaches—primarily focused on economic objectives—insufficient to meet the growing demands for flexible scheduling and dynamic response. To address these challenges, this paper proposes an adaptive multi-objective energy management strategy that accounts for the distinct operational requirements of distribution networks with a high penetration of new-type source-loads. The goal is to establish a comprehensive energy management framework that optimally balances energy efficiency, carbon reduction, and economic performance in modern distribution networks. To enhance classification accuracy, the strategy constructs a multi-dimensional scenario classification model that integrates environmental and climatic factors by analyzing the operational characteristics of new-type distribution networks and incorporating expert knowledge. An improved split-coupling K-means pre-clustering algorithm is employed to classify distribution networks effectively. Based on the classification results, fuzzy logic control is then utilized to dynamically optimize the weighting of each objective, allowing for an adaptive adjustment of priorities to achieve a flexible and responsive multi-objective energy management strategy. The effectiveness of the proposed approach is validated through practical case studies. Simulation results indicate that the proposed method improves classification accuracy by 18.18% compared to traditional classification methods and enhances energy savings and carbon reduction by 4.34% and 20.94%, respectively, compared to the fixed-weight strategy.Keywords
With the increasing integration of distributed photovoltaics, wind power generation, and electric vehicle charging stations, the volatility and uncertainty of distribution network loads have risen significantly, posing substantial challenges for traditional energy management strategies in handling complex and dynamic operational scenarios [1–3]. Meanwhile, although the deployment of energy storage systems enhances the flexibility of system scheduling, it also adds layers of complexity to energy management. Effective control of storage charging and discharging strategies is essential to ensure a coordinated balance between supply and demand [3–6]. However, the absence of robust multi-dimensional scenario classification methods has hindered the ability to comprehensively characterize the diverse operational characteristics of different distribution networks, ultimately compromising the effectiveness of energy management strategies [7–10]. Therefore, there is an urgent need for an adaptive multi-objective energy management strategy capable of dynamically adjusting objective weights to achieve optimal energy efficiency, carbon reduction, and economic performance across varying operational scenarios.
There has been considerable research on classification methods for low-voltage distribution networks. References [11,12] propose deep learning models based on deep neural networks for classifying distribution networks. Reference [13] introduces a formula-based classification for distributed system optimization, identifying two main types: nested and alternating formulas. Reference [14] explores the use of classification methods to facilitate the accurate estimation of probabilistic constraints in optimization problems under uncertainty. Reference [15] proposes the use of the ISODATA (Iterative Self-Organizing Data Analysis Technique) algorithm for customer classification within distribution networks. Reference [16] presents a hierarchical and zonal planning strategy for low-voltage distribution network looped equipment based on an improved K-Means partitioning method. While these studies have made progress in distribution network classification, they primarily rely on single indicators or specific types of classification methods and fail to comprehensively account for the complexities arising from the interactions among multi-source loads, distributed energy resources, and energy storage systems, as well as the diversity and dynamics induced by load fluctuations and bi-directional power flows. This makes them inadequate for accurately identifying the characteristics of different distribution networks.
Current research on energy management strategies primarily focuses on the following areas: Optimization design and energy management strategies for integrated energy systems, such as the universal optimization framework and model proposed in reference [17], which achieve optimal structural configuration and energy management strategies for multi-energy systems through optimization. Energy management methods addressing renewable energy uncertainty, such as the multi-microgrid energy management strategy proposed in references [18,19], which aims to mitigate the impact of uncertain renewable energy outputs on the system. Global optimization requirements, such as the inner-outer framework proposed in reference [20], which includes an outer layer for size optimization and an inner layer focused on optimizing the operation of the energy management system. Modeling of carbon emission flows and energy transmission processes, such as the carbon emission flow model for multi-energy systems in reference [21]. Economic scheduling of regional energy systems coupled with multiple networks, such as the regional energy system scheduling model for power and gas network coupling proposed in reference [22]. Integration of renewable energy and energy storage technologies, such as the smart distribution network energy management system for hydrogen storage and renewable energy introduced in reference [23]. Energy management methods considering demand response, such as the probabilistic methods used in reference [24] to simulate uncertain load behavior for efficient and sustainable energy management. Optimization management of energy storage systems, such as the fuzzy logic-based power allocation between hydrogen storage and electricity storage in reference [25]. And energy management of flexible energy centers, such as the optimization strategy for connecting energy centers to the grid discussed in reference [26]. Moreover, the application of historical data collected by energy management systems is of significant importance. Reference [27] proposes a data-driven system strength forecasting scheme based on historical online data collected by the energy management system, and utilizing multi-objective machine learning algorithms to enhance prediction accuracy. Reference [28] proposes an adaptable grid resiliency framework derived from a meticulous examination of existing metric structures. Based on the analysis of the above literature, combined with the research content of this paper, the relevant summary and comparison are shown in Table 1.

As can be seen from Table 1, existing scenario classification methods are often based on single indicators or specific types, with limited consideration of multidimensional factors such as environmental and climatic conditions, and they lack integration with expert knowledge. This leads to inadequate adaptability and accuracy in classification results. Meanwhile, conventional energy management strategies are generally generic and fail to optimize operations for different distribution feeder scenarios, making it difficult to fully achieve the comprehensive objectives of energy efficiency, low carbon emissions, and economic viability. To address these issues, this paper proposes a multidimensional scenario classification method that extends traditional classification criteria by incorporating environmental and climatic factors while integrating expert knowledge to enhance classification accuracy and adaptability. Furthermore, a split-coupled improved K-means pre-clustering algorithm is employed to classify distribution feeders, mitigating the dependency on initial conditions and improving the stability and precision of clustering results. Based on this classification, a self-adaptive multi-objective energy management strategy is proposed, utilizing fuzzy logic control to dynamically optimize objective weights. This strategy enables an effective balance among energy efficiency, carbon reduction, and economic benefits by adaptively adjusting the weight of each objective according to different scenarios. Through case studies, the effectiveness of this strategy is validated, demonstrating its capability to enhance energy efficiency, reduce carbon emissions, and improve economic performance.
2 Scenario Classification Model for Source-Grid-Load-Storage Integrated New Distribution Networks
The scenario classification model for new distribution networks integrates environmental and climatic factors with expert knowledge to enhance classification accuracy. It identifies five key dimensions to quantify essential indicators: load characteristics, distributed energy characteristics, energy storage characteristics, environmental factors, and comprehensive system attributes. These dimensions are rigorously defined to accommodate the classification requirements of various operational scenarios. Based on a detailed analysis of the distinctive features of new distribution networks, a multi-dimensional scenario classification model is developed. To further refine the classification process, an improved split-coupled K-means pre-clustering algorithm is employed, optimizing the overall classification methodology.
2.1 Characteristic Analysis of New Distribution Network
The characteristics analysis of the new distribution network mainly includes the following five aspects:
(a) Load Characteristics
First, Average Load (Lavg): Represents the mean load over a given period, used to assess the baseline load level of the distribution network. It is defined as follows:
where L(t) is the load at time t; T is the total time.
Second, Load Fluctuation (Lvar): Measures the variability of load across different time intervals, providing insights into load stability. It is defined as:
Third, Flexible Load Ratio (Fflex): Represents the proportion of flexible load within the total load, serving as an indicator of the distribution network’s flexibility. It is given by:
where Lflex(t) is the flexible load at time t.
Fourth, Charging Load Utilization Rate (UCP): Measures the effective utilization of electric vehicle charging piles, defined as the ratio of the actual charging load to the total charging pile capacity:
where PCP,cap is the total load capacity of the charging pile; PCP(t) is the load of charging pile at time t.
(b) Output Characteristics of Distributed Energy (such as photovoltaic)
First, Average PV Output (PPV,avg): Represents the mean power generation of the photovoltaic system over a specified period:
where PPV(t) is the photovoltaic output at time t.
Second, PV Output Fluctuation (PPV,var): Evaluates the degree of variation in PV output, reflecting the stability of the distributed power source:
Third, Photovoltaic Output Climate Influence Coefficient (αcl): Quantifies the impact of climatic conditions (e.g., sunlight intensity and temperature) on PV output. It is defined as follows:
where PPV,max is the maximum PV output; Isolar is the solar irradiance; APV is the photovoltaic panel area; ηPV is the photovoltaic system efficiency.
(c) Energy Storage Characteristics
First, Energy Storage Charging and Discharging Efficiency (ηst): Reflects the energy conversion efficiency of the energy storage system and is given by:
where Edis is the total energy of discharge; Ech is the total energy of the charge.
Second, State of Charge (SOC): Indicates the current charge level of the energy storage system, expressed as a ratio ranging from 0 to 1.
Third, Energy Storage Charging and Discharging Time Ratio (γch): Quantifies the relationship between charging and discharging durations of the energy storage system:
where Tch is the total charging time of the energy storage system; Tdis indicates the total discharge time of the energy storage system.
(d) Environmental and Climatic Characteristics
First, Average Temperature (Tavg): Represents the average temperature over a given period (e.g., annually or seasonally) to assess its potential impact on system operation:
where T(t) is the temperature value at time t.
Second, Humidity Variation Rate (Hvar): Captures the indirect impact of humidity on load demand and distributed energy output:
where H(t) is the humidity value at time t; Havg is the mean humidity over the period.
(e) Comprehensive Indicators
First, Source-Load Matching Degree (M): Evaluates the alignment between distributed generation output and load demand, measured as the standard deviation of their difference:
where PDG(t) represents the total output of the distributed generation at time t.
Second, Load Regulation Capability (C): Reflects the system’s capacity to adjust load demand in response to grid conditions, quantified by the total flexible load response:
where
2.2 Multi-Dimensional Scene Classification Method
By quantifying the aforementioned characteristic indicators, a multidimensional feature space is constructed, mapping the operational data of distribution networks under varying environmental and climatic conditions into this space. An improved split-coupling K-means pre-clustering algorithm is employed to cluster sample points within the feature space, grouping distribution networks with similar characteristics into distinct categories to form representative operational scenarios. To enhance classification accuracy and applicability, the clustering results are further refined through expert knowledge-based optimization. The main steps of the multidimensional scene classification method are as follows:
(a) Construction of a Multidimensional Feature Space
Based on the long-term operational characteristics of the distribution network, data from several weeks or months is utilized to capture seasonal and time-of-day variations. This approach prevents excessive classification by grouping similar scenarios and focusing on key factors that influence network performance, thereby reducing the operational burden on system operators. The extracted features are represented as feature vectors, with each distribution network’s data sample represented as an n-dimensional feature vector Xi:
where i represents the i distribution networks; n is the characteristic number. Construct all samples as matrix X:
where m is the total number of sample distribution networks.
(b) Improved Split-Coupling K-Means Pre-Clustering Algorithm
First, to quantify the similarity between different distribution networks, the Euclidean distance matrix within the feature space is computed as follows:
Second, the K-means algorithm is widely used in power load curve clustering due to its efficiency. However, it has notable limitations, such as the need to predefine the number of clusters K and its sensitivity to the selection of initial cluster centers. These limitations are particularly evident when dealing with high-dimensional power load data, where traditional K-means may fail to accurately capture the intrinsic structure of the dataset. To address these issues, we propose an improved feature vector-based split-merge K-means pre-clustering algorithm. Compared with traditional K-means, this method incorporates the bisecting K-means algorithm, which initially treats all data as a single cluster and progressively partitions it through bisecting clustering until the predetermined number of clusters is reached. This approach mitigates the dependence on the initial cluster center selection and enhances the stability of the clustering process. However, the performance of bisecting K-means is still influenced by the splitting strategy. Therefore, we further integrate a split-merge mechanism guided by the Calinski-Harabasz Index (CHI) as an effectiveness criterion. The algorithm performs splitting and merging operations only when the CHI index increases, continuing until convergence, thereby dynamically determining the optimal number of clusters. The advantage of this method lies in its ability to reduce the dependence on initial conditions inherent in traditional K-means, while also optimizing the splitting process through an effectiveness metric, resulting in more accurate and stable clustering outcomes. As a result, it is better able to capture the complex structure of power load data, particularly when handling high-dimensional datasets.
(c) Expert-Guided Optimization and Final Classification
To enhance the practical applicability of the clustering results, expert knowledge is incorporated to refine the classification process through the introduction of constraints and the adjustment of distance metrics.
First, introducing constraints into the clustering process
Second, the distance measure is modified by incorporating feature-specific weights αk. allowing critical features to exert a greater influence on the classification process:
where αk represents the weight of the k-th feature, determined based on expert experience to ensure that critical features dominate the classification process.
By integrating formalized and quantified feature extraction with expert-guided optimization, the proposed multidimensional scenario classification model enables the precise identification of representative distribution network scenarios. The model categorizes distribution networks into four primary types: PV-dominated, flexible load-dominated, charging pile load-dominated, and mixed-generation, load, and storage scenarios. This classification framework ensures adaptability to the diverse operational conditions of modern distribution networks.
A flowchart of the multidimensional scenario classification process is shown in Fig. 1.
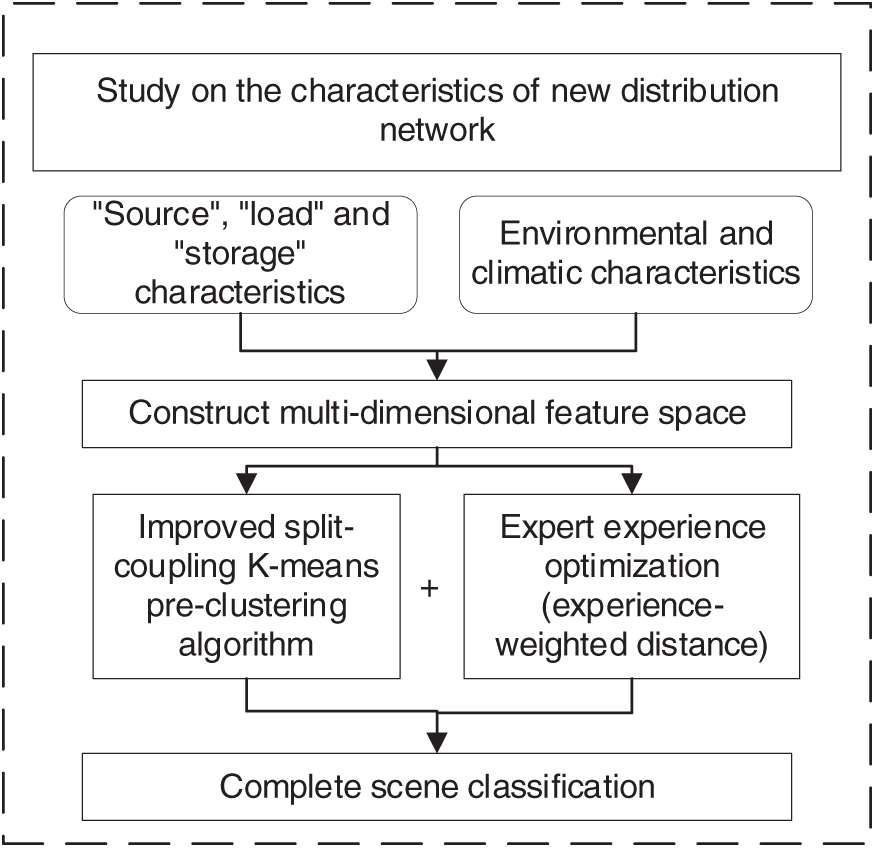
Figure 1: Flow chart of multi-dimensional scene classification
3 Adaptive Multi-Objective Energy Management Strategy Considering Dynamic Changes of Objective Weights
The multi-dimensional scenario classification of modern distribution networks is inherently linked to multi-objective energy management strategies. By analyzing the energy structure, load characteristics, and operational environment of distribution networks, scenario classification distinguishes different distribution networks, providing a systematic foundation for developing targeted energy management strategies. Based on the classification results, customized strategies can be formulated to optimize network operation under varying conditions. To this end, this paper proposes an adaptive multi-objective energy management strategy that accounts for the dynamic adjustment of optimization objective weights. The proposed strategy leverages fuzzy logic control to adaptively regulate the weights of multiple optimization objectives, thereby achieving a balanced trade-off among energy conservation, carbon reduction, and cost-effectiveness.
3.1 Dynamic Adjustment of Objective Weights Based on Fuzzy Logic Control
The integration of scenario classification with fuzzy logic control plays a pivotal role in the proposed adaptive energy management strategy, significantly enhancing the optimization capability of distribution networks. By analyzing historical operational data, scenario classification groups distribution feeders into representative categories and clarifies the dominant operational objectives for each category. For instance, a PV-dominated scenario prioritizes peak-valley balancing, whereas a charging pile-dominated scenario focuses on load flexibility. These scenario labels serve as critical inputs for the fuzzy logic control system, enabling it to dynamically adjust the objective weights according to specific operational conditions. Fuzzy logic control effectively addresses complexity and uncertainty in power system operation, facilitating real-time adaptive optimization of the energy management strategy. By continuously refining decision-making based on system conditions, fuzzy logic control enhances flexibility while reducing computational complexity. Moreover, scenario classification streamlines fuzzy rule design, ensuring computational efficiency and decision rationality.
Through this integrated approach, scenario classification supports and enhances fuzzy control, making the energy management strategy more adaptive, efficient, and capable of optimizing energy conservation, carbon reduction, and economic performance. The fuzzy logic control process is illustrated in Fig. 2.
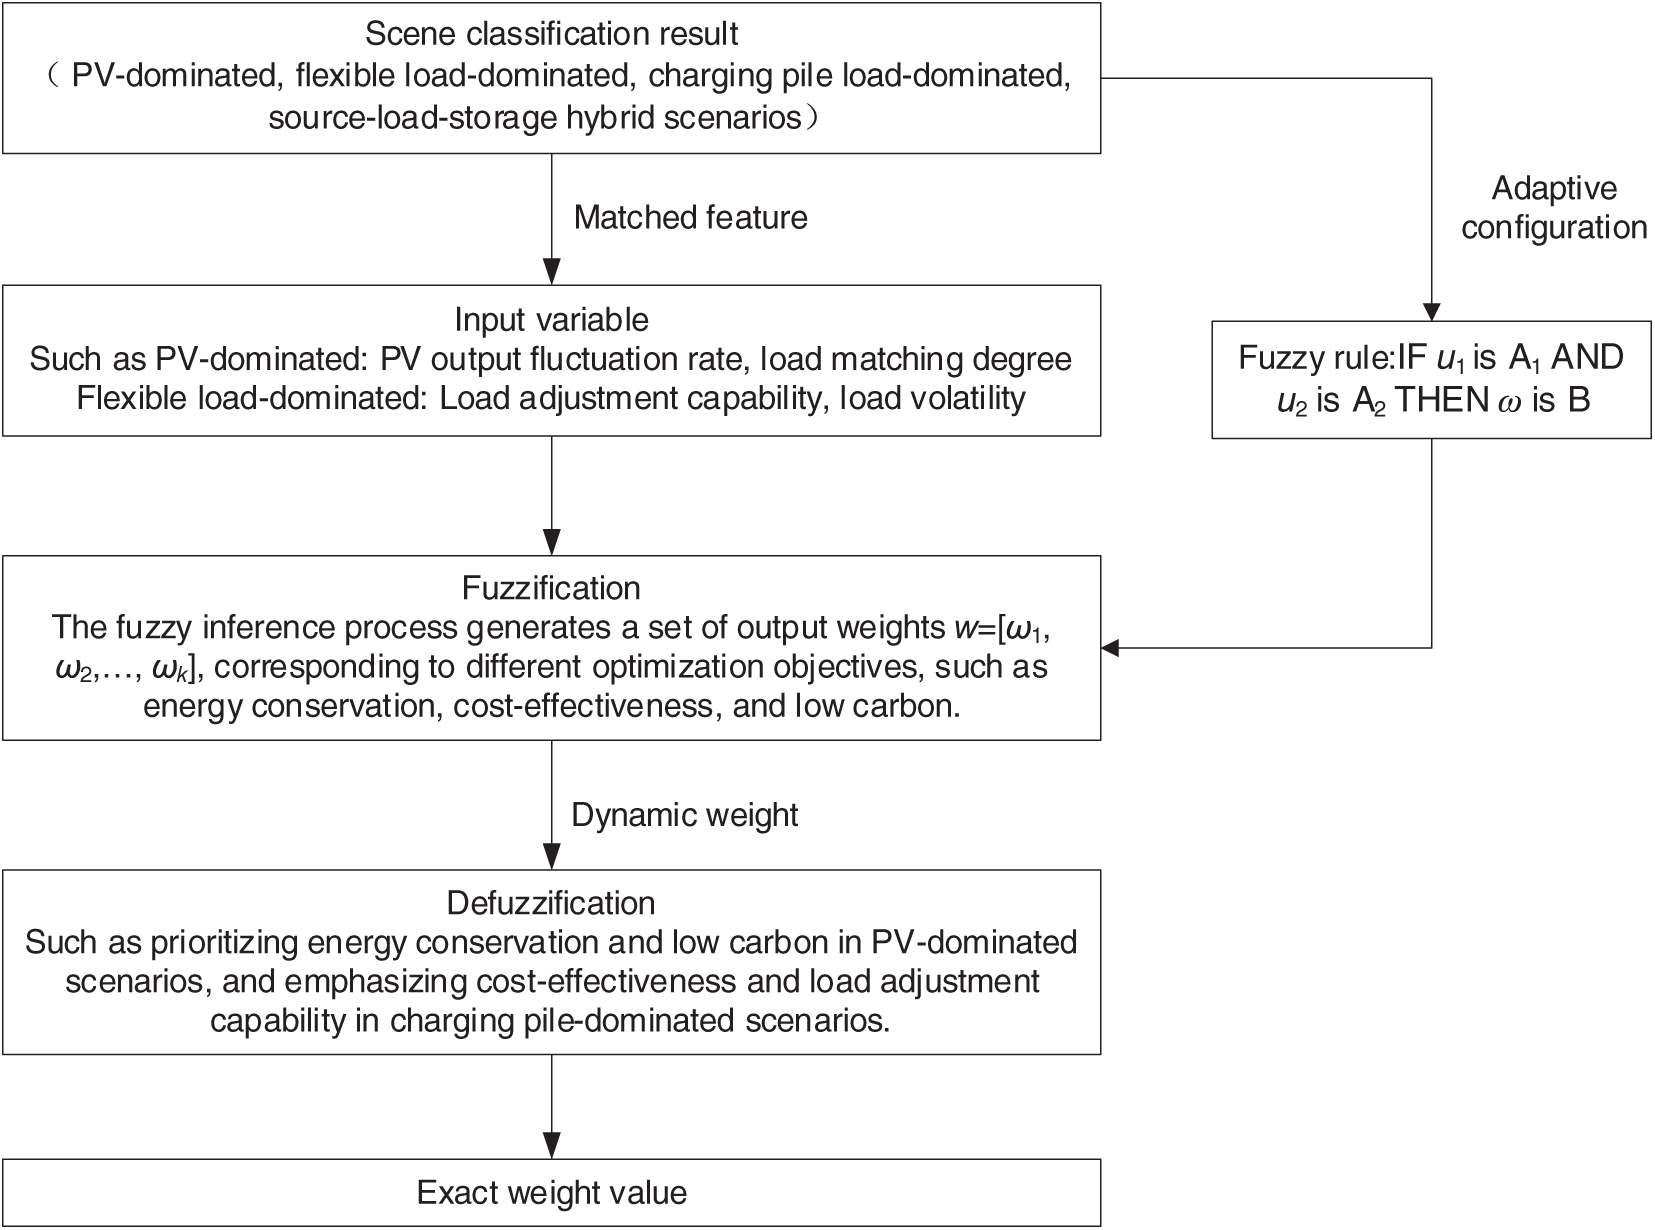
Figure 2: Fuzzy logic control
Embedding scenario classification results into a fuzzy logic control system is key to guiding the configuration of the fuzzy rule base and dynamically adjusting optimization weights. Scenario classification results influence the inputs, rule selection, and weight outputs of the fuzzy logic system as follows:
(a) Configuring Fuzzy Control Inputs Based on Scenario Classification
After classifying the distribution areas into scenarios such as PV-dominated, flexible load-dominated, charging pile load-dominated, and source-load-storage hybrid scenarios, each scenario exhibits distinct operational characteristics. Based on the classification results, the input variables of the fuzzy logic control are configured to match the specific features of the current scenario, reflecting the actual operating conditions of the distribution area. For example, in a PV-dominated scenario, the inputs may include PV output fluctuation rate and load matching degree, while a flexible load-dominated scenario may focus on load adjustment capability and load volatility.
(b) Scenario-Adaptive Configuration of the Fuzzy Rule Base
The fuzzy rule base is dynamically configured to align with the identified scenario, ensuring targeted and flexible control logic. For example, in a PV-dominated scenario, the rule base prioritizes objectives such as peak shaving, valley filling, and output stability, defining a set of IF-THEN rules as follows:
where Ai (i = 1, 2, … , n) represents the fuzzy sets of the input variables, and B denotes the fuzzy set of the output variable (weight). By linking classification results to rule selection, the control system remains adaptive to different operational conditions.
(c) Dynamic Weight Outputs via Fuzzy Inference
The fuzzy inference process generates a set of output weights w = [ω1, ω2, … , ωk], corresponding to different optimization objectives, such as energy conservation, cost-effectiveness, and low carbon. The system flexibly adjusts these weights based on the characteristics of the classified scenario. For instance, in a PV-dominated scenario, the weights for energy conservation and low carbon objectives are increased, whereas in a scenario with high load volatility, the emphasis may shift to cost-effectiveness and low carbon. This approach ensures that the fuzzy logic output aligns with the operational demands of different distribution area scenarios.
(d) Defuzzification for Precise Weight Determination
The fuzzy weight set obtained from inference is transformed into precise values ω through defuzzification, enabling their application in the multi-objective optimization process. Since the fuzzy rule base is adaptively configured based on scenario classification results, the defuzzified weights inherently reflect the specific demands of the current distribution area scenario. For instance, in a PV-dominated scenario, energy conservation and low carbon are assigned higher weights, while in a charging pile load-dominated scenario, greater emphasis is placed on cost-effectiveness and load adjustment capabilities.
At its core, fuzzy logic control dynamically adjusts objective weights in a multi-objective optimization strategy, achieving a balanced trade-off between energy conservation (efficiency), carbon reduction (emission minimization), and cost-effectiveness. Since these objectives often involve conflicting requirements, the system dynamically prioritizes each objective based on real-time operational conditions. This approach effectively balances energy efficiency, carbon reduction, and economic viability, thereby enhancing the overall optimization performance of the distribution network.
3.2 Adaptive Multi-Objective Energy Management Strategy
While energy prices and carbon emission prices are relatively mature and can be directly translated into economic objectives, managing the complexity of distribution networks with a high proportion of renewable energy and flexible loads cannot be fully addressed solely through conventional economic objectives. To this end, this paper proposes an adaptive multi-objective energy management strategy. The optimization goals of this strategy include energy efficiency (maximizing energy savings), low-carbon operation (minimizing carbon emissions), and economic efficiency (minimizing costs). These objectives often involve intrinsic trade-offs. To address this, the proposed strategy employs fuzzy logic control to dynamically adjust the weights of each optimization objective based on the real-time operational conditions of different scenarios. This enables a comprehensive and balanced optimization process that dynamically adapts to varying system demands.
By leveraging fuzzy logic control for weight optimization, the strategy continuously adjusts objective weights and integrates them into a comprehensive objective function for multi-objective optimization. The resulting objective function is formulated as follows:
where ωi is the weight coefficient of the i-th object, and its value range is [0, 1]; fi(x) is the i-th objective function.
First, the energy-saving objective aims to enhance energy utilization efficiency and minimize energy losses by optimizing the charging and discharging strategy of the energy storage system:
where T is the total time step; Eloss(t) is the energy loss at time t; Etotal(t) is the total energy at time t (including charge and discharge energy).
Second, the low-carbon objective seeks to minimize the overall carbon emissions of the system by optimizing the charging and discharging strategy of the energy storage system:
where Pg(t) is the power consumption of the distribution network at time t; Pc(t) and Pd(t), respectively represent the charge and discharge of energy storage at time t; ηch(t) and ηdis(t) are the charging and discharging efficiencies at time t of energy storage, respectively. αg(t) and αe(t) are the carbon emission factors of grid electricity and energy storage charging at time t, respectively.
Third, the economic objective aims to minimize the total cost, which includes electricity procurement costs, operation and maintenance costs, and energy storage degradation costs. This is achieved by optimizing the charging and discharging strategy of the energy storage system:
where Cbuy(t) is the cost of electricity purchase cost, which is influenced by electricity price fluctuations; M(t) and O(t) are respectively the operation and maintenance cost and the degradation cost of the energy storage system at time t of the station. λch(t) and λdis(t) are the electricity purchase and selling prices at time t.
Fourth, Constraints include the following aspects:
(a) Energy Balance Constraints
where Pv(t) is the photovoltaic power generation at time t; Pgrid(t) supplies power to the grid at time t.
(b) Power Limitations
where Pmax is the maximum power of charge and discharge.
(c) State of Charge (SOC) Constraints
where SOC(t) is the state of charge of energy storage at time t; SOCmin and SOCmax are the minimum and maximum charged states of energy storage, respectively.
(d) Flexible Load Constraints
where Pload,min(t) is the power of flexible load at t; Pload,min(t) and Pload,max(t) are respectively the minimum and maximum power requirements of the flexible load at t.
Finally, to solve this multi-objective optimization problem, an improved particle swarm optimization (IPSO) algorithm is employed. The key enhancements in IPSO include:
(a) Integration of Individual and Global Optima: Unlike the standard particle swarm optimization (PSO) algorithm, IPSO incorporates a hybrid mechanism that balances individual and global optima, improving both convergence speed and stability.
(b) Dynamic Inertia Weight Adjustment: A dynamic adjustment strategy is adopted for inertia weight, enabling adaptive velocity updates based on the current iteration number.
The fundamental equations of the particle swarm optimization algorithm are given by:
where vi is the velocity of particle i, xi is the position of particle i, ω is the inertial weight, c1 and c2 are acceleration constants, r1 and r2 are random numbers, pi is the individual optimal position of particle i, g is the global optimal position.
Based on the above formulation, the flowchart of the adaptive multi-objective energy management strategy for multi-dimensional scenario classification in the distribution network is illustrated in Fig. 3.
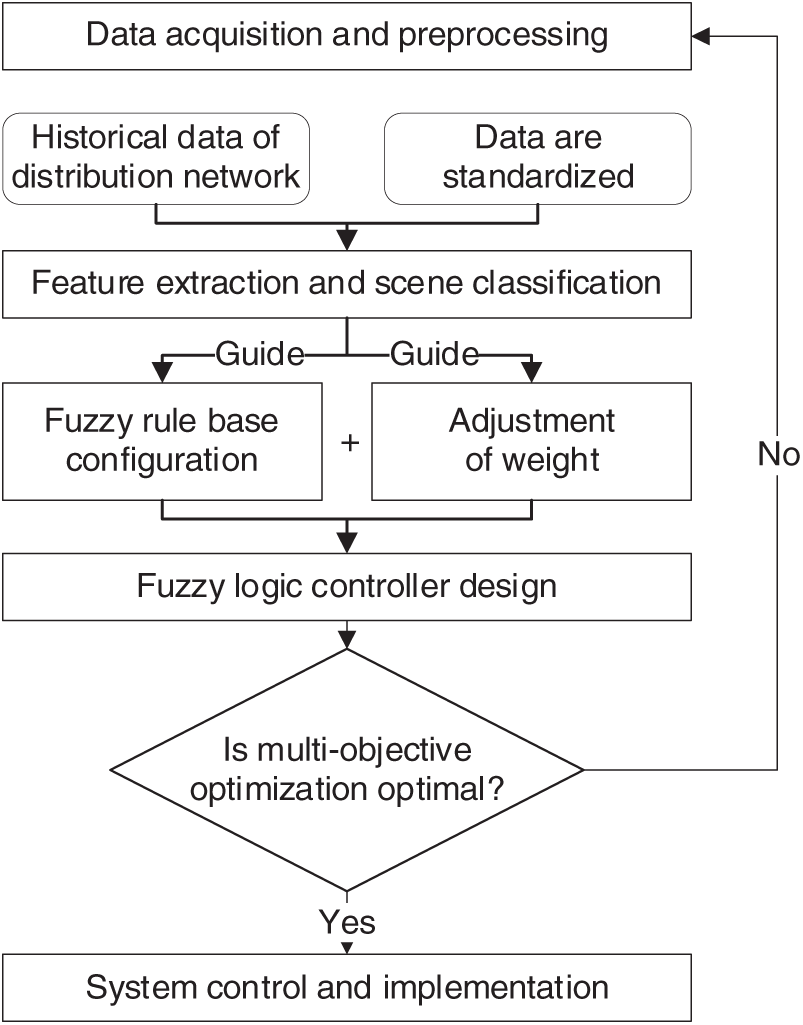
Figure 3: Multi-objective energy management strategy flow chart
4.1 Background of the Case Study
The research presented in this study is based on historical operational data from 100 typical residential distribution networks in a specific city. The dataset for each distribution networks encompasses a wide range of parameters, including load data, distributed photovoltaic (PV) generation, flexible load ratios, charging pile load data, energy storage system characteristics, environmental and climatic factors, electricity prices, carbon emissions data, and operational constraints. The validation objectives are outlined as follows:
(a) Validation of Classification Accuracy: A comparative analysis was conducted between a multi-dimensional scenario classification method (Method 1) and a traditional single-indicator classification method (Method 2) [29]. The classification accuracy of these methods was evaluated against expert classification results.
(b) Comparison of Energy Management Strategies: The performance of an adaptive multi-objective energy management strategy (Strategy 1) was compared with a fixed-weight strategy (Strategy 2) [30] in terms of energy efficiency, carbon emission reduction, and cost-effectiveness. Strategy 2 employs fixed objective weights of 0.3, 0.3, and 0.4 for energy conservation, carbon reduction, and cost-effectiveness, respectively, without adaptation throughout the optimization process. In contrast, Strategy 1 utilizes a fuzzy logic control mechanism to dynamically adjust these weights in response to real-time operating conditions and feeder characteristics.
To thoroughly evaluate both strategies, simulation experiments were first conducted on a 21-bus three-phase four-wire low-voltage distribution networks. This model accurately represents a typical low-voltage distribution system, allowing for the simulation of various operational scenarios involving electrical loads, distributed energy generation, and energy storage regulation. The comparative analysis examines the trade-offs in energy efficiency, carbon reduction, and cost savings between the two strategies. Based on these insights, the study extends the evaluation to 100 distribution networks for a broader and more detailed performance assessment.
The 21-bus low-voltage distribution network topology is shown in Fig. 4. The rated line voltage is 380 V, the self-impedance of the line is Zii = 0.650 + j 0.412 Ω/km, and the length of each line is 50 m. Nodes 4, 8, 10, 11, 12, 13, 16, 17 and 20 are connected with different new source charges to construct different distribution network scenarios.
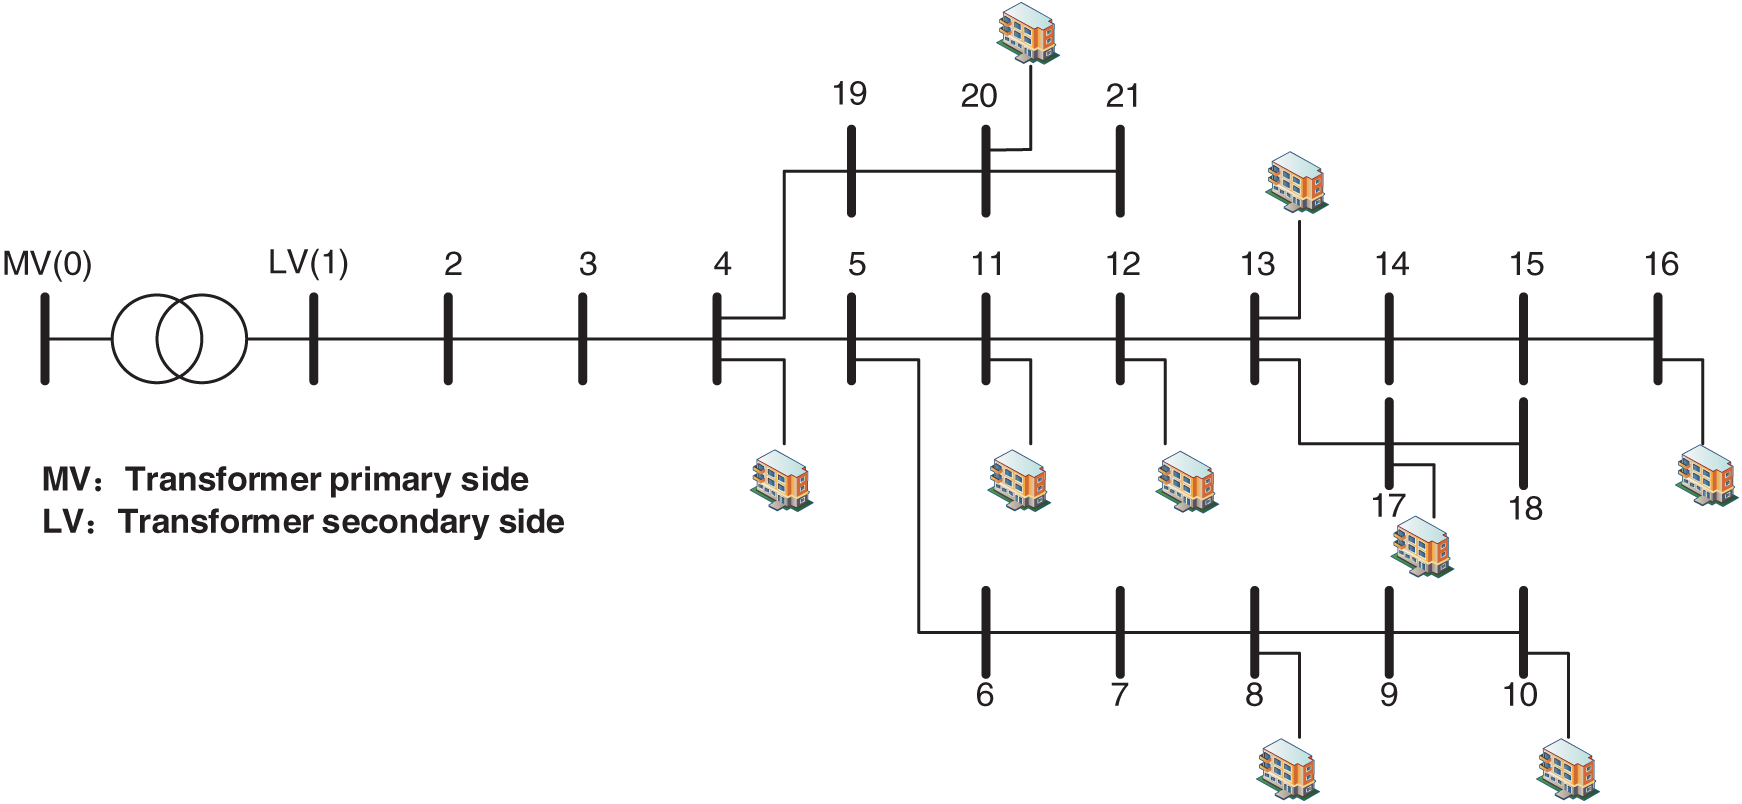
Figure 4: 21 bus low-voltage distribution network topology
The relevant parameters used in the simulation are shown in Table 2.

The standard curve of typical daily load and photovoltaic power generation is shown in Fig. 5.
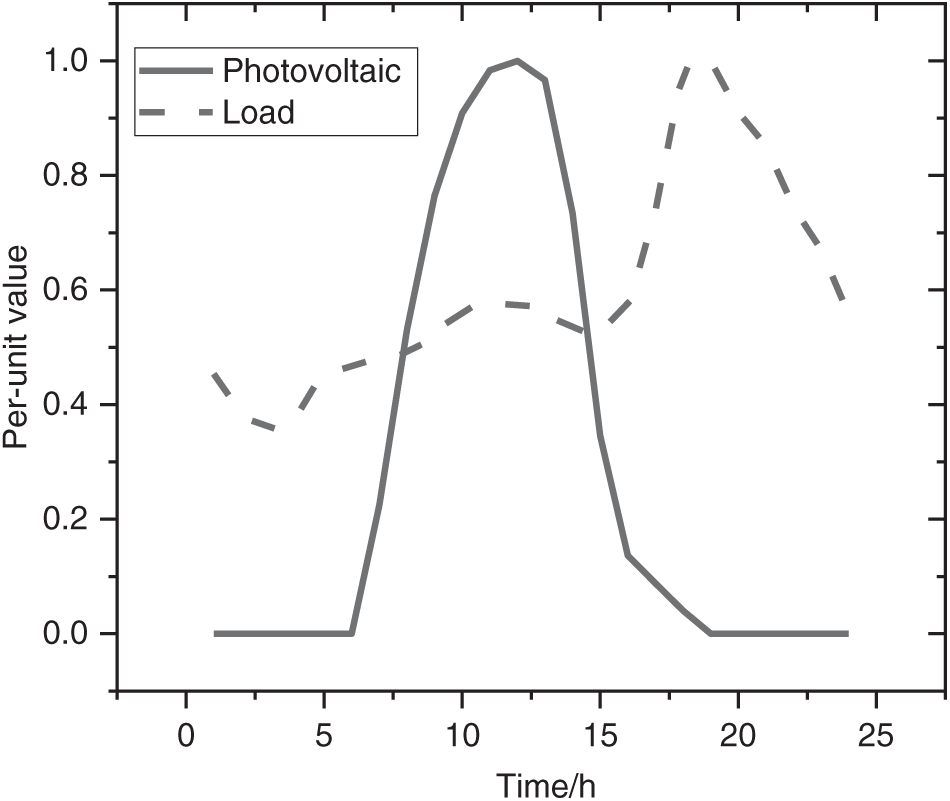
Figure 5: PV and load per unit curve
4.2 Precision Comparison of Distribution Network Classification Methods
To thoroughly validate the classification accuracy, this study utilizes data from 100 distribution networks with known types. These distribution networks include photovoltaic (PV)-dominated distribution networks (Type 1), flexible load-dominated distribution networks (Type 2), charging pile-dominated distribution networks (Type 3), and mixed-scenario distribution networks (Type 4). The classification results were manually labeled by power grid experts based on actual operational data and their professional judgment, which served as the reference for comparison. The dataset includes key variables such as PV output, flexible load characteristics, charging pile load, environmental factors, and climatic conditions. To assess classification performance, this study employs two commonly used accuracy metrics: recall and precision, which are computed using the following formulas:
where R and P are recall rate and accuracy rate, respectively; NT, NS, and NY are respectively the number of correctly classified distribution networks, the total number of actual distribution networks, and the total number of predicted distribution networks. The classification results obtained by the two models are shown in Table 3.

Table 3 presents a comparison of classification accuracy methods for distribution networks, including recall rate and precision, with a multi-dimensional model (Method 1) and a traditional model (Method 2) analyzed. Among the four different types of distribution networks (photovoltaic-dominated, flexible load-dominated, charging pile-dominated, and mixed generation-load-storage distribution networks), Method 1 demonstrates higher classification accuracy. The number of correctly classified instances for Method 1 exceeds that of Method 2 in all distribution network types. For example, in the photovoltaic-dominated distribution network, Method 1 correctly classified 23 instances, while Method 2 classified only 20. For the total of 100 distribution networks, Method 1 correctly classified 92 instances, compared to 78 by the traditional method, showing an advantage of 14 instances. Additionally, recall rate, which measures the proportion of correctly identified actual categories by the model, is consistently higher for Method 1 across all distribution network types. Particularly in the photovoltaic-dominated and flexible load-dominated distribution networks, the recall rate of Method 1 is 92% and 93.33%, respectively, significantly surpassing Method 2’s 80% for both. In the mixed generation-load-storage distribution network type, Method 1’s recall rate also remains high at 92%, compared to 80% for Method 2. Precision, which measures the proportion of correctly predicted instances for a given category, is also generally higher for Method 1. In particular, in the photovoltaic-dominated and flexible load-dominated distribution networks, Method 1’s precision is 95.83% and 96.55%, respectively, considerably higher than Method 2’s 66.67% and 75%. On average, Method 1’s precision exceeds that of Method 2 by 18.18% across all distribution network types, further emphasizing the superiority of the multi-dimensional model in distribution network classification. Overall, the multi-dimensional model (Method 1) shows strong classification ability across all categories, with superior performance in both recall rate and precision. While the traditional model (Method 2) is also capable of classification, its performance in terms of accuracy, recall rate, and precision is inferior to the multi-dimensional model, particularly in terms of recall and precision. This discrepancy can lead to reduced classification accuracy for certain distribution network types, potentially impacting subsequent energy management.
The superior performance of the multidimensional classification model can be attributed to its integration of multiple key features, including PV generation, flexible load regulation capability, and energy storage response dynamics. These features collectively provide a more comprehensive representation of the operational characteristics of distribution networks, thereby enhancing the model’s adaptability to complex power system conditions. Unlike traditional classification models, which typically rely on a single index (e.g., load or generation), the multidimensional model incorporates diverse scenario-specific information. This includes PV-dominated and charging pile load-dominated scenarios, as well as intricate load fluctuation patterns. By capturing these complexities, the model achieves a higher degree of accuracy in scenario identification. Leveraging an extensive set of data features, it demonstrates superior flexibility and adaptability, ensuring reliable classification performance across varying operational conditions. In contrast, conventional models often disregard critical information, limiting their capability to accurately distinguish complex scenarios. This shortcoming underscores the advantage of the multidimensional model in uncovering intricate patterns within the dataset, ultimately improving classification accuracy. The results demonstrate that the multidimensional approach achieves higher recall and precision, making it significantly more effective in recognizing and predicting the operational states of distribution networks. Notably, the model excels in capturing the complex interdependencies among generation, load, and storage—an essential capability in modern power systems. This advantage reinforces its applicability in distribution network classification and highlights its potential to deliver accurate and reliable results across diverse operational environments.
4.3 Comparative Analysis with Traditional Energy Management Strategies
Based on a 21-bus low-voltage distribution network, various operational scenarios were constructed by integrating different load types and proportions at nodes 4, 8, 10, 11, 12, 13, 16, 17, and 20, while maintaining the baseline residential load unchanged. These scenarios simulate diverse operational conditions, capturing the interactions among PV generation, flexible loads, charging pile loads, and energy storage systems. The simulation results, comparing the adaptive multi-objective energy management strategy (Strategy 1) with a traditional fixed-weight strategy (Strategy 2), are presented in Fig. 6. These results illustrate the dynamic optimization capabilities of the proposed strategy across different load distributions and operational conditions.
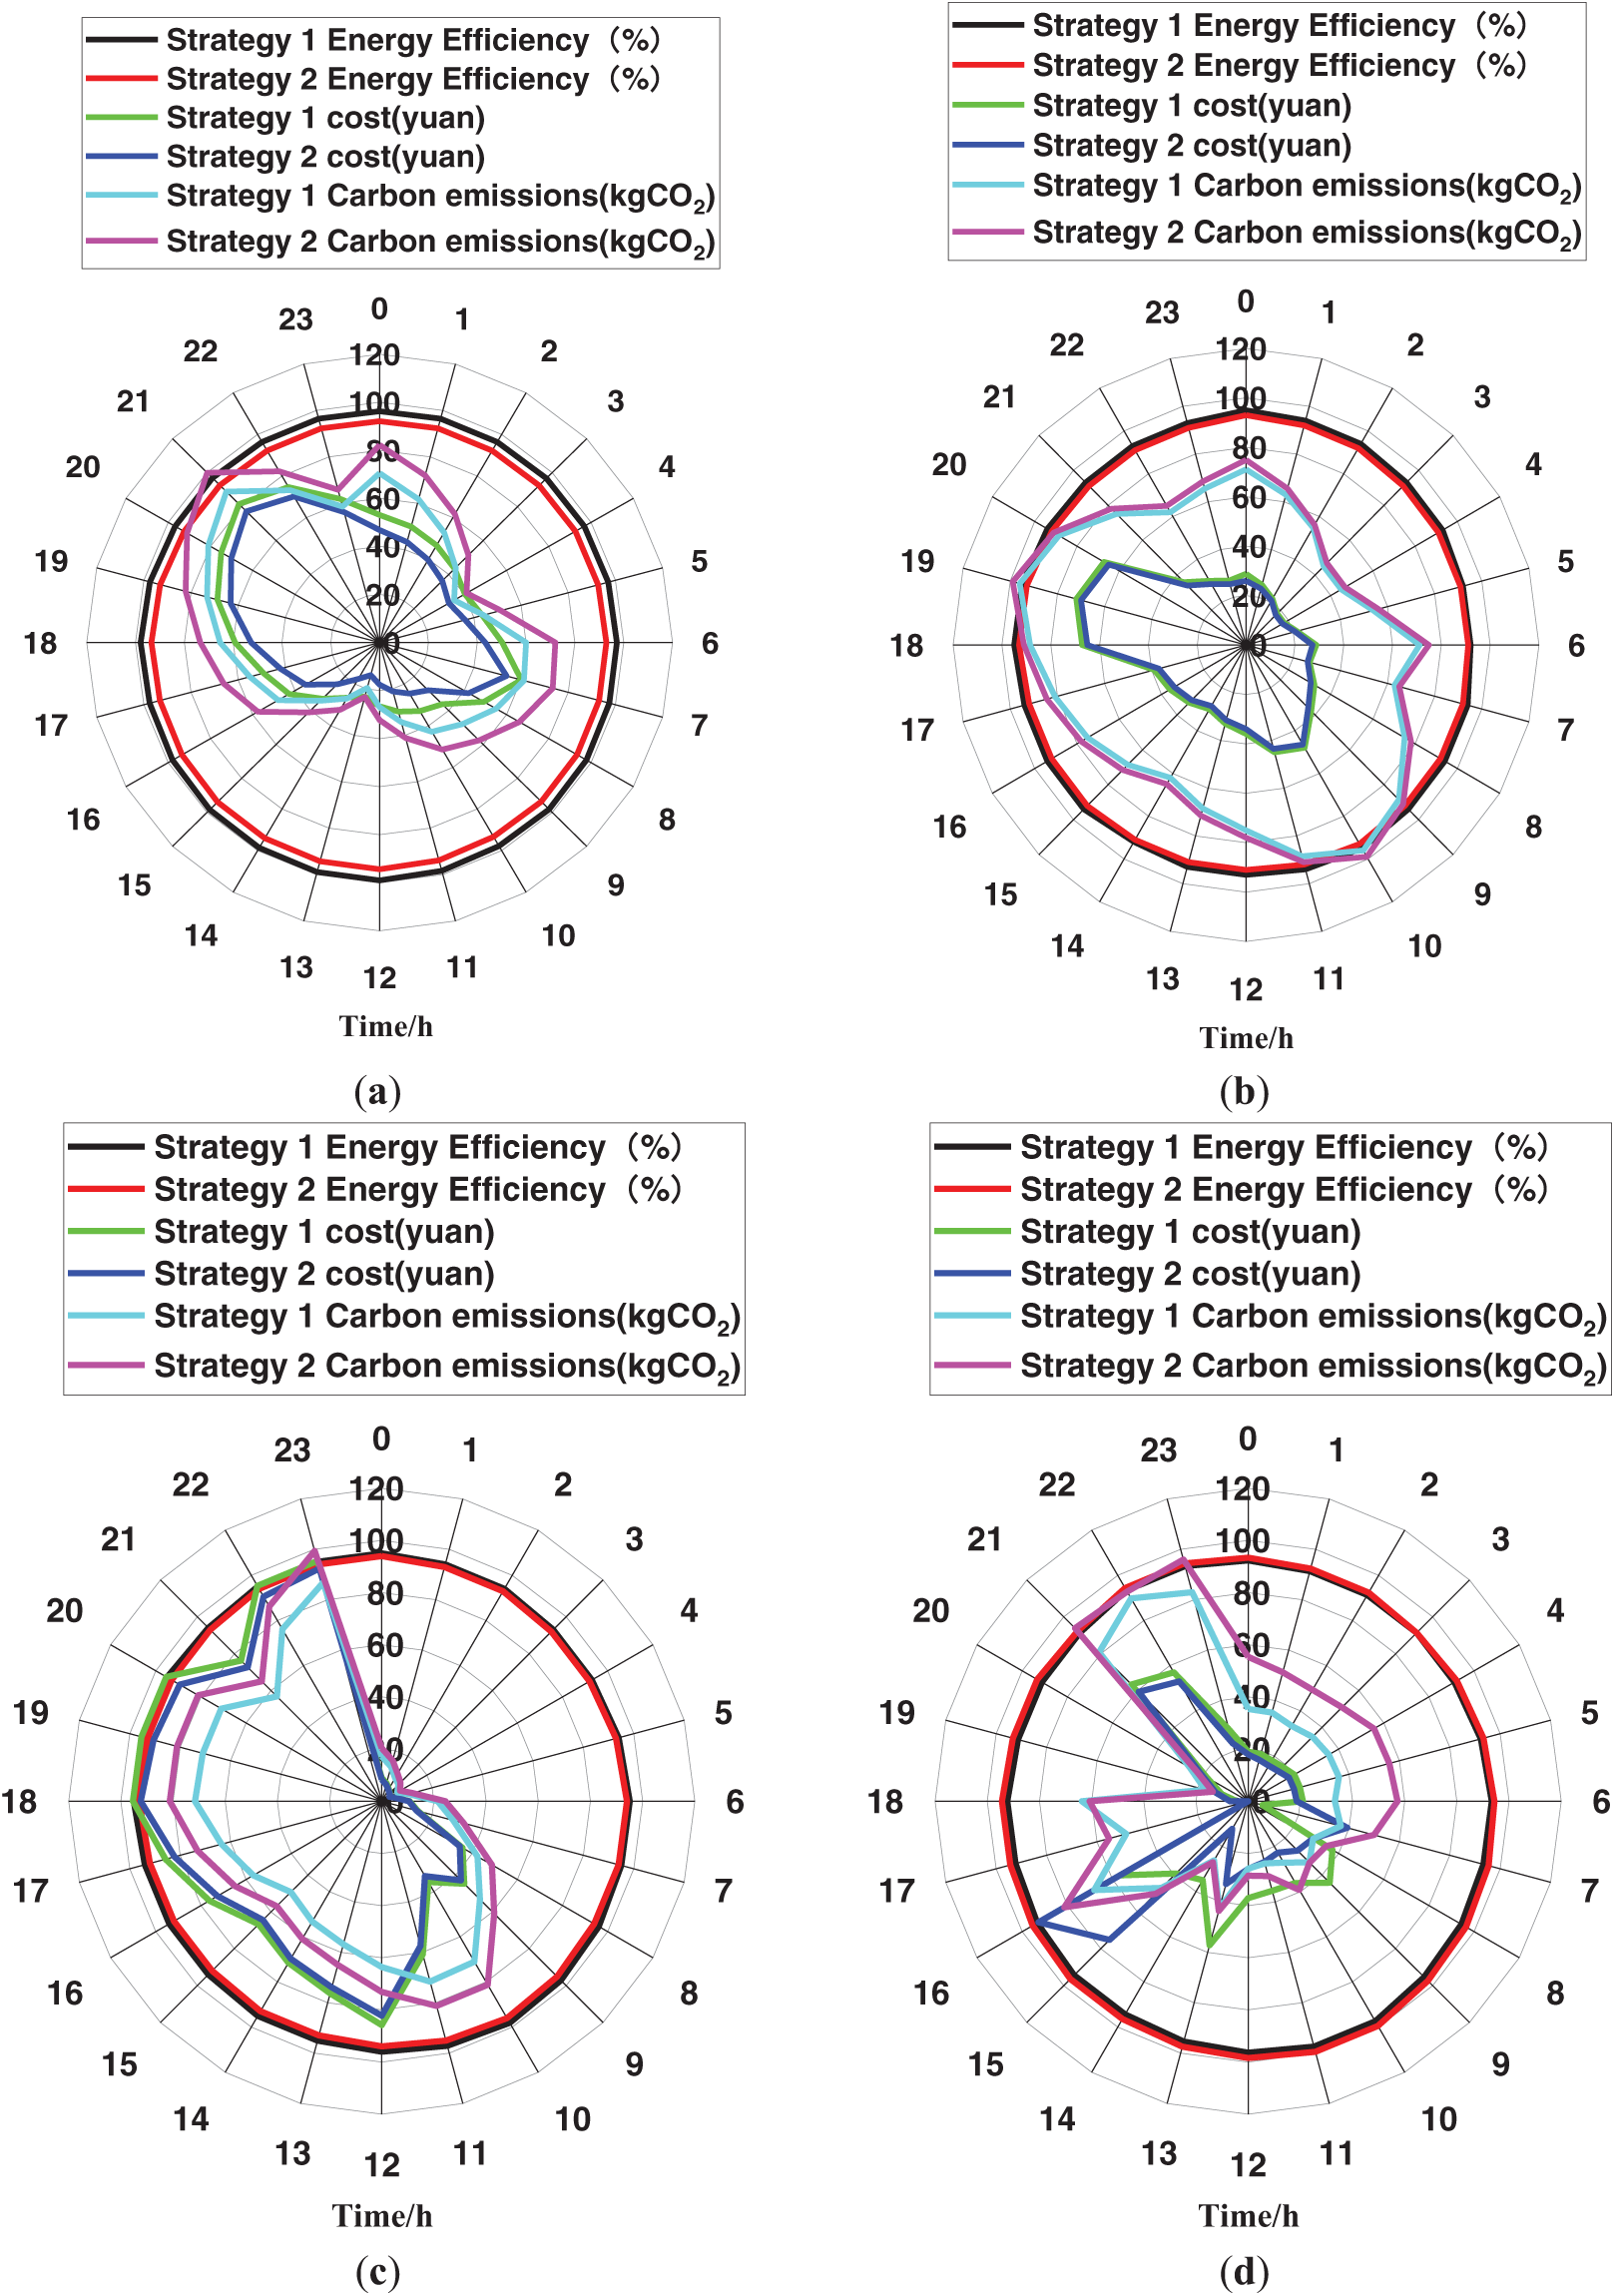
Figure 6: Simulation comparison between Strategy 1 and Strategy 2: PV (a), flexible load (b), charging pile (c), mixed (d)
The analysis of each subfigure in Fig. 6 yields the following insights:
First, PV-Dominated Distribution Networks: PV-dominated networks exhibit distinct operational characteristics, with PV generation contributing 60%–70% of the total daily energy output during peak solar hours (10:00–16:00). Under Strategy 1, energy efficiency reaches an impressive 95%–98%, while carbon emissions remain exceptionally low (below 20 kg/h). However, due to the intermittent nature of PV generation, no electricity is produced at night, necessitating energy storage systems for peak shaving and valley filling. This requirement slightly increases operational costs compared to Strategy 2, leading to marginally lower economic performance.
Second, Flexible Load-Dominated Distribution Networks: Networks dominated by flexible loads are characterized by significant load fluctuations, with peak demand occurring during morning and evening rush hours (6:00–8:00 and 18:00–21:00). Flexible load regulation, which can reach up to 30%, enables Strategy 1 to prioritize daytime load adjustments to enhance energy efficiency and reduce carbon emissions. During nighttime hours, adjustments focus primarily on cost minimization. Overall, Strategy 1 maintains consistently high operational efficiency (not falling below 90%) while effectively mitigating carbon emissions and costs.
Third, Charging-Pile Load-Dominated Distribution Networks: Charging-pile load-dominated networks exhibit pronounced peak charging characteristics, with surging demand during daytime (10:00–16:00) and evening (18:00–21:00) peaks. Strategy 1 dynamically adjusts charging times and storage discharges during peak periods to smooth load fluctuations, thereby significantly alleviating grid stress. This approach enhances energy efficiency and reduces carbon emissions, demonstrating superior adaptability to high-load conditions.
Fourth, Mixed Scenario Distribution Networks: In mixed-scenario networks, where PV generation, flexible load adjustments, and charging-pile loads coexist, the adaptive strategy dynamically adjusts objective weights in real time based on prevailing operational conditions. During daytime hours (10:00–16:00), PV generation is prioritized to supply local loads, while storage systems mitigate peak demands. At night, a combination of flexible load adjustments and storage discharges ensures a balanced optimization across economic, efficiency, and carbon reduction objectives.
In contrast, the fixed-weight strategy maintains constant weight assignments throughout the optimization process (energy efficiency: 0.3, carbon reduction: 0.3, economic performance: 0.4). While this strategy achieves a general equilibrium among objectives, it lacks the responsiveness needed to accommodate dynamic load variations and energy profile changes, particularly in scenarios with significant fluctuations. Consequently, this limitation results in reduced efficiency during nighttime hours and slightly elevated carbon emissions during the day. By contrast, the adaptive multi-objective strategy leverages fuzzy logic control to dynamically adjust objective weights based on real-time load variations, energy distribution, and electricity price fluctuations. This dynamic adaptability ensures optimal responses under varying operational conditions, highlighting the superiority of the proposed strategy in modern distribution network energy management.
The weights output by Strategy 1 at each time step are summarized in Table 4, illustrating its dynamic adjustment capability.

From the analysis of Table 4, it can be observed that the weights generated by Strategy 1 dynamically adjust according to specific scenarios, demonstrating remarkable flexibility. For instance:
First, PV-Dominated Distribution Networks: During daytime, when PV generation peaks, the weights for energy efficiency and carbon reduction are significantly higher. This prioritization maximizes the utilization of clean energy and minimizes carbon emissions. At night, when energy storage discharges to meet demand, the weight for economic performance increases moderately to reduce operating costs.
Second, Flexible Load-Dominated Distribution Networks: During the day, due to substantial load fluctuations, the weights for energy efficiency and carbon reduction are prioritized. Flexible load adjustments help reduce peak loads and optimize energy efficiency. At night, during low electricity price periods, the weight for economic performance rises to minimize power procurement costs.
Third, Charging-Pile Load-Dominated Distribution Networks: During peak charging periods, energy efficiency is emphasized to smooth load spikes, reducing grid stress. Conversely, during off-peak nighttime periods, economic performance becomes the dominant objective to optimize charging costs.
Fourth, Mixed Scenario Distribution Networks: Incorporating the characteristics of PV generation, flexible loads, and charging-pile loads, the adaptive algorithm dynamically adjusts weights in real time, responding flexibly to complex changes. The seamless transition of weights ensures that the overall operational performance, including energy efficiency, carbon reduction, and economic objectives, is comprehensively optimized.
Overall, the flexibility and scenario adaptability of Strategy 1 significantly enhance the comprehensive performance of the system. This is particularly evident in distribution networks with substantial load fluctuations or complex scenarios, where Strategy 1 demonstrates superior capabilities.
In the adaptive multi-objective energy management strategy, fuzzy logic control dynamically adjusts the weights for energy efficiency, carbon reduction, and economic performance to achieve a balanced optimization across these objectives. Compared to fixed-weight strategies, this dynamic weight adjustment mechanism demonstrates distinct advantages under different scenarios. For instance, the adaptive strategy excels in PV-dominated, mixed-scenario, charging-pile-dominated, and flexible-load-dominated distribution networks. Its real-time weight adjustment ensures optimal performance in all cases, particularly in terms of energy efficiency, carbon reduction, and cost optimization. The overall comparison results across all distribution networks are presented in Fig. 7, highlighting the superior adaptability and optimization capabilities of the adaptive strategy over the fixed-weight approach.
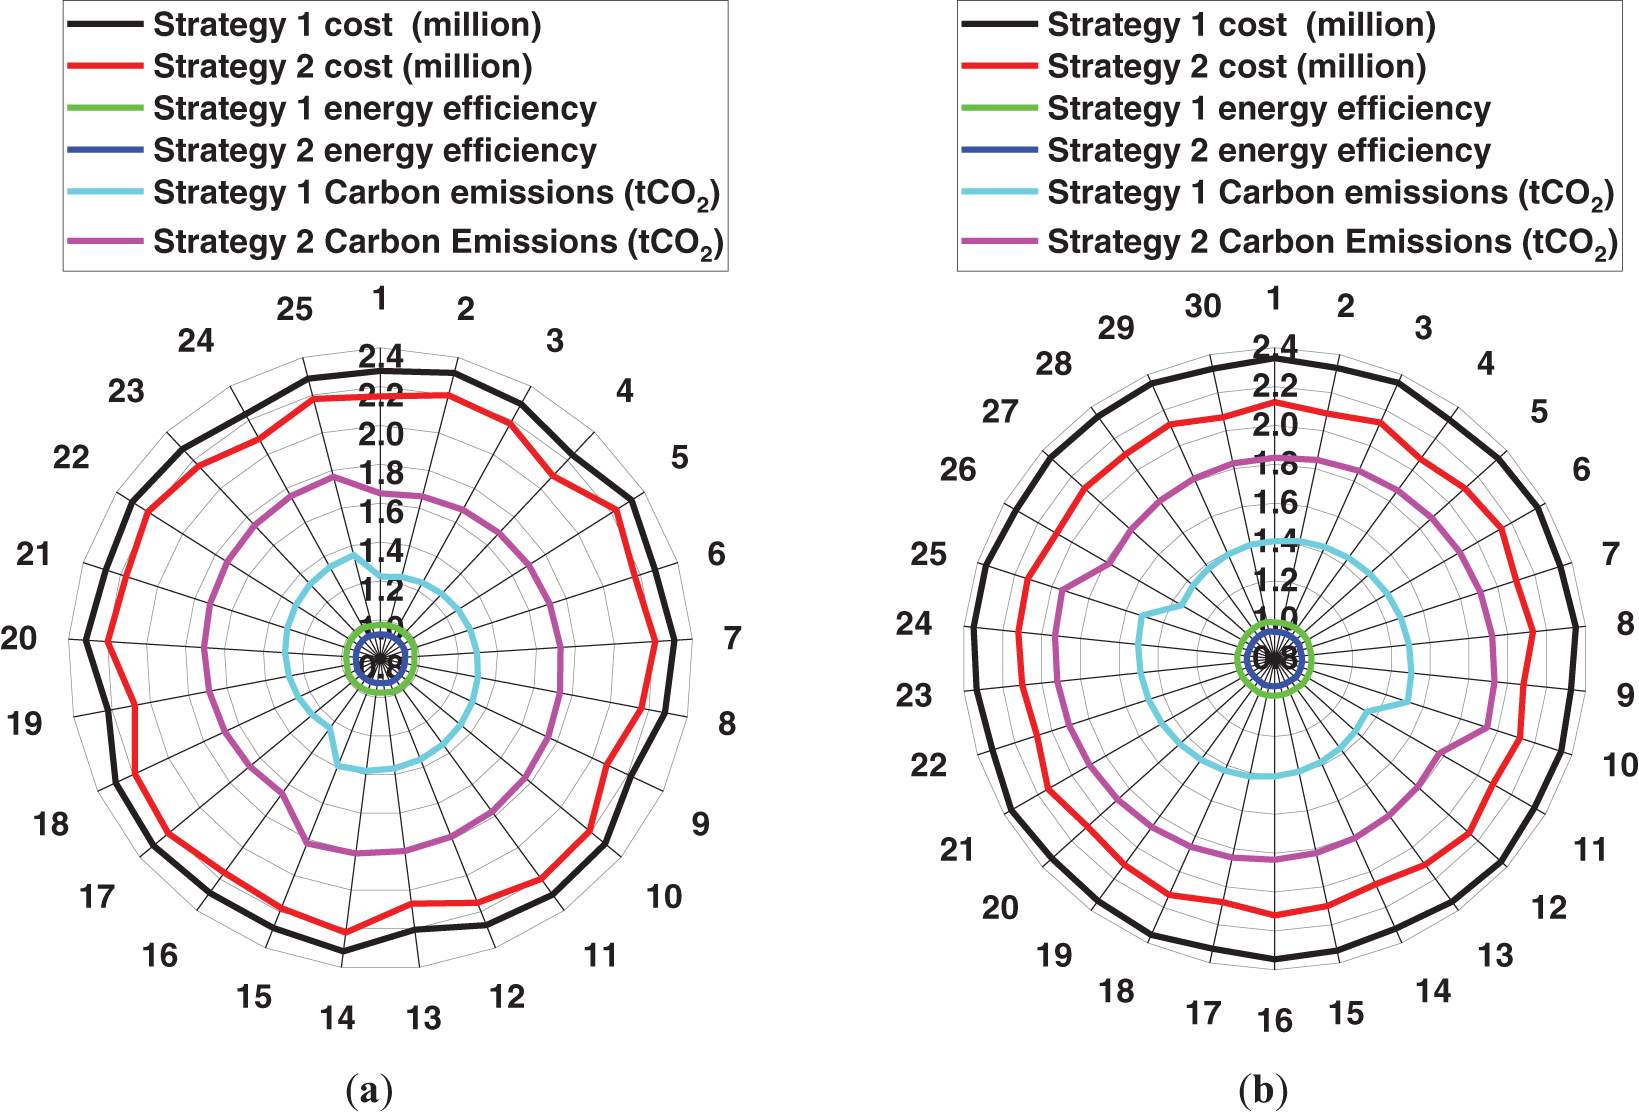
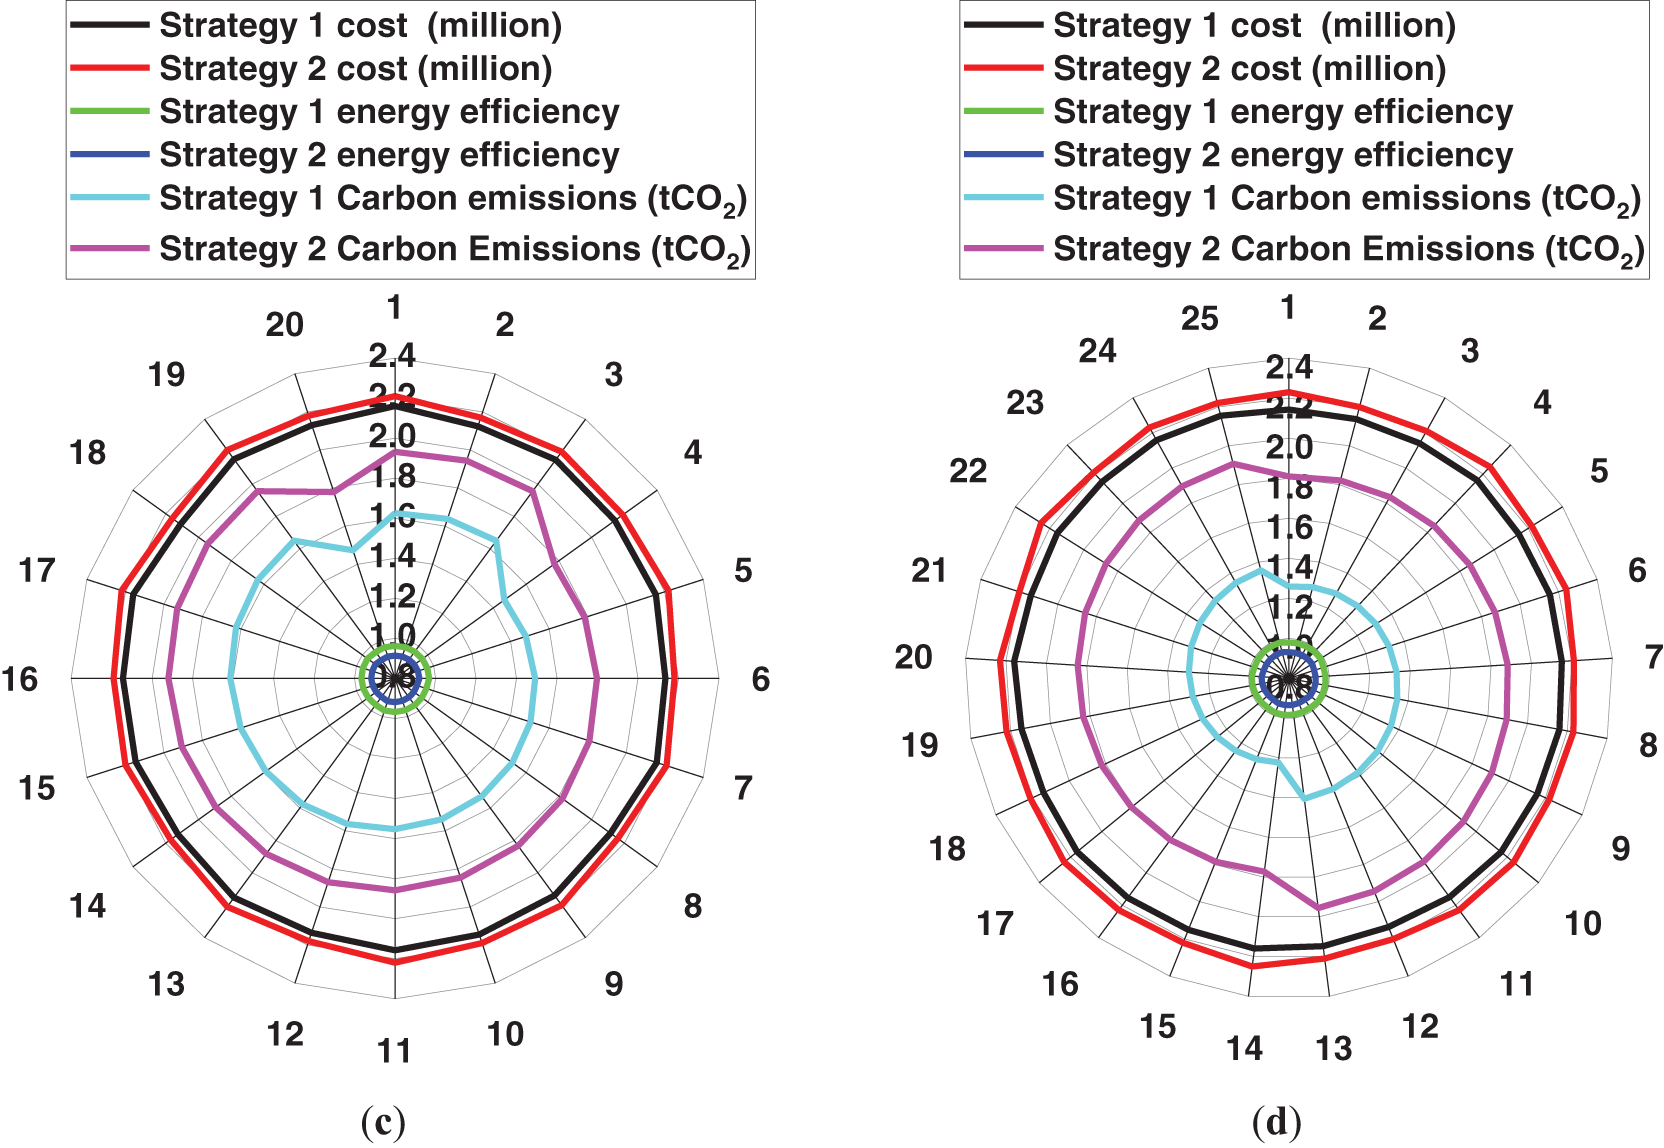
Figure 7: Strategy 1 and Strategy 2 comparison effect: PV (a), flexible load (b), charging pile (c), mixed (d)
Fig. 7 demonstrates that the adaptive multi-objective energy management strategy outperforms the fixed-weight strategy in terms of energy efficiency and carbon reduction. This superiority stems from the adaptive strategy’s ability to dynamically adjust objective weights in response to real-time operational conditions. By optimizing the utilization of renewable energy, reducing grid electricity purchases, and minimizing carbon emissions, the adaptive strategy is particularly effective in scenarios with a high penetration of distributed energy resources. However, in terms of economic performance, the fixed-weight strategy exhibits a slight advantage over the adaptive strategy in relatively simple scenarios, such as PV-dominated and flexible-load-dominated networks. These scenarios are characterized by stable PV generation and predictable load adjustments, allowing the fixed-weight strategy to achieve cost reductions through conventional optimization techniques. In contrast, the adaptive multi-objective energy management strategy demonstrates superior economic performance in charging-pile-dominated and mixed-scenario networks. This advantage arises from its dynamic scheduling mechanism, which effectively responds to load fluctuations and optimizes resource allocation. Consequently, while the fixed-weight strategy is more suitable for simpler and more stable operating conditions, the adaptive strategy exhibits greater overall optimization capability in complex and dynamic scenarios.
The total operational costs for both strategies under various distribution network scenarios are presented in Table 5.

Table 5 highlights the differences in cost performance between the adaptive and fixed-weight strategies across various scenarios. In PV-dominated and flexible-load-dominated networks, the fixed-weight strategy effectively reduces operational costs, with the maximum reduction reaching 9.99%.
First, PV-Dominated Networks: The high PV generation output enables a direct reduction in grid electricity purchases. While the adaptive strategy dynamically adjusts operational schedules, it may introduce unnecessary scheduling complexity and computational overhead, such as engaging energy storage systems (ESS) in charge-discharge operations when they are not essential. In scenarios with stable PV output and electricity prices, the fixed-weight strategy efficiently leverages straightforward scheduling based solely on PV generation, thereby minimizing computational complexity and overall costs.
Second, Flexible-Load-Dominated Networks: The fixed-weight strategy effectively simplifies demand-response scheduling, avoiding the computational burden of dynamic adjustments. This streamlined approach directly reduces system costs while maintaining operational reliability. Conversely, in charging-pile-dominated and mixed-scenario networks, the adaptive strategy exhibits superior cost-reduction capabilities, achieving a maximum reduction of 7.42%.
Third, Charging-Pile-Dominated Networks: The high variability in electric vehicle (EV) charging demand introduces significant load volatility. The fixed-weight strategy, constrained by its inability to respond dynamically to fluctuations in load and electricity prices, often results in peak-period charging, leading to increased system costs. In contrast, the adaptive strategy continuously adjusts charging schedules based on real-time electricity prices and grid conditions, prioritizing off-peak charging to enhance economic performance.
Fourth, Mixed-Scenario Networks: These networks require coordinated optimization of PV generation, ESS, flexible loads, and charging-pile loads. The static weighting approach of the fixed-weight strategy lacks the flexibility to accommodate the complexity of such multi-resource scheduling, often leading to suboptimal resource utilization or increased costs. In contrast, the adaptive strategy dynamically reallocates resources, reducing grid electricity consumption and minimizing energy waste, thereby achieving superior economic performance.
The average energy efficiency pairs of the adaptive strategy and the fixed weight strategy in different scenarios are shown in Table 6.
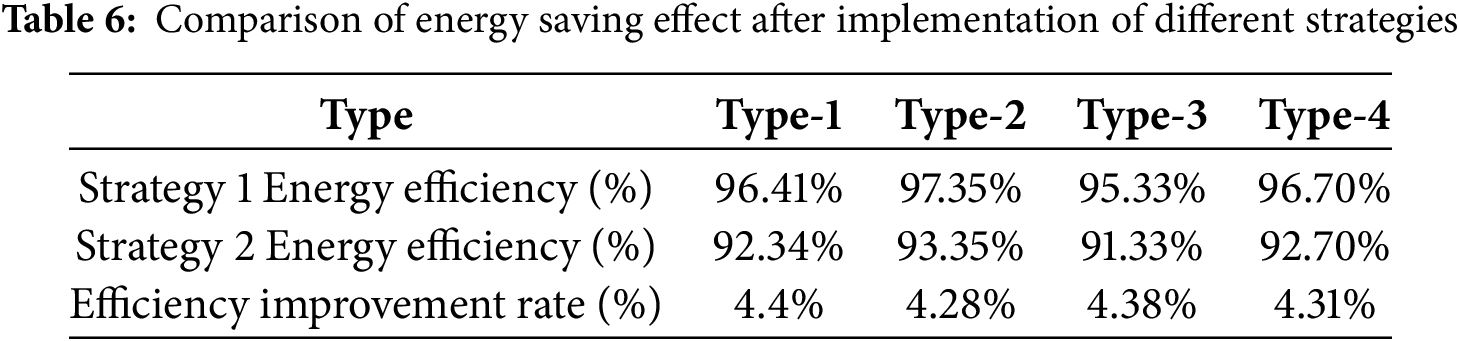
The analysis of Table 6 indicates that the implementation of the adaptive strategy has led to an overall improvement in the energy efficiency of the distribution network across various scenarios, with an increase of over 4%. This improvement is primarily attributed to the adaptive strategy’s capability to dynamically coordinate the operation of PV generation, ESS, flexible loads, and charging piles. By effectively mitigating resource conflicts and minimizing energy wastage, the strategy ensures optimal energy utilization. Additionally, the adaptive strategy enhances the load profile through peak shaving, valley filling, and load shifting, thereby reducing energy losses and transmission inefficiencies during power flow.
The total carbon emission pairs of the distribution network under different scenarios based on the adaptive strategy and the fixed weight strategy are shown in Table 7.

As shown in Table 7, the adaptive strategy demonstrates significant carbon reduction effects across all scenarios compared to the fixed-weight strategy. Among them, the photovoltaic (PV)-dominated distribution network exhibits the highest carbon emission reduction rate, reaching 24.50%, while the charging-pile-dominated network shows the lowest reduction rate at 16.33%, with an overall average reduction of 20.94%. The superior performance in PV-dominated networks is primarily due to the high penetration of renewable energy, which significantly reduces reliance on traditional fossil fuels and enhances energy utilization efficiency. Conversely, in charging-pile-dominated networks, carbon emissions remain relatively high due to the presence of high-energy-consumption equipment. Nevertheless, the adaptive strategy still achieves substantial carbon reduction, demonstrating its effectiveness in optimizing energy consumption and reducing environmental impact.
Considering the differentiated needs of new source load distribution networks with a high proportion, this paper proposes a multi-dimensional scenario classification method and an adaptive multi-objective energy management strategy and conducts simulation analysis. The following conclusions are obtained:
First, this paper introduces multiple dimensions such as seasonality, time period, and climate conditions. Combined with expert experience to optimize and adjust, it proposes a multi-dimensional scene classification method. Compared with the traditional single-index classification method, the accuracy rate of the proposed method is increased by 18.18% on average.
Second, in this paper, fuzzy logic control is used for weight optimization, and an adaptive multi-objective energy management strategy considering dynamic changes in target weights is proposed. Compared with the fixed weight strategy, the energy saving and low carbon of the proposed strategy are respectively improved by 4.34% and 20.94% on average.
Although the proposed scenario classification method demonstrates satisfactory performance in terms of classification accuracy and strategy adaptability, certain limitations remain. First, the adaptability of the current method to complex load conditions and diverse energy structures requires further improvement. In highly dynamic environments, the existing classification model may fail to accurately reflect real-time variations in loads and energy generation. Second, the method does not account for all potential external factors, such as climate variations or unforeseen events, which may lead to suboptimal performance in specific scenarios. Therefore, future research should focus on enhancing the granularity of scenario classification, exploring real-time data updating mechanisms, and integrating artificial intelligence techniques to improve classification accuracy and strategy adaptability further. Additionally, optimizing the existing strategy is crucial, particularly for scenarios with complex loads and diverse energy structures. Developing more generalized and robust optimization algorithms will be essential to address the increasingly complex and dynamic operating conditions of distribution networks.
Acknowledgement: Not applicable.
Funding Statement: This paper is supported by the Science and Technology Project of the Headquarters of the State Grid Corporation (project code: 5400-202323233A-1-1-ZN).
Author Contributions: The authors confirm contribution to the paper as follows: study conception and design: Huang Tan, Haibo Yu; data collection: Tianyang Chen; analysis and interpretation of results: Haibo Yu, Tianyang Chen, Hanjun Deng; draft manuscript preparation: Hanjun Deng, Yetong Hu. All authors reviewed the results and approved the final version of the manuscript.
Availability of Data and Materials: The datasets generated and/or analyzed during the current study are not publicly available due to input data used comes from the actual operation data of the distribution network and has certain confidentiality, but are available from the corresponding author on reasonable request.
Ethics Approval: Not applicable.
Conflicts of Interest: The authors declare no conflicts of interest to report regarding the present study.
References
1. Liu L, Zhai R, Xu Y, Hu Y, Liu S, Yang L. Comprehensive sustainability assessment and multi-objective optimization of a novel renewable energy driven multi-energy supply system. Appl Therm Eng. 2024;236(4):121461. doi:10.1016/j.applthermaleng.2023.121461. [Google Scholar] [CrossRef]
2. Qu Z, Xu C, Yang F, Ling F, Pirouzi S. Market clearing price-based energy management of grid-connected renewable energy hubs including flexible sources according to thermal, hydrogen, and compressed air storage systems. J Energy Storage. 2023;69(2):107981. doi:10.1016/j.est.2023.107981. [Google Scholar] [CrossRef]
3. Akbari E, Mousavi SSF, Pirouzi S, Jadidoleslam M. Network flexibility regulation by renewable energy hubs using flexibility pricing-based energy management. Renew Energy. 2023;206(3):295–308. doi:10.1016/j.renene.2023.02.050. [Google Scholar] [CrossRef]
4. Tripathi S, Shrivastava A, Jana KC. An efficient energy management system for a micro-grid system considering the volatility of hybrid renewable energy. Int J Hydrogen Energy. 2025;101(2):673–91. doi:10.1016/j.ijhydene.2024.12.260. [Google Scholar] [CrossRef]
5. Mukundufite F, Bikorimana JMV, Lugatona AK. Smart micro grid energy system management based on optimum running cost for rural communities in Rwanda. Energy Eng. 2024;121(7):1805–21. doi:10.32604/ee.2024.051398. [Google Scholar] [CrossRef]
6. Hua W, Jiang J, Sun H, Wu J. A blockchain based peer-to-peer trading framework integrating energy and carbon markets. Appl Energy. 2020;279(7774):115539. doi:10.1016/j.apenergy.2020.115539. [Google Scholar] [CrossRef]
7. Yu Z, Yue S, Hill DJ, Ke M. Online distributed MPC-based optimal scheduling for EV charging stations in distribution systems. IEEE Trans Ind Inform. 2019;15(2):638–49. doi:10.1109/TII.2018.2812755. [Google Scholar] [CrossRef]
8. Modu B, Abdullah MP, Bukar AL, Hamza MF. A systematic review of hybrid renewable energy systems with hydrogen storage: sizing, optimization, and energy management strategy. Int J Hydrogen Energy. 2023;48(97):38354–73. doi:10.1016/j.ijhydene.2023.06.126. [Google Scholar] [CrossRef]
9. Feng P, He X. Mixed neurodynamic optimization for the operation of multiple energy systems considering economic and environmental aspects. Energy. 2021;232(1):120965. doi:10.1016/j.energy.2021.120965. [Google Scholar] [CrossRef]
10. Azizivahed A, Arefi A, Ghavidel S, Shafie-khah M, Li L, Zhang J, et al. Energy management strategy in dynamic distribution network reconfiguration considering renewable energy resources and storage. IEEE Trans Sustain Energy. 2020;11(2):662–73. doi:10.1109/TSTE.2019.2901429. [Google Scholar] [CrossRef]
11. Stefenon SF, Yow K, Nied A, Meyer LH. Classification of distribution power grid structures using inception v3 deep neural network. Electr Eng. 2022;104(6):4557–69. doi:10.1007/s00202-022-01641-1. [Google Scholar] [CrossRef]
12. Stefenon SF, Singh G, Yow K, Cimatti A. Semi-ProtoPNet deep neural network for the classification of defective power grid distribution structures. Sensors. 2022;22(13):4859. doi:10.3390/s22134859. [Google Scholar] [PubMed] [CrossRef]
13. Tosserams S, Etman LFP, Rooda JE. A classification of methods for distributed system optimization based on formulation structure. Struct Multidiscip Optim. 2009;39(5):503–17. doi:10.1007/s00158-008-0347-z. [Google Scholar] [CrossRef]
14. Patel J, Choi S. Classification approach for reliability-based topology optimization using probabilistic neural networks. Struct Multidiscip Optim. 2012;45(4):529–43. doi:10.1007/s00158-011-0711-2. [Google Scholar] [CrossRef]
15. Mutanen A, Ruska M, Repo S, Jarventausta P. Customer classification and load profiling method for distribution systems. IEEE Trans Power Deliv. 2011;26(3):1755–63. doi:10.1109/TPWRD.2011.2142198. [Google Scholar] [CrossRef]
16. Li J, Li J, Wang D, Mao C, Guan Z, Liu Z, et al. Hierarchical and partitioned planning strategy for closed-loop devices in low-voltage distribution network based on improved K-Means partition method. Energy Rep. 2023;9(8):477–85. doi:10.1016/j.egyr.2023.05.161. [Google Scholar] [CrossRef]
17. Ma T, Wu J, Hao L, Lee W, Yan H, Li D. The optimal structure planning and energy management strategies of smart multi energy systems. Energy. 2018;160(14):122–41. doi:10.1016/j.energy.2018.06.198. [Google Scholar] [CrossRef]
18. Zhao Z, Guo J, Luo X, Lai C, Yang P, Lai L, et al. Distributed robust model predictive control-based energy management strategy for islanded multi-microgrids considering uncertainty. IEEE Trans Smart Grid. 2022;13(3):2107–20. doi:10.1109/TSG.2022.3147370. [Google Scholar] [CrossRef]
19. Hai T, Singh NSS, Jamal F. Energy management of a microgrid with integration of renewable energy sources considering energy storage systems with electricity price. J Energy Storage. 2025;110(16):115191. doi:10.1016/j.est.2024.115191. [Google Scholar] [CrossRef]
20. Lyu C, Zhang Y, Bai Y, Yang K, Song Z, Ma Y, et al. Inner-outer layer co-optimization of sizing and energy management for renewable energy microgrid with storage. Appl Energy. 2024;363(3):123066. doi:10.1016/j.apenergy.2024.123066. [Google Scholar] [CrossRef]
21. Cheng Y, Zhang N, Wang Y, Yang J, Kang C, Xia Q. Modeling carbon emission flow in multiple energy systems. IEEE Trans Smart Grid. 2019;10(4):3562–74. doi:10.1109/TSG.2018.2830775. [Google Scholar] [CrossRef]
22. He L, Lu Z, Geng L, Zhang J, Li X, Guo X. Environmental economic dispatch of integrated regional energy system considering integrated demand response. Int J Electr Power Energy Syst. 2020;116(7):105525. doi:10.1016/j.ijepes.2019.105525. [Google Scholar] [CrossRef]
23. Liang H, Pirouzi S. Energy management system based on economic Flexi-reliable operation for the smart distribution network including integrated energy system of hydrogen storage and renewable sources. Energy. 2024;293(49):130745. doi:10.1016/j.energy.2024.130745. [Google Scholar] [CrossRef]
24. Hua L, Alghamdi H, Hafeez G, Ali S, Khan FA, Khan MI, et al. Optimal energy management via day-ahead scheduling considering renewable energy and demand response in smart grids. ISA Trans. 2024;154(1):268–84. doi:10.1016/j.isatra.2024.08.032. [Google Scholar] [PubMed] [CrossRef]
25. Fan G, Liu Z, Liu X, Shi Y, Wu D, Guo J, et al. Energy management strategies and multi-objective optimization of a near-zero energy community energy supply system combined with hybrid energy storage. Sustain Cities Soc. 2022;83(4):103970. doi:10.1016/j.scs.2022.103970. [Google Scholar] [CrossRef]
26. Zhang X, Yu X, Ye X, Pirouzi S. Economic energy management of networked flexi-renewable energy hubs according to uncertainty modeling by the unscented transformation method. Energy. 2023;278(2):128054. doi:10.1016/j.energy.2023.128054. [Google Scholar] [CrossRef]
27. Ohirul Q, Iftekhar A, Daryoush H, Mohammad ASM. Forecasting data-driven system strength level for inverter-based resources-integrated weak grid systems using multi-objective machine learning algorithms. Electr Power Syst Res. 2025;238:111112. doi:10.1016/j.epsr.2024.111112. [Google Scholar] [CrossRef]
28. Kuriakose E, Aziz A, Qays MO, Hossain ML, Hasan R, Sohan MR. Resiliency measurement framework for distributed energy resource integrated distribution networks. In: 2024 International Conference on Advances in Computing, Communication, Electrical, and Smart Systems (iCACCESS); 2024 Mar 8–9; Dhaka, Bangladesh. p. 1–6. doi:10.1109/iCACCESS61735.2024.10499458. [Google Scholar] [CrossRef]
29. Shrivastava P, Bhoyar KK, Zadgaonkar AS. A novel approach to scene classification using K-means clustering. Int J Comput Appl. 2015;125(14):33–9. doi:10.5120/ijca2015906268. [Google Scholar] [CrossRef]
30. Li Z, Su S, Zhao Y, Jin X, Chen H, Li Y, et al. Energy management strategy of active distribution network with integrated distributed wind power and smart buildings. IET Renew Power Gener. 2020;14(12):2255–67. doi:10.1049/iet-rpg.2020.0049. [Google Scholar] [CrossRef]
Cite This Article
 Copyright © 2025 The Author(s). Published by Tech Science Press.
This work is licensed under a Creative Commons Attribution 4.0 International License , which permits unrestricted use, distribution, and reproduction in any medium, provided the original work is properly cited.
 Downloads
 Citation Tools