
 Submit a Paper
 Propose a Special lssue
 Open Access
ARTICLE

Experimental and Numerical Simulation Research on Aerodynamic Field of Integrated Exhaust End of Natural Gas Distributed Energy Station
1 School of Energy and Power Engineering, Qilu University of Technology (Shandong Academy of Sciences), Jinan, 250353, China
2 Shandong Engineering Research Center for High-Efficiency Energy Storage and Hydrogen Energy Utilization, School of Energy and Power Engineering, Shandong University, Jinan, 250061, China
* Corresponding Author: Shen Cheng. Email:
Energy Engineering 2025, 122(6), 2309-2335. https://doi.org/10.32604/ee.2025.062216
Received 12 December 2024; Accepted 05 March 2025; Issue published 29 May 2025
 View Full Text
 Download PDF
Abstract
In view of the situation of multi-temperature, multi-medium and multi-discharge equipment on the integrated exhaust end platform of a natural gas distributed energy station, which is compact in layout, mutual influence, complex aerodynamic field and complex heat and mass transfer field, the temperature field and aerodynamic field of the platform were comprehensively studied through field experiments and numerical simulation. The research results show that the high temperature flue gas discharged from the chimney is hindered by the chimney cap and returns downward. The noise reduction walls around the chimney make the top of the platform pressurized under the crosswind, as a result, the inlet air temperature of each cooling equipment is generally higher than the ambient temperature, and the cooling efficiency is extremely low. According to the numerical simulation results, the effect of hot gas recirculation is intensified by the ambient crosswind. With the increase of the ambient crosswind, the flue gases coverage expands. The influence of ambient crosswind on inlet air temperature first increases and then decreases within the range of 1–8 m/s, showing a nearly normal distribution. Secondly, this study innovatively designed a new V-shaped chimney cap, compared with the A-shaped chimney cap, the new chimney cap effectively reduces its own obstruction to the smoke and changes the flow path of the smoke. After the smoke rises for a certain distance, the smoke returns downward, which effectively reduces the temperature of the smoke and thus reduces its impact on the air inlet of the cooling equipment. On-site measurement found that the cooling efficiency of various cooling equipment has increased by an average of 27.3% compared to before the renovation, and centrifuge’s refrigeration capacity increased by 0.78 GJ/h.Keywords
Natural gas distributed energy refers to the use of natural gas as fuel, through the cold and thermal power triple supply and other ways to achieve the cascade utilization of energy, comprehensive energy utilization efficiency of more than 70%, and in the load center nearby to achieve energy supply of modern energy supply mode, is an important way of efficient use of natural gas [1,2]. The distributed energy system has many advantages. First of all, compared with traditional thermal power plants, the distributed energy system is close to the user end, which can give priority to meeting the energy needs of local users and reduce the long-distance transmission consumption. Secondly, the distributed energy system follows the principle of “temperature matching, step utilization”, and produces electricity, cold and heat in turn according to the grade of combustion products, achieving a high utilization rate of energy [3,4]. Natural gas distributed energy technology has gradually become a development trend in the world energy field [5]. In recent years, China’s natural gas production and import volume have been growing rapidly, which coincides with China’s dual-carbon target, and it is more suitable for large-scale natural gas cogeneration of cold, heat and electricity [6,7].
Due to natural gas distributed energy projects are mostly located in commercial dense areas, universities or large parks, land resources are limited, and the requirements of noise controlling level are high, therefore, heat dissipation equipment, chimneys, ventilation device and other facilities are mostly placed on the roof of the building and arranged in a compact way. Resulting in heat removal equipment and cooling equipment exhaust air interaction phenomenon of complex aerodynamic field, mass and heat transfer field complex, under the effect of crosswinds, prominent bottleneck problems such as hot gas recirculation, vortices, air short circuits, and wind cap effects caused by noise reduction walls occur.
At present, many scholars have used experimental or numerical simulation methods to carry out relevant research on the cooling process and the outflow field in the mechanical draft cross-flow cooling towers (MDCCT), including the filling arrangement, thermal resistance characteristics between different filling, the influence of crosswind, and the position of fans. Suranjan et al. [8] conducted experiments on four kinds of filling with different air-water ratios, and determined the corresponding air-water ratios of each type of filling when they perform best. Zhao et al. [9] conducted experimental and comparative study on the thermal resistance characteristics of 6 different types of filling, and determined the empirical formula of the thermal resistance characteristics of different fillings. Zhang et al. [10] studied the aerodynamic and temperature field characteristics in the tower under different fan positions, and finally proposed a scheme to solve the adverse effects of environmental crosswind from the optimization of fan positions. Wang et al. [11] used deflector plate to reduce the adverse effects of crosswind on cooling towers (CT). Shirazi [12] solved the problems caused by crosswind by introducing three new types of internal windbreak walls. Deng did a lot of research on the MDCCT through experiments and numerical analysis. The CT’s ventilation and heat dissipation performance were improved by installing air intake shutters and adjusting their angle [13], controlled the return flow of air from the tower by increasing the fan height [14], and studied the performance changes of the CT under different crosswind angles [15,16]. Some scholars have also carried out research on obstacles around towers and tower spacing, etc. Jiang et al. [17] studied the influence of noise reduction barriers and shutters on ventilation and thermal performance of CT under crosswind conditions. Lee et al. [18] used numerical simulation to analyze the height of obstacles, the distance between CT and obstacles, and the influence of front and rear obstacles on the outer plume of CT. Ma [19] found through the experiment that as the distance between CT increases, the interaction between the towers decreases, and the difference in cooling performance between the two towers reduces.
References [8–12] primarily focus on the optimization of packing arrangements and fan configurations for individual cooling towers, while this study examines the interactions between multiple cooling towers and heat dissipation equipment. References [13–16] mainly investigate cooling tower ventilation and louver optimization under different wind directions, whereas this study further explores the combined effects of cooling towers, chimneys, radiators, and other equipment, as well as the extent of thermal recirculation under the influence of crosswinds. References [17–19] study the impact of tower spacing and surrounding obstacles but do not address the aerodynamic and thermal recirculation phenomena in integrated heat dissipation systems. Additionally, some scholars [20,21] have examined the effect of chimney height on flue gas dispersion. Cuce et al. [20] developed a three-dimensional axisymmetric CFD model and comprehensively analyzed the potential impact of chimney height on key performance parameters of solar power plants. Teng et al. [21] determined the environmental impact of uranium elements in waste gas emissions from chimneys at different heights. However, research on optimizing chimney cap designs to mitigate hot air recirculation and reduce wind cover effects is lacking.
To date, most research has focused on large dry cooling towers or individual small cross-flow cooling towers. However, in high-density urban environments and modular cooling systems, the layout and operational optimization of small MDCCTs are of significant value for improving cooling efficiency and achieving energy conservation and emission reduction. This study fills this gap.
The building type natural gas distributed energy system involved in this paper is an energy supply system which uses the internal combustion engine as the prime mover, the flue gas hot water lithium bromide unit as the waste heat utilization equipment to produce hot and cold water, and directly outputs hot (cold) energy and electric energy to the building users in a certain area through the co-generation of cold and heat, as shown in Fig. 1. In the energy station, three gas hot water lithium bromide cold and hot water units and three gas internal combustion generating units are in one-to-one configuration, and the high temperature liner water and waste heat gas of the gas internal combustion engine are used to enter the lithium bromide unit for energy production.
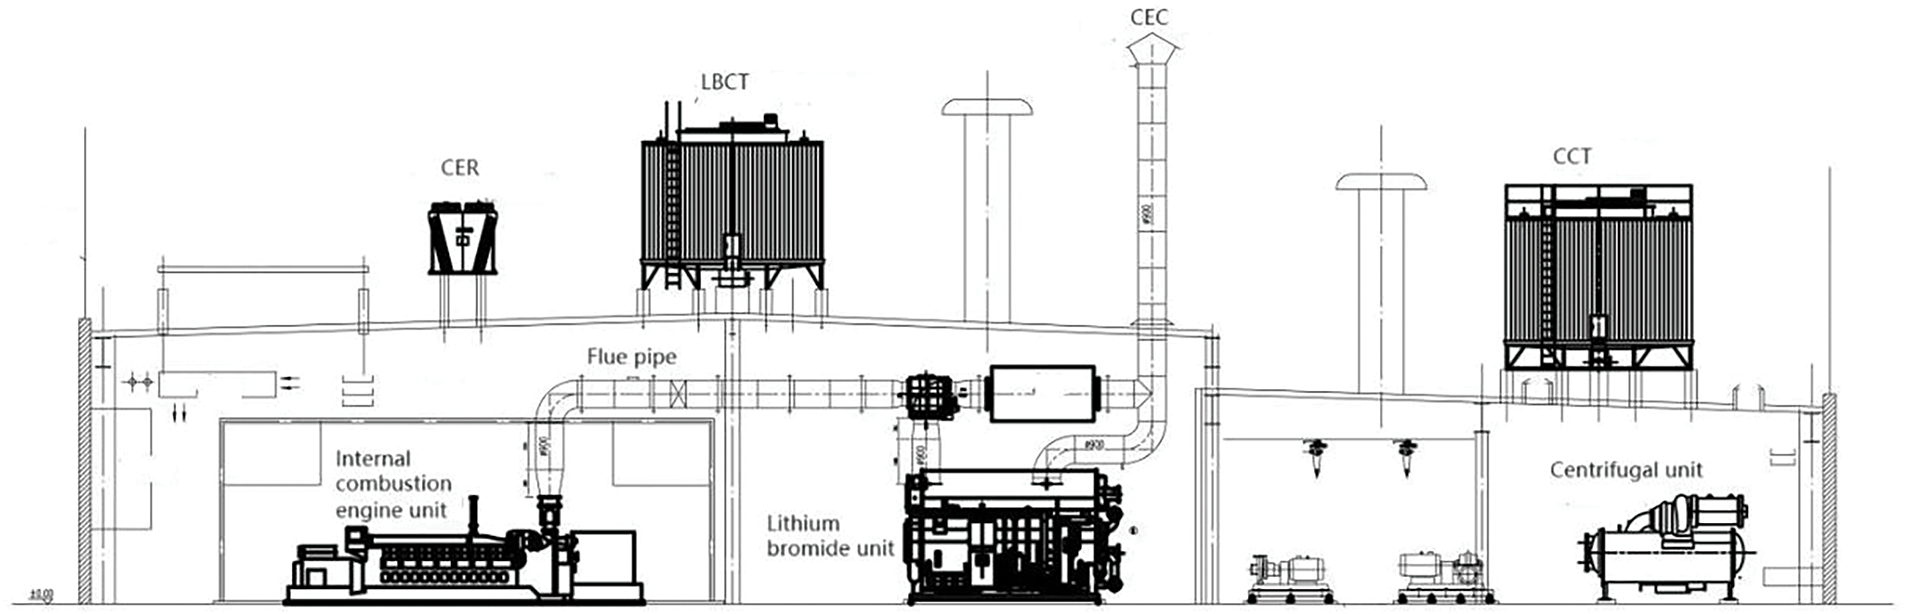
Figure 1: Schematic diagram of equipment operation
The focus of the experiment is to measure the temperature field and velocity field at the integrated exhaust end, and to measure the inlet and outlet temperature, velocity, chimney exhaust temperature, and ambient dry and wet bulb temperature of the CT by means of thermometers, anemometers and dry and wet bulb thermometers. Because the energy station has strict regulations and restrictions on the operation and start-stop of each equipment, the experimental stage focuses on the internal and external fields of centrifuge cooling towers (CCT) and lithium bromide cooling towers (LBCT).
The integrated exhaust end of the energy station is located on the roof and surrounded by noise reduction walls. Fig. 2 shows the simplified three-dimensional diagram of the measuring site and each equipment.
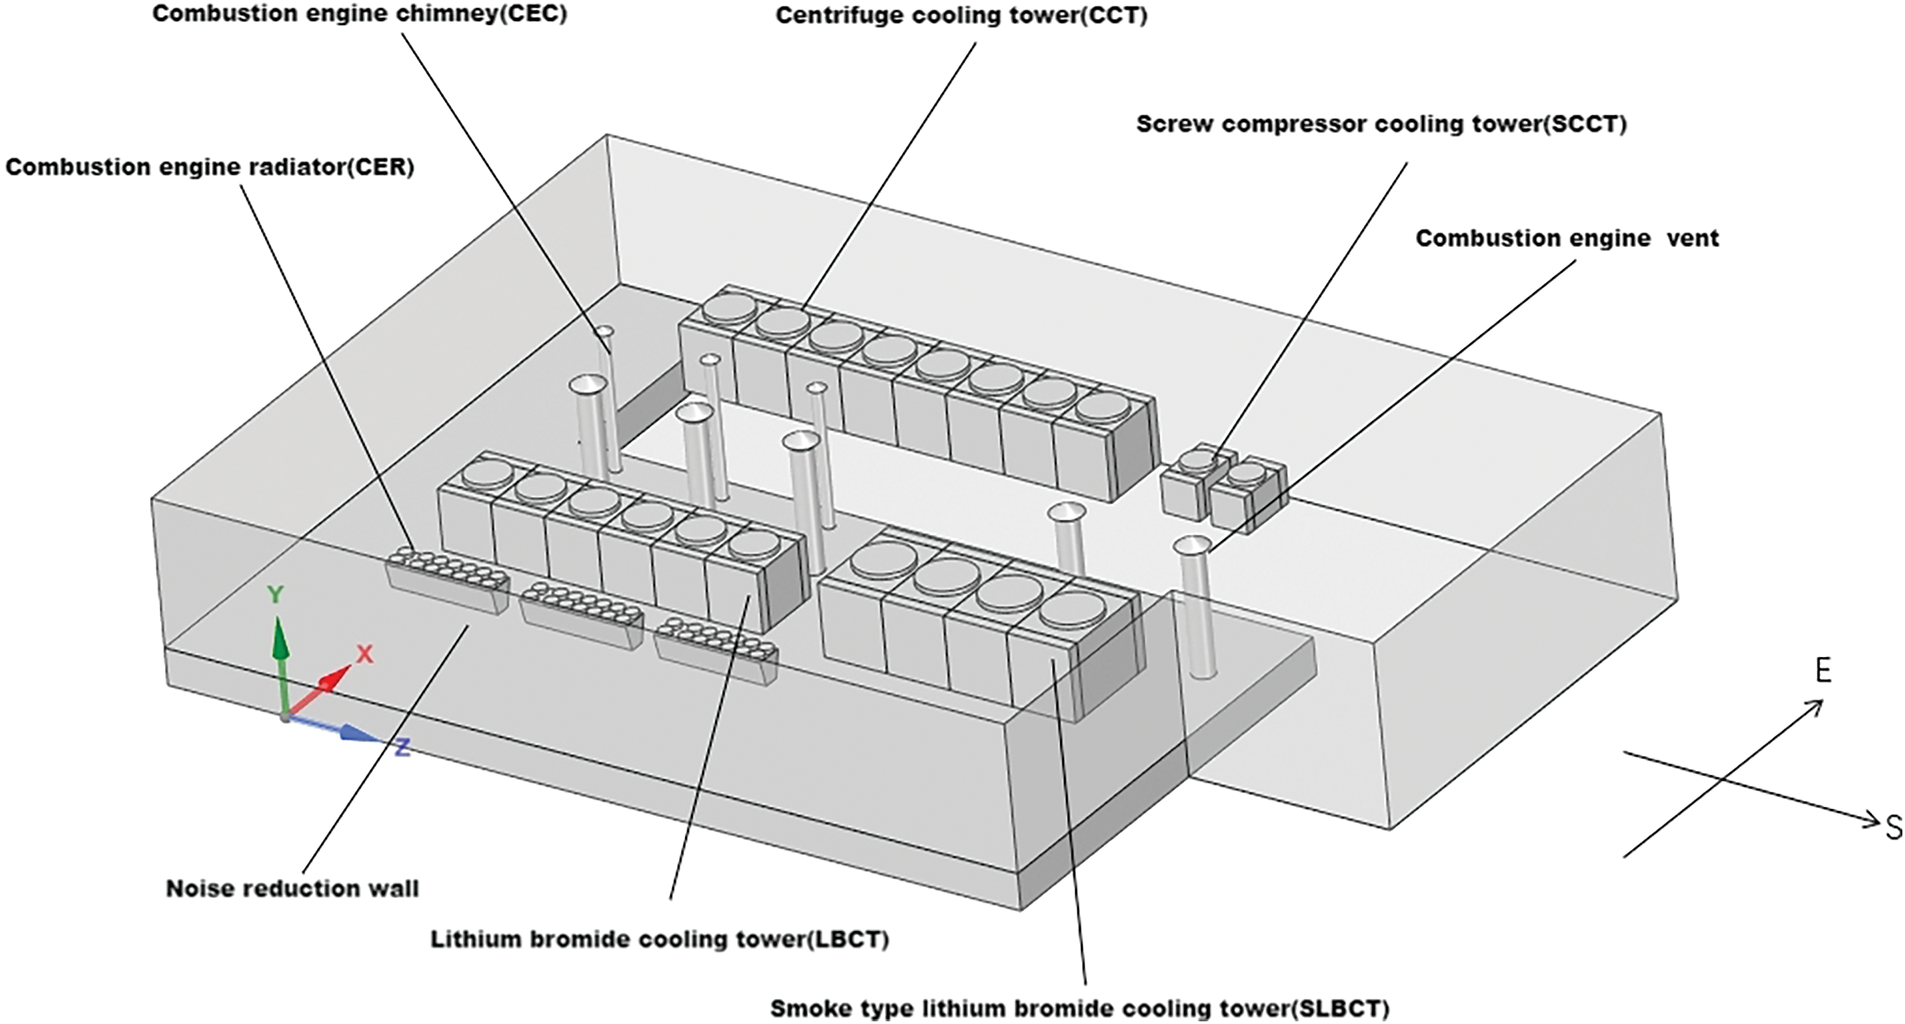
Figure 2: Energy station integrated exhaust end diagram
2.1 Layout of Measuring Points
According to the experimental results, the inlet air temperature of the CT shows minimal variation in the horizontal direction but significant changes in the vertical direction. Arranging too many measurement points would result in substantial consumption of human and material resources. It was found that placing several measurement points in the vertical direction and taking their average as the inlet air data is the most effective way to compare differences between CTs. As shown in Fig. 3, air is injected into both sides of the CT, and 3 measuring points are arranged in the vertical direction at the center of both sides of the CT, each measuring point is 1.5 m apart, The 1.5-m spacing effectively reflects the trends in airflow variation, while avoiding the issues of redundant data caused by overly dense measurement points or incomplete measurements due to sparse ones. It strikes a balance between data accuracy and experimental feasibility. While the CTs outlet air temperature, air speed and pressure are measured above the fan outlet. The water temperature in and out of the tower is measured in the shower tray and the sump. Atmospheric dry and wet bulb temperatures measured 15 m from the edge of the tower.
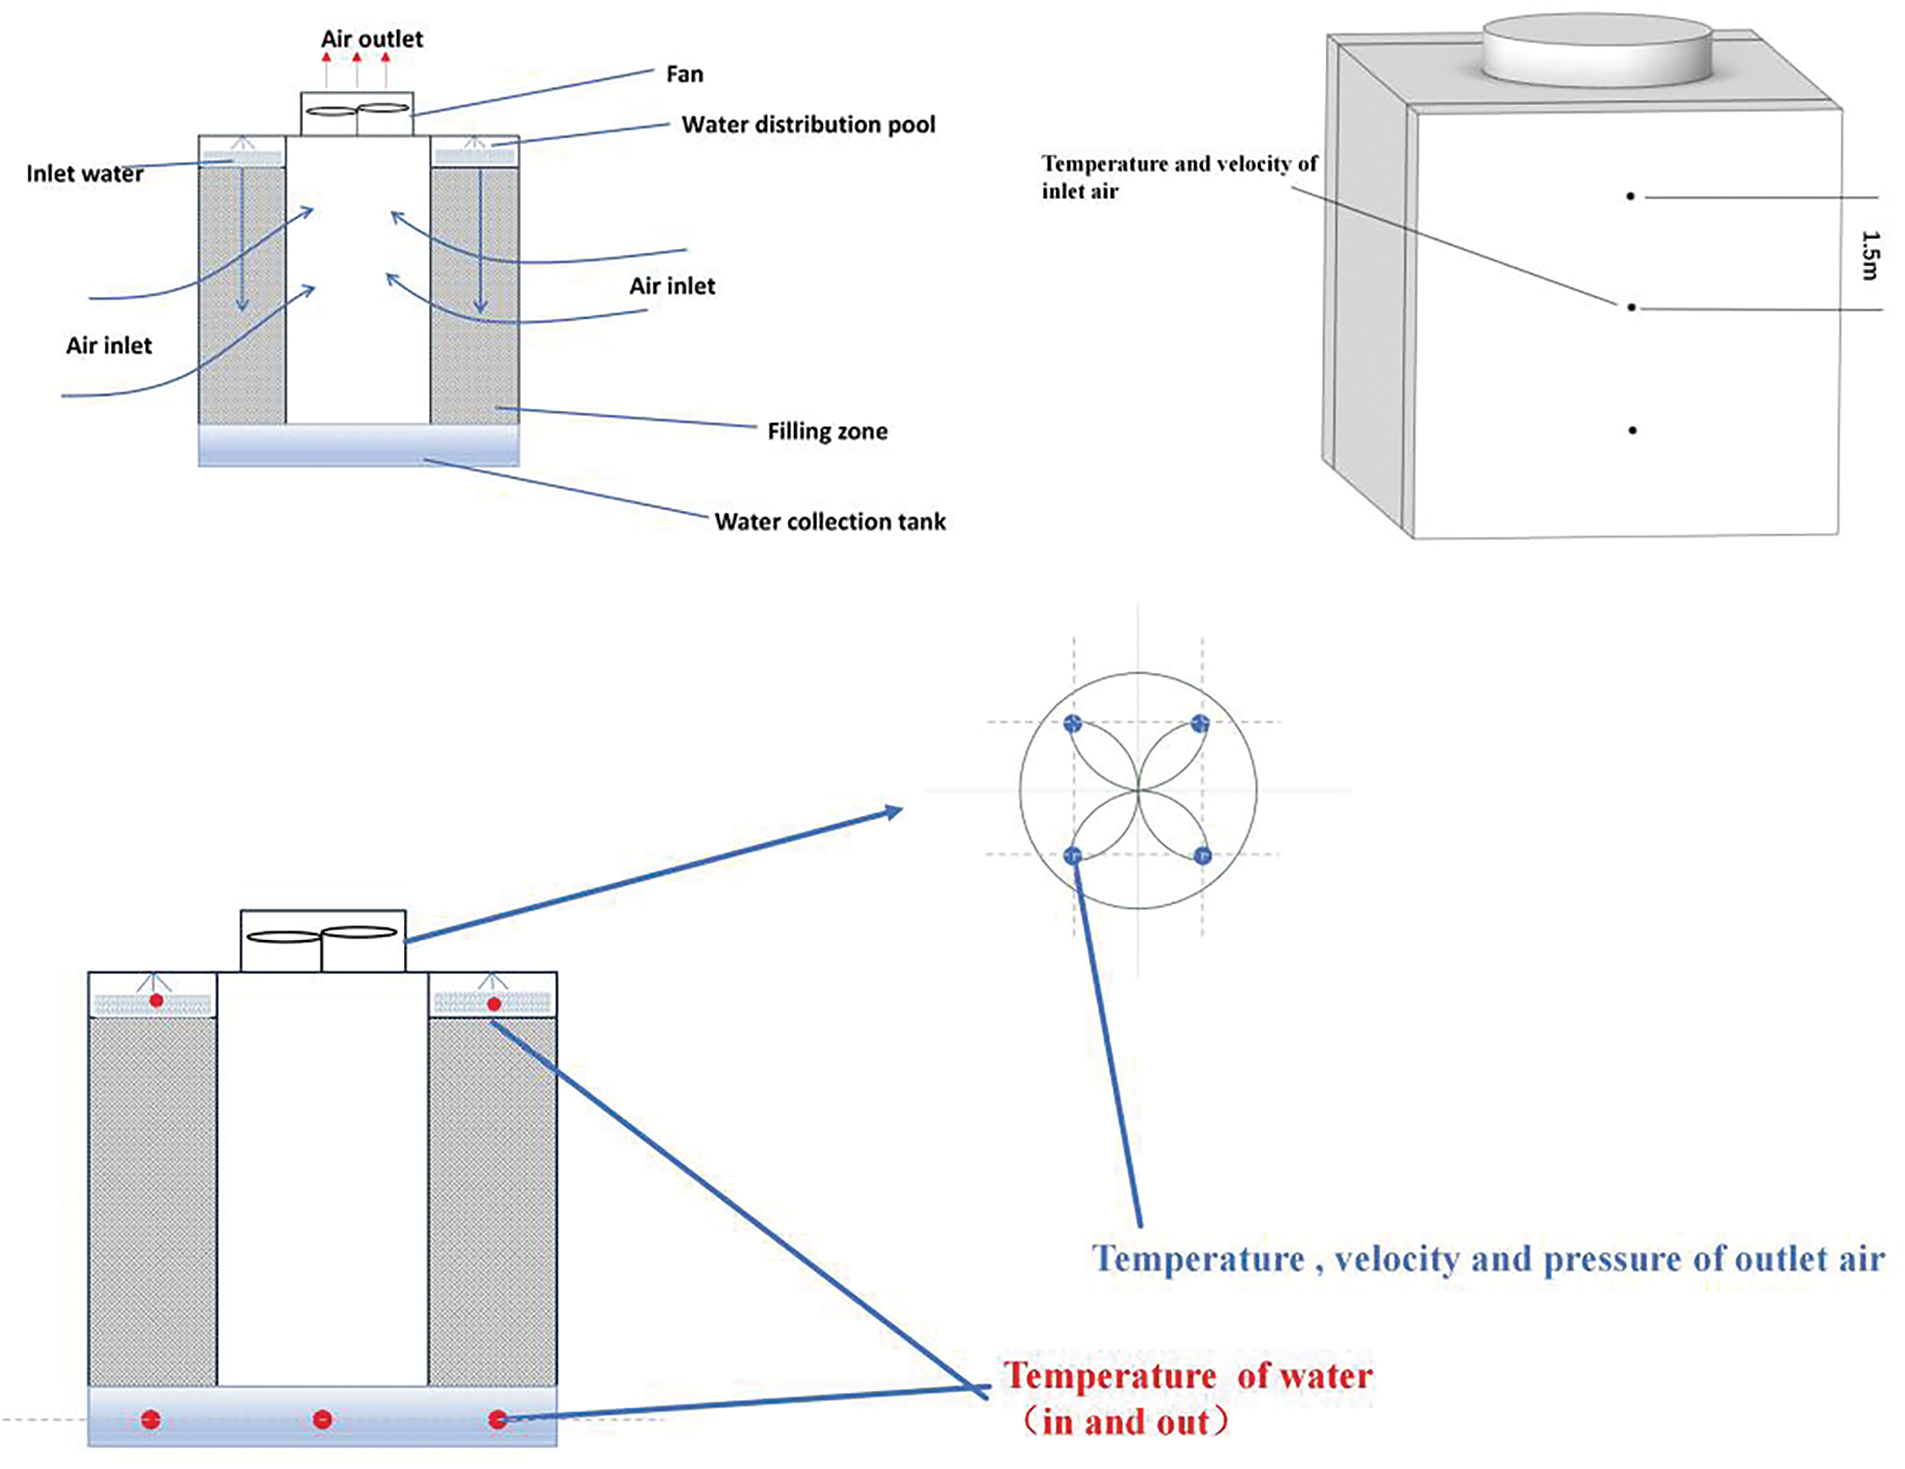
Figure 3: Schematic diagram of measuring point arrangement of MDCCT
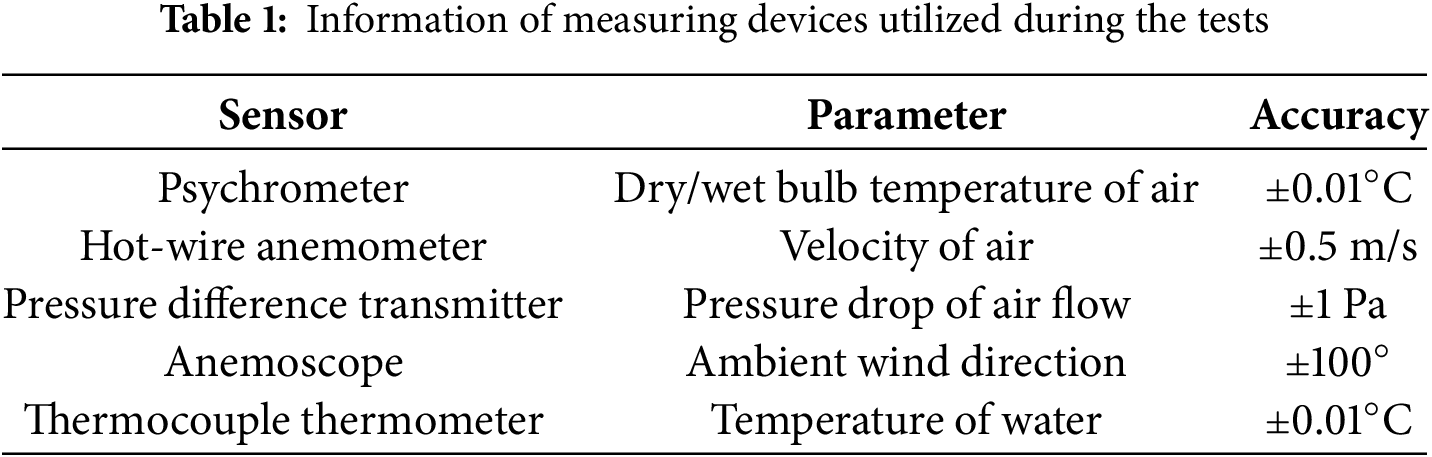
Environmental variations, such as changes in wind speed, temperature fluctuations, and humidity, can lead to measurement errors, especially under complex airflow conditions. To minimize these errors as much as possible, multiple measurement points were arranged for each data set, and steady-state readings were taken. Measurements were recorded every minute, with three readings taken in total, and the arithmetic mean of these readings was used as the final measurement result. The information of each measuring device is shown in Table 1.
2.2 Thermodynamic Calculation of Cross-Flow CT
According to Merkel’s theory, heat and mass transfer in CT is mainly driven by the enthalpy difference between water and air [9], and the air-water flow in MDCCT is orthogonal and two-dimensional, as shown in Fig. 4. Therefore, the water temperature and air enthalpy values at each point in the filling area are different.
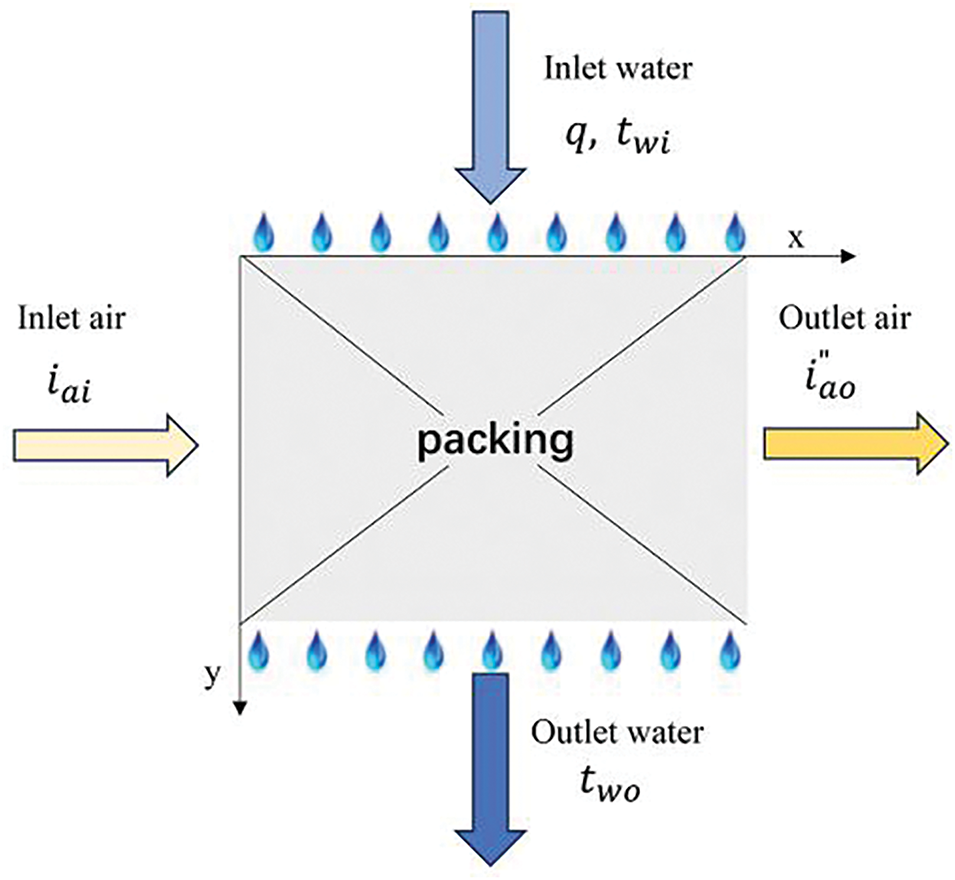
Figure 4: Schematic of water and air flow in MDCCT
In a rectangular CT, the governing equation for the filling region is:
The boundary conditions for the above partial differential equation are:
At present, the methods used to evaluate the thermal performance of CT filling mainly include volumetric mass transfer coefficient derived from F. Merkel formula and η CT cooling efficiency based on evaporative cooling limit [8,9]. The former can be iteratively calculated from Eqs. (4)–(6), where the enthalpy of air exiting the tower can be approximated as the saturation enthalpy corresponding to the current air temperature. The latter can be derived directly from Eq. (7). Considering that the CT involved in this experiment is a group arrangement rather than a single CT, and the water inlet mode is the main pipe inlet, the air intake and water flow cannot be accurately obtained under the change of working conditions. Secondly, the volumetric mass transfer coefficient is mainly applied in the simulation test of CT. Therefore, the cooling efficiency η based on evaporative cooling limit is used as the index to evaluate the thermal performance of CT.
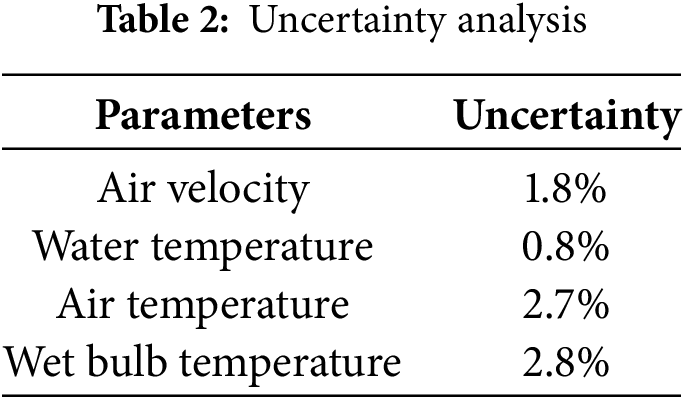
Due to the presence of uncertainty, measurement equipment may experience errors. According to the method proposed by Moffat [22,23], the possible errors were analyzed using the following Eqs. (8)–(10).
where
According to the calculation results in Table 2, the uncertainty of air velocity, water temperature, air temperature and wet bulb temperature are 1.8%, 0.8%, 2.7% and 2.8%, respectively. The errors are all less than 3%, which is within the acceptable range.
2.4 Experimental Results and Discussions
As shown in Fig. 5, various types of heat dissipation equipment are numbered separately.
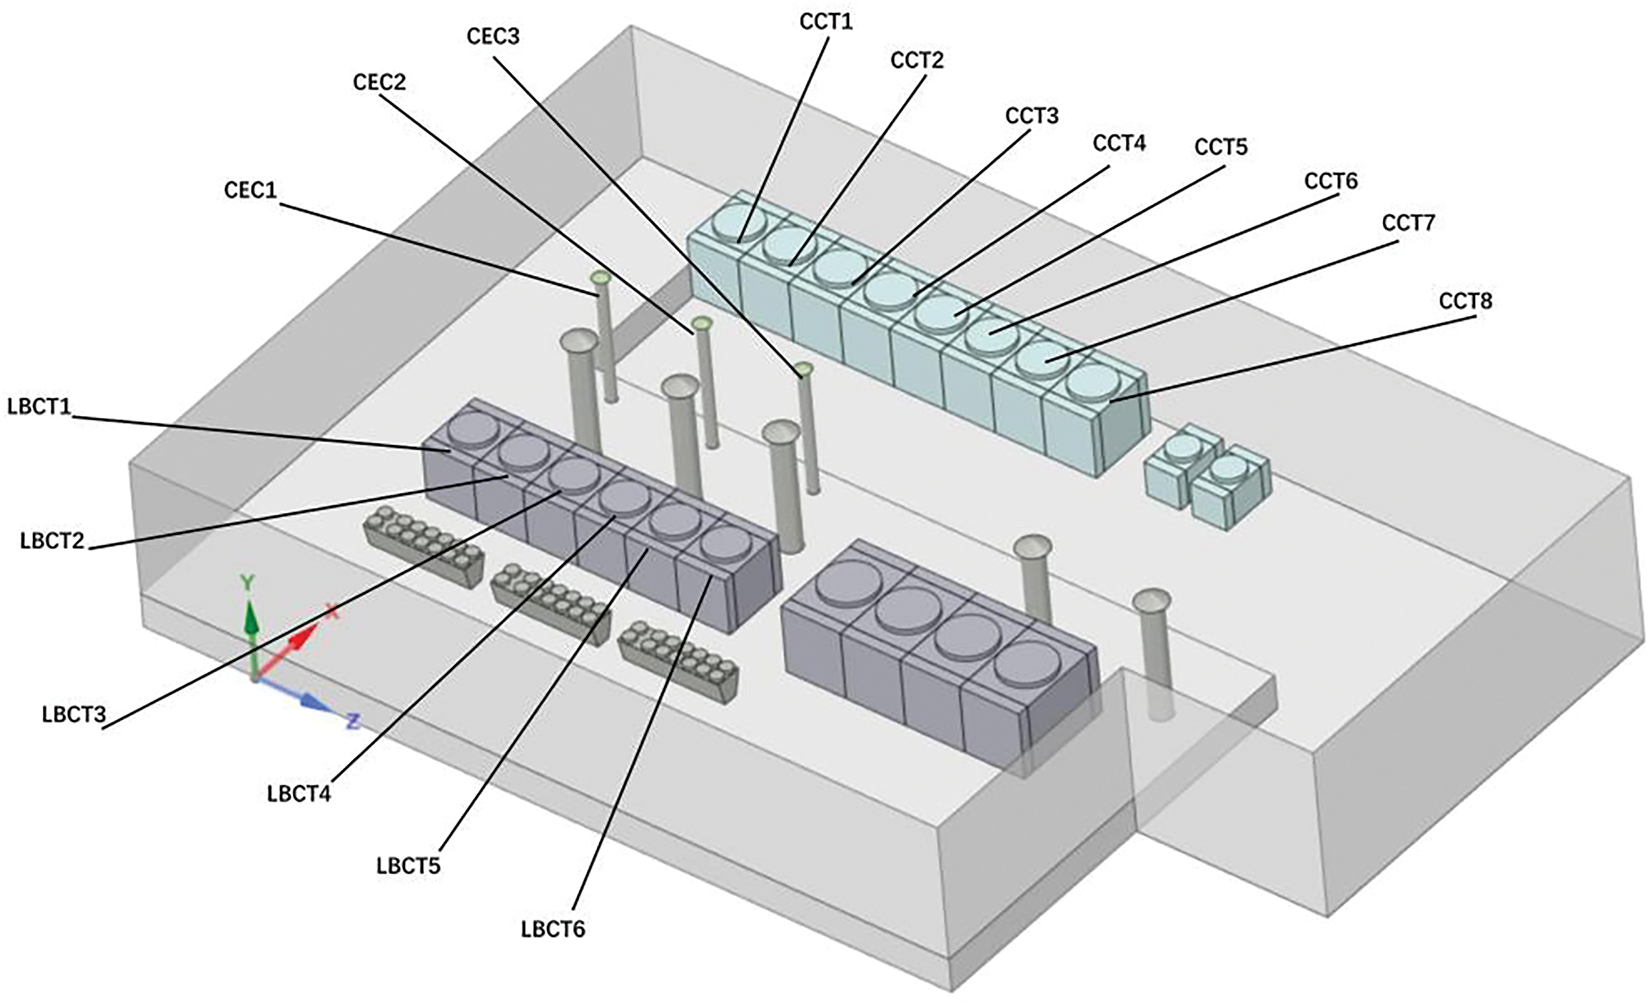
Figure 5: Equipment number
2.4.1 Analysis on the Inlet Air Temperature of CTs under Different Working Conditions
The influence of chimney exhaust on the air temperature at the inlet of the CT under two typical operating conditions was explored, as show in Table 3, with a small range of environmental temperature changes and a constant southwest wind direction. When the energy station operates under CEC13 conditions, smoke is emitted from the #1&3 combustion engine chimney (CEC); When operating under CEC3 conditions, the #3CEC emits smoke separately.
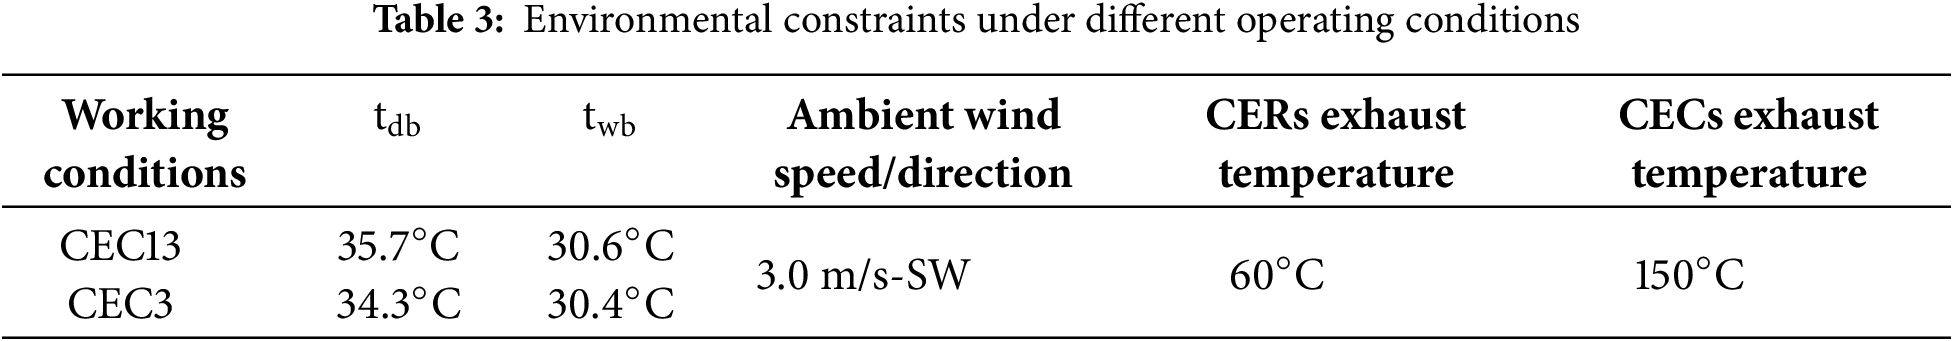
From Fig. 6, it can be seen that the inlet air temperature of the CT under both operating conditions is generally between 35°C and 39°C, significantly exceeding the ambient dry bulb temperature, indicating that the CT is affected by other temperature media. Compared to a single chimney exhaust, the dual chimney exhaust under operating condition CEC13 has a greater impact on the inlet temperature of CCT. When dual chimneys exhaust simultaneously, the inlet temperature on the west side of CCT is 1°C~2°C higher than when #CEC3 chimney exhausts separately. This temperature increase phenomenon is related to the localized heat island effect caused by the dual-chimney emissions. The discharge from dual chimneys can lead to a wider range of smoke recirculation and accumulation, thereby raising the temperature at the cooling tower’s inlet.
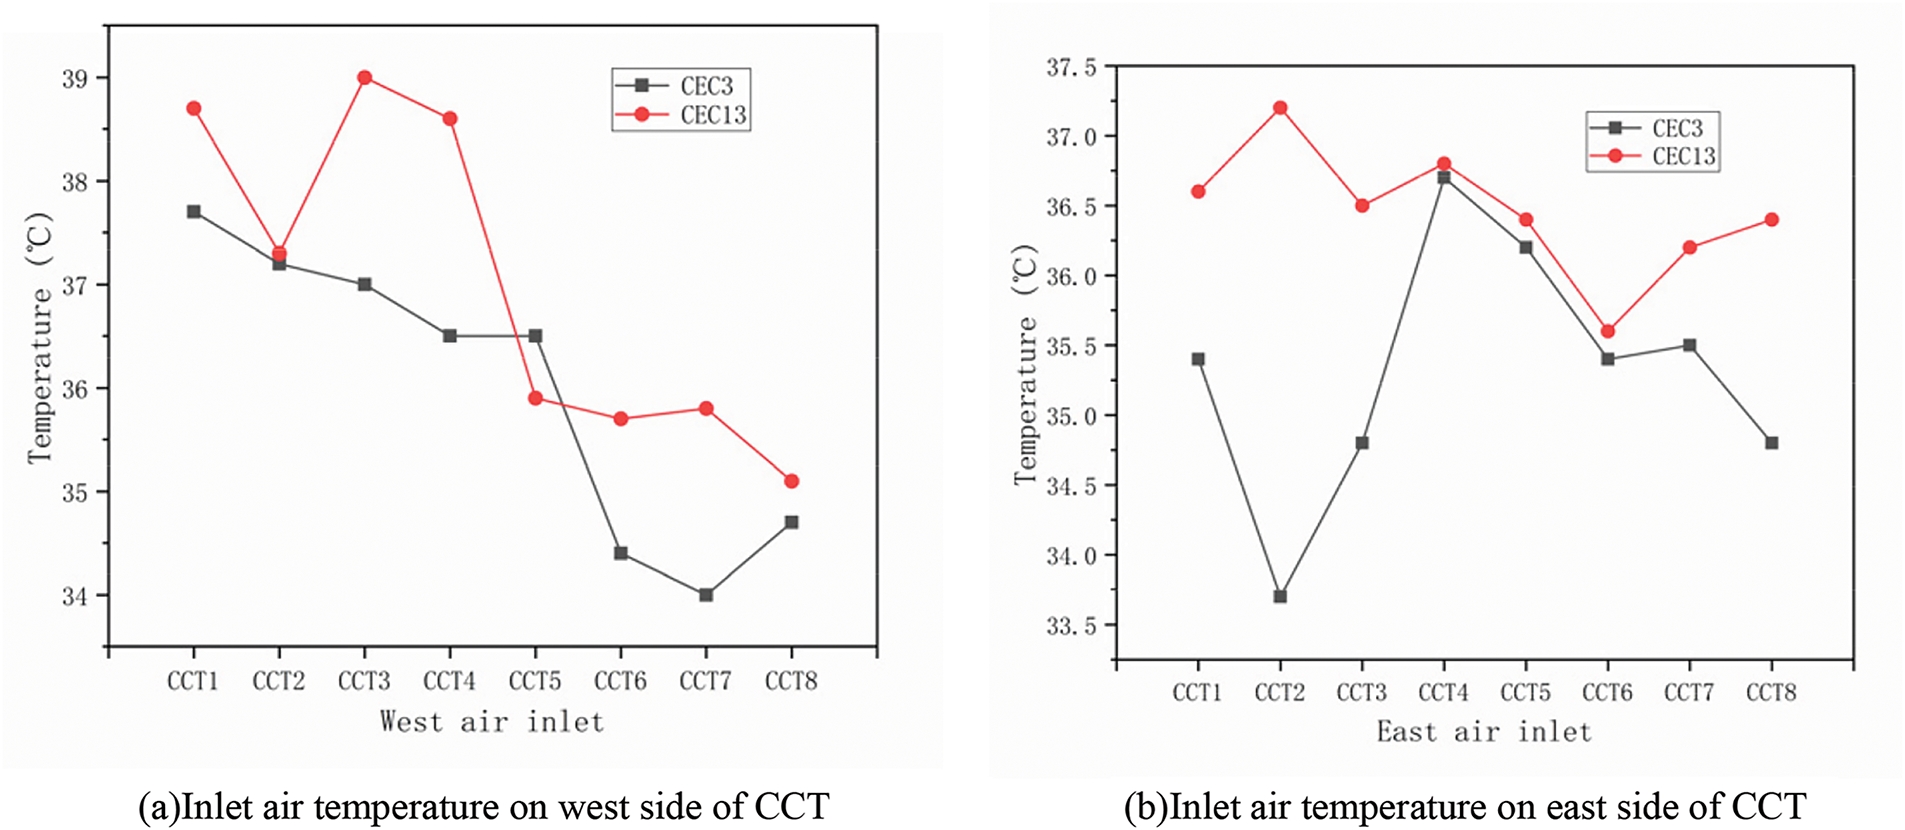
Figure 6: Effects of chimney smoke exhaust on inlet air temperature of CCT under different working conditions
As shown in Fig. 6a, due to the influence of typical local environmental wind direction and spatial distribution differences of various equipment, the inlet temperature on the west side of #CCT1-4 is significantly higher than that of #CCT5-8, indicating that chimney exhaust has a greater impact on the former. The analysis suggests that this is because the front-row CTs are closer to the emission source and are therefore more directly affected by the exhaust gases. In contrast, the rear-row CTs are farther from the emission source, resulting in a higher degree of heat dilution. From Fig. 6b, it can be seen that although the air inlet on the east side is far away from the heat source compared to the west side, it is still affected by the smoke exhaust from the chimneys. This is because, under a level 2 wind speed, exhaust gases accumulate around the base of the cooling tower. A portion of the high-temperature exhaust gases is entrained from the base of the cooling tower to the east-side air intake.
Similarly, according to Fig. 7, the inlet air temperature of LBCT is generally higher than the ambient temperature, especially at the west inlet, where the overall inlet air temperature is higher than that on the east side, with the highest inlet air temperature being 8°C higher than the ambient temperature. The west air inlet is greatly affected by the heat dissipation of the combustion engine radiator (CER). Due to the height of the CER fan outlet being flush with the height of the LBCT west inlet and the narrow spacing, a large amount of waste heat is sucked into the tower due to the negative pressure of the LBCT inlet.
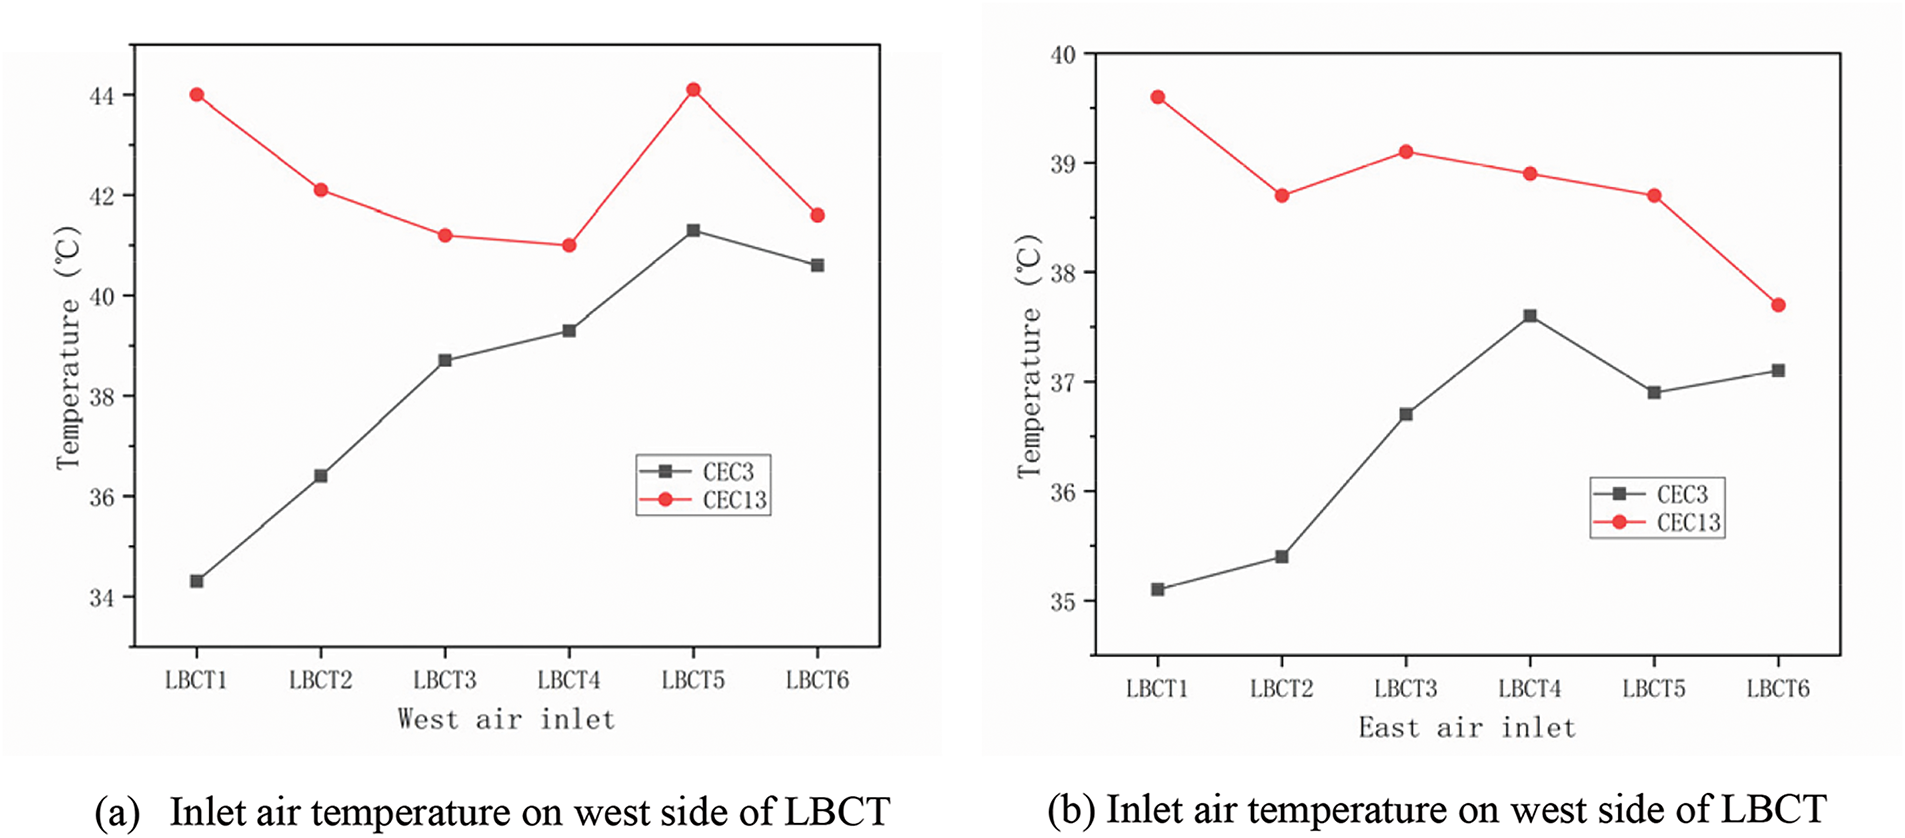
Figure 7: Effects of chimney smoke exhaust on inlet air temperature of LBCT under different working conditions
From the above analysis, it can be seen that under the influence of hot gas recirculation inside the platform, chimney exhaust mainly affects the inlet temperature on the west side of CCT and the east side of LBCT, while CER exhaust hot air flow mainly affects the inlet temperature on the west side of LBCT, and its impact exceeds that of the chimney.
2.4.2 Effect of Different Ambient Temperature on CT Cooling Efficiency
Fig. 8 shows the CCT cooling efficiency under two different ambient temperatures under the same operating condition (CEC13). At an ambient temperature of 32°C, the cooling efficiency is between 0.35 and 0.45; When the ambient temperature is 38°C, the cooling efficiency is between 0.19~0.25. It can be seen that when the ambient temperature rises by 6°C, the cooling efficiency decreases by about 0.15. Secondly, from the perspective of a single CT, at a constant ambient temperature, the overall cooling efficiency of #CCT5-8 is better than #CCT1-4, which indirectly confirms the conclusion about the impact of chimney exhaust on CCT mentioned earlier: the phenomenon of hot gas recirculation caused by chimney exhaust has a greater impact on #CCT1-4.
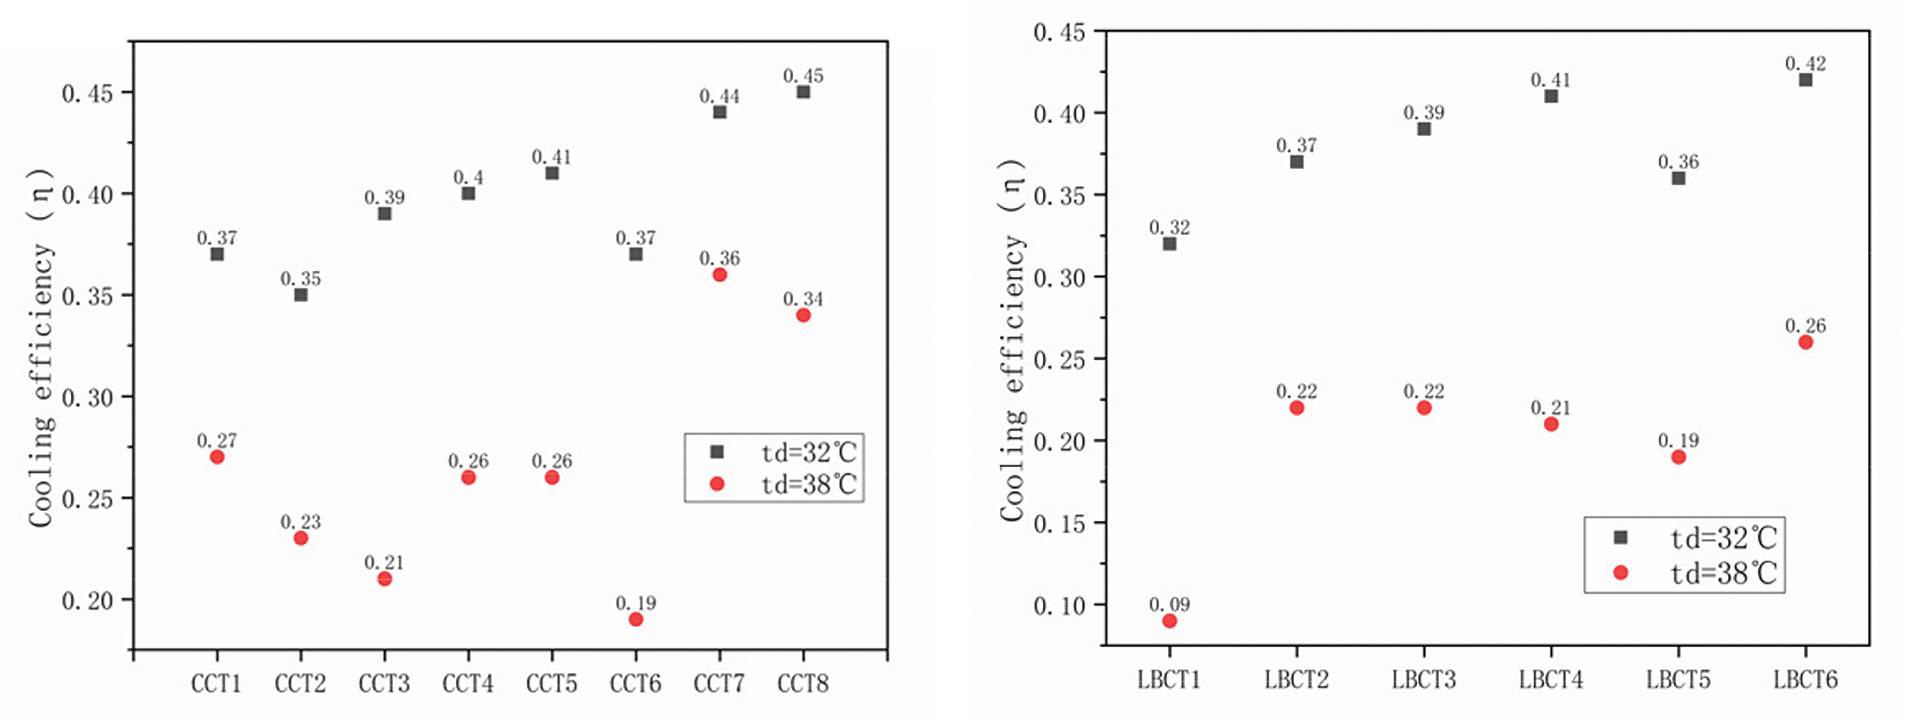
Figure 8: CT cooling efficiency analysis
Based on the main facilities and layout of the integrated exhaust end on the top floor of the energy station, this study uses Spaceraim software to perform a 1:1 geometric reconstruction, as shown in Fig. 2, including various MDCCTs, CERs, chimneys, walls, and ventilation facilities. Taking the center of the rooftop as the origin, a cylindrical area with a diameter of 180 m and a height of 29 m is selected as the computation domain for the aerodynamic field of the integrated exhaust end. Geometric simplifications have been made for the CT, chimney cap, noise reduction wall, etc., as shown in Fig. 9. The simplified cooling tower consists of three parts: filling, tower body, and fan area, and simplify the chimney cap and noise reduction wall to a non thick wall surface.
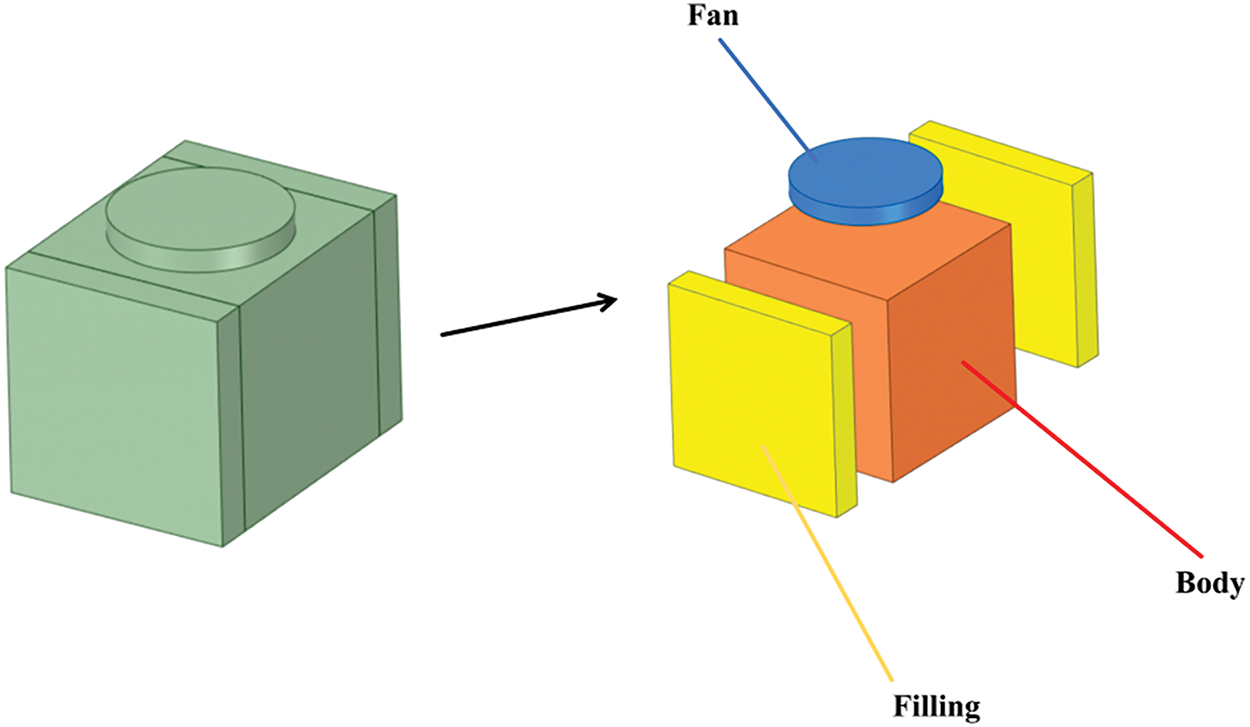
Figure 9: The simplified model of MDCCT
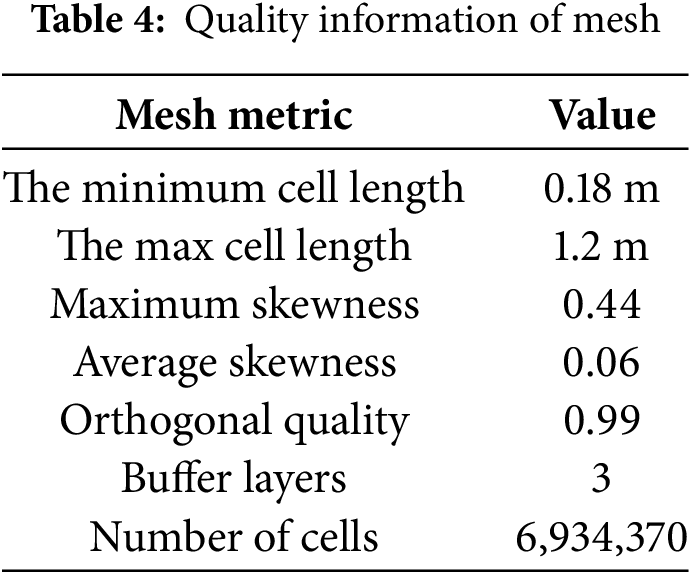
This paper uses Ploy-Hexcore based on “mosaic” technology to generate grids, which can generate a large number of hexahedral grids and effectively reduce the impact of pseudo diffusion on the calculation results while reducing the number of grids. Set the global maximum size to no more than 1.2 m, separately set the size of the opposite and body grids, and perform grid refinement on corners, walls, and key areas multiple times, the specific details are shown in Fig. 10. The final number of generated grids is 6,934,370, and the specific information on grid quality is shown in Table 4.
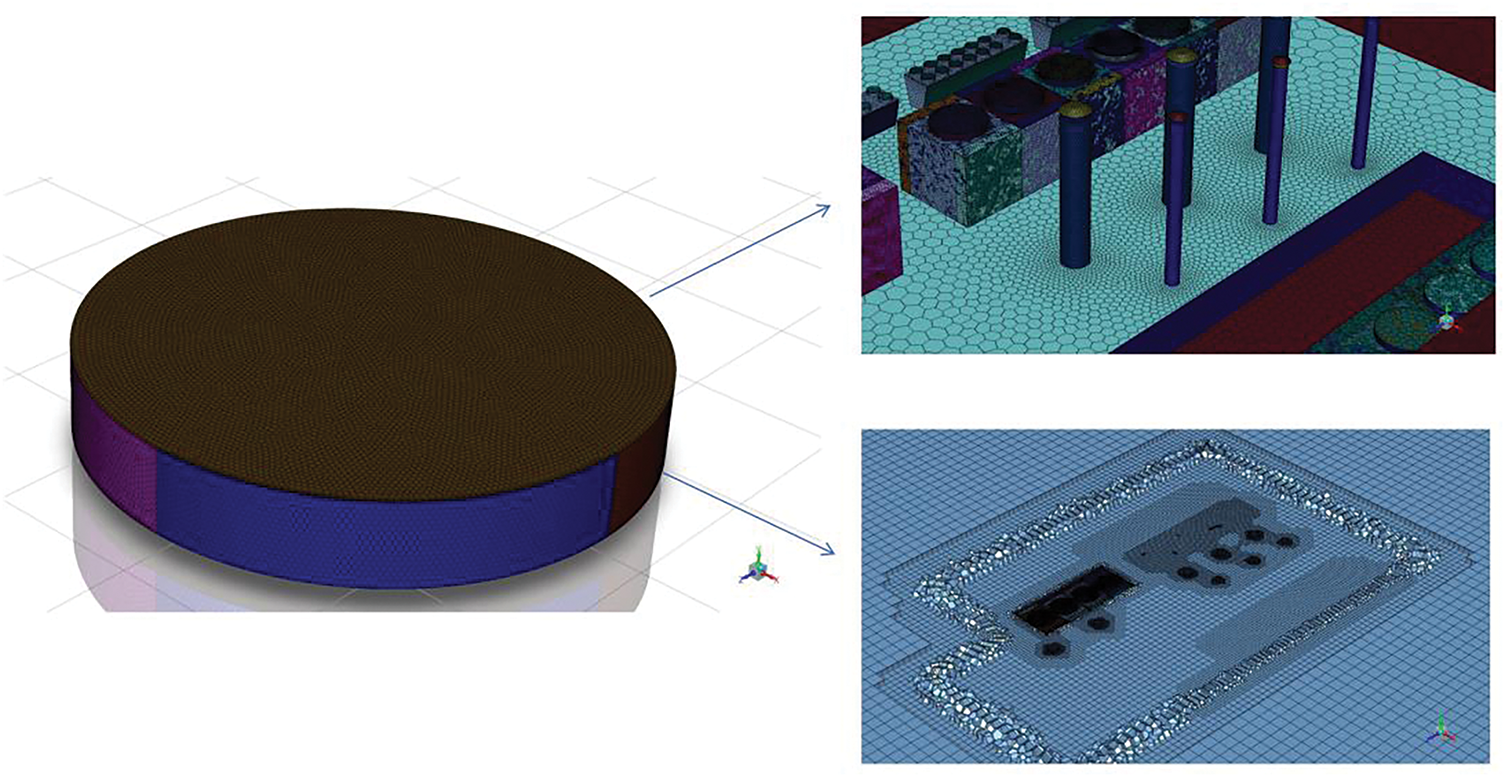
Figure 10: Sketch of the grid
The air flow inside and around the CT can be regarded as stable turbulence. In this paper, the incompressible Reynolds Average Navier-Stokes (RANS) equation is used [24,25]. The standard wall function is used to calculate the airflow in the near wall area to simulate the changes in the aerodynamic and temperature fields inside and outside the CT under different environmental conditions. The specific parameters are shown in the Table 5.

The conservation of mass equation:
where
The momentum conservation equation is:
where
where
The energy conservation equation is:
where
This paper selects a cylindrical region as the computational domain for numerical simulation to simulate the atmospheric environment [11,26]. The boundary conditions are shown in Fig. 11. Specifically, in a windless environment, the windward and leeward sides of the computational domain are defined as the pressure-inlet, and the top side is defined as the pressure-outlet; Under windy conditions, the windward side of the computational domain is defined as the velocity-inlet, while the leeward and top sides are defined as the pressure-outlet. The bottom surface of the computational domain, as well as the CT shell, chimney, noise reduction wall, etc., are defined as non slip adiabatic wall surfaces.
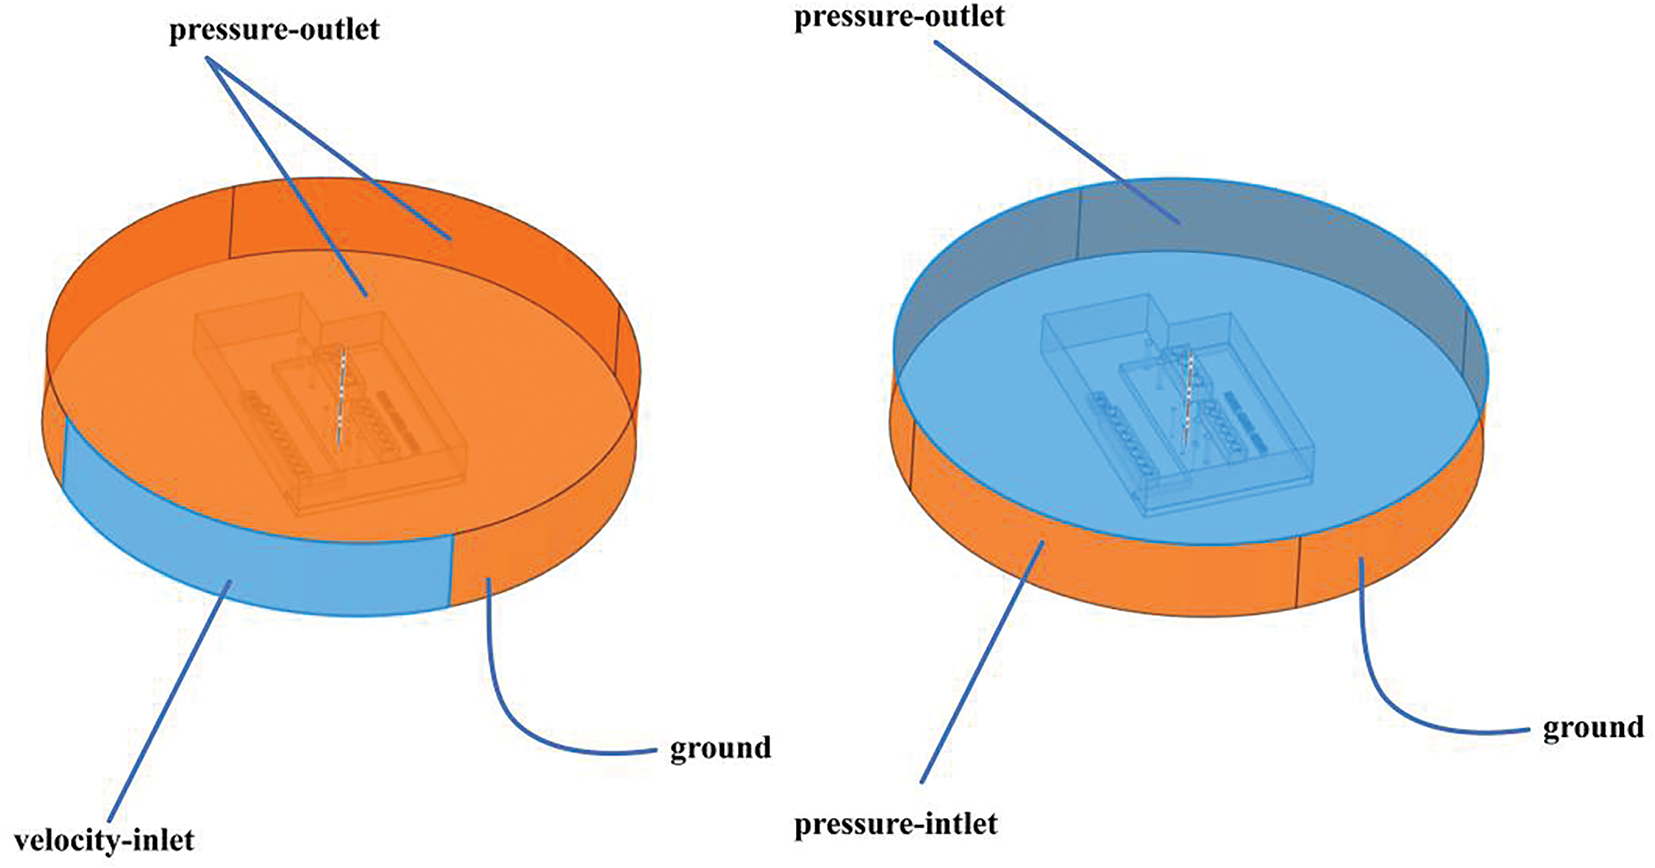
Figure 11: Boundary conditions of computation domain
The heat dissipation methods of wet CTs are mainly divided into contact heat dissipation and evaporation heat dissipation. In contact heat dissipation, air flows through water, and heat is transferred from the higher side to the lower side, and the heat is carried away in the form of sensible heat. In evaporative heat dissipation, some water vapor is carried away by the cooling water due to evaporation, and most of the heat of the cooling water is carried away in the form of latent heat. By Eq. (16), the evaporation loss of various CT during normal operation can be calculated, and a mass source term acting on the body of the CT can be obtained to represent the latent heat exchange of the CT. Evaporation loss of CT is:
where
The latent heat exchange capacity of the CT is:
where
Therefore, the energy source term acting on the CT body can be expressed as:
This paper simplifies the CT fan into a cylindrical area, and applies a universal momentum source term and momentum source term coefficient inside to achieve the forced ventilation of the fan in MDCCT. The general momentum source term can be expressed as follows:
where
where
For the CT filling part, this paper adds a porous medium model to simulate the pressure loss formed by air passing through the filling area, providing an ideal approximation to the real situation for modeling the filling area. The directional loss model requires setting parameters such as flow direction and square resistance coefficient. The square resistance coefficient can be expressed as:
where
This study considers flue gas discharged from CER as air, and exchanges heat and mass with the surrounding air. The discharge temperature and velocity are assigned values based on experimental data.
3.5 Verification of Grid Independence
This paper evaluates five different grid densities for independence analysis, with five sets of grid quantities of 3.58, 4.21, 5.3, 6.93, and 8.12 million, respectively. According to the experimental results of CCT inlet air temperature and cooling efficiency, it was found that #CCT2 was most affected by hot gas recirculation. Therefore, the inlet air temperature and outlet air velocity of #CCT2 under typical operating conditions was used as the basis for grid independence verification.
According to the computational results, as shown in Fig. 12a, the variation in inlet air temperature gradually decreases with increasing mesh density, indicating that the results tend to stabilize. Based on the relative error Eq. (24), the relative errors for the five different mesh densities are calculated as 1.52%, 0.75%, 0.5%, and 0.125%, respectively. When the mesh count reaches 6.93 million, the relative error drops below 0.5%, and for 8.12 million meshes, the error is only 0.125%. Similarly, as shown in Fig. 12b, the relative error of the cooling tower outlet air velocity decreases to 0.99% when the mesh density reaches 6.93 million. Generally, when the relative error falls below 1% or even lower (such as below 0.5%), the results can be considered insensitive to further mesh refinement, indicating that mesh independence is essentially achieved. Based on the above analysis, a mesh count of 6.93 million is sufficient to ensure computational accuracy. Further increasing the mesh density has little effect on the results but significantly increases computational cost. Therefore, 6.93 million meshes are selected as the final computational mesh to balance accuracy and efficiency.
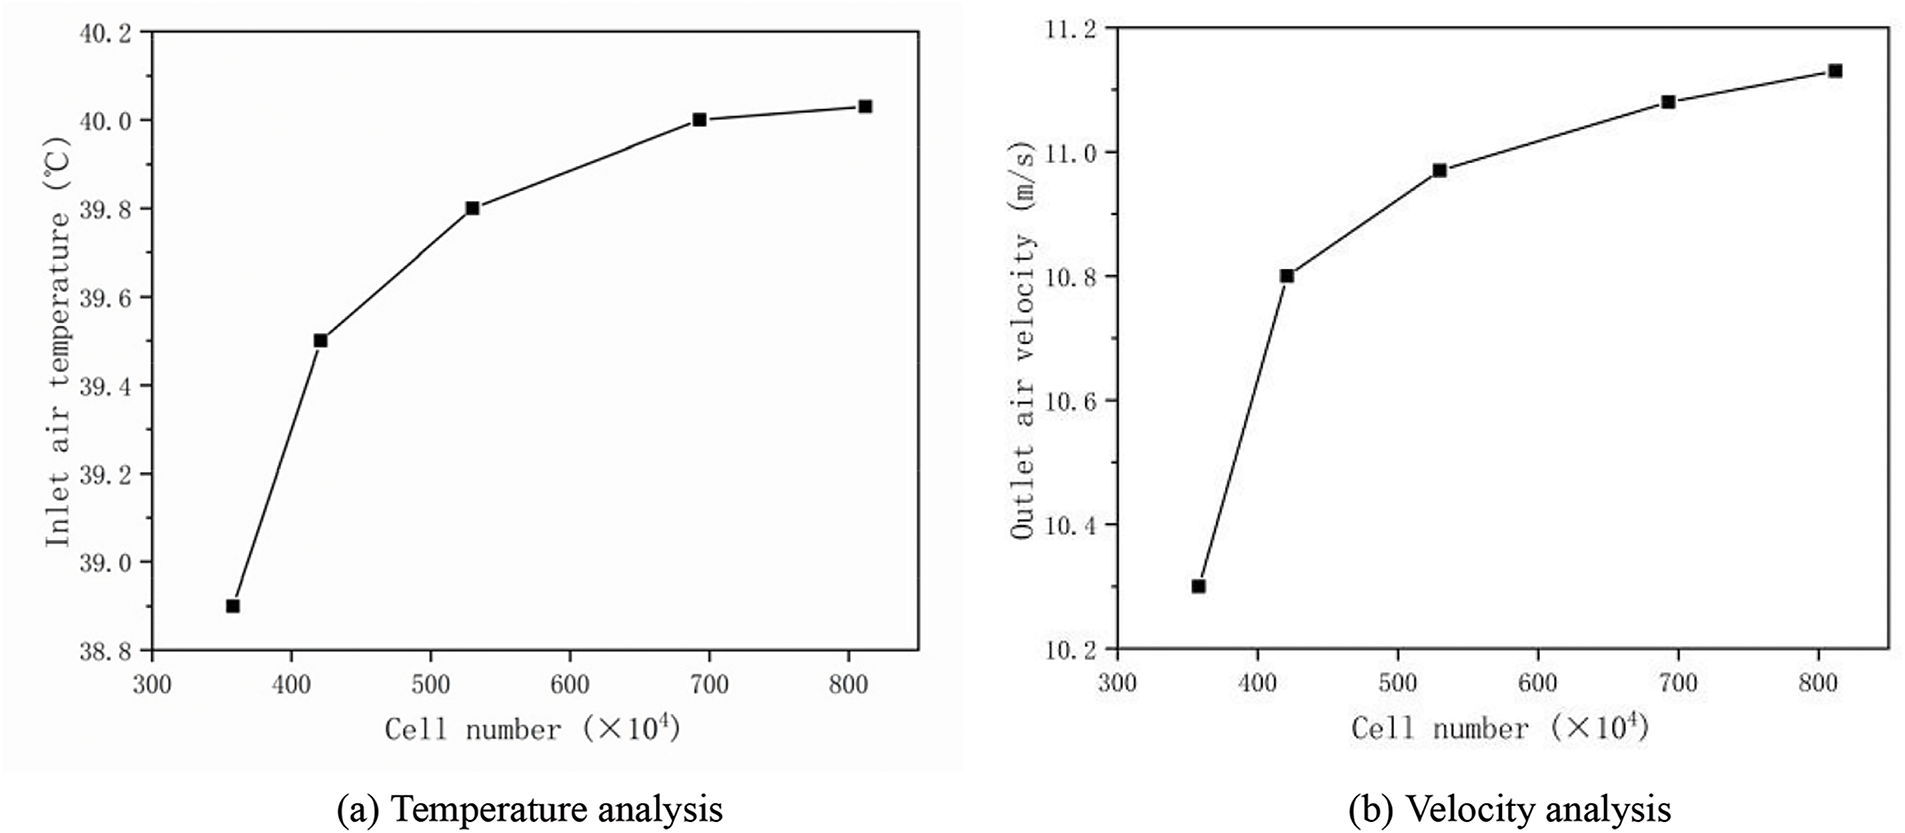
Figure 12: Results of grid independence analysis
3.6 Verification of Model Accuracy
In order to further verify the accuracy of the model, this paper compared the experimental and numerical simulation results of the inlet air temperature on the west side of the CCT under typical operating conditions. According to Fig. 13, the error between the measured and simulated values is within 0.5°C. Based on this, the modeling method used in this paper is accurate and reliable.
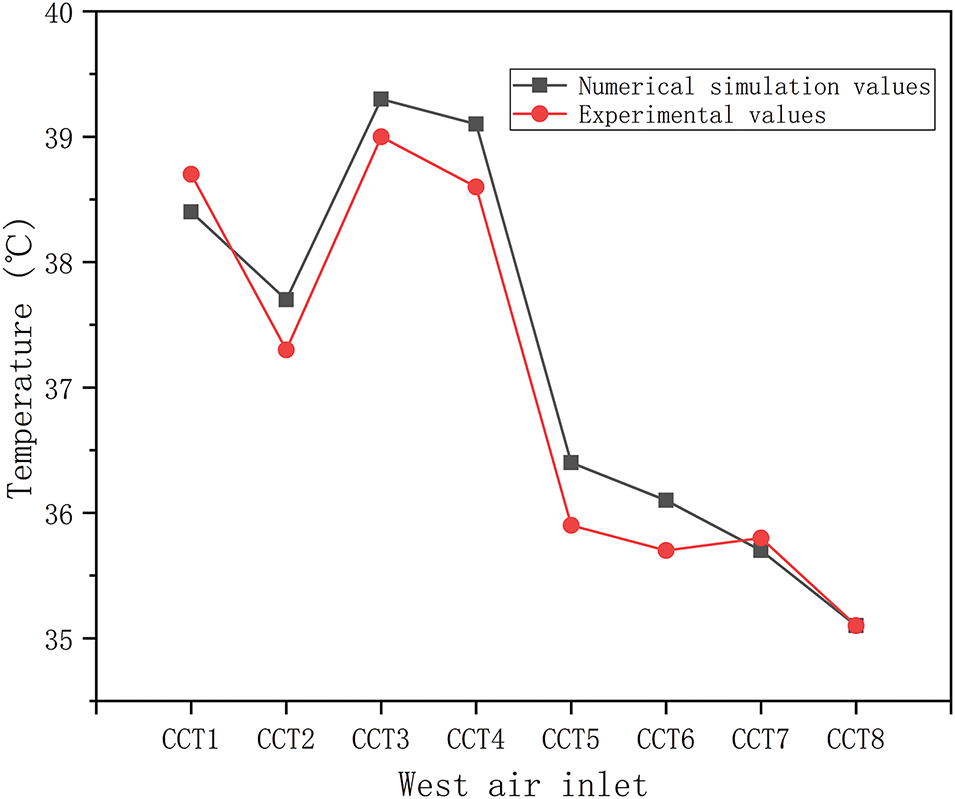
Figure 13: Results of grid accuracy analysis
The first step in CFD solving is to transform the continuous fluid control equations (such as the N-S equations and turbulence models) into a computable discrete form. Common discretization methods include the finite difference method, finite volume method, and finite element method. In this numerical simulation, a pressure-based solver was adopted to ensure the reliability and physical accuracy of the results, with the SIMPLE algorithm used for iterative solving.
Spatial discretization schemes were employed, where the pressure terms were discretized using a Second Order scheme to better capture the flow field gradients and reduce numerical dissipation. The momentum equations were discretized using the Second Order Upwind scheme, while the turbulence kinetic energy equations were discretized with the First Order Upwind scheme.
During the iteration process, the residuals of the momentum and energy equations were monitored. The solution was considered converged when the residuals fell below a specific threshold, which was set at 1.e − 5. Additionally, the outlet pressure at the top of the computational domain was monitored as a critical physical quantity to ensure stable and accurate simulation results.
This paper focuses on exploring the influence of hot gas recirculation on CCT and temperature field distribution under different ambient crosswinds through numerical simulation. In addition, a new renovation design has been carried out on the chimney cap to address existing issues. While maintaining the original design’s rain and wind protection functions, the obstruction effect of the chimney cap on smoke is minimized to the greatest extent possible. And numerical simulation results were used to demonstrate the rationality and effectiveness of the new chimney cap.
3.8.1 Influence of Ambient Crosswind on Temperature Field
Ambient crosswind has always been a key factor affecting the thermal performance of CT and a research point that many scholars cannot avoid. Similarly, for this study, ambient crosswind is also a key variable that affects the flow and temperature fields. This section analyzes the effects of four different ambient crosswind speeds,
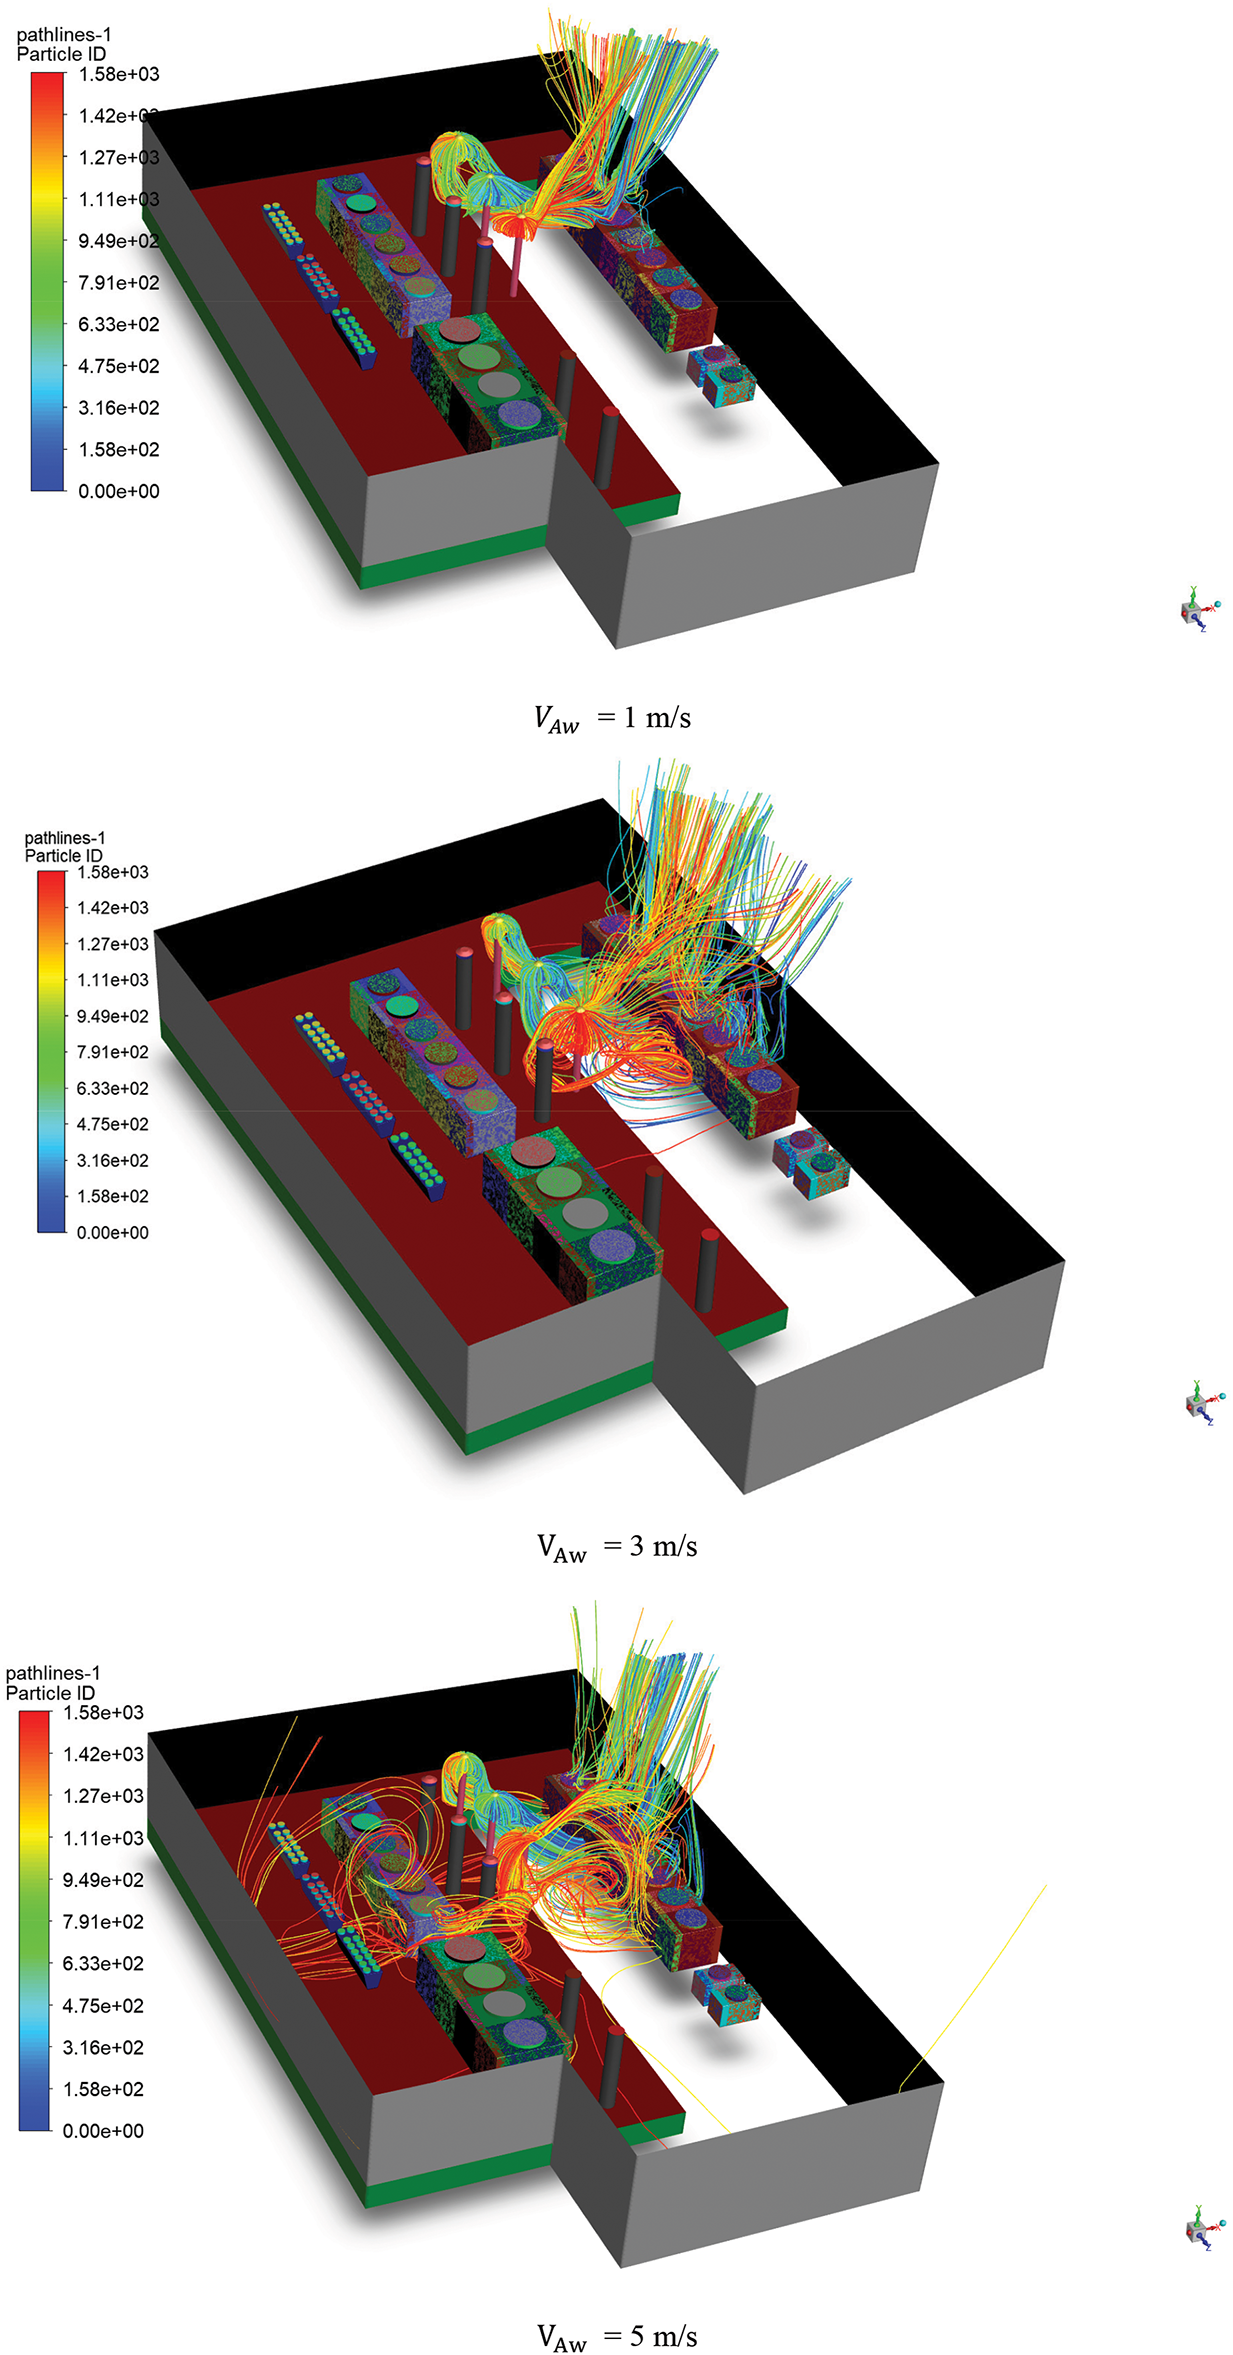

Figure 14: Streamlines of chimneys smoke under different ambient crosswind
Firstly, the increase in ambient crosswind speed intensifies the wind cap effect above the platform. Due to the higher dynamic pressure of the high-speed airflow, a strong flow barrier forms above the rooftop noise reduction walls, restricting the vertical diffusion of hot gas recirculation. As a result, the smoke is blocked and accumulates near the platform, leading to the formation of recirculation zones and an enhanced hot gas recirculation effect. This further increases the extent of hot gas recirculation and expands the smoke influence range. Secondly, due to its high temperature, the smoke naturally tends to rise, with buoyancy-driven convection typically dominating under low wind speed conditions. However, as the ambient wind speed increases, dynamic pressure gradually surpasses the buoyancy effect, making the smoke more easily captured and entrained by the horizontal airflow. Consequently, the smoke fails to rise smoothly, increasing the likelihood of horizontal diffusion and recirculation. Under low wind speed conditions, smoke dispersion is mainly driven by natural convection and buoyancy, resulting in a limited diffusion range. In contrast, under high wind speed conditions, the dispersion pattern shifts to forced convection. The airflow not only drives the horizontal diffusion of the smoke but also forms large downstream vortex zones below the rooftop platform. This causes the smoke to recirculate repeatedly, thereby enhancing the hot gas recirculation effect.
As a result, a phenomenon emerges where temperature tends to concentrate under low wind speeds and becomes more dispersed under high wind speeds.
It can be clearly seen from the inlet temperature Contour map in Fig. 15 that the high-temperature inlet area is mainly concentrated in #CCT2-4, and the local inlet temperature exceeds the ambient temperature (305 K) by 11°C.
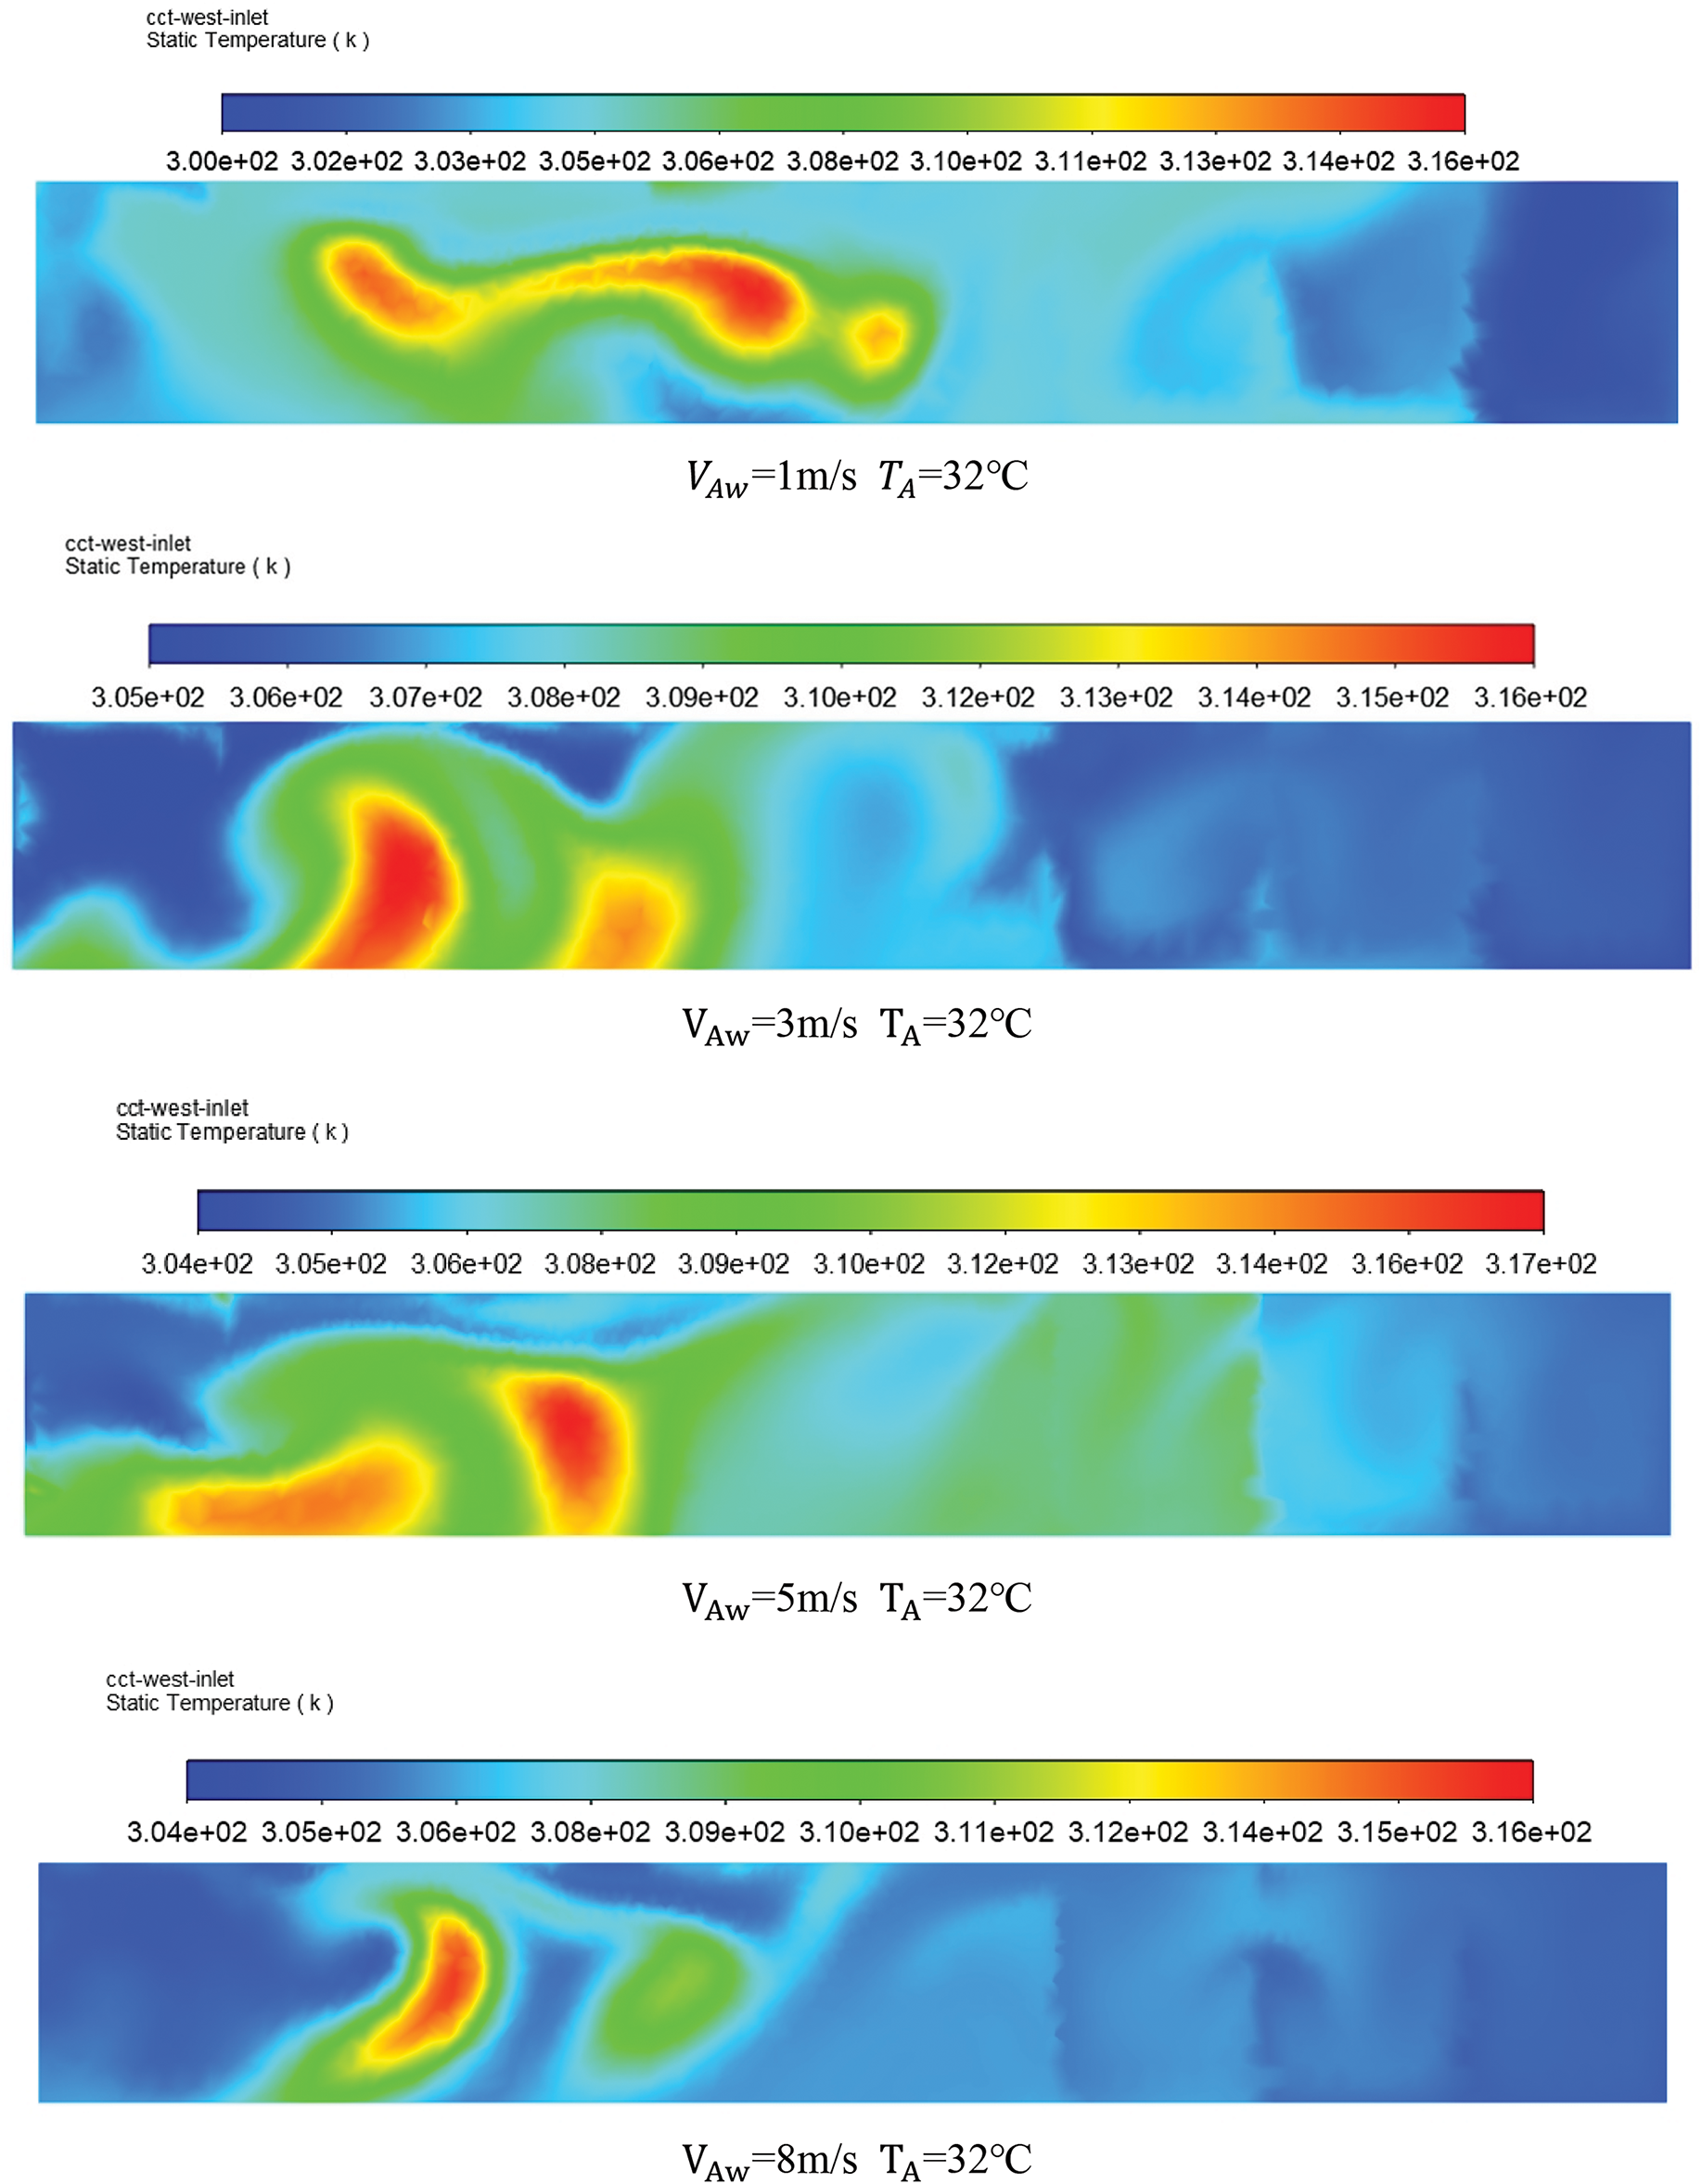
Figure 15: Temperature field of on the west inlet of CCT
As shown in Fig. 16, three monitoring lines with a length of 36 m are established along the Z-axis direction, and one is established every 1.5 m along the Y-axis.
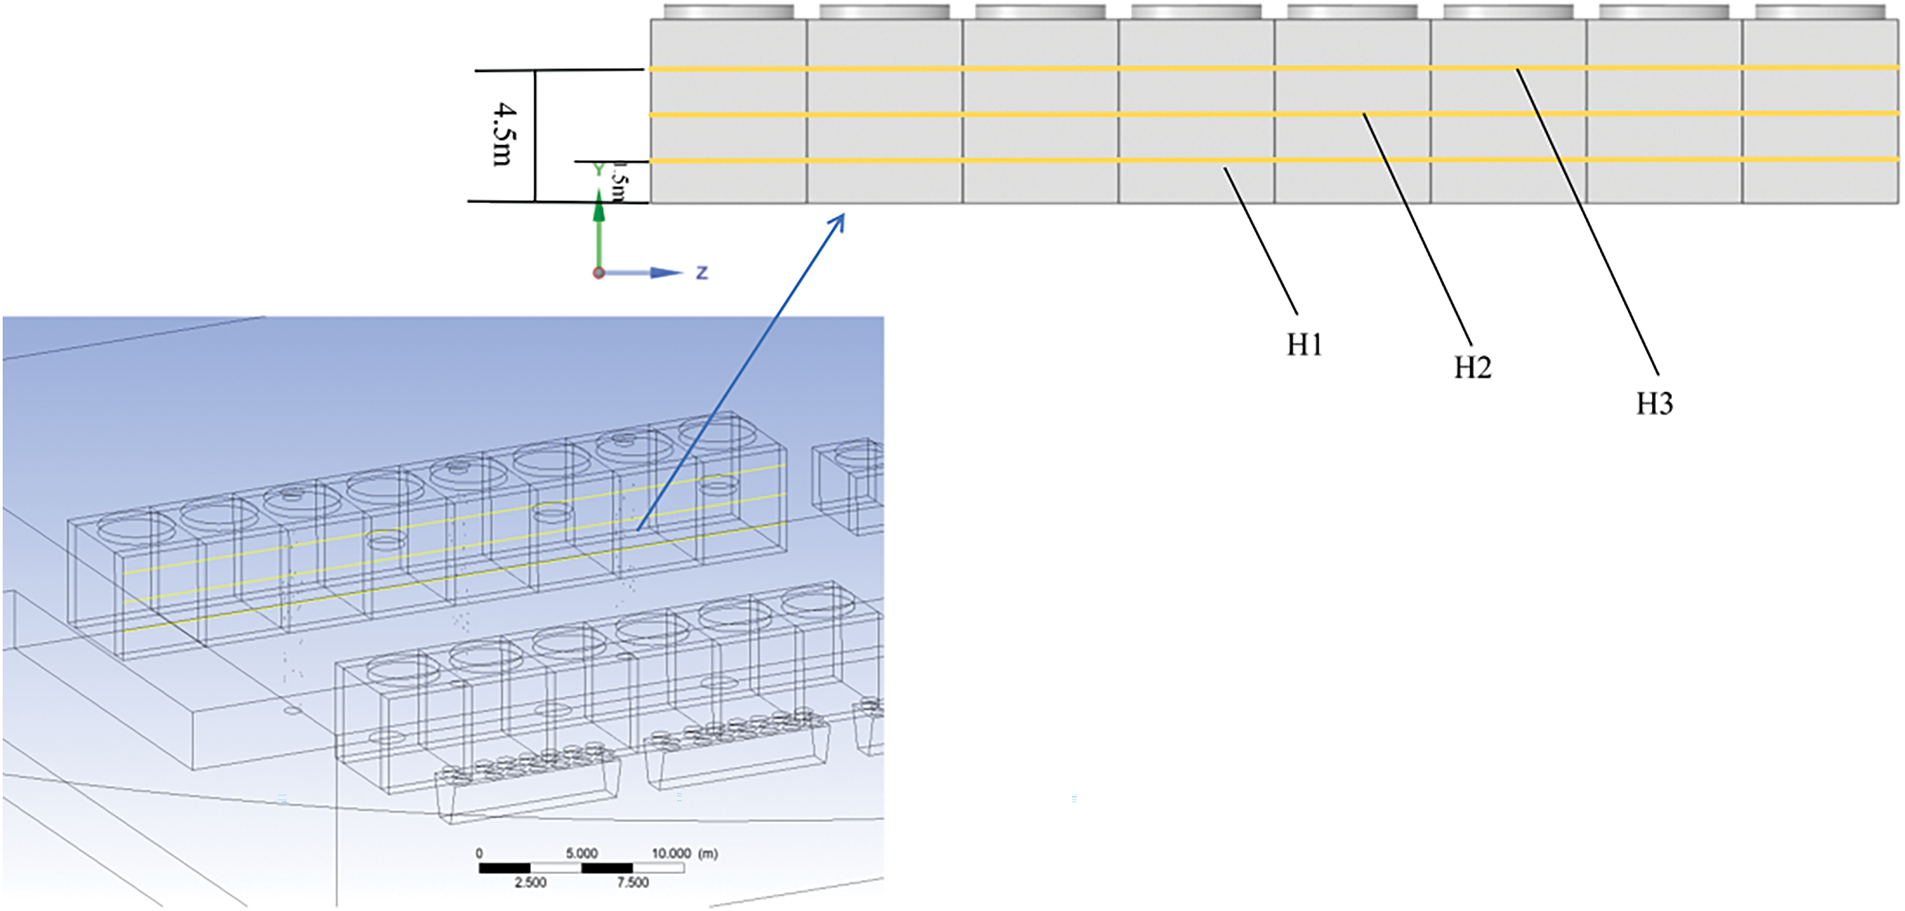
Figure 16: Schematic diagram of monitoring line arrangement
Fig. 17 shows the temperature trend of the west inlet of CCT under two different crosswind conditions. Firstly, when the ambient crosswind is 3 and 5 m/s, the inlet temperature on the west side of the CCT is all higher than the ambient temperature. Secondly, it is not difficult to see that the inlet air temperature of the CT generally shows a downward trend along the height. Between the heights of H1 and H2, that is, in the lower half of the inlet side of the CT, the temperature drop is relatively low, but between H2 and H3, there is a sudden drop in the inlet air temperature, which is particularly evident in #CCT1-4.
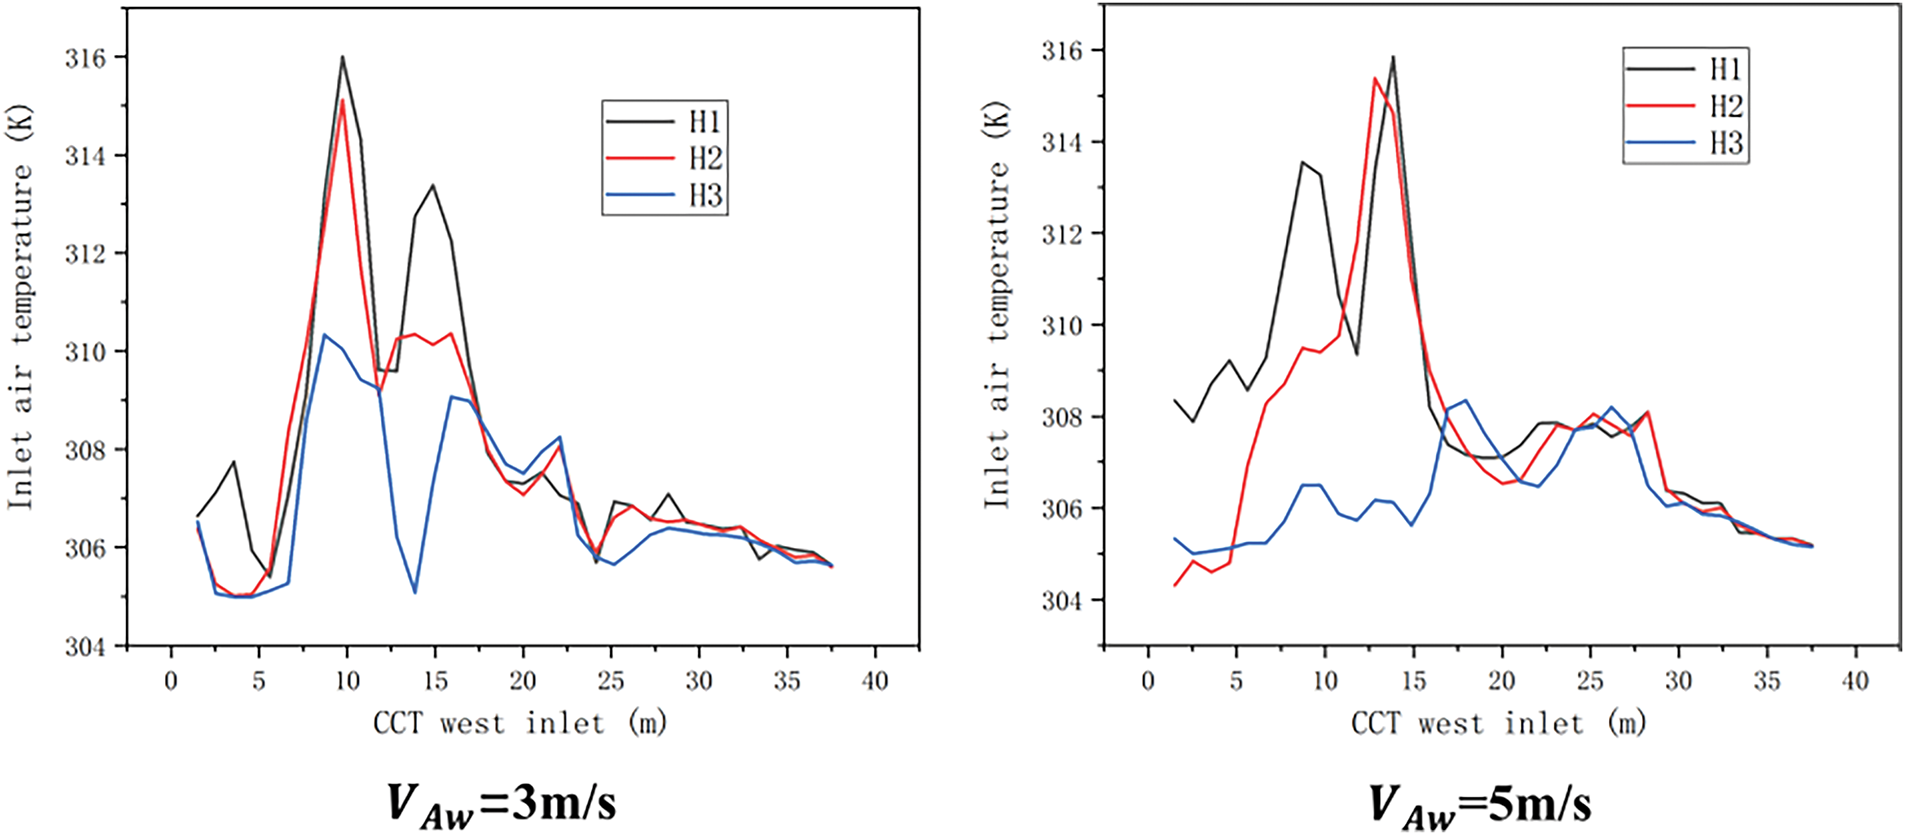
Figure 17: Inlet air temperature of the CT at different heights
Regarding the above phenomenon, Fig. 18 can explain the reason very well. As shown in the figure, the flue gas is discharged through the chimney and then obstructed by the chimney cap to turn back downwards. During this process, the flue gas first flows towards the ground and is then sucked into the CT through the negative pressure in the lower half of the air inlet. The remaining small part of the flue gas is mixed with the surrounding ambient air and sucked into the upper half of the air inlet. This is because the structural design and internal flow dynamics of the cooling tower create a negative pressure region during the air intake process, which facilitates the attraction of high-temperature air. In particular, at the base of the tower, the higher adsorption effect makes hot air more likely to stagnate. Additionally, due to the interaction between turbulence and ambient airflow at the bottom, small vortex structures are prone to form. These vortices restrict the inflow of cold air, thereby enhancing local heat accumulation and causing the inlet air temperature to gradually decrease along the vertical direction. Therefore, there is a phenomenon where the air temperature in the inlet area of the CT is lower in the upper half than in the lower half.
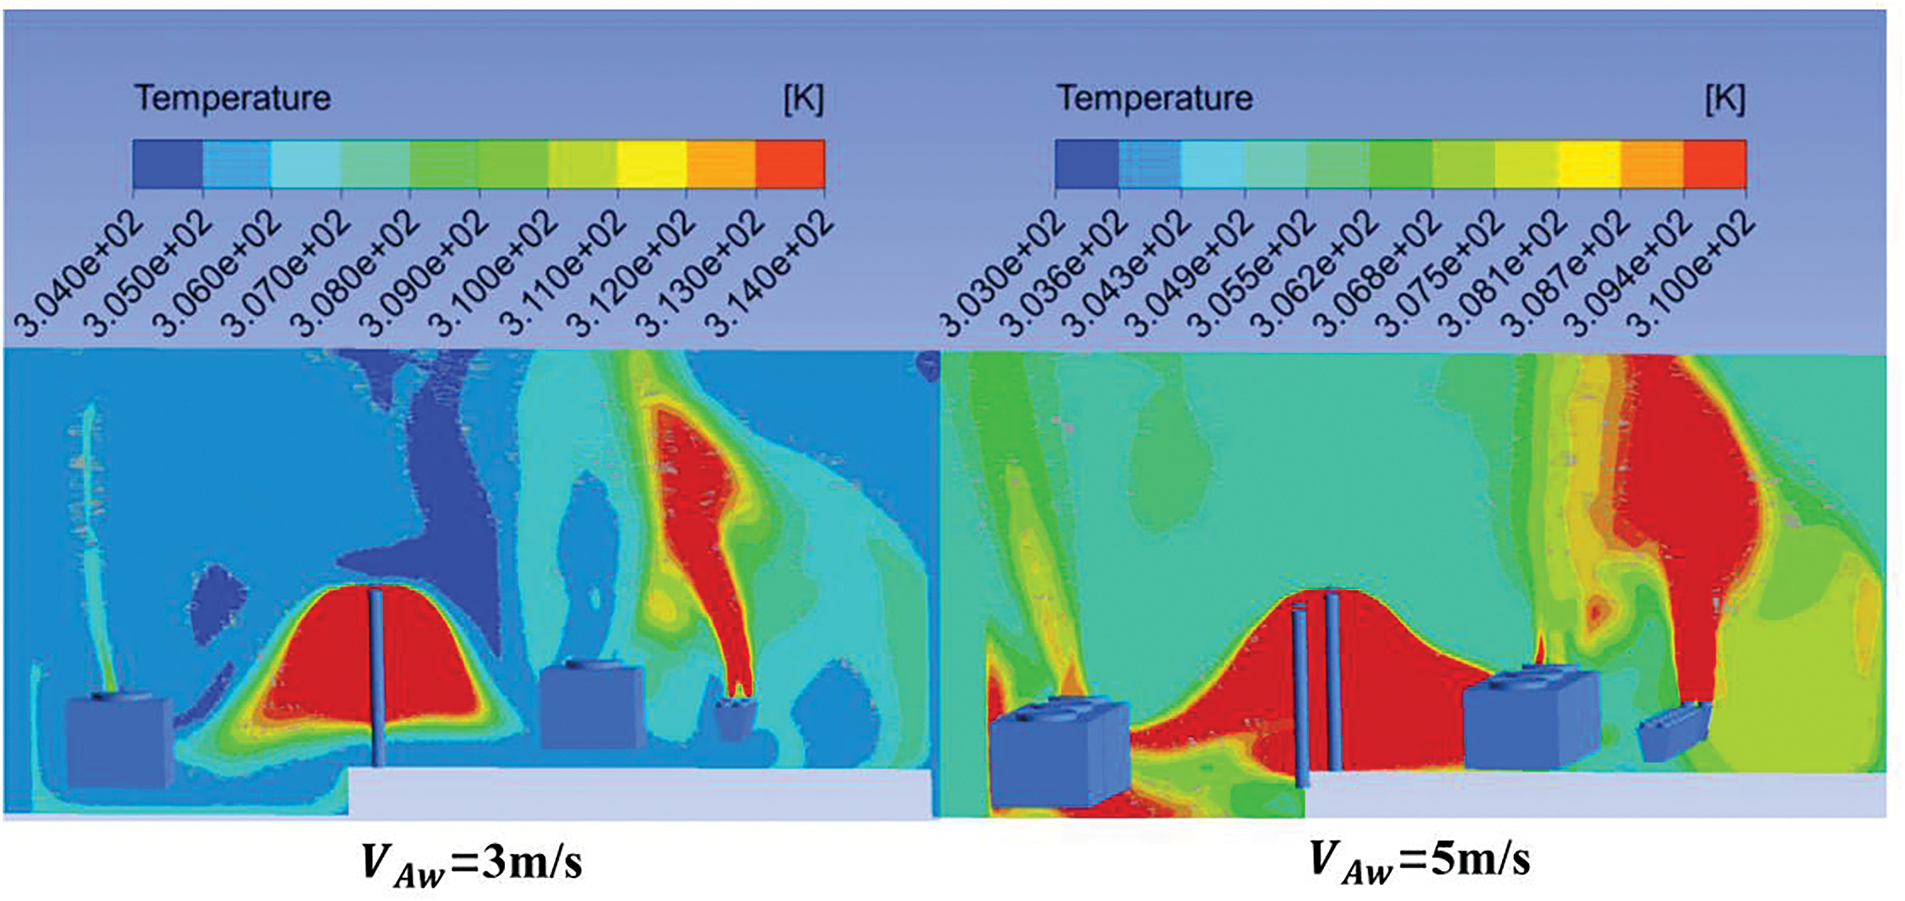
Figure 18: Temperature contour distribution in the cross-section of the chimney
Fig. 19 shows the average inlet air temperature along the Z-axis at the west side inlet of CCT under different ambient crosswinds. It can be seen that when the environmental crosswind is 1–3 m/s, as the ambient crosswind speed increases, the average inlet air temperature on the west side of CCT increases, and the increase in average inlet air temperature is between 1°C–2°C. The ambient wind speed is proportional to the inlet air temperature. This phenomenon is primarily attributed to the increasing wind cap effect as ambient wind speed rises, which traps hot flue gas near the platform. The accumulated hot gas is then directed toward the vicinity of the cooling towers, causing an initial rise in the inlet air temperature. As wind speed continues to increase, enhanced turbulence and dynamic airflow promote the mixing of hot gas with cooler ambient air. This mixing effect dilutes the concentration of hot gas while the heat dispersion mechanism transitions from buoyancy-driven natural convection to forced convection. This shift allows for more effective heat dissipation and alters the thermal distribution near the cooling towers, leading to a decrease in inlet air temperature. Consequently, as the ambient wind speed increases within the range of 1 to 8 m/s, the hot gas recirculation transitions from localized high-temperature accumulation to a broader platform-wide diffusion, thereby exhibiting a “bell-shaped trend” in the physical mechanism.
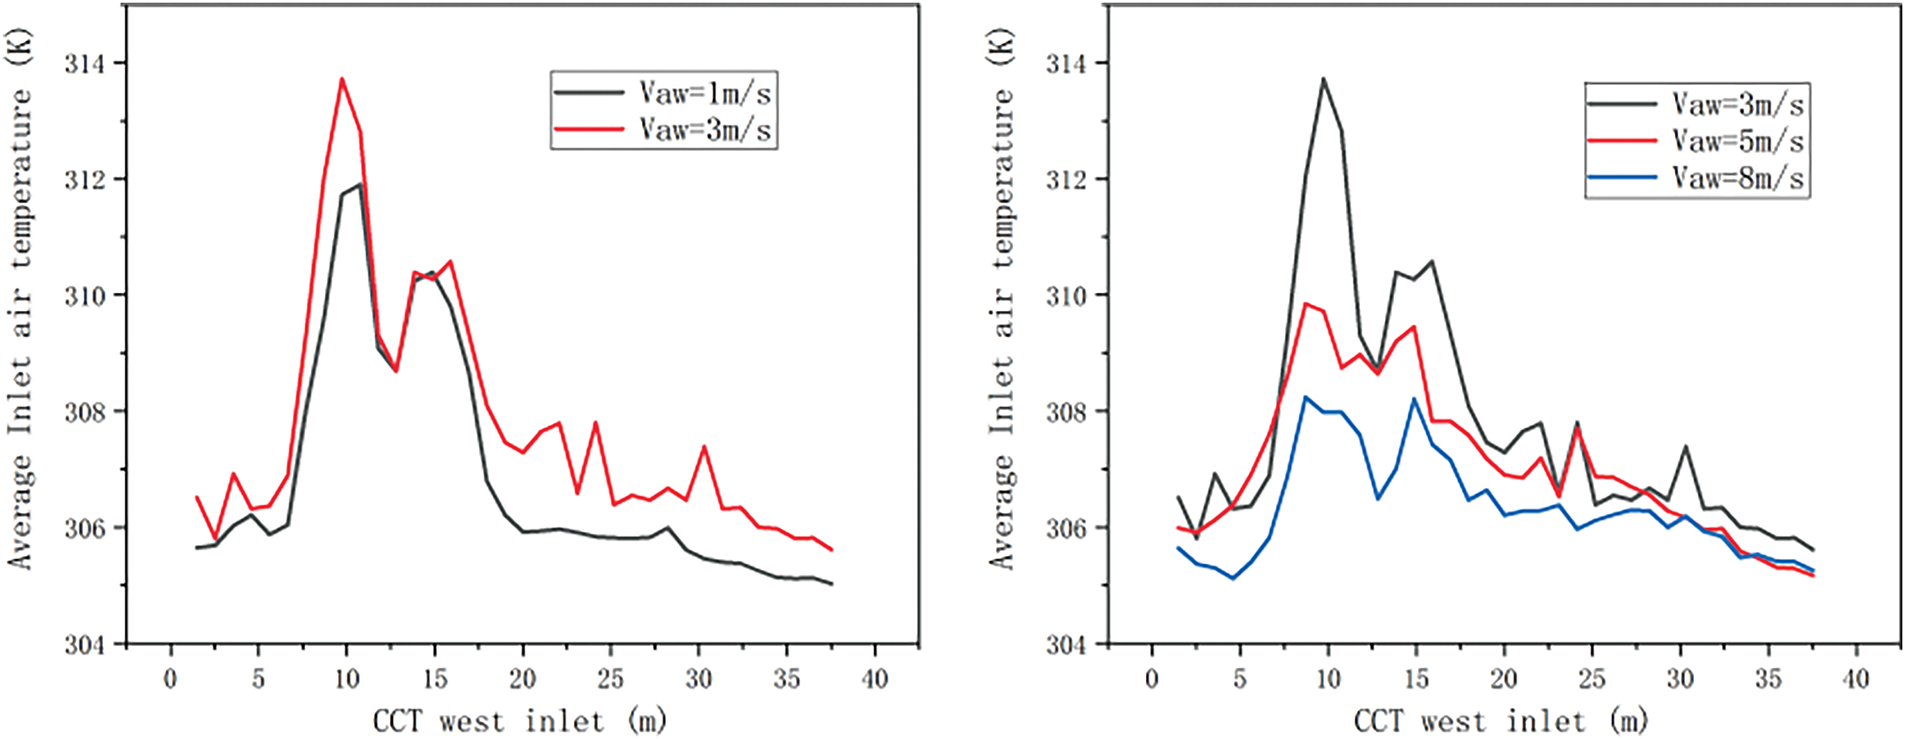
Figure 19: Horizontal trend of CCT inlet air temperature under different ambient wind
Based on various visual analyses, it can be concluded that for CCTs alone, the influence of crosswinds on their inlet air temperature first increases and then decreases within the range of 1–8 m/s, showing a nearly normal distribution, when the crosswind is 3 m/s, the average inlet air temperature reaches the extreme value under the current corresponding operating conditions. In terms of the entire energy station flow field, the increase in ambient crosswind has expanded the coverage of flue gas, affecting more cooling units.
3.8.2 A-Shaped and V-Shaped Chimney Cap Impact Analysis on Temperature and Flow Field
On the premise of fully considering that the functions of rainproof and windproof are not affected and the requirements of load-bearing are met, this study transforms the traditional A-shaped chimney cap into a brand new V-shaped chimney cap, and installs an expansion section at the chimney outlet to achieve the function of guiding the smoke, Fig. 20. The chimney cap, while undergoing a change in shape, retains its original height of 80 cm. This is because an excessively high cap could compromise its ability to shield against rain and wind, while a cap that is too low may hinder the effective exhaust of smoke.
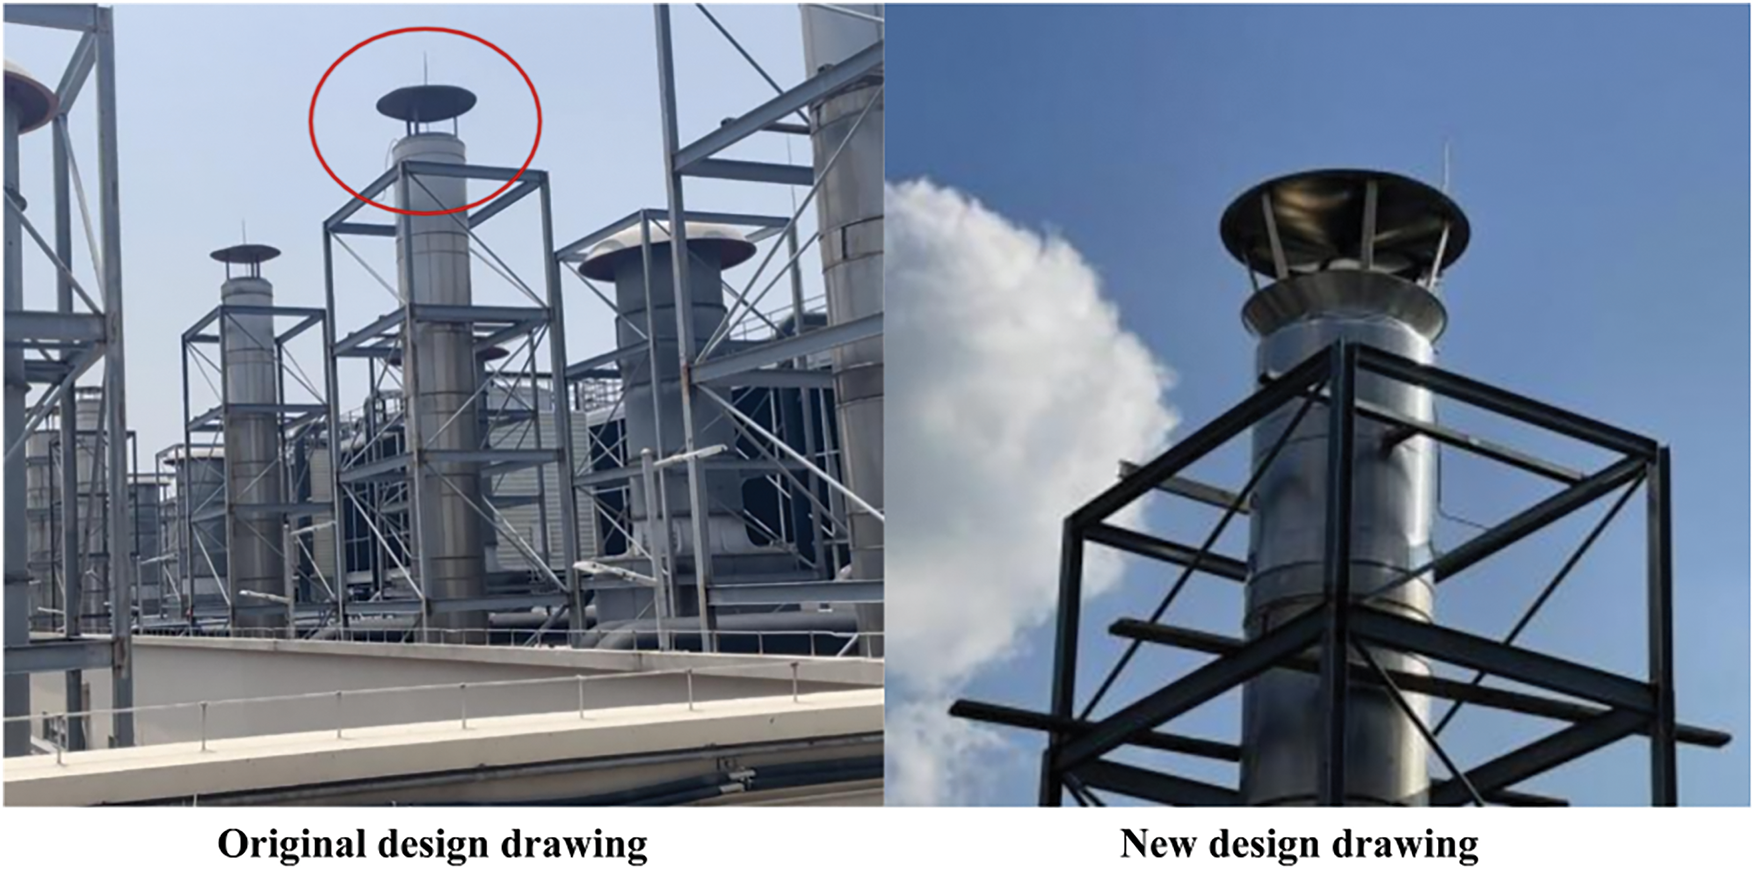
Figure 20: Physical drawings of A-shaped and V-shaped chimney caps
According to the streamline at the chimney outlet in Fig. 21, it can be seen that compared to the A-shaped chimney cap, the smoke outflow of the V-shaped chimney cap does not immediately turn downwards, but instead turns downwards after being lifted for a certain distance. According to the numerical calculation results, compared to the A-shaped chimney cap, the V-shaped chimney cap can effectively raise the flue gas height by 1.5–2.4 m before it recirculates downward. During this reciprocating process, the flue gas temperature decreases rapidly, thereby slowing down the impact on the temperature field.
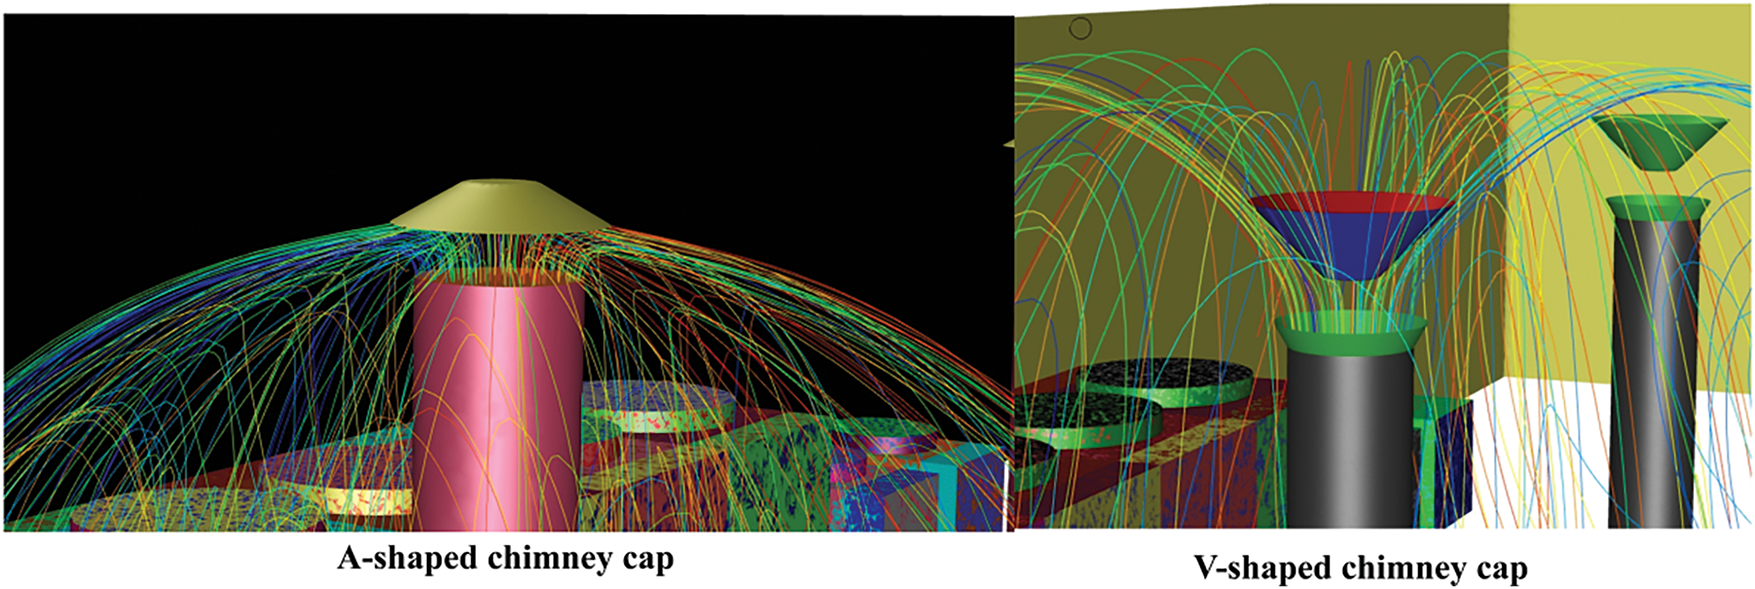
Figure 21: Streamline of chimney outlet under different chimney caps
The above analysis can be reasonably explained by the temperature field distribution in the cross-section of the chimney in Fig. 22. After installing a V-shaped smoke cap, the influence of smoke on the inlet side of CTs on both sides is significantly reduced, and the inlet temperature decreases significantly.

Figure 22: Temperature field comparison under different chimney caps
3.8.3 Evaluation of Cooling Efficiency of Various Cooling Equipment after Renovation
The V-shaped chimney cap effectively reduces the air inlet temperature of the CT, improves the heat exchange between air and water in the packing area, and further improves the cooling efficiency. According to the field measurement, the cooling efficiency of the CT is much higher than that under the A-shaped chimney cap under the same environmental conditions and working conditions. As shown in Fig. 23, the cooling efficiency of CT under A-shaped chimney cap is between 0.2 and 0.4, and the average cooling efficiency is 0.288; The average cooling efficiency is 0.561 under V-shaped chimney cap. The average cooling efficiency increased by 0.273. However, due to the presence of data discreteness, the calculation of cooling efficiency has a certain degree of error. According to the error range calculation, the fluctuation of cooling efficiency error is 0.144. That is, compared with the A-shaped chimney cap, the improvement in cooling efficiency of the cooling tower under the V-shaped chimney cap falls within the range of 0.273 ± 0.144.
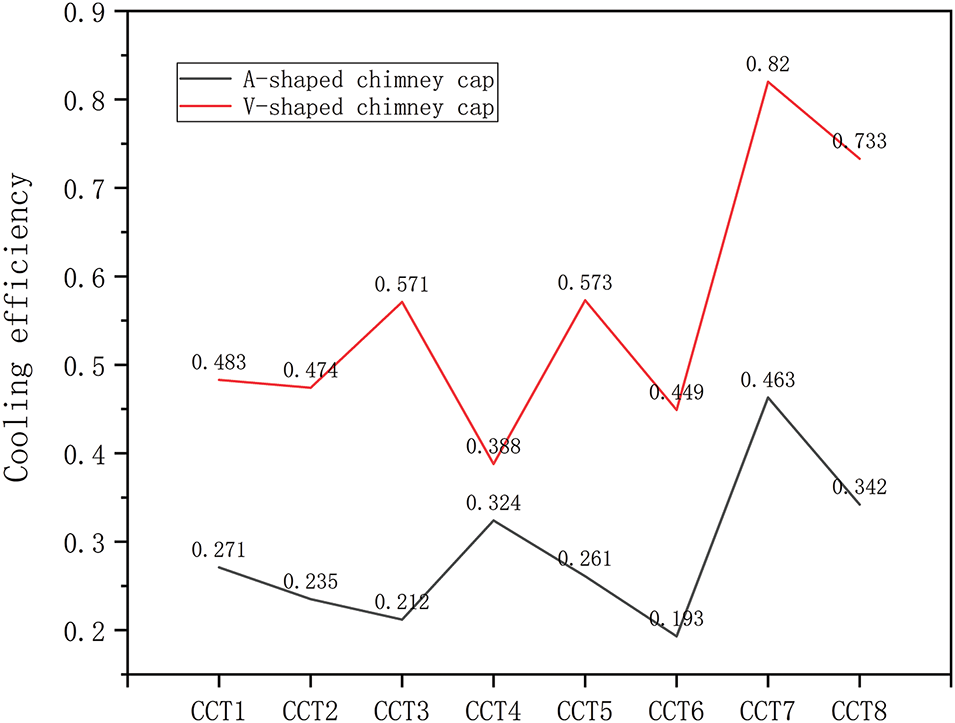
Figure 23: Cooling efficiency comparison under different chimney caps
According to calculations, at the rated water flow rate of the cooling tower, the improvement in cooling efficiency leads to an average increase of 0.787 GJ/h in the cooling capacity of the Centrifugal refrigeration machine.
This paper comprehensively studies the problem of low efficiency of various cooling devices and heat dissipation devices at the integrated discharge end of the top floor of a natural gas distributed energy station through experimental and numerical simulation methods. The following conclusions can be drawn from the above analysis:
(1) The experimental research mainly measured the temperature field and velocity field on the top floor, calculated the efficiency of various cooling equipment, and obtained relatively accurate results. Secondly, a preliminary qualitative analysis was conducted on the existing problems of the energy station. The experiment found that the hot gas recirculation from the chimney seriously affects the air intake of the CT, resulting in extremely low cooling efficiency. In severe weather conditions, the cooling efficiency of some CTs is less than 0.1.
(2) A three-dimensional aerodynamic field mathematical model was established for the integrated exhaust end, and numerical simulations were conducted on the hot gas recirculation law under different crosswind conditions. It was found that within 1–8 m/s, the increase in ambient crosswind intensified the hot gas recirculation effect, and the coverage area of flue gas expanded. As for CCTs, the influence of crosswind on their inlet air temperature first increases and then decreases within the range of 1–8 m/s, showing a nearly normal distribution. When the ambient crosswind is 3 m/s, the average inlet air temperature reaches the extreme value under the current corresponding operating conditions.
(3) This paper proposes for the first time a V-shaped chimney cap that includes an expansion section, it was found that the reconstruction design of the chimney cap reduced its own hindering effect on flue gas, lowered the inlet air temperature of the CTs, and slowed down the hot gas recirculation effect. After being put into use, it was found that it increased the cooling efficiency of the CT by 27.3%, averagely.
Based on the economic evaluation, the investment in the V-shaped chimney cap is the same as that of the original chimney cap, with only the shape being modified. The 27.3% improvement in cooling efficiency results in an energy saving of 0.787 GJ/h. This design demonstrates significant economic benefits in long-term operation. However, considering the high flue gas temperature, prolonged use may lead to fatigue and degradation of the chimney cap, affecting the normal exhaust of flue gases. Therefore, further assessment through long-term monitoring data is required to evaluate its stability and actual service life. Additionally, future research may explore alternative solutions such as hydrophobic or catalytic coatings, as well as structural modifications like guide plates or increased chimney height, to further optimize the cooling system.
Acknowledgement: This paper was completed with the hard help of every author.
Funding Statement: The funding support from the Shandong Provincial Science and Technology SMEs Innovation Capacity Improvement Project (2023TSGC0087), the Shandong Natural Science Foundation (Grant No. ZR2022ME008) and China Postdoctoral Science Foundation (2023M732102).
Author Contributions: Shuang Li: Conceptualization, Investigation, Formal analysis, Writing—original draft. Shen Cheng: Formal analysis, Methodology, Writing—review & editing, Project administration, Supervision, Funding acquisition, Validation. Suoying He: Resources, Supervision, Project administration, Funding acquisition, Writing—review & editing, Validation. Jiarui Wu: Investigation, draft, Resources. Ruiting Meng: Software, Data curation, Formal analysis. All authors reviewed the results and approved the final version of the manuscript.
Availability of Data and Materials: Data will be made available on request.
Ethics Approval: Not applicable.
Conflicts of Interest: The authors declare no conflicts of interest to report regarding the present study.
Nomenclature
| C | Specific heat capacity, J/kg |
| Specific enthalpy, J/kg | |
| N | Cooling number |
| Q | Water flow rate, t/h |
| T | Temperature, °C |
| V | Volume, m3 |
| P | Pressure, pa |
| Greek Symbols | |
| Volumetric mass transfer coefficient, kg/(m3·h) | |
| Relative humidity, % | |
| Density, kg/m3 | |
| Cooling efficiency | |
| Heat, kJ/kg | |
| Subscripts | |
| a | Air |
| ai | Air inlet |
| ao | Air outlet |
| B | Body |
| db | Dry bulb |
| F | Filling |
| wi | Water inlet |
| wo | Water outlet |
| wb | Wet bulb |
| v | Vapor |
References
1. Ge Y, Han J, Zhu X, Li J, Zhu W, Yang J, et al. Power/thermal-to-hydrogen energy storage applied to natural-gas distributed energy system in different climate regions of China. Energy Convers Manag. 2023;283:116924. doi:10.1016/j.enconman.2023.116924. [Google Scholar] [CrossRef]
2. Wang J, Yang Y, Sui J, Jin H. Multi-objective energy planning for regional natural gas distributed energy: a case study. J Nat Gas Sci Eng. 2016;28:418–33. doi:10.1016/j.jngse.2015.12.008. [Google Scholar] [CrossRef]
3. Ge Y, Han J, Ma Q, Feng J. Optimal configuration and operation analysis of solar-assisted natural gas distributed energy system with energy storage. Energy. 2022;246:123429. doi:10.1016/j.energy.2022.123429. [Google Scholar] [CrossRef]
4. Li M, Zhou M, Feng Y, Mu H, Ma Q, Ma B. Integrated design and optimization of natural gas distributed energy system for regional building complex. Energy Build. 2017;154(8):81–95. doi:10.1016/j.enbuild.2017.08.053. [Google Scholar] [CrossRef]
5. Khattak SI, Khan A, Hussain K. Green technology innovations, natural gas and resource extraction strategies in BRICS: modeling impacts on CO2 emission intensity. Sustain Futures. 2024;7:100227. doi:10.1016/j.sftr.2024.100227. [Google Scholar] [CrossRef]
6. Wei N, Pei J, Li H, Zhou S, Zhao J, Kvamme B, et al. Classification of natural gas hydrate resources: review, application and prospect. J Nat Gas Sci Eng. 2024;124:205269. doi:10.1016/j.jgsce.2024.205269. [Google Scholar] [CrossRef]
7. Zou C, Lin M, Ma F, Liu H, Yang Z, Zhang G, et al. Development, challenges and strategies of natural gas industry under carbon neutral target in China. Pet Explor Dev. 2024;51(4):476–97. doi:10.1016/S1876-3804(24)60038-8. [Google Scholar] [CrossRef]
8. Suranjan Salins S, Kumar S, González AT, Shetty S. Influence of packing configuration and flow rate on the performance of a forced draft wet cooling tower. J Build Eng. 2023;72(9):106615. doi:10.1016/j.jobe.2023.106615. [Google Scholar] [CrossRef]
9. Zhao Z, Gao J, Zhu X, Qiu Q. Experimental study of the corrugated structure of film packing on thermal and resistance characteristics of cross-flow cooling tower. Int Commun Heat Mass Transf. 2023;141:106610. doi:10.1016/j.icheatmasstransfer.2022.106610. [Google Scholar] [CrossRef]
10. Zhang D, Chen R, Zhang Z, He S, Gao M. Crosswind influence on heat and mass transfer performance for wet cooling tower equipped with an axial fan. Case Stud Therm Eng. 2021;27(1):101259. doi:10.1016/j.csite.2021.101259. [Google Scholar] [CrossRef]
11. Wang Y, Liu Y, Yuan X, Niu P, He S, Gao M, et al. Crosswind effects on thermal performance improvement of mechanical draft cooling towers with deflector plates. Appl Therm Eng. 2024;253:123839. doi:10.1016/j.applthermaleng.2024.123839. [Google Scholar] [CrossRef]
12. Shirazi M, Jahangiri A. 3D numerical study using three novel windbreak walls in natural draft dry cooling towers for performance enhancement under various crosswind conditions. Therm Sci Eng Prog. 2021;25(9):100971. doi:10.1016/j.tsep.2021.100971. [Google Scholar] [CrossRef]
13. Deng W, Sun F, Wang R, He K. Influence mechanism of the louver on the thermal performance of the mechanical draft wet cooling tower. Appl Therm Eng. 2023;230:120640. doi:10.1016/j.applthermaleng.2023.120640. [Google Scholar] [CrossRef]
14. Deng W, Sun F, Chen K, Zhang X. New method to decrease the air recirculation of mechanical draft wet cooling tower group by increasing height of fan duct. Appl Therm Eng. 2023;219(3):119645. doi:10.1016/j.applthermaleng.2022.119645. [Google Scholar] [CrossRef]
15. Deng W, Sun F, Chen K, Zhang X. New retrofit method to cooling capacity improvement of mechanical draft wet cooling tower group. Int J Heat Mass Transf. 2022;188:122589. doi:10.1016/j.ijheatmasstransfer.2022.122589. [Google Scholar] [CrossRef]
16. Deng W, Sun F, Chen K, Zhang X. The research on plume abatement and water saving of mechanical draft wet cooling tower based on the rectangle module. Int Commun Heat Mass Transf. 2022;136:106184. doi:10.1016/j.icheatmasstransfer.2022.106184. [Google Scholar] [CrossRef]
17. Jiang L, Zhang Z, Sang P, Dong L, He S, Gao M, et al. Influence of noise barrier and louver on ventilation and thermal performance of wet cooling towers under crosswind conditions. Int J Therm Sci. 2022;173(2):107364. doi:10.1016/j.ijthermalsci.2021.107364. [Google Scholar] [CrossRef]
18. Lee JH, Moshfeghi M, Choi YK, Hur N. A numerical simulation on recirculation phenomena of the plume generated by obstacles around a row of cooling towers. Appl Therm Eng. 2014;72(4):10–9. doi:10.1016/j.applthermaleng.2014.04.021. [Google Scholar] [CrossRef]
19. Ma H, Cai L, Si F. Numerical study identifies the interaction between two adjacent dry cooling towers on fluid flow and heat transfer performances of the radiators at different points of each tower. Int J Therm Sci. 2023;191:108351. doi:10.1016/j.ijthermalsci.2023.108351. [Google Scholar] [CrossRef]
20. Cuce E, Sen H, Cuce PM. Numerical performance modelling of solar chimney power plants: influence of chimney height for a pilot plant in Manzanares, Spain. Sustain Energy Technol Assess. 2020;39(1):100711. doi:10.1016/j.seta.2020.100704. [Google Scholar] [CrossRef]
21. Teng K, Peng H, Lv C, Sun H, Wu H. Optimization of emission chimney heights for uranium enrichment facility based on individual dose. J Environ Radioact. 2022;255(2):107014. doi:10.1016/j.jenvrad.2022.107014. [Google Scholar] [PubMed] [CrossRef]
22. Moffat RJ. Describing the uncertainties in experimental results. Exp Therm Fluid Sci. 1988;1(3):3–17. doi:10.1016/0894-1777(88)90043-X. [Google Scholar] [CrossRef]
23. Moffat RJ. Contributions to the theory of single-sample uncertainty analysis. J Fluids Eng. 1982;104(5):250–8. doi:10.1115/1.3241818. [Google Scholar] [CrossRef]
24. Klimanek A. Numerical modelling of natural draft wet-cooling towers. Arch Comput Meth Eng. 2013;20(1):61–109. doi:10.1007/s11831-013-9081-9. [Google Scholar] [CrossRef]
25. Zhao Y, Sun F, Long G, Huang X, Huang W, Lyv D, et al. Comparative study on the cooling characteristics of high-level water collecting natural draft wet cooling tower and the usual cooling tower. Energ Conver Manage. 2016;116(3):150–64. doi:10.1016/j.enconman.2016.02.071. [Google Scholar] [CrossRef]
26. Dang C, Jia L, Yang L. Effects of acoustic barriers and crosswind on the operating performance of evaporative cooling tower groups. J Therm Sci. 2016;25(5):532–41. doi:10.1007/s11630-016-0895-2. [Google Scholar] [CrossRef]
Cite This Article
 Copyright © 2025 The Author(s). Published by Tech Science Press.
This work is licensed under a Creative Commons Attribution 4.0 International License , which permits unrestricted use, distribution, and reproduction in any medium, provided the original work is properly cited.
 Downloads
 Citation Tools