
 Submit a Paper
 Propose a Special lssue
 Open Access
ARTICLE

Electricity Theft and Its Impact on Quality of Service in Lubumbashi, DR Congo
1 Department of Electrical Engineering, School of Engineering, University of Lubumbashi, Lubumbashi, P.O. Box 1825, Democratic Republic of the Congo
2 Department of Metallurgy, Polytechnic, University of Lubumbashi, Lubumbashi, P.O. Box 1825, Democratic Republic of the Congo
3 Department of Electrical Engineering, University of KwaZulu-Natal, Durban, 4041, South Africa
4 Department of Geography, Faculty of Sciences, University of Lubumbashi, Lubumbashi, P.O. Box 1825, Democratic Republic of the Congo
* Corresponding Author: David Milambo Kasumba. Email:
Energy Engineering 2025, 122(6), 2401-2416. https://doi.org/10.32604/ee.2025.063144
Received 06 January 2025; Accepted 26 March 2025; Issue published 29 May 2025
 View Full Text
 Download PDF
Abstract
Electricity theft significantly impacts the reliability and sustainability of electricity services, particularly in developing regions. However, the socio-economic, infrastructural, and institutional drivers of theft remain inadequately explored. Here we examine electricity theft in Lubumbashi, Democratic Republic of Congo, focusing on its patterns, causes, and impacts on service quality. Theft rates exceeded 75% in peripheral municipalities like Katuba and Kampemba, driven by poverty, weak law enforcement, and poor infrastructure dominated by above-ground networks. In contrast, central areas like Kamalondo and Lubumbashi reported lower theft rates due to better urban planning and underground systems. We found that electricity theft directly correlates with frequent voltage fluctuations, prolonged outages, and grid overloads. Socio-economic factors, including high connection fees and poverty, emerged as primary drivers, while institutional weaknesses such as corruption and ineffective enforcement perpetuate theft. Addressing theft requires a holistic approach integrating infrastructure modernization, socio-economic reforms, and institutional strengthening. Transitioning to underground networks, providing affordable electricity access, and adopting advanced metering systems are crucial. Overall, this study highlights the systemic nature of electricity theft and provides actionable insights for improving electricity service delivery and equity in urban settings.Keywords
Electricity theft is a pervasive global challenge, undermining the financial sustainability of utilities, diminishing service quality, and exacerbating energy inequalities. Defined as the unauthorized use of electricity without proper payment, theft is estimated to contribute to losses exceeding $89 billion annually, with developing countries bearing the brunt of these losses [1]. In these regions, electricity theft often accounts for 20%–30% of distributed electricity, placing immense pressure on utilities already struggling with infrastructure deficits, inefficient systems, and limited resources [2]; Beyond its economic toll, electricity theft disrupts grid reliability, resulting in voltage fluctuations, outages, and increased maintenance costs, disproportionately affecting low-income households and small businesses that depend on reliablepower [3–7].
The socio-economic drivers of electricity theft are deeply intertwined with the structural and institutional inequities prevalent in developing countries. Poverty, unemployment, and lack of affordable access to legal electricity connections compel many households and businesses to resort to theft [3,8]. High electricity tariffs and prohibitive connection fees further deter many households from accessing electricity legally, pushing them to seek illicit means [3]. Meanwhile, weak regulatory frameworks, ineffective enforcement mechanisms, and corruption within utility organizations create an environment where theft can thrive [9]. Fraudulent practices, often facilitated by utility staff or contractors in exchange for bribes, exacerbate the problem [4]. As a result, electricity theft becomes a reflection of broader socio-economic disparities and governance failures, rather than simply a technical problem for utilities to address [10].
Sub-Saharan Africa exemplifies the complexities and consequences of electricity theft. Despite being home to some of the fastest-growing economies, the region has one of the lowest rates of electricity access globally, with only 48% of the population connected to the grid in 2021 galegalemd [11]. Even for those with access, the supply is often unreliable, characterized by frequent outages and poor voltage quality [12]. Electricity theft exacerbates these issues, contributing to system losses that make it difficult for utilities to invest in infrastructure upgrades or expand services to underserved areas [13]. For instance, non-technical losses (NTLs), which include electricity theft, can account for up to 50% of total energy losses in some regions [3].
The Democratic Republic of Congo (DRC) provides a stark illustration of the multi-faceted challenges associated with electricity theft. With an electrification rate of approximately 19%, the DRC ranks among the lowest in the world for electricity access (World Bank, 2021). Société Nationale d’Électricité (SNEL), the country’s national electricity utility, reports that nearly 40% of distributed electricity is lost to theft, representing one of the highest rates in Sub-Saharan Africa (SNEL Annual Report, 2022). Lubumbashi, the second-largest city in the DRC and an industrial hub, is particularly affected. Approximately 20% of households in Lubumbashi reportedly access electricity illegally [3,14,15]
Despite the significance of the problem, systematic research on electricity theft in Lubumbashi is scarce. Existing studies predominantly focus on macroeconomic analyses of theft’s financial costs or technological solutions, such as advanced metering infrastructure and grid modernization [2,13]. While these measures offer potential benefits, they often fail to address the socio-economic drivers of theft or the institutional weaknesses that sustain it [16]. These gaps in understanding limit the effectiveness of interventions, which frequently prioritize punitive measures over holistic solutions that balance enforcement with socio-economic and institutional reforms [3] contexts such as Lubumbashi is shaped by a complex interplay of factors that transcend technical issues. Socio-economic disparities, including high poverty rates and unemployment, create conditions where theft becomes a survival strategy for marginalized populations [3]. Overall, the relationship between electricity theft and service quality remains poorly understood. While it is widely acknowledged that theft contributes to technical inefficiencies, such as grid overloading and increased transformer failures, there is limited empirical evidence quantifying these impacts [4]. This study seeks to investigate the socio-economic, infrastructural, and institutional drivers of electricity theft in Lubumbashi, Democratic Republic of Congo. Our study makes several key contributions that address both the technical and socio-economic aspects of electricity theft in Lubumbashi. First, we quantify the socio-economic, infrastructural, and institutional drivers of electricity theft, providing a comprehensive understanding of the factors at play. Second, we examine the direct impact of illegal connections on service quality by analyzing voltage fluctuations and power outages, thereby highlighting the operational challenges posed by theft. Third, our findings offer actionable insights and recommendations, emphasizing an integrated approach that includes infrastructure modernization, socio-economic reforms, and enhanced institutional oversight. These contributions not only advance the academic discussion on electricity theft but also provide practical strategies for improving service reliability in urban settings.
The study was conducted in Lubumbashi, the second largest city in the Democratic Republic of Congo (DRC). Located in the Haut-Katanga province, southeastern DRC (11°20′–12°00′ S, 27°10′–10°27′ E). The city is administratively divided into 7 communes, including 3 planned communes: Lubumbashi, Kenya, Kamalondo, and 4 self-built communes: Katuba, Kampemba, Ruashi and Annexe: Katuba, Kampemba, Ruashi and Annexe. Between 1988 and 2020, its population decreased from 700,000 to 3,000,000 [17].
2.2 Study Design and Data Collection
This study used a mixed-methods approach, combining quantitative and qualitative data collection techniques to assess the prevalence and dynamics of electricity theft and its impact on service quality. A stratified random sampling method was applied, ensuring a representative selection of households across the seven municipalities. Each municipality served as a stratum to capture geographical and socioeconomic variations in electricity theft practices. The sample size was calculated using the Krejcie and Morgan formula, which resulted in an optimal sample size of 1211 households. This sample was distributed proportionally across municipalities, with approximately 173 households surveyed per municipality. This design allowed for the inclusion of households with diverse socioeconomic backgrounds and varied modes of access to electricity [18].
The data collected included access to electricity (legal or illegal), payment behaviors (including non-payment of bills), household perceptions of electricity quality and costs, motivations for engaging in electricity theft. In addition, semi-structured interviews were conducted with stakeholders including SNEL employees, utility contractors, and community leaders. These interviews provided qualitative insights into systemic challenges, such as corruption, gaps in law enforcement, and consumer grievances. Observations were made across the 7 communes that make up the city of Lubumbashi, leading to 6 ddl (k − 1) The Chi-square table in the appendix gives us X2 6 ddl = 12.592. Using the Formula (1) below:
where: S = required sample size;
Field observations were conducted to identify visible indicators of illegal connections, such as unauthorized meter bypassing and overhead power outlets. SNEL operational records and local authority reports were reviewed to complement primary data, particularly regarding statistics on electricity theft and service complaints.
2.3 Data Analysis and Statistics
2.3.1 Principal Component Analysis of Theft Dynamics
All statistical analyses were conducted using R software (version: R4.4.1). Principal Component Analysis (PCA) was employed to identify key variables driving electricity theft across the municipalities. This technique reduced the dimensionality of the data, focusing on variables such as connection types (overhead vs. underground), household income, and proximity to electricity infrastructure. PCA components were calculated using standardized Z-scores, with the analysis emphasizing the role of socioeconomic conditions and infrastructural disparities in shaping theft patterns.
2.3.2 Spatial Mapping of Theft Distribution
Geographic Information System (GIS) tools were applied to visualize the spatial distribution of electricity theft. GIS mapping highlighted theft clusters and their correlation with infrastructure quality and socioeconomic factors. The analysis linked theft-prone areas to physical infrastructure characteristics, particularly the predominance of overhead power lines in certain municipalities.
2.3.3 Correlation Analysis of Socioeconomic and Infrastructure Factors
Correlation analyses examined the relationships between electricity theft rates and socioeconomic variables such as household income and poverty levels. Infrastructure quality, a critical factor, was assessed using a composite infrastructure quality score. This score was derived by evaluating the proportion of above-ground vs. underground connections, the age of the electrical network, maintenance frequency, and accessibility to metered electricity. Higher scores reflected newer, well-maintained infrastructure with a predominance of underground networks, while lower scores were associated with aging, poorly maintained, or predominantly overhead networks.
2.3.4 Qualitative Assessment of Systemic Contributions
Semi-structured interviews with key stakeholders, including SNEL employees, contractors, and community leaders, were analyzed to uncover institutional practices influencing theft. Thematic coding highlighted patterns of bribery, meter tampering, and unauthorized connections. Field observations further documented visible signs of theft, including bypassed meters and unauthorized wiring. These qualitative findings complemented quantitative analyses, providing a comprehensive understanding of the systemic drivers of electricity theft.
3.1 Characteristics of Electrical Network and Typology of Electricity Theft
Above-ground canalization was the predominant type across all municipalities, with percentages ranging from approximately 60% to over 80%, while below-ground canalization remained comparatively low across all areas (Fig. 1). Municipalities with high percentages of above-ground canalization, such as Annexe, Katuba, and Kampemba, exhibited values up to 80%, whereas municipalities like Kamalondo and Lubumbashi showed a relatively higher proportion of below-ground canalization, though it still accounted for less than 40% of households. Overall, the spatial distribution of canalization types underscores the infrastructural disparities between municipalities and their potential role in shaping electricity theft patterns.

Figure 1: Type of pipeline to the electrical network
Illegal connections accounted for the largest share of electricity theft techniques (35%), followed by meter tampering (25%). Non-payment of bills contributed 20%, while employee corruption accounted for 15%. The least used method was upstream collection, accounting for only 5% of the total. These results indicate a diversity of techniques used, with a clear predominance of tampering and unauthorized connections (Fig. 2).

Figure 2: Diversity of techniques used to steal electricity
Illegal Connections: These are unauthorized physical taps into the network. Consumers bypass the official process to obtain power directly, often by physically connecting to the grid without a proper meter. This category reflects theft through direct, unregulated access. Meter Tampering: This technique involves altering or disabling the meter to under-record consumption. It can include bypassing the meter or rewiring to produce lower readings, allowing consumers to benefit from unmetered usage despite having a legal connection. Non-Payment of Bills: Here, consumers legally access electricity but deliberately evade payment. Although the consumption is recorded accurately, the theft lies in the financial aspect, as the user avoids settling the cost of the consumed power. Employee Corruption: This form involves collusion with utility staff. Employees might under-report consumption, manipulate billing records, or facilitate unauthorized connections in exchange for bribes, effectively enabling theft from within the system. Upstream Collection: The least common method, this category involves illicit tapping into the network at higher distribution points before the electricity reaches individual meters. It typically affects a broader area, as it occurs upstream of the consumer-level connection.
3.2 Links among Municipalities, Connection Methods, and Socio-Economic Factors
The biplot illustrates the relationship between municipalities, connection types, and socio-economic factors. Dim1 (51.5%) and Dim2 (31.12%) explain the majority of the variance in the dataset (Fig. 3). Katuba and Annexe are strongly associated with illegal and neighbor-based connections, highlighting informal electricity practices prevalent in these areas. Ruashi aligns closely with overhead connections, reflecting its reliance on above-ground distribution networks. Kampemba exhibits a clear association with underground connections, suggesting better infrastructure compared to peripheral areas. Kenya and Lubumbashi show strong links to prepaid and postpaid meter systems, indicating a higher prevalence of formal electricity services. Kamalondo is primarily associated with factors such as salary and monthly income, suggesting a more affluent demographic. Illegal connections are inversely related to salary, monthly income, and metered systems, while overhead connections dominate in less-developed municipalities like Ruashi.

Figure 3: Relationships among municipalities, connection types and socio-economic factors
3.3 Spatial Mapping of Electricity Theft
The spatial distribution map illustrates the concentration of illegal electricity connections across the city of Lubumbashi (Fig. 4). Illegal connections are predominantly clustered in peripheral municipalities such as Katuba, Kampemba, and Annexe, where informal settlements and overhead power lines are common. Central areas like Lubumbashi and Kamalondo display relatively fewer illegal connections, aligning with better urban planning and underground electricity networks. The map highlights distinct geographical patterns, with illegal connections being more widespread in areas with lower infrastructure quality and higher poverty levels.

Figure 4: The spatial distribution of illegal electrical connections across the city of Lubumbashi
3.4 Relationships between Theft Rates, Socio-Economic Factors, and Grid Performance
Illegal connection rates varied significantly across municipalities, with Katuba and Kampemba exhibiting the highest rates, exceeding 75%. Poor quality of service was the most frequently cited cause in these areas (Fig. 5). In contrast, Kamalondo showed moderate rates, largely attributed to poverty. Annexe recorded a high illegal connection rate, strongly linked to weak law enforcement. Municipalities such as Lubumbashi had comparatively lower rates, where dissatisfaction with service was the primary driver. Ruashi demonstrated a mixed pattern, with unemployment and weak law enforcement contributing to its rates. Overall, the causes of illegal connections showed distinct patterns tied to local socioeconomic and infrastructural conditions.

Figure 5: Rate of illegal electricity connection by municipality and their causes
The percentage of illegal connections decreases as household income levels increase. Households with income levels below 10,000 Congolese francs (CDF) exhibit the highest rate of illegal connections, exceeding 70%, and represent the largest proportion of households (30%). In contrast, households earning above 100,000 CDF have the lowest rate of illegal connections, below 10%, and constitute the smallest household proportion. Intermediate income brackets, such as 10,001–50,000 CDF, show moderate illegal connection rates, between 50% and 70%, with varying household percentages (Fig. 6).

Figure 6: Relationship between illegal connection and household income level
Voltage fluctuations and illegal connection rates show a positive correlation across municipalities (Fig. 7). Katuba exhibits the highest illegal connection rate, exceeding 90%, and the greatest frequency of voltage fluctuations (50 events/year), alongside the highest number of power outages (300 days/year). Annexe follows closely, with an illegal connection rate of around 85%, frequent voltage fluctuations(45 events/year), and 300 power outage days/year. Kampemba and Kenya show moderate illegal connection rates, between 70% and 80%, with voltage fluctuations around 40 events/year and 200 outage days/year. Ruashi records slightly lower values, with an illegal connection rate of approximately 65% and voltage fluctuations of 35 events/year. Kamalondo and Lubumbashi have the lowest illegal connection rates (below 60%) and experience fewer voltage fluctuations (25–30 events/year), along with fewer power outage days (100–200 days/year).

Figure 7: Links among voltage fluctuation, illegal connection rate, and power outages
Energy consumption shows a clear disparity between legal and illegal access types across municipalities (Fig. 8). Illegal consumption dominates in most municipalities, with Katuba, Kampemba, and Annexe showing higher proportions of illegal energy use relative to legal use. Lubumbashi and Kamalondo exhibit a more balanced distribution, although illegal consumption still exceeds legal use. Kenya shows the highest total energy consumption, with illegal consumption accounting for the majority. When aggregated at the city level, illegal energy consumption significantly outweighs legal consumption, highlighting the pervasive nature of unauthorized access to electricity across the region.

Figure 8: Legal and illegal energy consumption by municipality
The relationship between infrastructure quality and illegal connections shows a clear inverse trend. Municipalities with lower infrastructure quality scores, such as Katuba, Kampemba, and Annexe, have the highest illegal connection rates, exceeding 80% (Fig. 9). Conversely, municipalities like Kamalondo and Lubumbashi, with higher infrastructure quality scores (above 4.0), exhibit lower illegal connection rates, below 60%. Energy consumption, represented by bubble size, is generally higher in municipalities with better infrastructure quality, such as Kenya and Lubumbashi, where legal connections are more prevalent. In contrast, areas with high illegal connection rates, like Katuba and Kampemba, have moderate to high energy consumption despite poor infrastructure. This pattern highlights a strong correlation between infrastructure quality and the prevalence of illegal connections.

Figure 9: Relationship among infrastructure quality, illegal connections, and energy consumption
The correlation matrix reveals that better infrastructure quality strongly correlates with fewer illegal connections and fewer transformer overloads, indicating that well-maintained or modernized systems reduce opportunities for unauthorized access and strain on equipment (Fig. 10). In contrast, high rates of illegal connections positively correlate with transformer overloads, suggesting that unregulated consumption increases demand surges beyond system capacity. Interestingly, municipalities with higherinfrastructure quality report lower official energy consumption, which may be due to more efficient usage or less unaccounted-for consumption. Meanwhile, the negative correlation between illegal connections and reported energy consumption could reflect that significant theft remains unmetered.

Figure 10: Correlation among energy consumption, transformer overloads, infrastructure quality and illegal connections
3.5 Network of Practices and Collusion That Underpins the Theft Dynamics
The diagram highlights the roles and practices contributing to electricity theft within the system. Consumers engage in bribery of SNEL agents, distribute electricity to neighbors, avoid paying bills, and manipulate meters (Fig. 11). SNEL agents, in turn, under-report consumption, manipulate billing, and establish their own unofficial subscriber networks. Daily operators collect bribes, manipulate meters, and make unauthorized connections to the SNEL grid, while electrification committees facilitate fraudulent connections, embezzle funds, and misuse their authority. These interconnected practices create a cyclical relationship between consumers, SNEL agents, daily operators, and electrification committees, perpetuating systemic inefficiencies and corruption in the electricity supply chain.
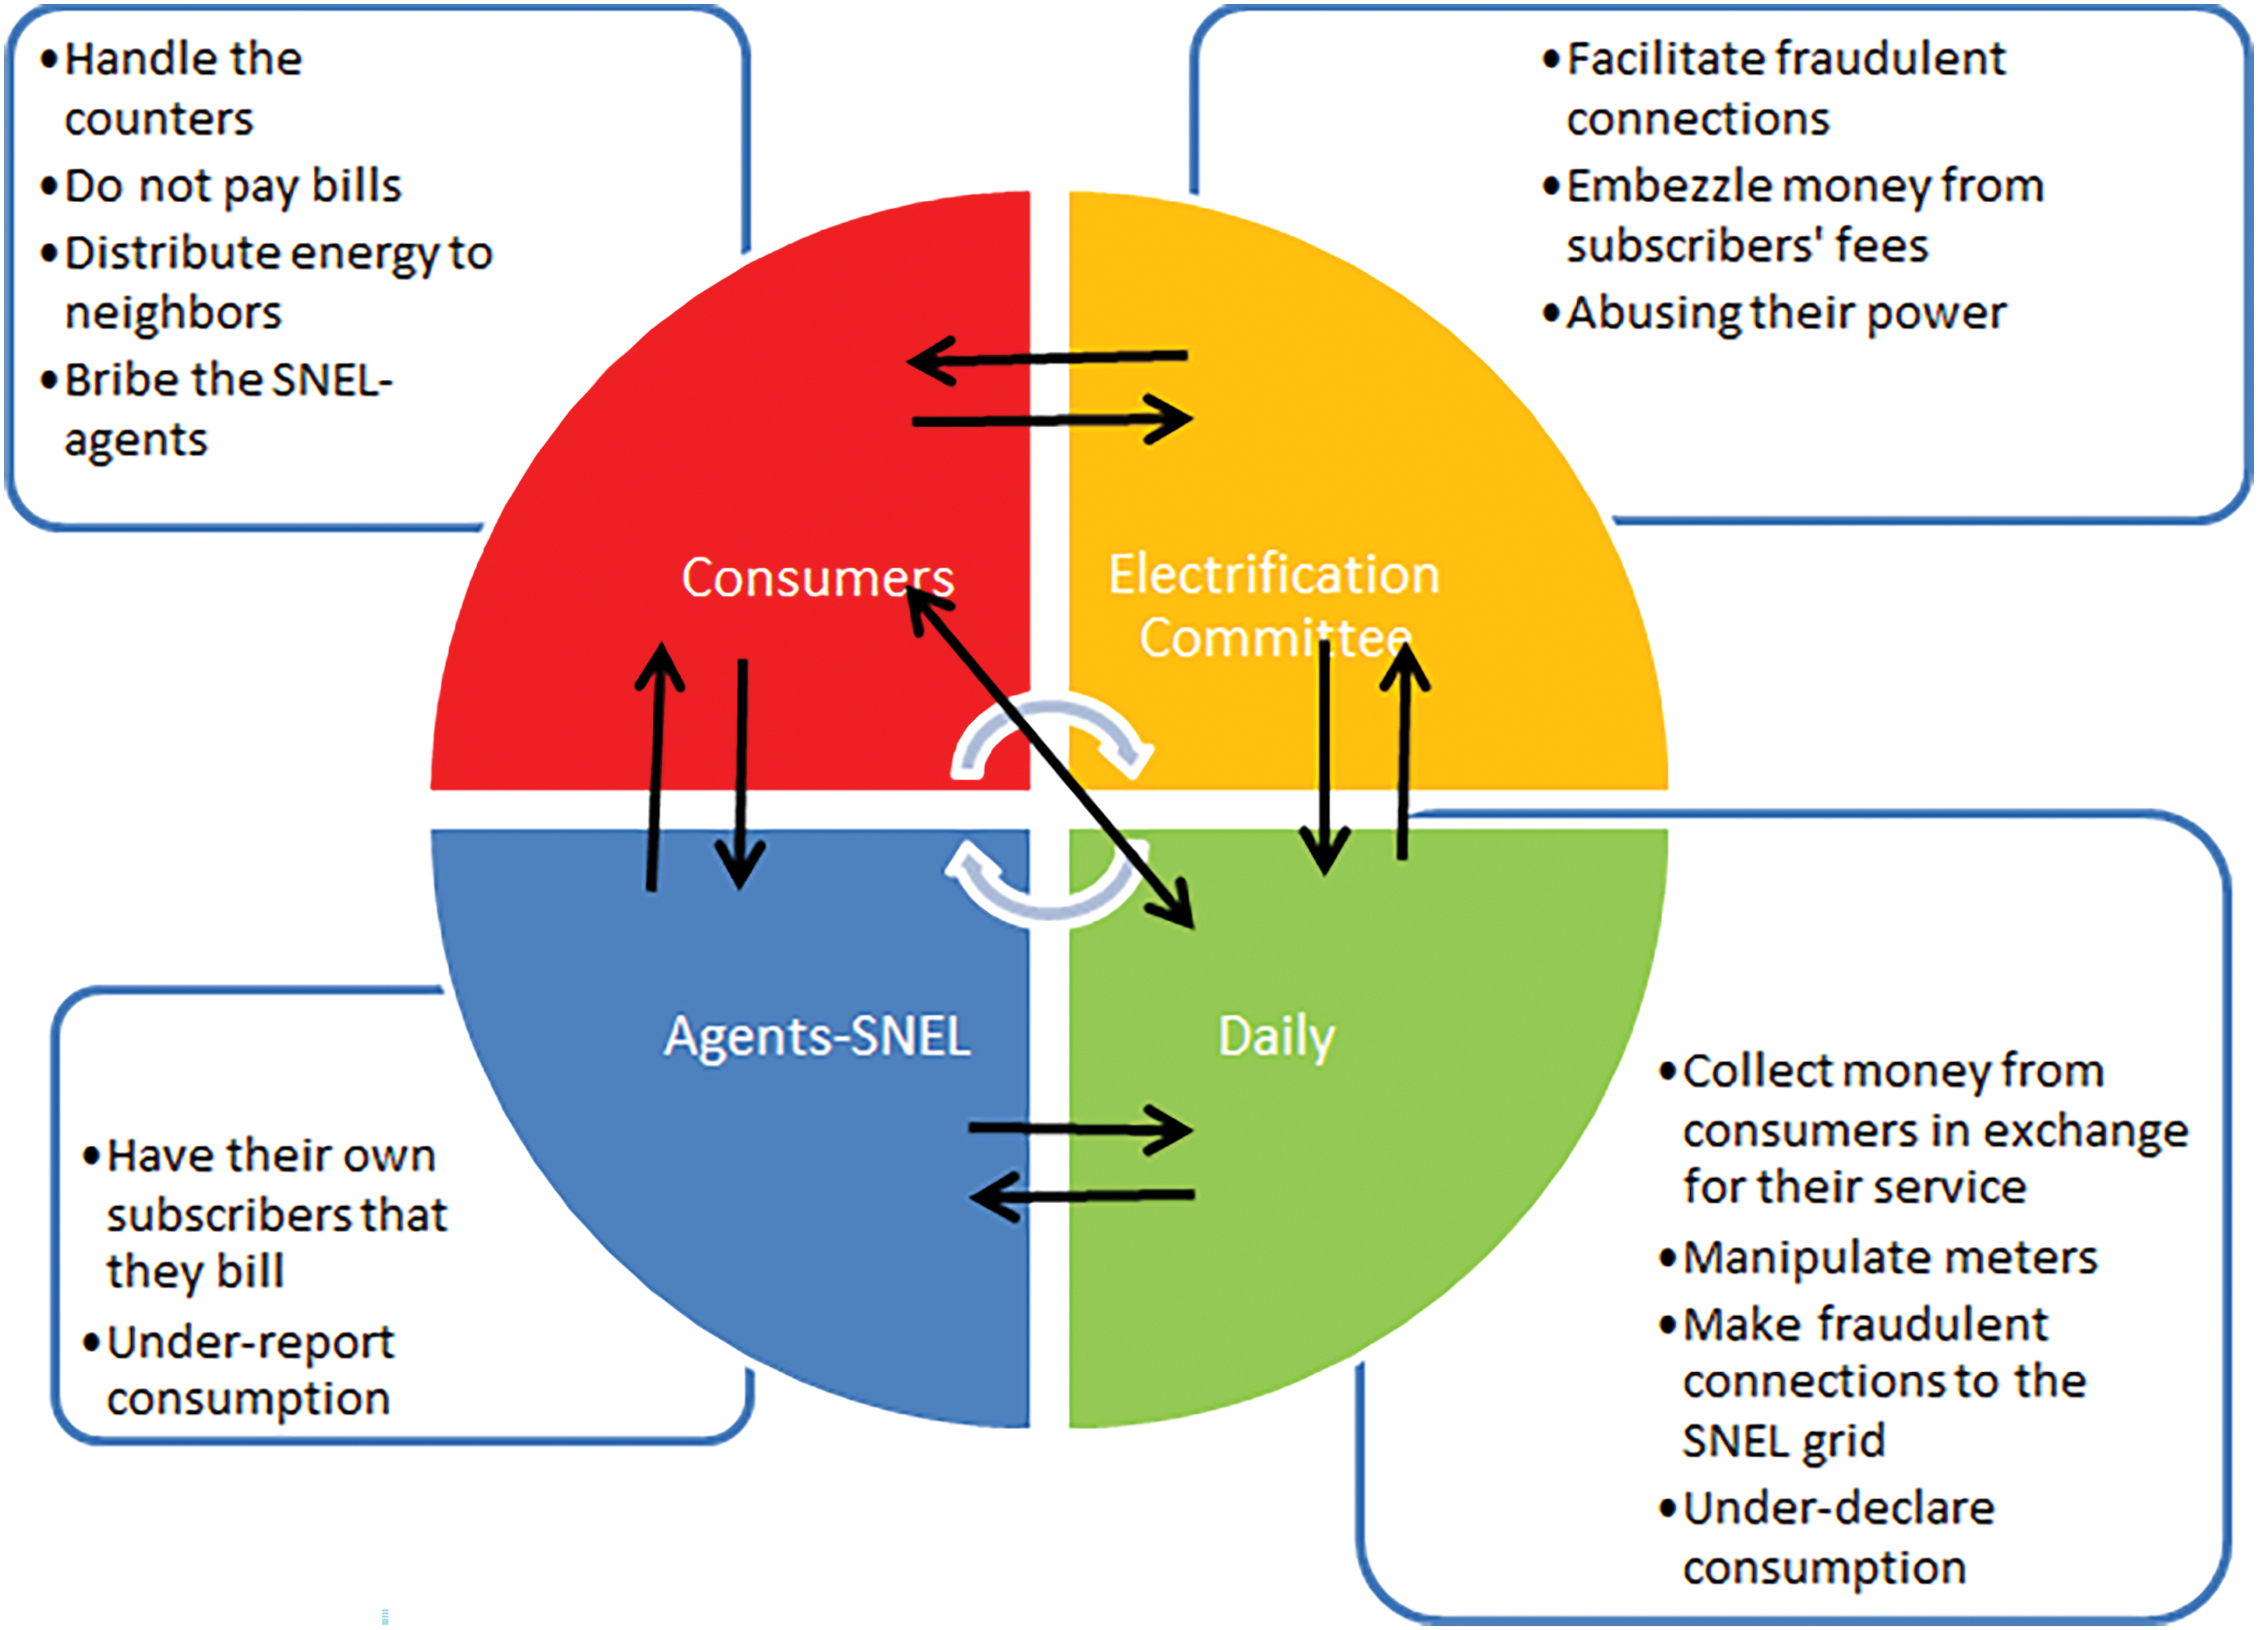
Figure 11: Cyclical relationship between actors involved in electricity theft and their roles
4.1 Patterns of Electricity Theft
Electricity theft in Lubumbashi takes various forms, including illegal connections (35%), meter tampering (25%), non-payment of bills (20%) and corruption (15%). These techniques, although diverse, have in common that they are linked to socio-economic inequalities and infrastructure deficiencies. Peripheral municipalities like Katuba and Kampemba demonstrate illegal connection rates exceeding 75%, attributed to poor infrastructure and elevated poverty levels. Above-ground power lines dominate these areas, making them more susceptible to theft. Conversely, central municipalities such as Kamalondo and Lubumbashi exhibit lower rates of theft, underpinned by better infrastructure quality and urban planning. Geographically, illegal connections cluster in areas characterized by informal settlements and socio-economic vulnerability, with the spatial distribution correlating strongly with overhead power networks and weak law enforcement. Similar patterns are observed in other Sub-Saharan African cities, where structural inequities amplify the prevalence of theft [16]. These results suggest that addressing theft requires more than punitive measures—it necessitates structural reforms to improve infrastructure and alleviate socio-economic disparities.
The high prevalence of meter tampering as the dominant theft method highlights gaps in monitoring and enforcement mechanisms. In areas such as Katuba, tampering often occurs with the complicity of utility staff, reflecting institutional weaknesses. Studies from other developing economies, such as India, similarly attribute meter tampering to collusion between consumers and utility employees, underscoring the systemic nature of the issue [16].
The impact of electricity theft extends beyond financial losses for utilities, directly undermining service quality. Municipalities with high theft rates, such as Katuba and Annexe, report frequent voltage fluctuations (up to 50 events/year) and extended power outages (300 days/year). These disruptions not only inconvenience residents but also hinder economic activities, particularly for small businesses reliant on reliable electricity.
The relationship between theft and grid instability is well-documented. Illegal connections often overload transformers and distribution networks, increasing the likelihood of equipment failures and maintenance costs [2]. In Lubumbashi, the dual burden of theft and aging infrastructure compounds these challenges, creating a vicious cycle where unreliable service drives more consumers toward illicit connections. Similar dynamics are evident in Pakistan and Nigeria, where theft-induced losses perpetuate service unreliability, further incentivizing illegal practices [4].
Households in affected areas express dissatisfaction with service quality, citing frequent outages and voltage instability as major grievances. This dissatisfaction fuels a perception of illegitimacy, where consumers justify theft as a compensatory mechanism for poor service. Addressing theft thus requires not only enforcement but also systemic improvements in service delivery to rebuild consumer trust.
4.3 Infrastructure and Theft Correlation
The analysis reveals a strong inverse relationship between infrastructure quality and theft rates. Municipalities with higher infrastructure quality scores, such as Kamalondo and Lubumbashi, report theft rates below 60%, while those with poor infrastructure, like Katuba and Kampemba, exhibit rates exceeding 80%. Above-ground networks dominate theft-prone areas, while underground systems in central municipalities deter unauthorized access.
This pattern aligns with global evidence emphasizing the role of infrastructure modernization in theft mitigation. Underground distribution networks, though costlier to install, offer significant long-term benefits by reducing vulnerability to tampering and enhancing grid reliability [2]. In contrast, above-ground systems, prevalent in Lubumbashi’s peripheral areas, are not only more accessible for theft but also prone to physical damage, further exacerbating service disruptions. The spatial distribution of theft underscores the need for targeted interventions. For instance, upgrading infrastructure in high-theft municipalities could yield substantial reductions in unauthorized connections. However, such efforts must be complemented by community engagement and socio-economic reforms to ensure sustainable outcomes.
4.4 Energy Consumption Dynamics
The disparity between legal and illegal energy consumption in Lubumbashi highlights the operational inefficiencies faced by SNEL. Municipalities like Katuba, Kampemba, and Annexe report illegal consumption dominating total energy use, reflecting the systemic nature of theft. Aggregated city-level data reveal that illegal consumption significantly outweighs legal usage, undermining revenue generation and complicating grid management.
Illegal consumption bypasses demand forecasting, leading to inefficiencies in energy distribution and increasing the risk of grid instability. Moreover, it places additional strain on infrastructure, accelerating wear and tear on transformers and other critical components. These challenges are not unique to Lubumbashi; they mirror trends observed in other developing regions, where theft constitutes a major barrier to achieving universal electricity access [12].
Addressing these dynamics requires a multi-pronged approach. On one hand, improving metering infrastructure, such as adopting prepaid systems, can enhance monitoring and reduce theft. On the other, efforts must focus on enhancing legal access to electricity, particularly for low-income households, to reduce dependence on illicit connections.
4.5 Socioeconomic and Institutional Drivers
The socio-economic underpinnings of electricity theft in Lubumbashi are evident in the strongcorrelation between theft rates and poverty levels. Households earning below 10,000 CDF exhibit theft rates exceeding 70%, driven by the high costs of legal connections and limited income. These findings align with broader literature emphasizing the role of economic vulnerability in driving electricity theft [19,20].
Institutional weaknesses, including corruption and ineffective enforcement, further perpetuate theft. Thematic analysis reveals a network of collusion involving SNEL employees, daily operators, and electrification committees, facilitating unauthorized connections and meter tampering. Such practices create a cycle of inefficiency, where utility losses incentivize further theft, undermining the financial sustainability of the electricity sector. Addressing these challenges requires systemic reforms. Strengthening regulatory frameworks, enhancing transparency, and promoting accountability within SNEL are critical. Additionally, community-level interventions, such as awareness campaigns and stakeholder engagement, can help foster a culture of compliance.
4.6 Implications for Policy and Practice
The findings from Lubumbashi provide valuable insights for policymakers and practitioners. Firstly, addressing electricity theft requires a holistic approach that combines enforcement with infrastructure upgrades and socio-economic reforms. Secondly, improving service quality is essential to rebuilding consumer trust and reducing incentives for theft. Lastly, tackling institutional corruption and enhancing governance within utilities are crucial for sustainable progress. Investments in modernizing infrastructure, particularly in theft-prone areas, can yield significant benefits. However, these efforts must be accompanied by targeted socio-economic interventions, such as subsidies for low-income households, to ensure equitable access to electricity. Moreover, leveraging technology, such as advanced metering systems, can enhance monitoring and reduce opportunities for theft.
This study reveals that electricity theft in Lubumbashi is not merely a technical issue but a reflection of deep-rooted socio-economic vulnerabilities, infrastructural disparities, and institutional inefficiencies. In peripheral areas such as Katuba and Kampemba, where theft rates exceed 75%, the predominance of outdated above-ground networks combined with high poverty levels compels communities toward unauthorized connections. In contrast, central municipalities like Kamalondo and Lubumbashi benefit from improved urban planning and modern infrastructure, resulting in lower theft rates and enhanced service stability. The consequences of electricity theft extend far beyond immediate financial losses for the utility. High-theft areas experience frequent voltage fluctuations, transformer overloads, and prolonged outages, all of which disrupt economic activities and exacerbate energy poverty among low-income households and small businesses. This, in turn, undermines SNEL’s capacity to reinvest in network upgrades, thereby reinforcing a cycle of inefficiency and inequity. The findings underscore the urgent need for an integrated strategy that addresses both the technical vulnerabilities of the electrical network and the underlying socio-economic and institutional factors. Transitioning to underground networks and upgrading existing infrastructure, alongside the implementation of advanced metering systems, can reduce technical vulnerabilities. At the same time, policy measures aimed at lowering connection fees and providing affordable tariffs are essential to extend legal and reliable electricity access to marginalized populations. Strengthening regulatory frameworks and enhancing accountability within utility operations are also critical to curbing the systemic practices that perpetuate theft. In conclusion, electricity theft reflects broader socio-economic and governance challenges. A holistic approach combining technical, socio-economic, and institutional reforms is essential for mitigating theft and ensuring reliable, equitable electricity access in Lubumbashi. Future research should employ advanced analytics and real-time monitoring to quantify how illegal connections directly impact grid stability, such as voltage fluctuations, transformer overloads, and outage frequencies.
Acknowledgement: The authors would like to express their sincere gratitude to all field assistants and local collaborators who contributed to data collection and field observations. Their dedication and effort were invaluable to the success of this study. We also extend our appreciation to the anonymous language editor for their careful review and constructive suggestions, which significantly improved the clarity and readability of the manuscript.
Funding Statement: The authors received no specific funding for this study.
Author Contributions: Each author made an equal contribution to the writing and development of this manuscript. David Milambo Kasumba: conceptualization, methodology, investigation, formal analysis, writing. Guy Nkulu Wa Ngoie: writing, proofreading, visualization. Hyacinthe Tungadio Diambomba: conceptualization, proofreading. Matthieu Kayembe Wa Kayembe: conceptualization, proofreading. Flory Kiseya Tshikala: proofreading, writing. Bonaventure Banza Wa Banza: conceptualization, methodology, writing, supervision. All authors reviewed the results and approved the final version of the manuscript.
Availability of Data and Materials: The data used in this study are available upon request from the corresponding author.
Ethics Approval: Not applicable.
Conflicts of Interest: The authors declare no conflicts of interest to report regarding the present study.
References
1. Sharma T, Pandey KK, Punia DK, Rao J. Of pilferers and poachers: combating electricity theft in India. Energy Res Soc Sci. 2016;11(2):40–52. doi:10.1016/j.erss.2015.08.006. [Google Scholar] [CrossRef]
2. Depuru SSSR, Wang L, Devabhaktuni V. Electricity theft: overview, issues, prevention and a smart meter based approach to control theft. Energy Policy. 2011;39(2):1007–15. doi:10.1016/j.enpol.2010.11.037. [Google Scholar] [CrossRef]
3. David MK, Bonaventure BWB. Identification of factors encouraging household consumers to engage in theft of electricity in Lubumbashi, DR Congo. Rev Ind Eng Lett. 2019;5(1):22–30. doi:10.18488/journal.71/2019.51.22.30. [Google Scholar] [CrossRef]
4. Jamil F. Electricity theft among residential consumers in Rawalpindi and Islamabad. Energy Policy. 2018;123(5–6):147–54. doi:10.1016/j.enpol.2018.04.023. [Google Scholar] [CrossRef]
5. Zhu L, Liu J, Hu C, Zhi Y, Liu Y. Analysis of electricity consumption pattern clustering and electricity consumption behavior. Energy Eng. 2024;121(9):2639–53. doi:10.32604/ee.2024.041441. [Google Scholar] [CrossRef]
6. Jiang Z, Wang Y, Li Y, Cao H. A new method for recognition and classification of power quality disturbances based on IAST and RF. Electr Power Syst Res. 2024;226(10):109939. doi:10.1016/j.epsr.2023.109939. [Google Scholar] [CrossRef]
7. Gao J, Hao H, Wen C, Wang Y, Han Z, Nykilla EE, et al. Correlation analysis of power quality and power spectrum in wind power hybrid energy storage systems. Energy Eng. 2025;122(3):1175–98. doi:10.32604/ee.2025.061083. [Google Scholar] [CrossRef]
8. Tamimi B, Canizares C, Bhattacharya K. System stability impact of large-scale and distributed solar photovoltaic generation: the case of Ontario, Canada. IEEE Trans Sustain Energy. 2013;4(3):680–8. doi:10.1109/TSTE.2012.2235151. [Google Scholar] [CrossRef]
9. Xanthopoulou A, Skordoulis M, Kalantonis P, Arsenos P. Integrating corporate governance and forensic accounting: a sustainable corporate strategy against fraud. J Gov Regul. 2024;13(2):327–38. doi:10.22495/jgrv13i2siart9. [Google Scholar] [CrossRef]
10. Shahbaz M, Raghutla C, Chittedi KR, Jiao Z, Vo XV. The effect of renewable energy consumption on economic growth: evidence from the renewable energy country attractive index. Energy. 2020;207(1):118162. doi:10.1016/j.energy.2020.118162. [Google Scholar] [CrossRef]
11. Galema S, Male D, Mbabazi M, Mutambuka M, Muzira R, Nambooze J, et al. An overview of the Ugandan food system: outcomes, drivers & activities [Internet]; 2024 [cited 2025 Jan 5]. Available from: https://research.wur.nl/en/publications/55278ad6-c21e-4a6b-a407-7de971f37e372024. [Google Scholar]
12. Blimpo MP, Cosgrove-Davies M. Electricity access in sub-saharan Africa: uptake, reliability, and complementary factors for economic impact. In: Electricity access in Sub-Saharan Africa : uptake, reliability, and complementary factors for economic impact. The World Bank; 2019. doi:10.1596/978-1-4648-1361-0. [Google Scholar] [CrossRef]
13. Kgaphola PM, Marebane SM, Hans RT. Electricity theft detection and prevention using technology-based models: a systematic literature review. Electricity. 2024;5(2):334–50. doi:10.3390/electricity5020017. [Google Scholar] [CrossRef]
14. Bonaventur BWB. Causes of deterioration of the electrical service quality at the household scale in Lubumbashi, DR Congo. Trends Appl Sci Res. 2019;14(1):12–8. doi:10.3923/tasr.2019.12.18. [Google Scholar] [CrossRef]
15. Mbungu NT, Milambo KD, Siti MW, Bansal RC, Naidoo RM, Kamabu TP, et al. Assessing and mapping electricity access patterns in a developing country. Energy Rep. 2023;9(1):193–201. doi:10.1016/j.egyr.2023.08.080. [Google Scholar] [CrossRef]
16. Gaur V, Gupta E. The determinants of electricity theft: an empirical analysis of Indian states. Energy Policy. 2016;93:127–36. doi:10.1016/j.enpol.2016.02.048. [Google Scholar] [CrossRef]
17. Muteya HK, donné Nghonda DN, Kalenda FM, Strammer H, Kankumbi FM, Malaisse F, et al. Mapping and quantification of miombo deforestation in the Lubumbashi charcoal production basin (DR Congospatial extent and changes between 1990 and 2022. Land. 2023;12(10):1852. doi:10.3390/land12101852. [Google Scholar] [CrossRef]
18. Banza BB, Mbungu NT, Siti MW, Tungadio DH, Bansal RC. Critical analysis of the electricity market in developing country municipality. Energy Rep. 2022;8(4):329–37. doi:10.1016/j.egyr.2022.10.200. [Google Scholar] [CrossRef]
19. Razavi R, Fleury M. Socio-economic predictors of electricity theft in developing countries: an Indian case study. Energy Sustain Dev. 2019;49(5):1–10. doi:10.1016/j.esd.2018.12.006. [Google Scholar] [CrossRef]
20. Ikejemba ECX, Schuur PC. Analyzing the impact of theft and vandalism in relation to the sustainability of renewable energy development projects in Sub-Saharan Africa. Sustainability. 2018;10(3):814. doi:10.3390/su10030814. [Google Scholar] [CrossRef]
Cite This Article
 Copyright © 2025 The Author(s). Published by Tech Science Press.
This work is licensed under a Creative Commons Attribution 4.0 International License , which permits unrestricted use, distribution, and reproduction in any medium, provided the original work is properly cited.
 Downloads
 Citation Tools