
 Submit a Paper
 Propose a Special lssue
 Open Access
ARTICLE

Field Testing Methodology for Wave Energy Converters Using the MIKE 21 Model
1 Marine Test Field Management Center, National Ocean Technology Center, Tianjin, 300112, China
2 Strategic and Planning Research Office, National Ocean Technology Center, Tianjin, 300112, China
* Corresponding Author: Xiangnan Wang. Email:
Energy Engineering 2025, 122(6), 2389-2400. https://doi.org/10.32604/ee.2025.064891
Received 26 February 2025; Accepted 30 April 2025; Issue published 29 May 2025
 View Full Text
 Download PDF
Abstract
With the depletion of fossil fuels and increasing environmental concerns, the development of renewable energy, such as wave energy, has become a critical component of global energy strategies. However, challenges persist in the field testing methodologies for wave energy converters (WECs). In this paper, a numerical wave field of the Dawanshan Island Sea Area in Zhuhai City is constructed based on the MIKE21 SW wave model and by using an NCEP wind field driving model. In conjunction with the IEC-62600-100 standard, by taking site testing of the “Wanshan” wave energy converter on which a sea trial has been conducted in Dawanshan Island of Zhuhai city as an example, research on-site testing method for a wave energy converter has been carried out. The wave measurement position for the “Wanshan” converter was determined by combining statistically analyzed field data with a validated numerical wave model. By comparing a valid wave height at the position where a wave rider is located with a valid wave height at the position where the “Wanshan” wave energy converter is situated, the correlation coefficient between simulation and observed data reached 0.90, with a root-mean-square error of 0.19. The representativeness of wave measurement data during site testing is verified and can be used as a basis for calculating the input energy of the “Wanshan” wave energy converter.Keywords
With the use of traditional fossil energy sources such as coal and petroleum, fossil energy resources are becoming insufficient, and environmental problems are increasingly obvious. Therefore, the development and utilization of new and renewable energy sources have become an important direction for the planning and development of energy source strategies in countries worldwide. Marine energy utilization technology is a key solution for achieving comprehensive decarbonization of energy systems, typically including tidal energy, tidal current energy, wave energy, ocean thermal energy, and salinity gradient energy. Broadly defined, marine renewable energy also encompasses offshore wind and offshore photovoltaic energy [1]. Among these, wave energy, ocean thermal energy, tidal current energy, offshore photovoltaics, and offshore wind energy hold the greatest potential for development and utilization. China possesses vast marine energy resources, but high costs, low efficiency, and harsh marine environments have hindered the rapid advancement of marine energy utilization technologies [2].
Wave energy power generation technology aims to convert the kinetic and potential energy of waves into electricity and other usable forms of energy [3]. Based on fixation methods, wave energy converters (WECs) can be classified as floating or shore-mounted [4]. According to energy transfer mechanisms, they are primarily categorized into oscillating water column technology, oscillating buoy technology, tapered channel technology, pendulum technology, and raft technology [5]. Since the 1970s, WEC development has progressed through multiple stages. The first-generation WECs were predominantly shore-based, facilitating observation, testing, and component replacement [6]. Second-generation WECs, such as the UK’s “Pelamis” and “Oyster” devices, marked significant technological advancements [7]. In recent years, wave energy technologies have increasingly integrated with interdisciplinary fields, leading to novel research directions. Examples include ship-mounted WECs: in 2020, Li et al. [8] demonstrated wave power generation by installing a mass block on cargo ships to drive generators. In 2023, Wen et al. [9] designed a wave energy-harvesting trimaran, where relative motion between the central hull and side hulls under wave excitation drives power generation to supplement onboard energy. Innovations in energy storage for WECs have also emerged, such as Chang et al. [10], who proposed a dynamic optimal control method for wave energy systems using electric-hydrogen hybrid storage in 2023.
Over the past decade, the research and development of wave energy power generation technology in China has rapidly progressed, and multiple hundred-kilowatt level wave energy converters have undergone sea trial operation in succession. In 2022, the first megawatt-level wave energy power station in China was put into demonstration operation, and a semi-submersible wave energy cultivation integrated platform developed autonomously in China has operated for more than 24 months in a fishery base [11].
Performing site testing on a wave energy converter after sea trialscan provide scientific data support for converter performance optimization, and is a key link for facilitating the advancement of ocean energy power generation technology toward industrialization. The International Electrotechnical Commission (IEC) has published technical standards for marine energy [12], and the International Towing Tank Conference (ITTC) has released recommended procedures and guidelines for model testing of wave energy converters [13]. By analyzing and comparing wave measurement methods from wave rider buoys and Langlong devices, Xia et al. conducted comparative tests of these two observation systems in the Dawanshan Island Sea Area of Zhuhai City, China, using statistical methods such as standard deviation and Pearson’s correlation coefficient [14]. Recent advancements in WEC field testing emphasize multi-sensor integration and adaptive control strategies. For instance, Zhang et al. (2023) proposed a machine learning-based approach for real-time wave prediction in offshore WEC deployments, achieving 15% improvement in data representativeness [15]. Additionally, García-Medina et al. (2024) demonstrated the efficacy of hybrid LiDAR-buoy systems for high-resolution wave characterization in typhoon-prone regions [16]. These studies underscore the need for robust numerical-empirical frameworks to address challenges in harsh marine environments.
In 2012, the IEC issued “IEC-62600-100: Electricity producing wave energy converters—Power performance assessment”, which was subsequently revised in 2023 [17]. The IEC standard defines six parameters to characterize wave energy resources, requiring the use of hydrodynamic models validated by field measurements for wave calculations. It provides guidance on spatiotemporal resolution of input data, computational accuracy of numerical models, discretization of wave energy spectra, and physical processes of wave propagation (especially in nearshore regions). Successful global applications of this standard, such as in American Samoa [18] and the Mariana Islands [19], have bolstered investor confidence and credibility in the wave energy sector. To our knowledge, this is the first study to integrate the MIKE21 SW model with IEC-62600-100 standards for field testing of WECs in the South China Sea. Our work fills a critical research gap by establishing a validated protocol for site-specific wave measurement positioning, enabling accurate input energy assessment and conversion efficiency analysis under dynamic marine conditions.
Aligned with the IEC-62600-100 standard, we establish a wave numerical model of the Wanshan Sea Area using the MIKE21 SW model. Taking the “Wanshan” wave energy converter deployed in the Dawanshan Island Sea Area of Zhuhai City, China, as a case study, we analyze and simulate the distribution of wave energy resources in the sea area. By comparing the significant wave height at the wave measurement instrument location with that at the “Wanshan” WEC site, we verify and analyze the representativeness of the wave measurement data. This study is the first to integrate MIKE21 SW with IEC-62600-100 standards for field testing wave energy converters in the South China Sea.
MIKE21 is marine simulation software researched and developed by Danish Hydraulic Institute (DHI for short), and is especially suitable for simulation of environments such as water flow, wave, and slush in a small range of estuaries, bays, shorelines, and oceans. The MIKE21 SW model (MIKE-21 Spectral Waves, SW model for short) is a spectrum equation model based on a wave action conservation equation, can deal with the effect of bottom friction, wave breaking, diffraction, refraction, reflection and engineering buildings, etc., and can simulate the growth, fading and deformation of wind waves and surge waves in a wide range of inshore and shore areas, and is an international mature and universal sea wave numerical calculation mode [20].
2.1 Basic Principle of the Model
The SW model is based on a wave action conservative equation, and can be expressed in a Cartesian coordinate system as:
In the equation,
in the equation,
In Eq. (1), the first term represents the change of
2.2 Selection of Model Parameters and Calculation Condition
The simulation area comprises numerous islands near Pearl River Estuary and a complex shape of shore boundaries, and a south boundary extends as far as possible to the deep sea, so as to ensure sufficient growth of wind waves (as shown in Fig. 1). Finite element meshes of the SW model can more accurately fit the tortuosity of the shorelines and the shape of the islands, and improve the resolution of meshes of the Wanshan test field sea area by step-by-step mesh refinement, in which the minimum spacing between meshes does not exceed 10 m (as shown in Fig. 2).
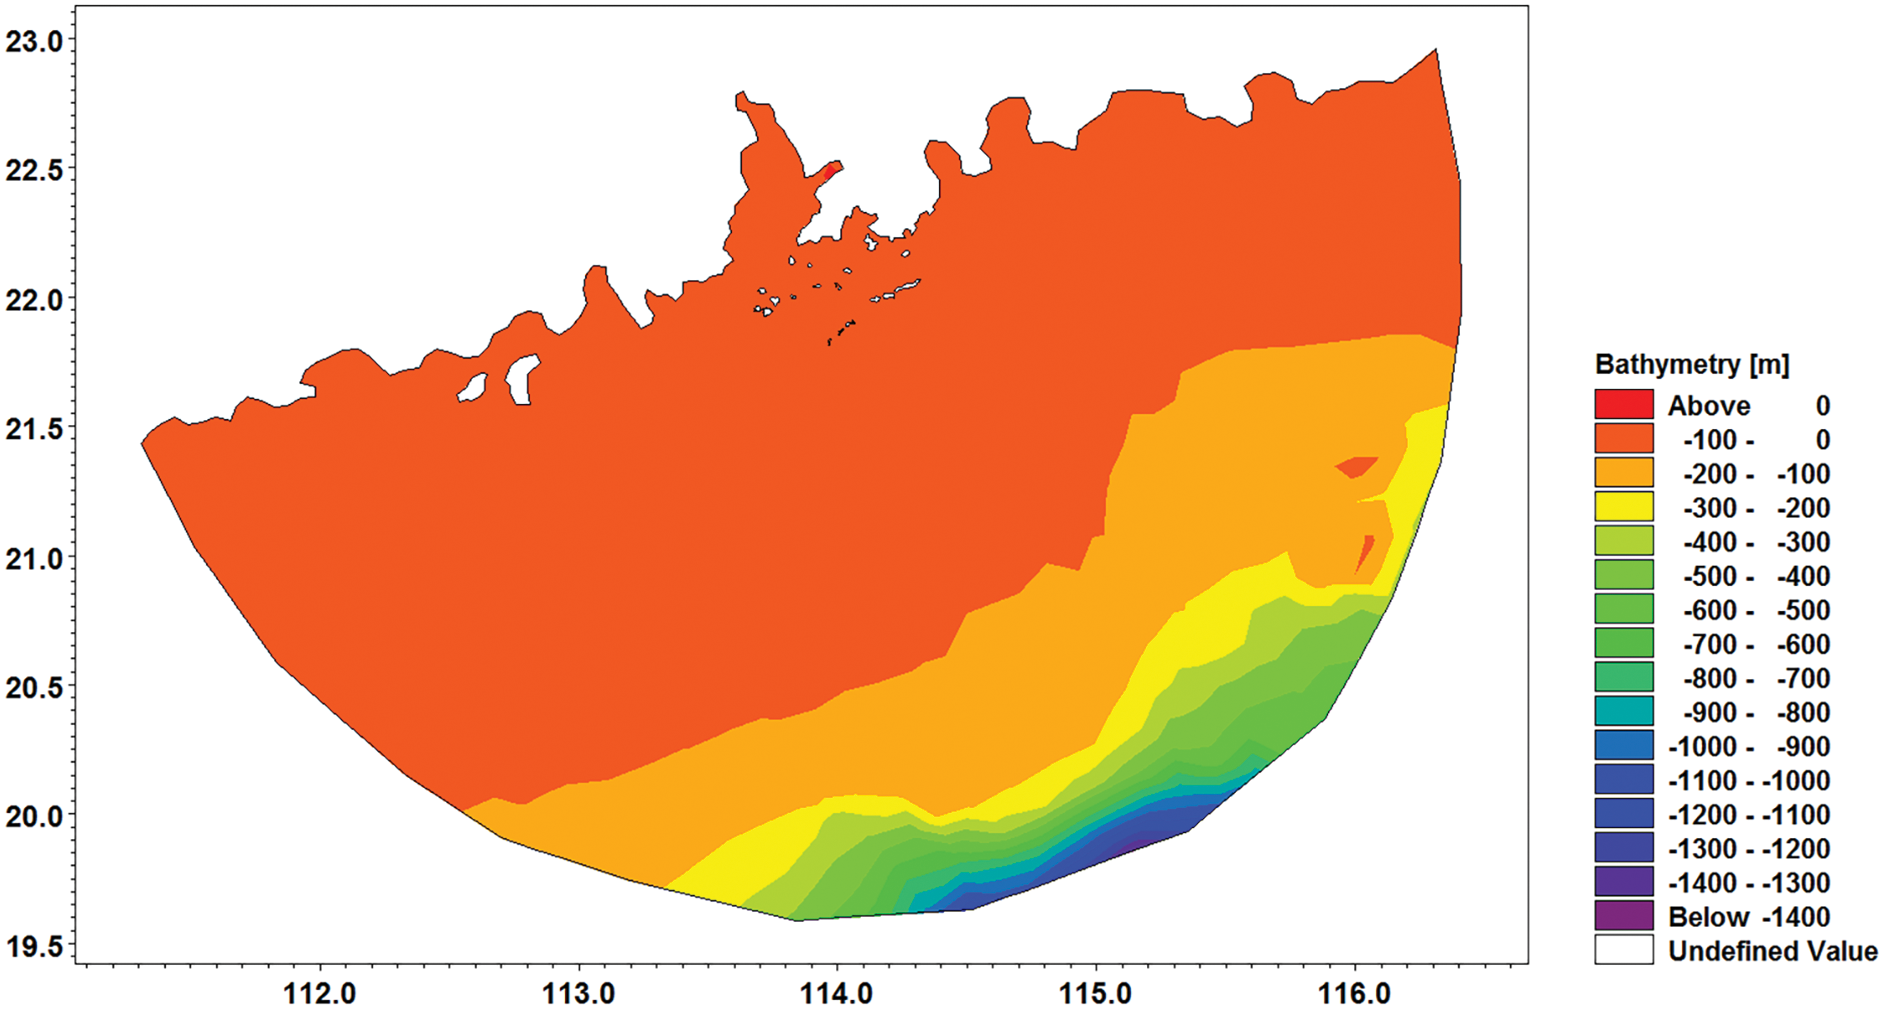
Figure 1: Model range vs. bathymetry
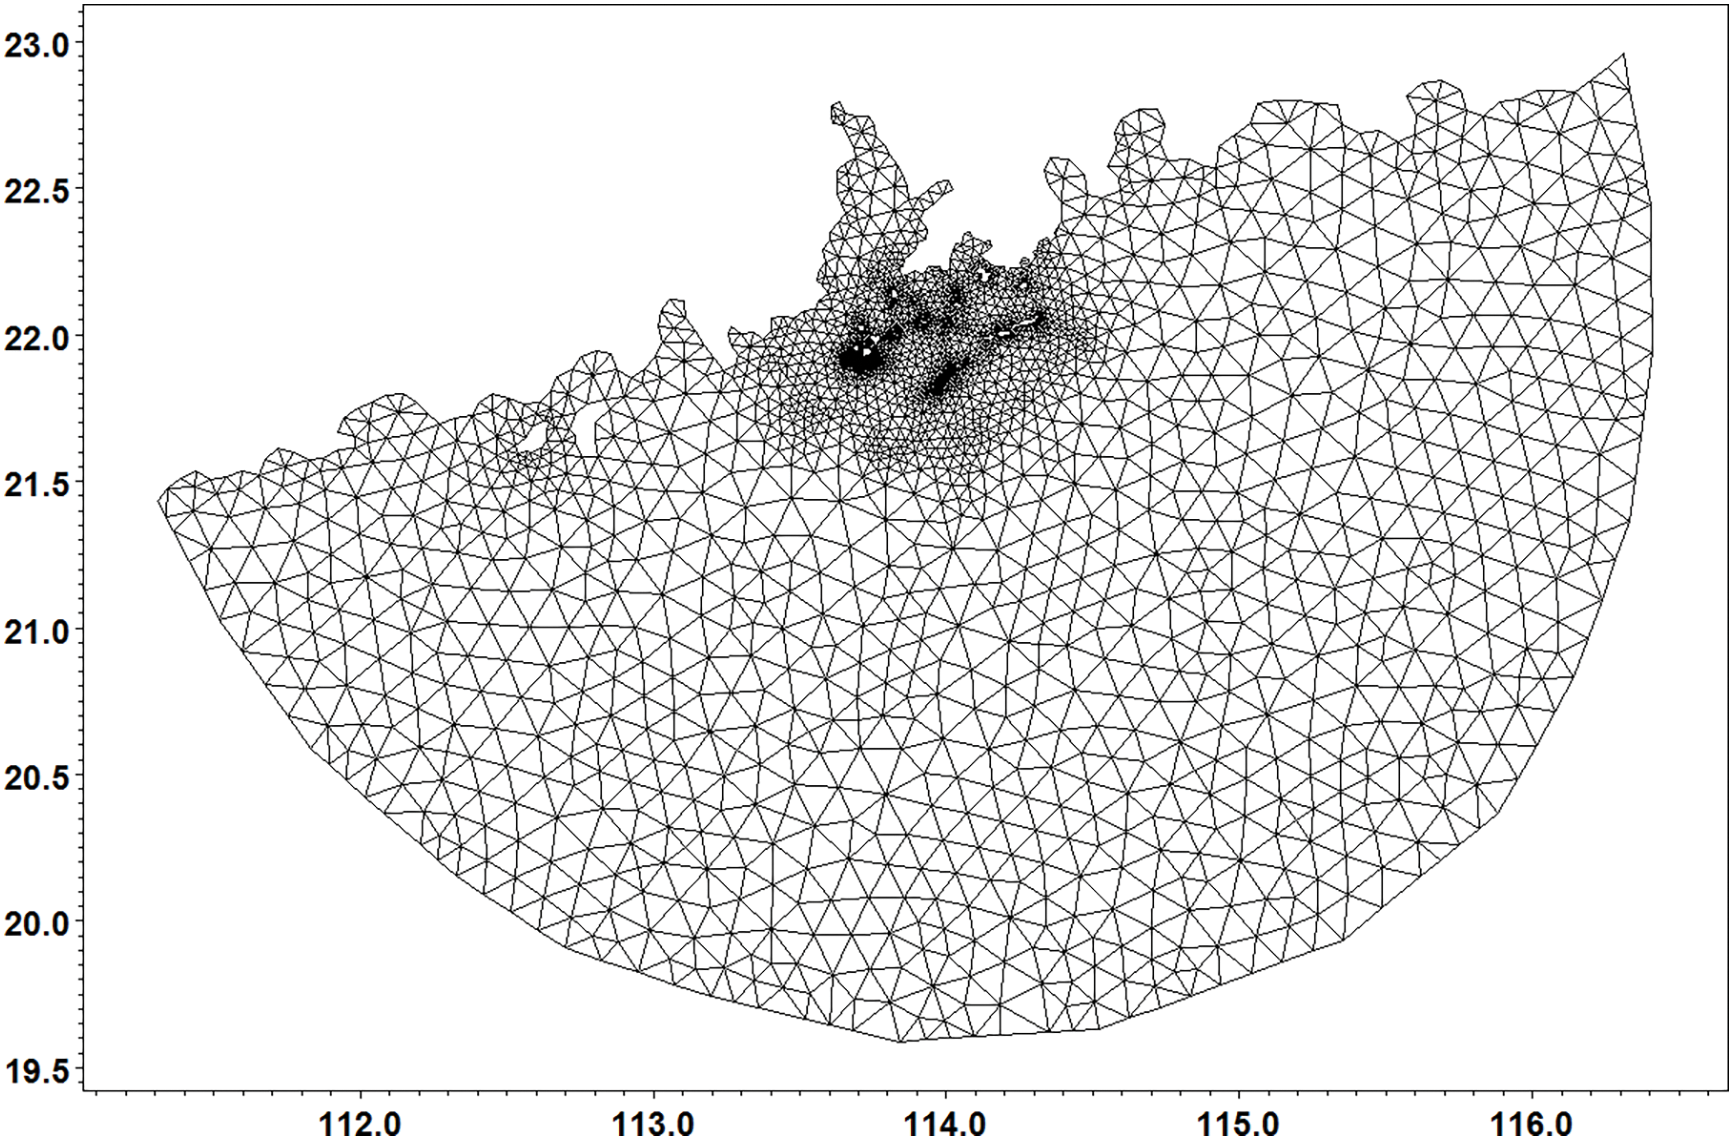
Figure 2: Model range vs. calculation mesh
The wind field uses data of version 2 large-scale forecast system CFSv2 (Climate Forecast System version 2) of the National Centers for Environmental Prediction (NCEP for short) in America as a driving wind field of a Wanshan Sea Area wave model; and a time period of selecting wind field data is January 2015 to December 2017, with the range being 18°N–23°N and 111°E–117°E. The NCEP CFSv2 wind field ensures accurate simulation of typhoon-driven waves due to its high temporal resolution and spatial coverage.
On the basis of basic settings of the simulation area and the wind field, relevant parameters of the wave model are determined, wherein a simulation time period is from 0 o’clock on 1 January 2015 to 0 o’clock on 31 December 2017, a time step is 360 s, the number of simulation steps is 262,500, an output interval is 1 h, and output parameters comprise a valid wave height, a maximum wave height, an average period, a zero-crossing period, a main wave direction, an average wave direction and wave energy.
3 Result Verification and Selection of Wave Measurement Position
The “Wanshan” wave energy converter was developed by Guangzhou Institute of Energy Conversation, Chinese Academy of Sciences, and adopted a one-base multi-body design, that is, a plurality of wave energy absorption bodies are mounted on one wave energy semi-submersible mother ship, all wave energy absorption bodies share the semi-submersible mother ship, share one energy conversion system and share one anchor system, and one mother ship forms a wave energy converter group. The converter has good hydrodynamic performance, can adapt to waves in different directions, and has a relatively strong energy acquisition capability. The laying position of the “Wanshan” wave energy converter was N21°55′30″, E113°43′30″. In May 2014 to April 2015, wave observation for one year was conducted in the Wanshan Sea Area, the position of the observation point was N21°55’11.46”, E113°42’29.4”, which was close to the laying position of the “Wanshan” converter; and the relevant observation result can be used as a basis for the present model result verification, and a basis for selecting a wave measurement position of the “Wanshan” converter.
The result of the wave model is verified by using wave survey data from January 2 to January 27 in 2015 (as shown in Fig. 3). The valid wave height vs time curves of the two have good consistency, and the simulation values deviate greatly only on January 13, and upon analysis, the reason may be that the bathymetry data used in the simulated sea area has a certain difference from the actual data. By comparing time sequences of the two and performing validity check, upon calculation, a correlation coefficient of 0.82 between the two is obtained, the consistency between simulation values and actual observation values of waves is very high, and the data has a relatively high confidence level. Discrepancies in bathymetry data and extreme weather conditions were identified as primary error sources.
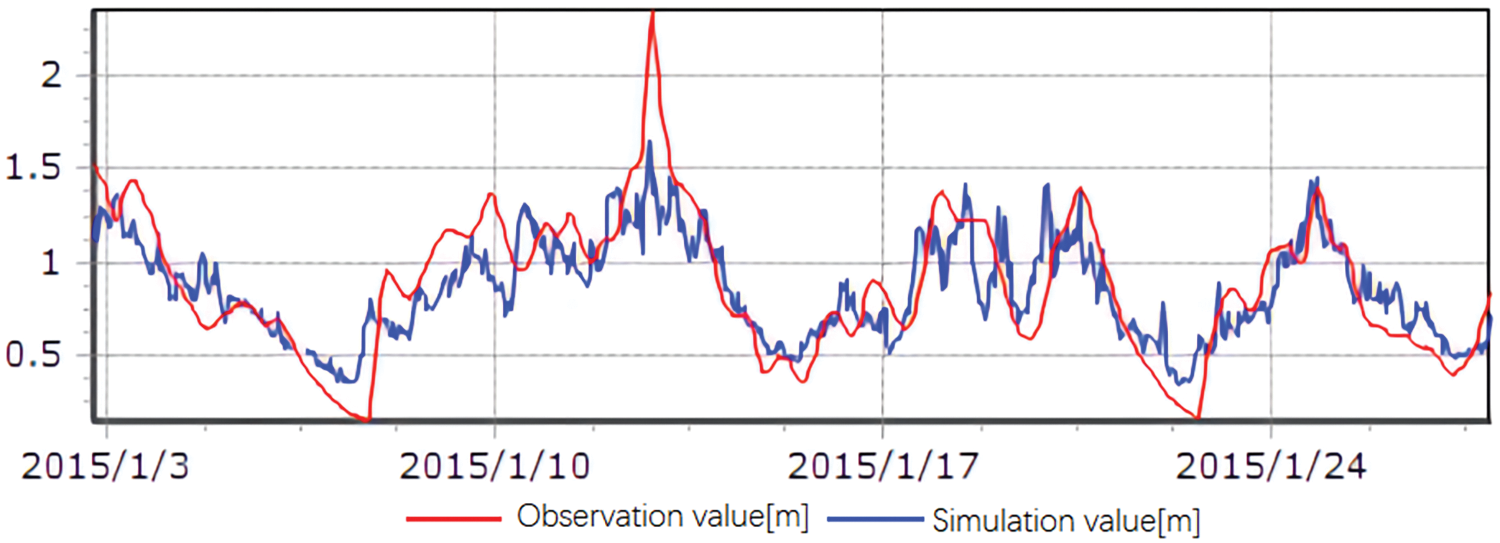
Figure 3: Verification of simulation result and actually measured data of waves
3.2 Selection of Wave Measurement Position
3.2.1 Statistical Result of Actually Measured Wave Data
Statistical analysis is performed on wave observation data from May 2014 to April 2015, and it can be determined that the wave direction of the maximum wave in the whole year is SE, the wave direction of the secondary maximum wave is SE, the main wave direction is ESE, and the secondary wave direction is SE. The main wave directions in all months are ESE, S and SSW directions, and the appearance rate of waves in ESE-SSW directions in the whole year is 91.7% (as shown in Fig. 4). According to the device development cycle specified in the contract, the device needed to complete the offshore test and site test in 2017, and the test sea area would enter the typhoon season in June 2017. Therefore, the “Wanshan” wave energy converter research and development institute, namely Guangzhou Institute of Energy Conversation, set the time for site test in May 2017. And therefore the wave statistical data in May was mainly analyzed, and in May, the waves were mainly waves in ESE direction. The high occurrence of ESE-SSW waves (91.7%) in Dawanshan Island ensures comprehensive testing of the converter’s directional adaptability.
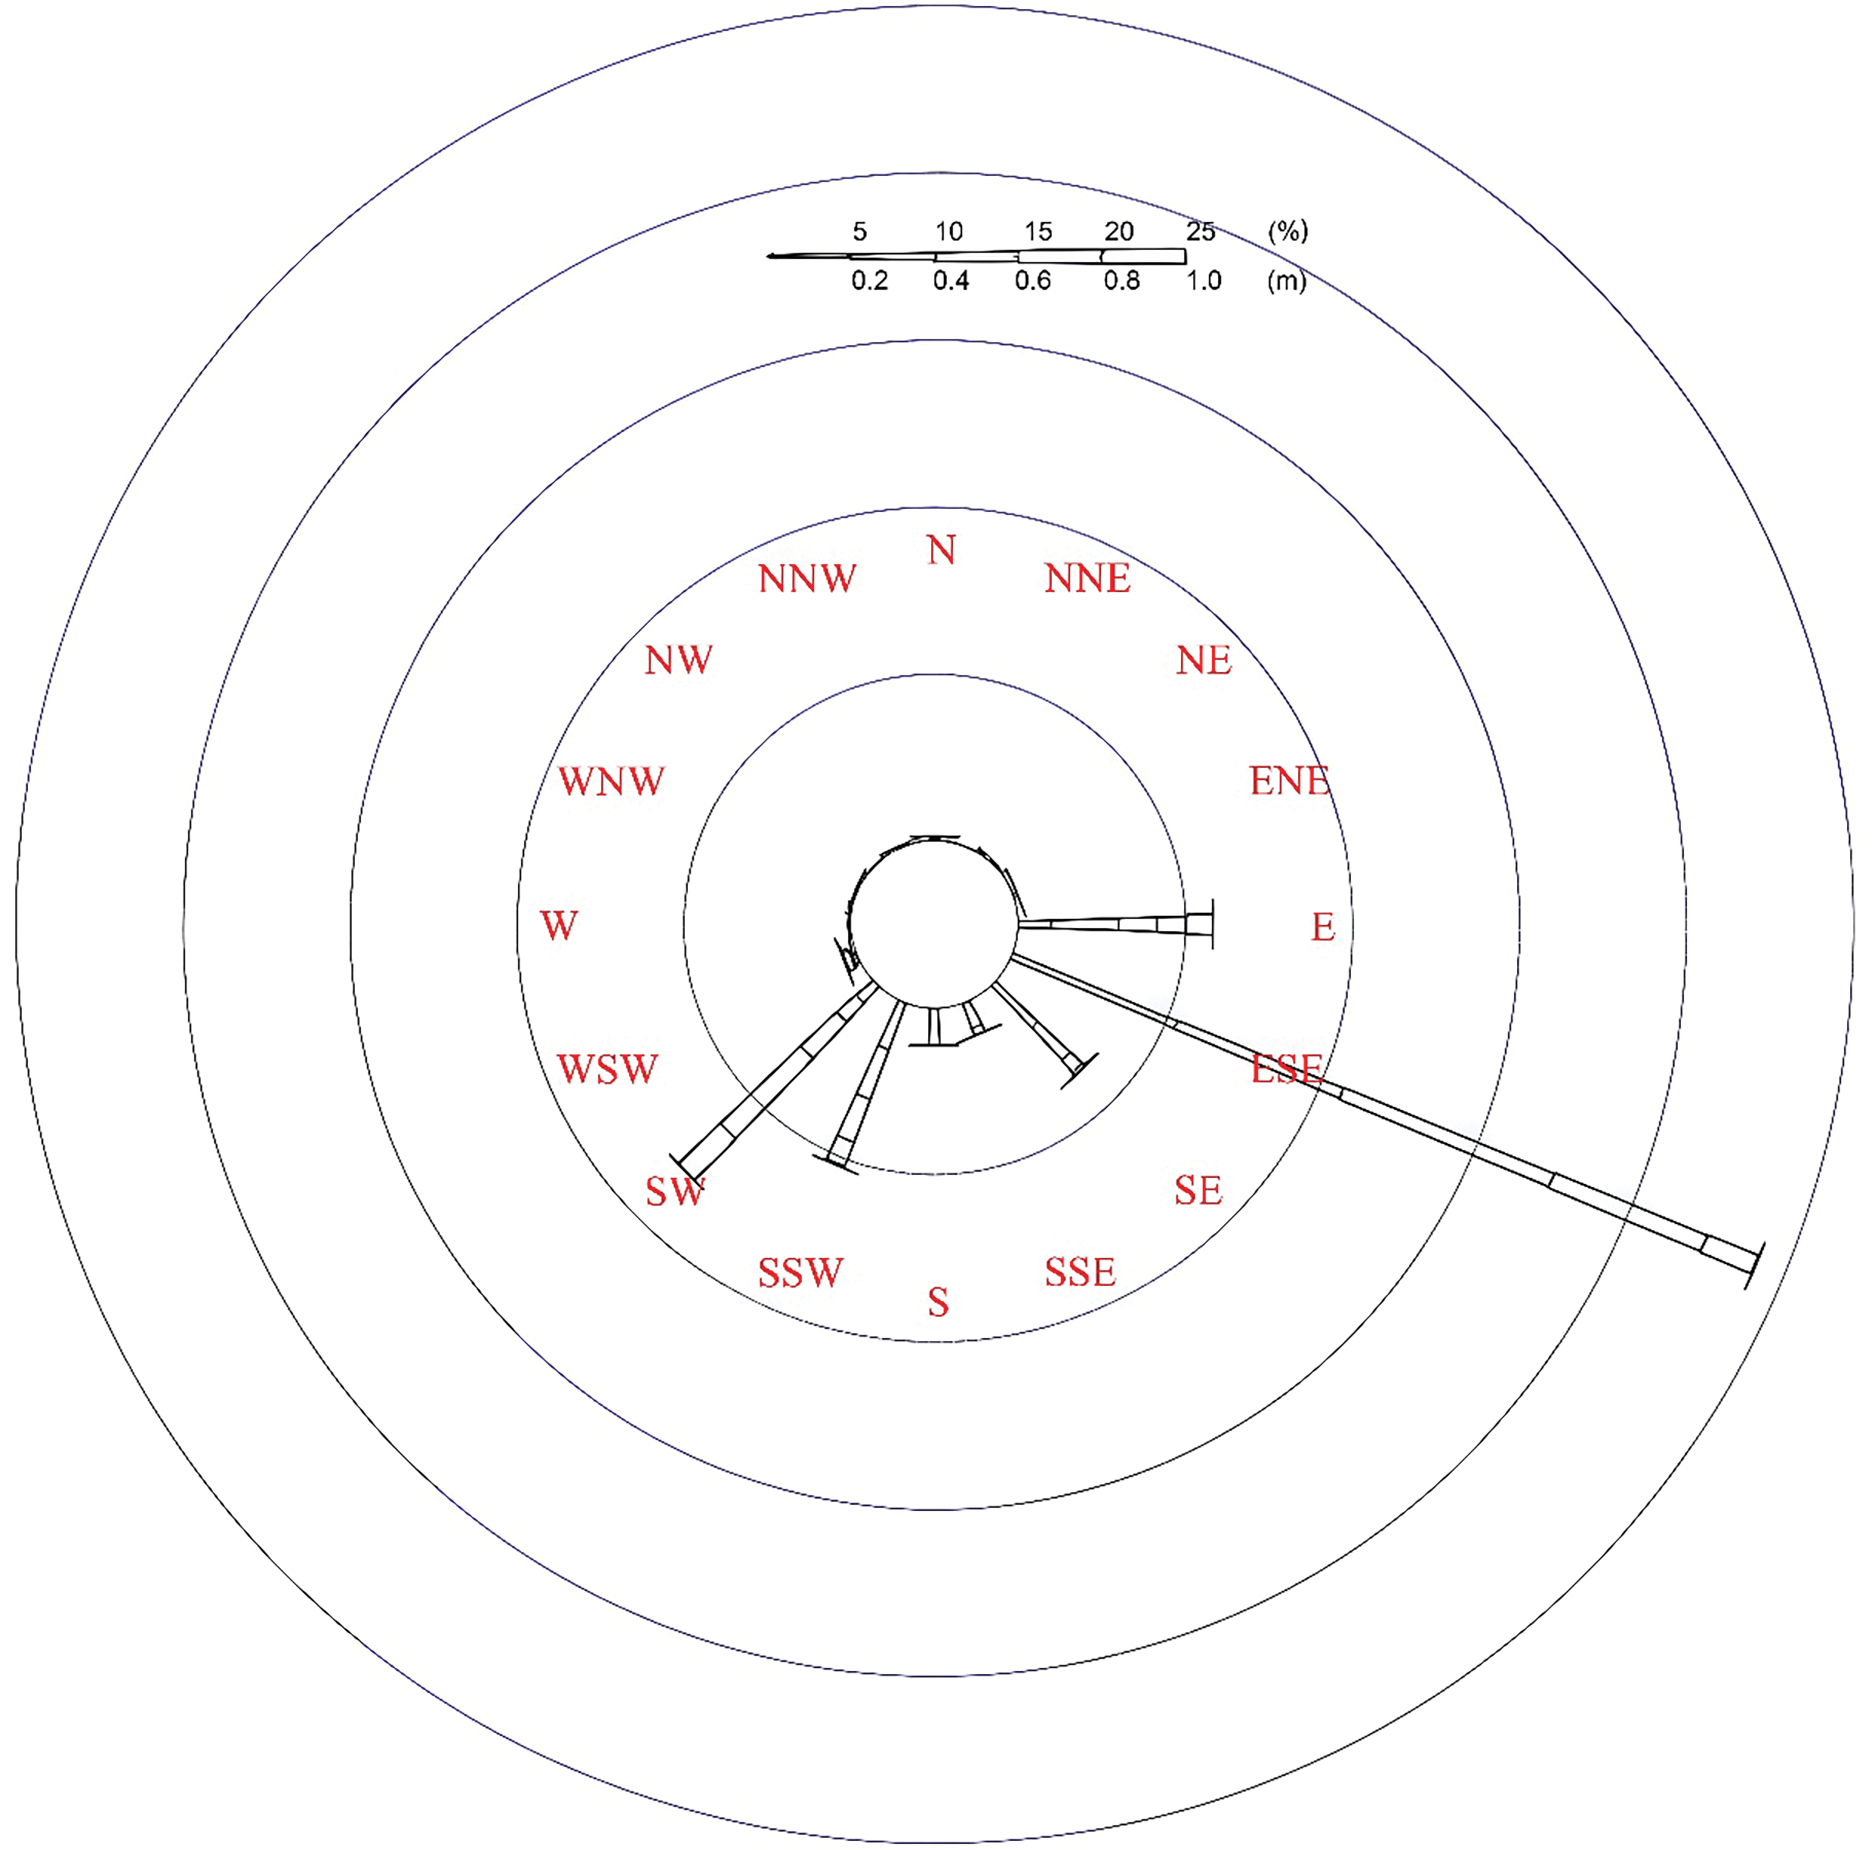
Figure 4: Rose diagram of waves in May 2015
3.2.2 Distribution Characteristics of Waves in Simulated Sea Area
The annual average valid wave height distribution in the simulated sea area is as shown in Fig. 5, and it can be determined that the wave intensity basically decreases gradually as the isobath becomes lighter, the annual average valid wave height in open seas is greater than 1.2 m, the waves in the Wanshan Islands Sea Area are significantly shielded by several islands in the east, especially the Miaowan Islands; the waves in the southeast part of the Wanshan Island are stronger, the annual average valid wave height is greater than 1 m; and the waves in the southwest part is slightly smaller, and the annual average valid wave height is between 0.8–1 m, and the change trend thereof is consistent with the change of isobath.
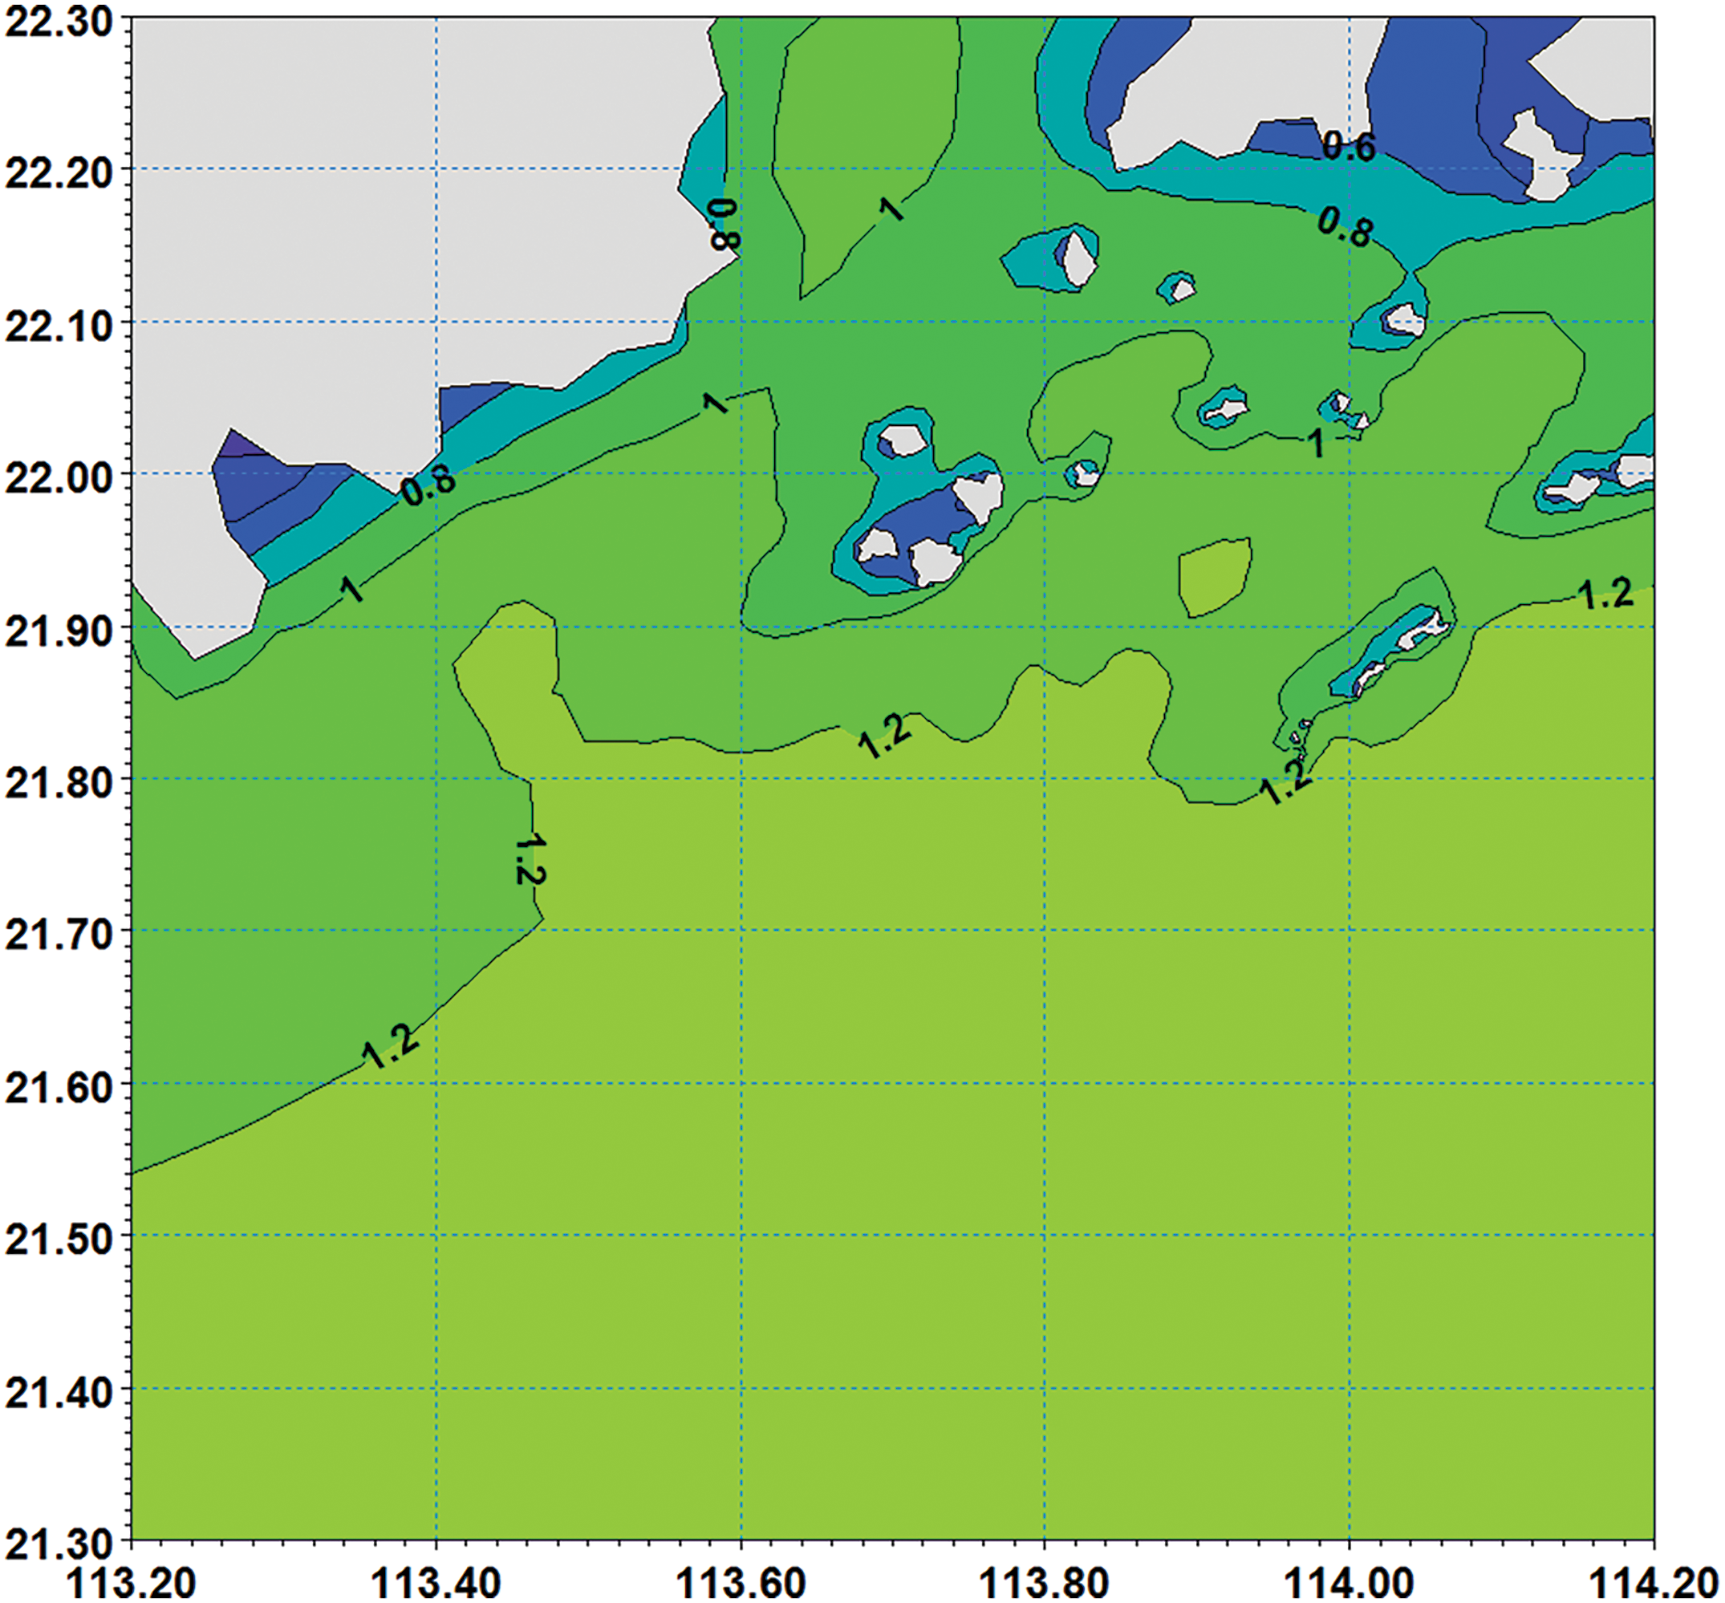
Figure 5: Distribution of annual average valid wave height
A general calculation formula for assessing wave energy resources is:
where
Upon calculation, it is obtained that the distribution of annual average wave energy in the simulated sea area is as shown in Fig. 6, and the wave energy distributions in south and north of the Wanshan Islands Sea Area differ greatly. The average energy flux density in the south sea area is substantially greater than 3 kW/m, while the average value in the north part is below 2 kW/m. This is mainly because in the sea areas to the north of the Wanshan Islands, the water depth is generally less than 10 m, and there are more shallow beaches and islands, which are not conducive to the growth of waves. It can also be determined from the figure that the wave energy flux density in open seas is greater than that of the inshore, as a wide sea area is beneficial to the sufficient growth of waves.
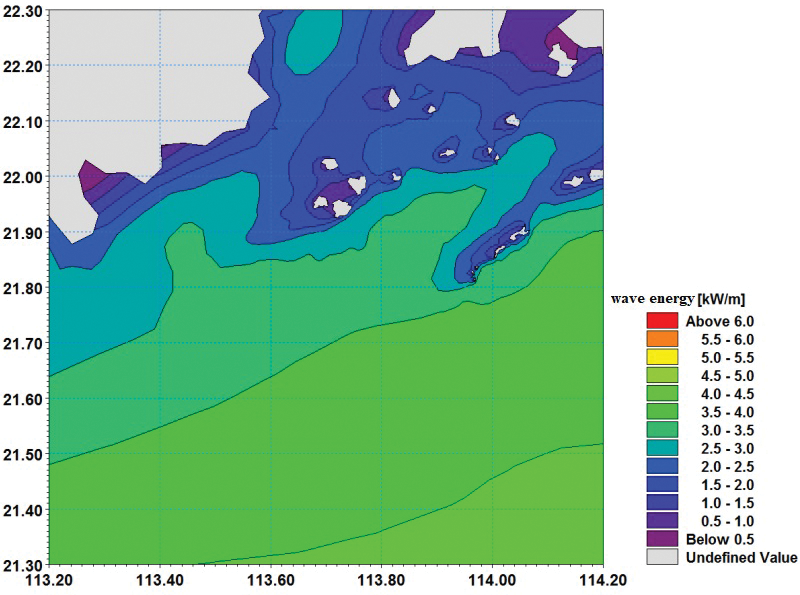
Figure 6: Distribution of annual average wave energy
Upon analysis, the laying position of the “Wanshan” converter has a water depth of 30 m, the main wave direction in May is ESE, the isolines of the valid wave height and the average wave energy are substantially parallel to the water depth line, and along the northeast-southwest direction, the deeper the water depth, the greater the valid wave height and the wave energy density. The test position is preferably in an area approximately 100–200 m to the south of the wave energy converter. A wave rider (DWR4 WAVERIDER, hereinafter referred to as DWR) is a reliable wave observation instrument, is widely applied to spectral measurement of wave height, wave period and wave direction of sea waves, and has high wave measurement precision and good durability and stability. Key challenges include maintaining instrument stability in harsh marine conditions and ensuring data representativeness across varying wave directions. Affected by wind and flow direction on site, the laying position of the DWR was N21°55′15.06″, E113°42′56.88″, and was spaced approximately 160 m from the “Wanshan” wave energy converter (as shown in Fig. 7).
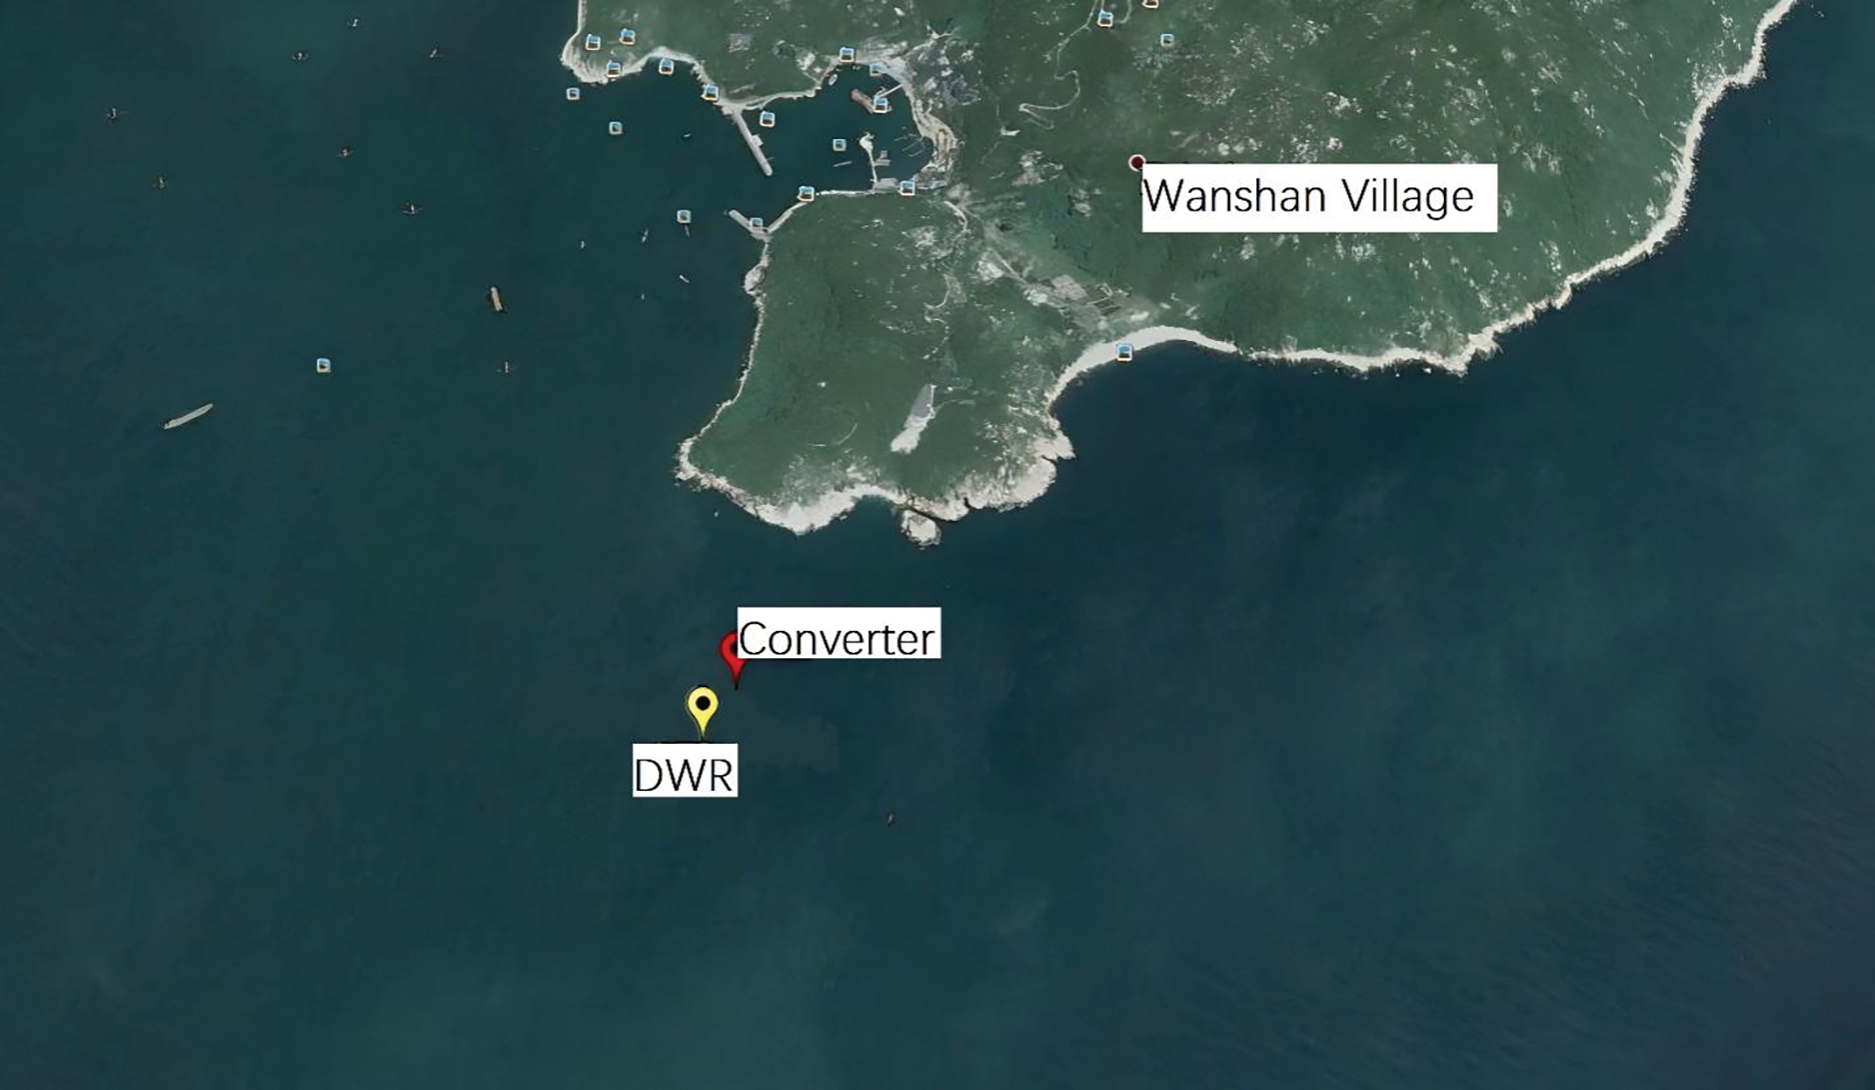
Figure 7: Wave rider (DWR) test position
4 Representativeness Analysis of the Wave Test Position
4.1 Verification of Wave Data at the Test Position
By using wave observation data of the DWR at this time (1 May to 25 May 2017), experimental verification was performed on the result of the wave model, and the result is shown in the following Fig. 8. The valid wave height vs. time curves of the two have good consistency; by comparing time sequences of the two and performing validity check, upon calculation, the deviation value of the two is −0.08, the mean absolute error is 0.15, the root-mean-square error is 0.19, the correlation coefficient is 0.90; the consistency between simulation values and actual observation values of waves is good, and the data has a relatively high confidence level; however, in 20 May, the simulation values have a certain deviation; and upon analysis, the reason may be that the bathymetry data used in the simulated sea area has a certain difference from the actual data.
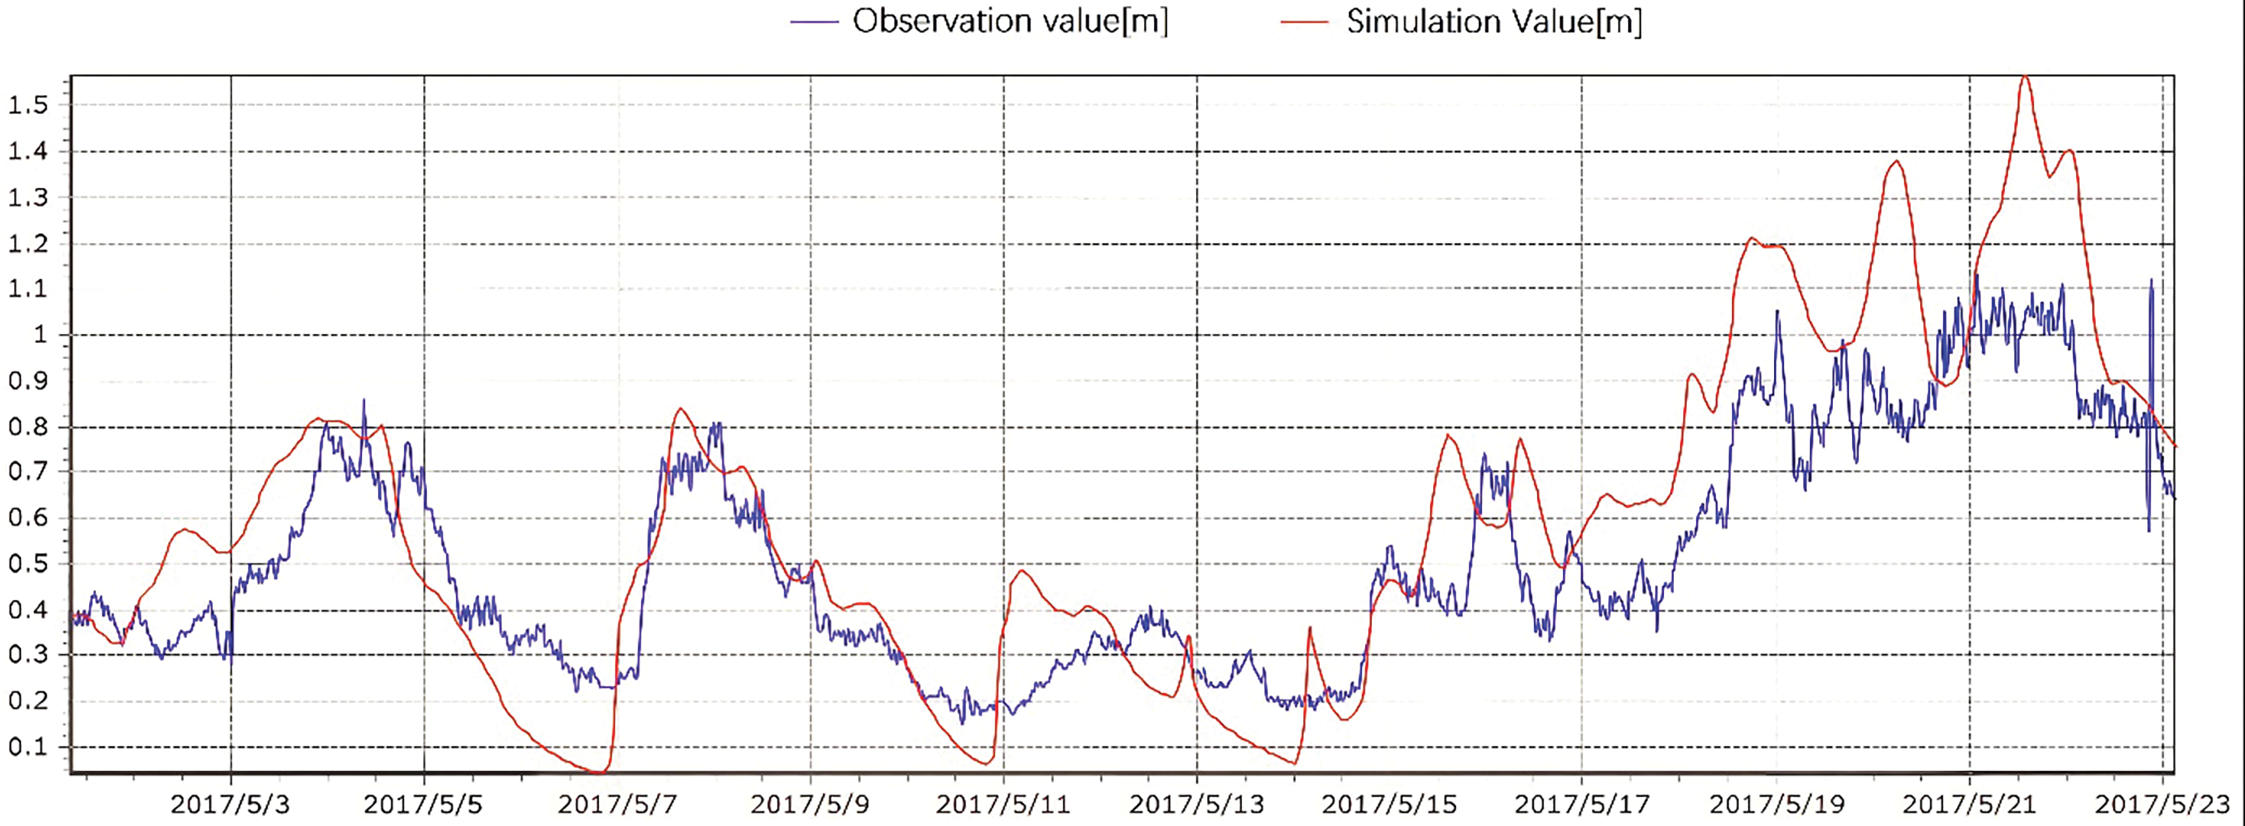
Figure 8: Verification of simulation result and DWR actually measured data of waves
4.2 Wave Distribution Characteristics in the Simulated Sea Area during Testing
The average valid wave height in the simulated sea area during testing is as shown in Fig. 9, and it can be determined that the wave intensity basically decreases gradually as the isobath becomes lighter, and the average valid wave height at the position where the converter is located is between 0.6–0.65 m. The average wave energy distribution in the simulated sea area during testing is as shown in Fig. 10, and the average wave energy density at the position where the converter is located is between 1–1.2 kW/m. Measurement positions were optimized using statistical wave direction data and bathymetry simulations.
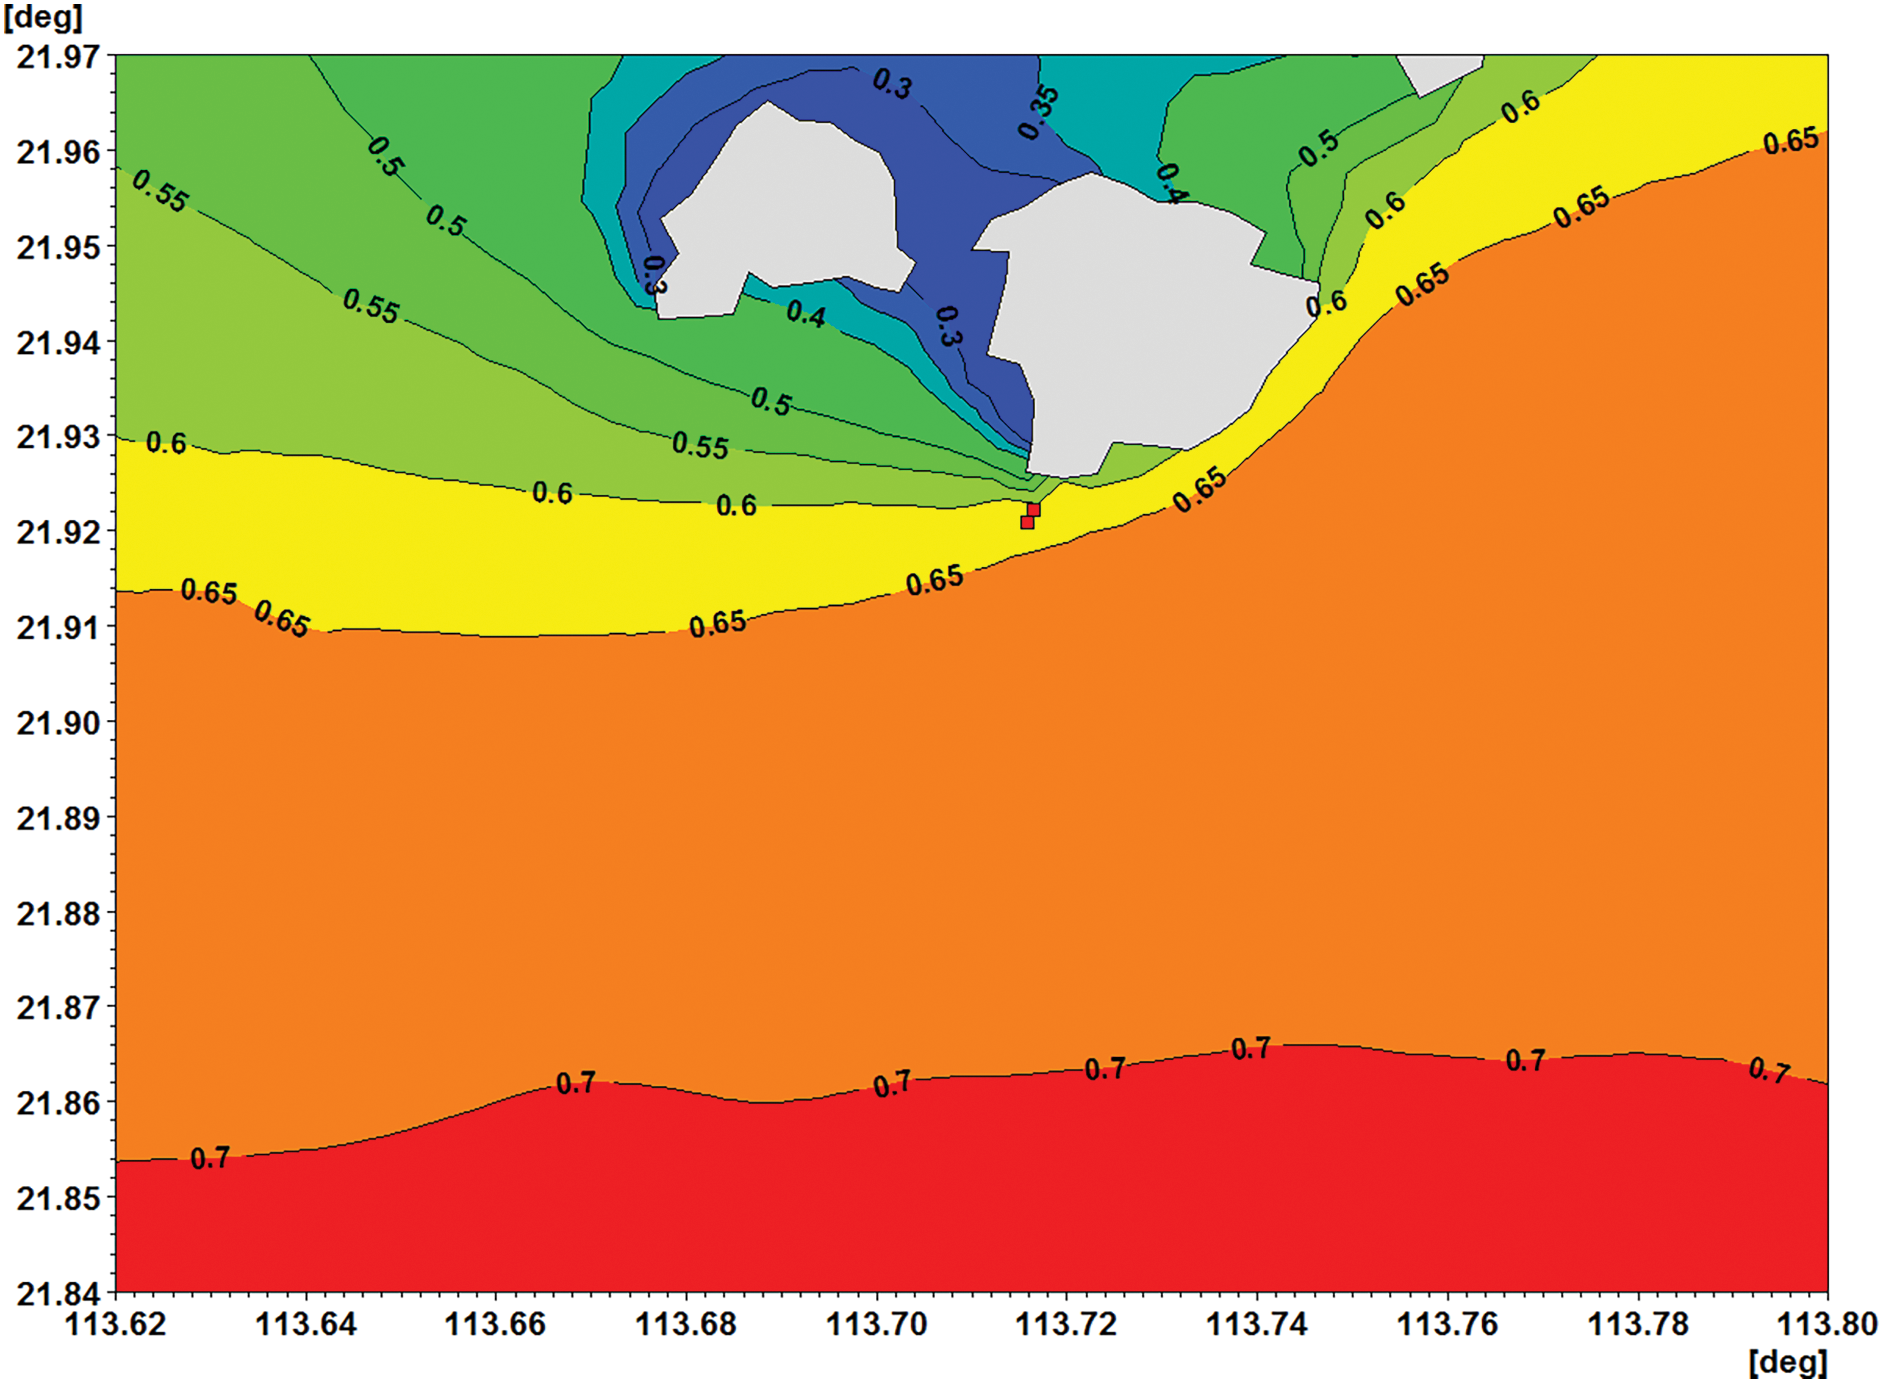
Figure 9: Average valid wave height distribution during testing
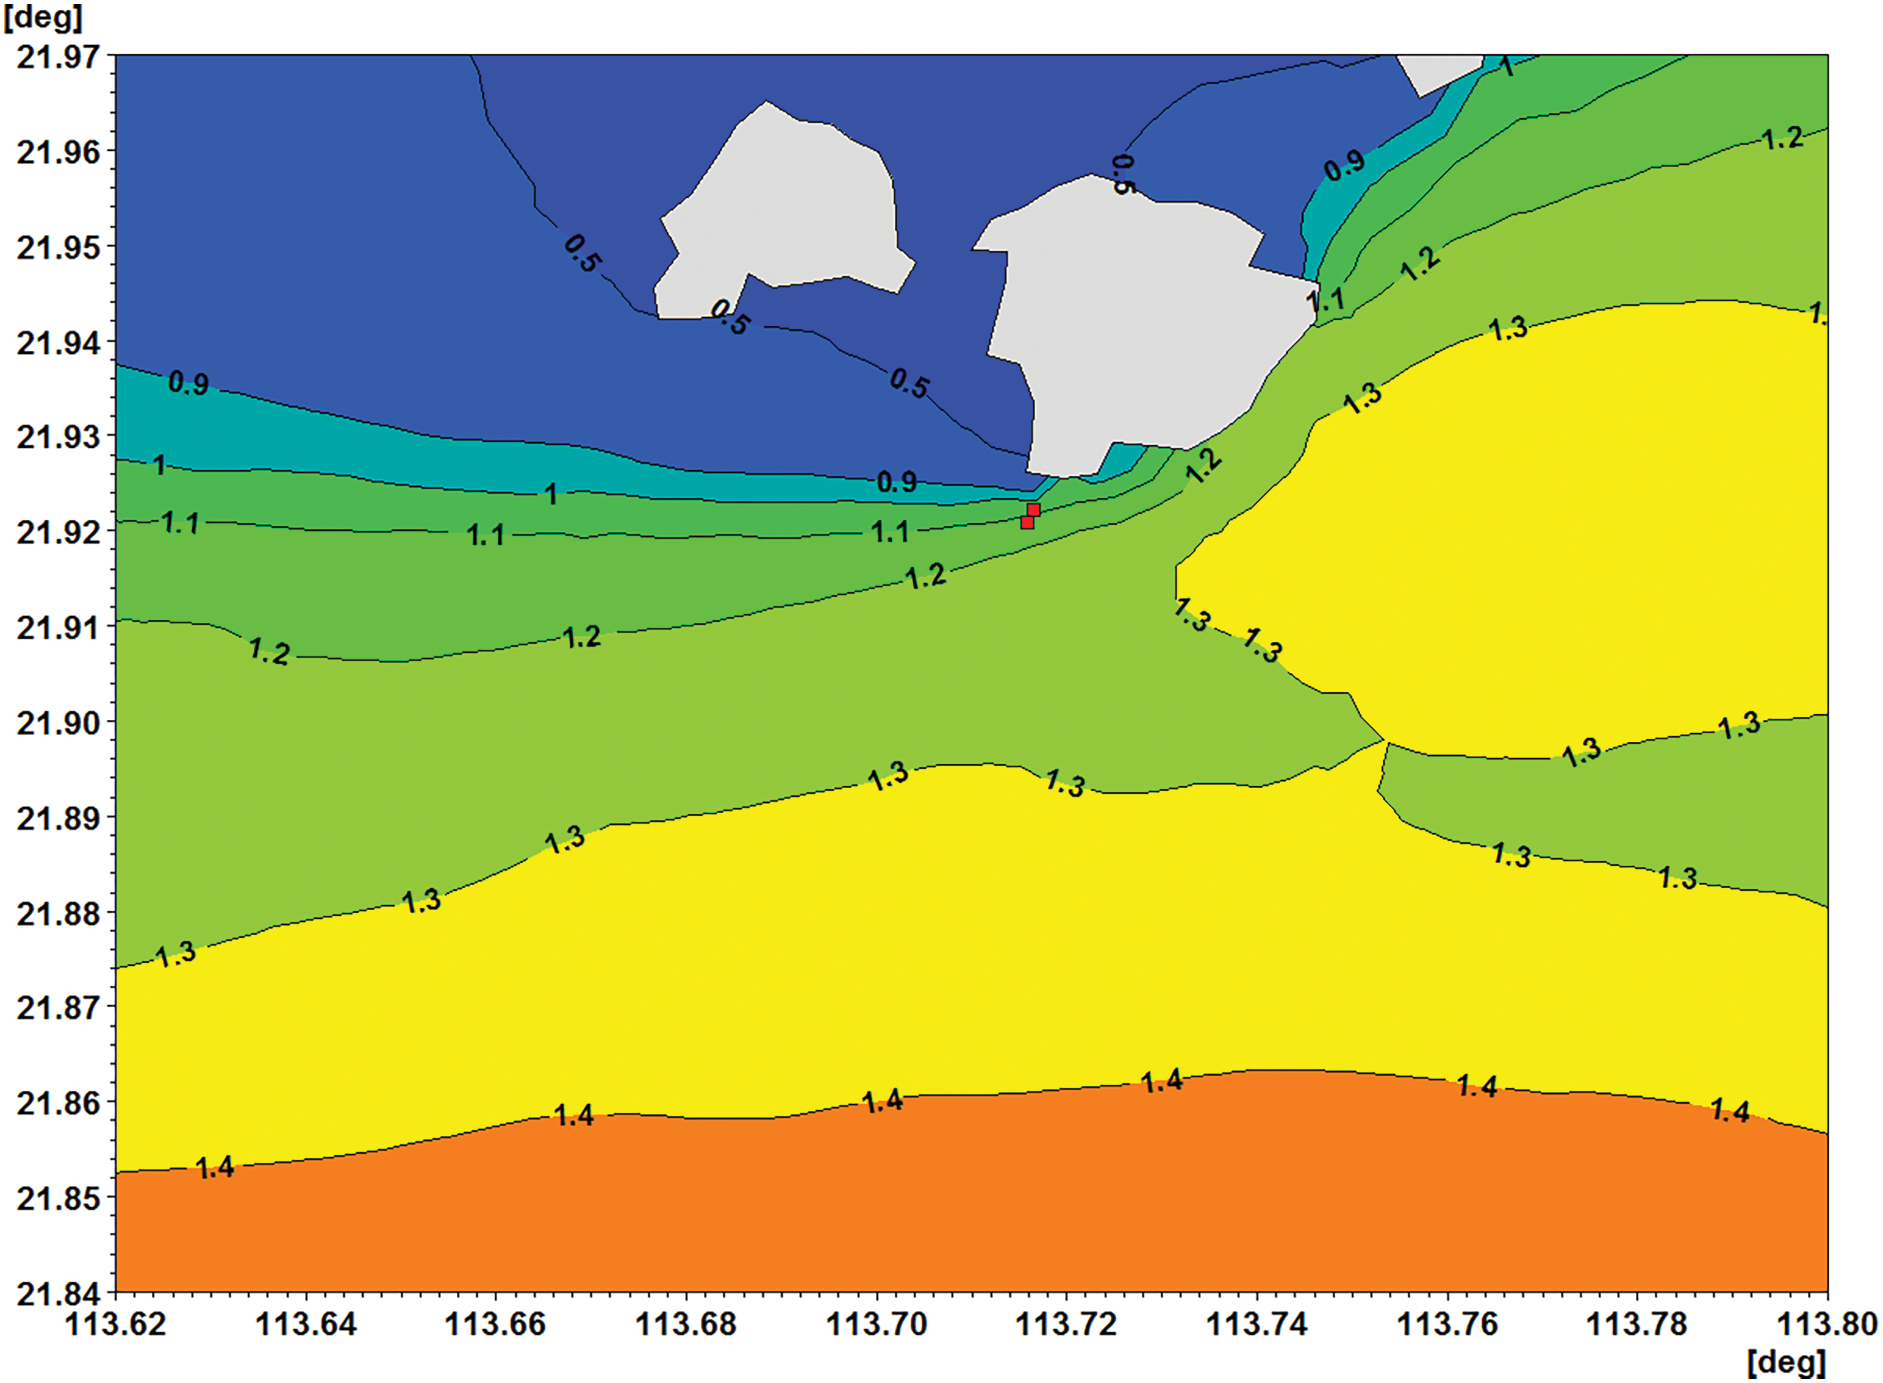
Figure 10: Average wave energy density distribution (kW/m) during testing
4.3 Representativeness Analysis of the Test Position
The valid wave height simulation results at two positions, i.e., the laying position of the “Wanshan” wave energy converter and the test position of the wave rider (DWR) are selected for comparison and analysis (as shown in Fig. 11). The valid wave height vs. time curves of the two have good consistency; by comparing time sequences of the two and performing validity check, upon calculation, the deviation value of the two is −0.01, the mean absolute error is 0.01, the root-mean-square error is 0.02, the correlation coefficient is 0.99. The high correlation (0.99) between DWR and converter wave heights validates the spatial consistency of measurement data. Wave observation data at the test position of the wave rider (DWR) can represent a wave condition of the position where the “Wanshan” converter is located; and input energy and conversion effi-ciency of the “Wanshan” wave energy converter can be calculated by the wave observation data of the wave rider (DWR). Post-optimization validation achieved a correlation coefficient of 0.99 and RMSE of 0.02, con-firming the model’s high accuracy. The MIKE21 SW model simulates wave growth and deformation with high precision by integrating wind fields and bathymetry data.
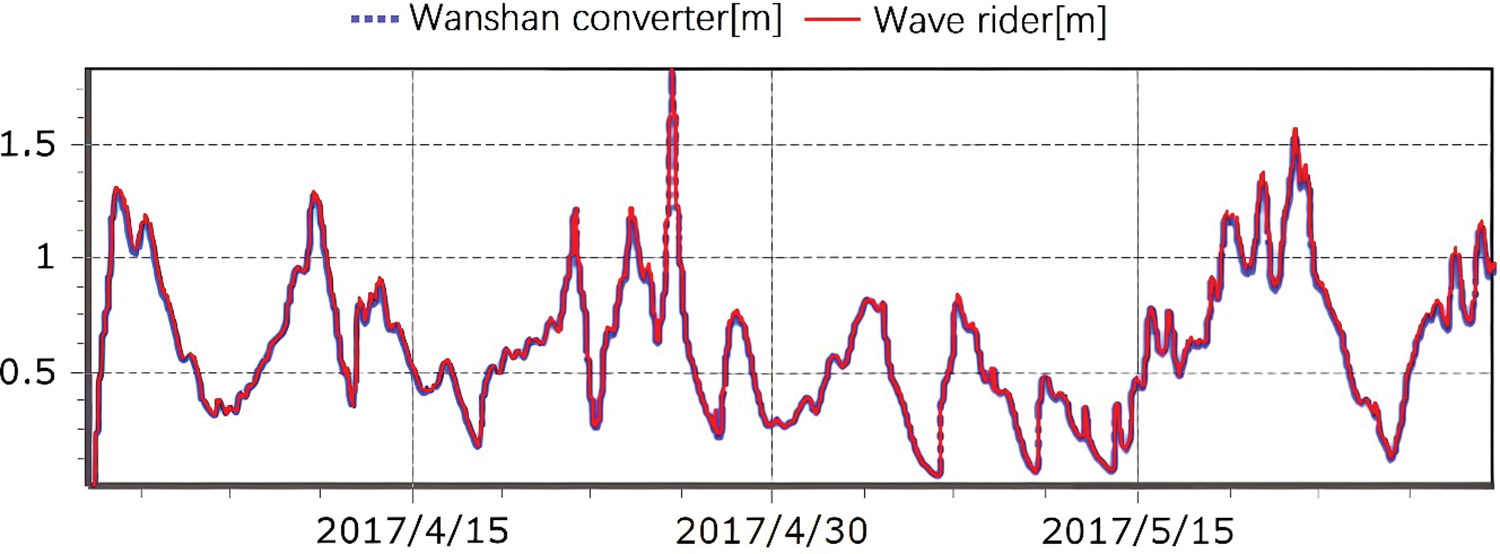
Figure 11: Verification of simulation result and actually measured data of waves
The conversion efficiency is a ratio of an energy value output by the wave energy converter to an energy value input by waves, and is one of important indexes for measuring the power performance of a converter. Wave energy flux calculations based on DWR data directly supported efficiency analysis of the ‘Wanshan’ converter. The conversion efficiency of “Wanshan” wave energy convertor: The conversion efficiency of “Wanshan” wave energy convertor during the test ranged from 0.05% to 31.64%, and the overall conversion efficiency was 11.77%.
In this paper, a wave numerical model of Dawanshan Island Sea Area in Zhuhai city is constructed using the MIKE21 SW model integrated with NCEP CFSv2 wind field data (January 2015–December 2017, covering 18°N–23°N and 111°E–117°E). The primary innovation of this work lies in the development of a hybrid numerical-empirical framework for WEC field testing. By combining the MIKE21 SW model with IEC-62600-100 standards, we achieve a correlation coefficient of 0.99 between simulated and observed wave data, significantly advancing the reliability of wave energy assessments in real-sea environments. Initial validation against 2015 field measurements showed a correlation coefficient of 0.82 (Section 3.1), while post-optimization alignment with IEC-62600-100 standards improved the correlation coefficient to 0.99 (Section 4.3), with a root-mean-square error of 0.02. The result demonstrates that the model not only simu-lates wave distribution characteristics of the Wanshan Sea Area accurately but also ensures high confidence in wave energy assessment for field testing.
By leveraging IEC-62600-100 standards, the methodology for site testing of the ‘Wanshan’ wave energy converter was rigorously validated. The comparison of valid wave heights between the DWR and converter positions confirmed data representativeness (correlation: 0.99), enabling precise input energy calculations and revealing an overall conversion efficiency of 11.77%. These results highlight the model’s capability to support performance optimization of wave energy devices under real-sea conditions.
The proposed methodology exhibits strong generality for diverse WEC types, including oscillating buoy and oscillating water column systems. For instance, the MIKE21 SW model’s capability to simulate wave refraction and diffraction (Section 2.1) ensures applicability to both nearshore and offshore deployments. Furthermore, the IEC-62600-100 compliance (Section 4.2) provides a standardized basis for adapting the framework to other regions with varying bathymetry and wave regimes, such as tidal-dominated estuaries or open-ocean sites.
Future studies should integrate real-time sensor networks and AI-driven predictive models to enhance wave forecasting accuracy and reduce uncertainties caused by bathymetry discrepancies. Machine learning algorithms could optimize wave predictions by integrating multi-source environmental data. This approach could further advance the reliability of field testing methodologies for marine energy systems.
Acknowledgement: Not applicable.
Funding Statement: This research was supported by the “National Ocean Technology Center Innovation Fund” under Project No. N3220Z002, led by Ning Jia. The official website of the National Ocean Technology Center is accessible at: http://www.notcsoa.org.cn/.
Author Contributions: The authors confirm contribution to the paper as follows: Study conception and design: Ning Jia, Xiangnan Wang; Data collection: Ning Jia, Linsheng Han, Hainan Xia; Analysis and interpretation of results: Ning Jia, Xiangnan Wang, Linsheng Han; Draft manuscript preparation: Ning Jia. All authors reviewed the results and approved the final version of the manuscript.
Availability of Data and Materials: Shoreline data were obtained from the Global Self-consistent, Hierarchical, High-resolution Geography Database (GSHHG). Bathymetry data were sourced from the General Bathymetric Chart of the Oceans (GEBCO). Wind field data were derived from the National Centers for Environmental Prediction (NCEP) Climate Forecast System version 2 (CFSv2).
Ethics Approval: Not applicable.
Conflicts of Interest: The authors declare no conflicts of interest to report regarding the present study.
References
1. Hu H, Xue W, Jiang P, Li Y. Bibliometric analysis for ocean renewable energy: an comprehensive review for hotspots, frontiers, and emerging trends. Renew Sustain Energy Rev. 2022;167:112739. doi:10.1016/j.rser.2022.112739. [Google Scholar] [CrossRef]
2. Yang X, Liu N, Zhang P, Guo Z, Ma C, Hu P, et al. The current state of marine renewable energy policy in China. Mar Policy. 2019;100(6):334–41. doi:10.1016/j.marpol.2018.11.038. [Google Scholar] [CrossRef]
3. Veerabhadrappa K, Suhas BG, Mangrulkar CK, Kumar RS, Mudakappanavar VS, Narahari, et al. Power generation using ocean waves: a review. Glob Transitions Proc. 2022;3(2):359–70. doi:10.1016/j.gltp.2022.05.001. [Google Scholar] [CrossRef]
4. Li D, Sharma S, Borthwick AGL, Huang H, Dong X, Li Y, et al. Experimental study of a floating two-body wave energy converter. Renew Energy. 2023;218(8):119351. doi:10.1016/j.renene.2023.119351. [Google Scholar] [CrossRef]
5. Gallutia D, Tahmasbi Fard M, Gutierrez Soto M, He J. Recent advances in wave energy conversion systems: from wave theory to devices and control strategies. Ocean Eng. 2022;252(22):111105. doi:10.1016/j.oceaneng.2022.111105. [Google Scholar] [CrossRef]
6. Guo B, Ringwood JV. A review of wave energy technology from a research and commercial perspective. IET Renew Power Gener. 2021;15(14):3065–90. doi:10.1049/rpg2.12302. [Google Scholar] [CrossRef]
7. Ghaedi A, Sedaghati R, Mahmoudian M, Bazyari S. Reliability modeling of wave energy converters based on Pelamis technology. Electr Power Syst Res. 2024;227(3):109977. doi:10.1016/j.epsr.2023.109977. [Google Scholar] [CrossRef]
8. Li B, Zhang R, Zhang B, Cui Y, Yang Q. A new energy recovery device by utilizing the merchant ship rolling. IEEE Access. 2020;8:162049–65. doi:10.1109/ACCESS.2020.3021180. [Google Scholar] [CrossRef]
9. Wen RT, Sun L, Dong Y, Jiang YC. Design and performance analysis of ship-borne wave energy converter. J Ocean Technol. 2023;42(3):37–45. (In Chinese). [Google Scholar]
10. Chang X, Huang L, Zhang X, Yang J, Liu H. Study on the dynamic optimal control strategy of an electric-hydrogen hybrid energy storage system for a direct drive wave power generation system. J Mar Sci Eng. 2023;11(7):1347. doi:10.3390/jmse11071347. [Google Scholar] [CrossRef]
11. Peng W, Wang F, Wang J. Status and development suggestion for the development and utilization of ocean energy in China. Mar Econ. 2022;12(3):70–5. doi:10.19426/j.cnki.cn12-1424/p.2022.03.001. (In Chinese). [Google Scholar] [CrossRef]
12. International Electrotechnical Commission. Marine energy-wave, tidal and other water current converters—part 1: terminology. London: IEC; 2019. TS 62600-1. [Google Scholar]
13. International Towing Tank Conference. ITTC recommended procedures guidelines: wave energy converter model test experiments. Hamburg, Germany: Ocean Engineering Committee; 2021. [Google Scholar]
14. Xia HN, Wang XN, Li Q, Jia N, Chang H, Zhao ZK. Comparison and analysis of wave parameters in field test of wave energy converters. Acta Energiae Solaris Sin. 2022;43(6):251–5. doi:10.19912/j.0254-0096.tynxb.2021-1081. (In Chinese). [Google Scholar] [CrossRef]
15. Zhang Y, Liu C, Wang T, Wei J, Chen L, Li X, et al. Machine learning-enhanced wave prediction for offshore energy systems. Ocean Eng. 2023;275(5):114203. doi:10.1016/j.oceaneng.2023.114203. [Google Scholar] [CrossRef]
16. García-Medina G, Yang ZQ, Li N, Wu Y, Roberts J, White K, et al. Hybrid LiDAR-buoy systems for typhoon-resilient wave characterization. Renew Energy. 2024;225:120112. doi:10.1016/j.renene.2024.120112. [Google Scholar] [CrossRef]
17. International Electrotechnical Commission. Marine energy-wave, tidal and other water current converters—part 100: electricity producing wave energy converters-power performance assessment. Geneva: IEC; 2023. TS 62600-100. [Google Scholar]
18. García Medina G, Yang Z, Li N, Cheung KF, Lutu-McMoore E. Wave climate and energy resources in American Samoa from a 42-year high-resolution hindcast. Renew Energy. 2023;210:604–17. doi:10.1016/j.renene.2023.03.031. [Google Scholar] [CrossRef]
19. Li N, García Medina G, Yang Z, Cheung KF, Hitzl D, Chen YL. Wave climate and energy resources in the Mariana Islands from a 42-year high-resolution hindcast. Renew Energy. 2023;215(5):118835. doi:10.1016/j.renene.2023.05.093. [Google Scholar] [CrossRef]
20. DHI. MIKE 21 spectral wave module scientific documentation. Hørsholm, Denmark: DHI Water & Environment; 2009. [Google Scholar]
Cite This Article
 Copyright © 2025 The Author(s). Published by Tech Science Press.
This work is licensed under a Creative Commons Attribution 4.0 International License , which permits unrestricted use, distribution, and reproduction in any medium, provided the original work is properly cited.
 Downloads
 Citation Tools