
 Submit a Paper
 Propose a Special lssue
 Open Access
ARTICLE

Techno-Economic Comparison of Electrochemical Batteries and Supercapacitors for Solar Energy Storage in a Brazil Island Application: Off-Grid and On-Grid Configurations
1 Environmental Engineering Program, Federal University of Rio de Janeiro, Rio de Janeiro, 21941-901, Brazil
2 Faculty of Engineering and Architecture, Peruvian Union University, Juliaca, 21101, Peru
3 University Rovira i Virgili, Department of Mechanical Engineering, Av. Països Catalans, 26, Tarragona, 43007, Spain
* Corresponding Author: Dieter Boer. Email:
(This article belongs to the Special Issue: Selected Papers from the SDEWES 2024 Conference on Sustainable Development of Energy, Water and Environment Systems)
Energy Engineering 2025, 122(7), 2611-2636. https://doi.org/10.32604/ee.2025.061971
Received 07 December 2024; Accepted 13 May 2025; Issue published 27 June 2025
 View Full Text
 Download PDF
Abstract
The growing concern for energy efficiency and the increasing deployment of intermittent renewable energies has led to the development of technologies for capturing, storing, and discharging energy. Supercapacitors can be considered where batteries do not meet the requirements. However, supercapacitors in systems with a slower charge/discharge cycle, such as photovoltaic systems (PVS), present other obstacles that make replacing batteries more challenging. An extensive literature review unveils a knowledge gap regarding a methodological comparison of batteries and supercapacitors. In this study, we address the technological feasibility of intermittent renewable energy generation systems, focusing on storage solutions for PVS energy. We propose a framework according to one of the essential parameters for their application in PVS: Energy Density or Specific Energy (Wh/kg). Through computational modelling, issues related to the intermittency and seasonality of the solar energy source are addressed, evaluating the possible benefits of implementing batteries, supercapacitors, and hybrid solutions in renewable energy generation systems. Also, the characteristics of two hypothetical configurations of photovoltaic systems, off-grid and on-grid, were analysed. This analysis highlights the characteristics of totally isolated systems (e.g., on an island or remote village) and systems connected to the grid (e.g., solar farms), where eliminating the use of batteries can bring significant benefits, in addition to tax incentives, which are decisive in the investment decision-making process. The results clarify the viability of PVS and allow an understanding of parameters that can support the technical decision process between isolated or non-isolated systems, reflecting economic and financial issues.Graphic Abstract
Keywords
A simple way to understand how to control energy is to decompose it into time and power. As electrical energy is directly proportional to these two factors, from a consumption point of view, reducing at least one of them already reduces the energy involved in a process. On the other hand, from a production approach, increasing one of these factors can increase the generated energy and system efficiency for both cases. Not leaving aside the quality requirements of the energy before and after that reduction or increase.
In the same way, the vision of systems and processes clarifies the definition of boundaries during the energy analysis processes. It proves fundamental to measuring the effects of energy reduction or increasing actions in a system, aiming at its more efficient consumption or production, respectively, which reflects directly in energy efficiency [1].
The analysis of renewable energy sources considering these components (time and power) under a systemic approach can bring a complete view of energy efficiency, for example, including storage devices in conjunction with photovoltaic panels, to circumvent the time aspects of seasonality over the months and the intermittency throughout the days, inherent to the incidence of sunlight, also, including the power conversion efficiency, in this case, the conversion of solar radiation into electrical power.
Energy conversion efficiency (ECE) refers to the amount of useful energy obtained from a conversion divided by the energy used.
However, as mentioned by Ghosh and Yadav [2], the most commonly and widely used parameter for comparing different PV technologies is power conversion efficiency (PCE), which can be written as follows.
Energy is power integrated over time, as power is the rate at which work is done or transmitted energy.
The same authors state that PCE limits are fundamental to manufacturers, project developers, consumers, and all stakeholders as they affect energy efficiency, the Levelized Cost of Energy (LCOE) [3], and eventually, the financial feasibility of the projects.
1.2 Brief History: Evolution of Solar Panel’s Intrinsic Efficiency
In a review work, Sing [4] points out that Solar Power is the conversion of sunlight into electricity, either directly using photovoltaic (PV) or indirectly using concentrated solar power (CSP). The following considerations are based on the direct photovoltaic energy conversion efficiency.
A brief timeline of PV can reveal its evolution over the last two centuries since Alexandre-Edmond Becquerel discovered the photovoltaic effect in 1839. Heinrich Hertz confirmed the effect experimentally in 1887, and Albert Einstein explained it in an article published in 1905, which was translated into a book by Arthur Miller in 1981 [5]. In 1883, when Charles Fritz developed the first photovoltaic cell, its power conversion efficiency was less than 1%.
In 1954, three papers from the USA were published in the American Physical Society journals, reporting advances in research in the field of PV. Loferski quantified the capability of semiconductor p-n junction devices in converting the energy of incident radiation into electricity, with a significant increase compared to the previous century [6]. At that time, the power conversion efficiency reached a new level of 11%.
In 1962, research published by Shockley and Queisser [7] calculated the theoretical limit value of the PCE, defined as the Shockley-Queisser limit (SQ), and presented the maximum efficiency for a photovoltaic device based on a p-n junction, called the detailed balance sheet efficiency threshold, as being up to 30%.
Nowadays, the most common technologies of PV cells are, Crystalline Silicon (Si), Single-Junction Gallium Arsenide (GaAs), Multi-junction Cells (2, 3, 4 and more junctions), Thin Film (amorphous-Si, CdTe, Copper Indium Gallium Selenide—CIGS), and also the emerging technologies, e.g., Dye Sensitised Cells (liquid electrolyte), Organic Cells, Inorganic Cells, Perovskite Cells, Quantum Dot Cells and Carbon Nano Tube (single and multi-walled) [2].
Concerning the classical Crystalline Silicon (single-Si, multi-Si, Si-Heterostructures—HIT and Thin Film Crystal) technologies, in 2013, according to Richter et al. [8], the theoretical power conversion limit efficiency was estimated to be 29.4%. On a laboratory scale, achieving 25% efficiency was reported in 1999 [9], and a slight improvement in the efficiency value has been achieved since then. These publications, combined with values recently published in the journal Progress in Photovoltaic about Solar Cells Efficiency for the last 30 years [10], allow us to assume that future PV cell PCE improvements will probably come from the above-mentioned technologies.
The Eq. (5) describes the efficiency of a solar panel by relating the maximum power that can be obtained according to its functional area and the amount of solar irradiance.
From Eq. (5), it is possible to extract, for the same level of solar irradiance (e.g., 1000 W/m²), the relationship between Pmax, SPE (%) and the solar panels Area (m²).
The insertion of values in this Formula (5) allows us to observe that for solar panel efficiencies (SPE), the effect obtained by incrementing 1% in the efficiency results in power increments (
Solar panels on the market have already reached efficiency levels of around 20%. Intrinsic gains in efficiency of 100% would lead to panels having an efficiency of around 40%, reducing the required area for the same installed power by 50%. Still, in this example, an increase in panel area by 100%, considering panels with 20% efficiency, would bring the same effect in terms of installed power as the 40% intrinsic efficiency of the panels, historically more challenging to obtain. This means that, although the intrinsic efficiency gains of solar panels are welcome when the spatial aspects of the systems are not critical, panel sizing that focuses on the panel area can meet the energy demands of a large proportion of consumers.
Such a comparison, far from minimising the importance of efforts to increase the intrinsic efficiency of panels, aims to show the relevance of the advances already achieved in this aspect [11].
The system view approach to measuring energy efficiency leads us to consider the need to promote advances, such as those mentioned above about the intrinsic efficiency of panels, in minimising losses and waste of energy produced [12]. Aspects such as the intrinsic efficiency of devices for storing the energy produced could bring more timely results for energy efficiency in general. Also, aspects such as connecting these energy generation systems to the grid to obtain storage functionality circumvent the issue of solar irradiation intermittency.
These considerations led us to focus this research on the energy efficiency of solar photovoltaic systems and their energy storage aspects [13] to find information that can add value to existing and future systems.
This study will raise relevant aspects of electrical energy storage devices, in the electronic aspect, restricted to batteries and supercapacitors. However, in future work, solutions such as devices involving reversible hydroelectric plants, kinetic flywheels, and hydrogen may be included in this comparison.
When comparing batteries and supercapacitors, one interesting aspect is the inversion of characteristics between energy and power density, suggesting that these solutions could complement hybrid energy storage systems [14,15]. These characteristics can be observed in the Ragone Plot [16]. A literature review shows that the studies regarding this combination are more focused on solutions for mobile use with fewer, however crescent number, of studies related to solutions for networks powered by photovoltaic systems [14,17,18].
This work aims to establish a dynamic list of factors that compare energy storage systems (ESS). Also, it is expected to serve as a basis for future analyses and include new factors that can provide criteria for deciding when to use the systems and whether they should be used separately or in hybrid mode (HESS) according to the desired applications.
These studies focus on modelling off-grid and connected solar generation plants [19], mainly community solar farms. In these cases, factors such as the system’s mass and volume do not necessarily represent the most critical constraints without failing to prioritise the system’s intrinsic efficiency.
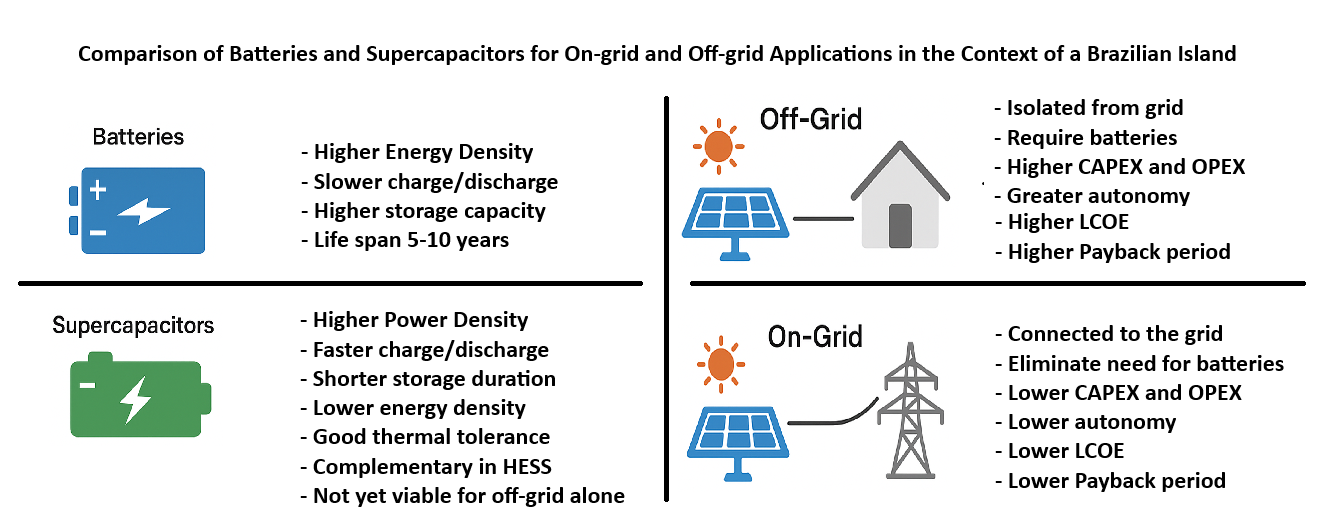
This work was divided into two main parts. The objective was to establish a minimum set of parameters to compare two electrical energy storage systems, batteries and supercapacitors. Next, two solar plant systems were analysed to meet the same demand of island inhabitants and verify the application of the energy storage system.
The first part refers to a comparative analysis through parameters of the characteristics of the energy storage systems, namely batteries and supercapacitors. Aspects such as Operating Principles, Voltage Source, Energy and Power Density (Mass and Volume) and Temperature Ranges are analysed. More relevant aspects are proposed for future studies.
The second part is a hypothetical case study involving modelling two scenarios of Photovoltaic Plants meeting an island’s energy demand. Scenario 1 considers the system off-grid and uses batteries. In Scenario 2, the system is on-grid, that is, connected to the distribution network of the nearby concessionaire, and batteries are not considered. The electrical network stores excess energy.
The photovoltaic plant’s energy production, consumption, storage, and export were modelled, simulated, and optimised. The graphs generated were implemented in MS Excel using formulas relating, for example, the hourly sunlight data of the region under analysis, extracted from the Energy Plus website [20], with the performance information of the manufacturers of the solar panels and batteries adopted.
Data related to energy production and consumption were distributed hourly, daily, monthly, and annually to consolidate and analyse the model’s financial and economic aspects and obtain reliability in calculations.
The consumption profile developed for the simulations considers the island’s 4000 inhabitants, distributed across approximately 1300 residences (local businesses are located in some residences) and public lighting. As detailed in the case study, this profile intentionally results in peak energy consumption outside of sunlight hours, either due to the islanders’ habits or lighting consumption.
The LCOE is the economic assessment of the average total cost to build and operate a power-generating asset over its lifetime, that is, the Life Cycle Cost (LCC) divided by the total energy output of the asset over that lifetime, which could be called Life Cycle Energy (LCE). The LCOE can also be considered the average minimum cost at which electricity must be sold to ensure the feasibility of the project over its lifetime [21].
where:
LCC: Life Cycle Cost at a Net Present Value €
LCE: Life Cycle Energy (kWh)
i: Annual nominal discount rate (%)
n: Expected lifetime of the power-generating system (y)
The real discount rate (r), considering the general energy price inflation rate (I), can be obtained from Eq. (7).
where:
r = Real discount rate (%);
i = Nominal discount rate (%);
I = General energy price inflation (%).
For the LCOE calculations, considering Brazil, annual values for the nominal discount rate of 7.00% and an energy price inflation rate of 3.50% were adopted, resulting in a real discount rate of 3.38%, obtained through Eq. (7). The time frame for the life cycle was 30 years.
3 Energy Storage Comparison Points
A rechargeable battery is one or more electrochemical cells that convert stored chemical energy into electrical energy during a discharge process or electrical energy into chemical energy during a charging process [22]. The Handbook of Batteries [23] explains that an electrochemical cell is a chemical device for generating or storing electric energy. It consists of a positive and negative electrode, separated by an electrolyte. The electrolyte is an electronic insulator that can conduct ions between the two electrodes. The positive and negative electrodes are immersed in the electrolyte, and the reacting substances are usually stored within the electrodes, sometimes in the electrolyte. The chemical reactions associated with the energy conversion take place at the two electrodes. During discharge, the negative electrode contains the oxidised substance (i.e., releases electrons), while the positive electrode contains the reduced oxidising substance (i.e., accepts electrons). Those electrons pass through the external load, thereby doing valuable work. When the battery is charged, this reaction is reversed, and a corresponding amount of energy from an external source has to be supplied to the cell.
Supercapacitors lay in the middle ground between batteries and conventional capacitors. Electric Double-Layer Capacitors (EDLC) take advantage of the electro-ionic charge storage induced in the electrochemical double layer of high-surface-area carbons, whereas electrochemical supercapacitors rely on electroactive phases which undergo faradaic redox processes limited to the electrode-electrolyte interface leading to a so-called pseudocapacitance [24].
Assuming a circuit with a direct voltage source (Vo) and a capacitor with capacitance (C) and a Resistance (R) during the charging period and subsequently, after the switch (A), the same capacitor is connected to a Resistance or Load (R’) during the discharging period (Fig. 1).
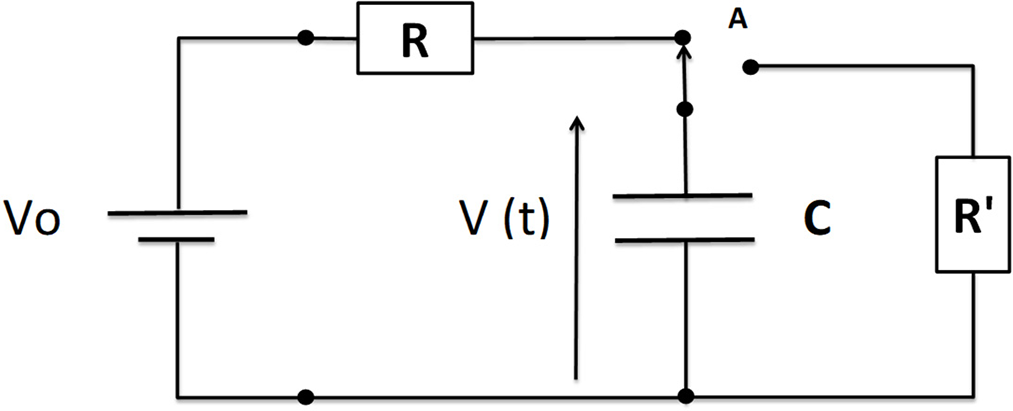
Figure 1: RC circuit
The factor τ = RC is the circuit constant time. With V(t) being the voltage on the capacitor, the following equation determines the form of this voltage according to the voltage source charging the capacitor over time.
If the exact value of R for events, charge, and discharge is considered, a graphical representation will be as follows (Fig. 2). The capacitance constant (τ = RC) is the same.
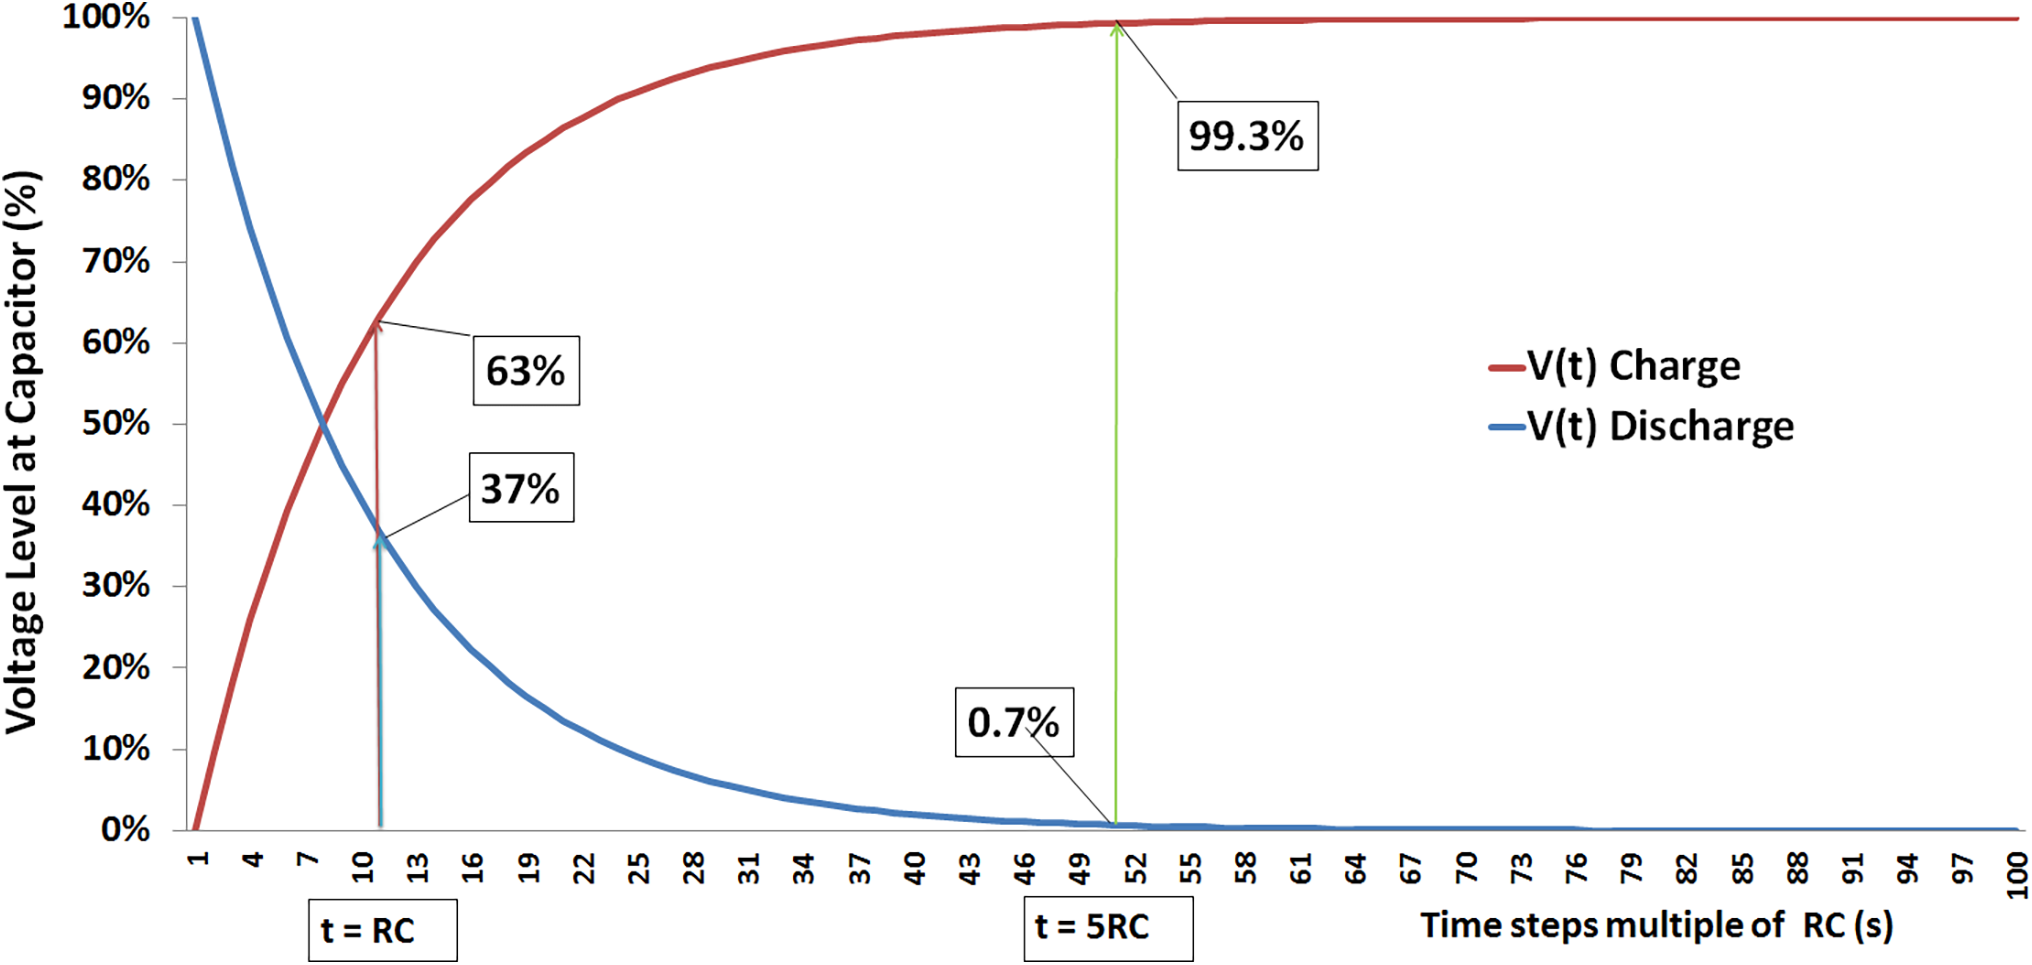
Figure 2: Capacitor charge and discharge curves (τ = RC)
Consider a value of R’ = 10 for the same circuit above. R during the discharge of the capacitor (C) will be represented graphically as follows (Fig. 3). That is, the capacitance constant (τ = RC) is now ten times (blue) of that from the charging period (red).
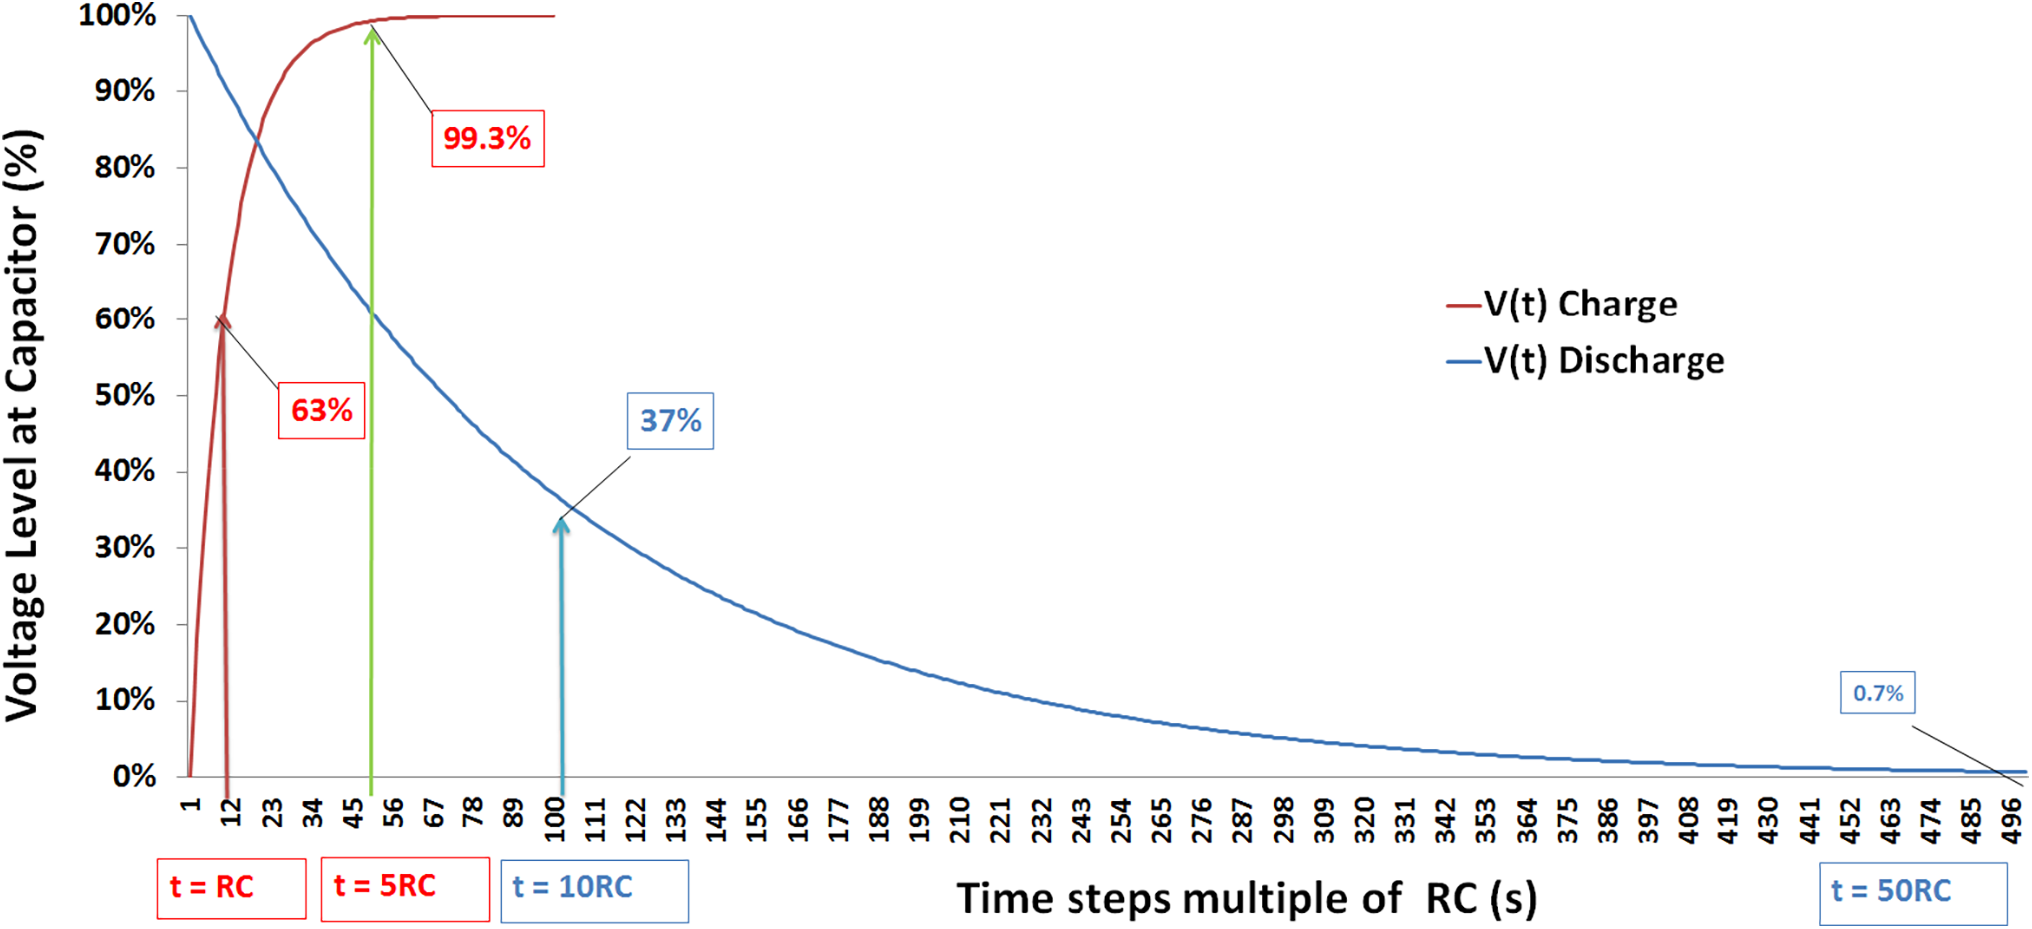
Figure 3: Charge (τ = RC) and discharge curves (τ = 10RC)
The examples shown above illustrate that the charge and discharge curves of a capacitor (as well as that of a supercapacitor) directly reflect the voltage, which makes using capacitors as a voltage source inappropriate. These curves also demonstrate the characteristics of capacitors that are suitable for meeting power demands in a short time (Power = Energy/Time). However, less energy for extended periods (Energy = Power · Time). Remembering that “Time” is equivalent to the capacitance constant above, τ = RC. Characteristic charge and discharge curves for supercapacitors can be found, for example, in a review study published by Noori et al. [25], where the characteristics of Capacitors, Supercapacitors (EDLC and Pseudocapactitors), Hybrid Systems and Batteries are discussed in detail.
Even increasing the energy density of supercapacitors, which is characteristic of storing energy per unit of mass (Wh/g) and delivering this energy in the form of power (W), it is clear that this energy is extinguished quickly. Techniques and mechanisms are needed to overcome this characteristic, mainly when supercapacitors are used separately without batteries. The latter has a very prominent voltage source characteristic with a relatively flat profile, as shown in the following graphic (Fig. 4).
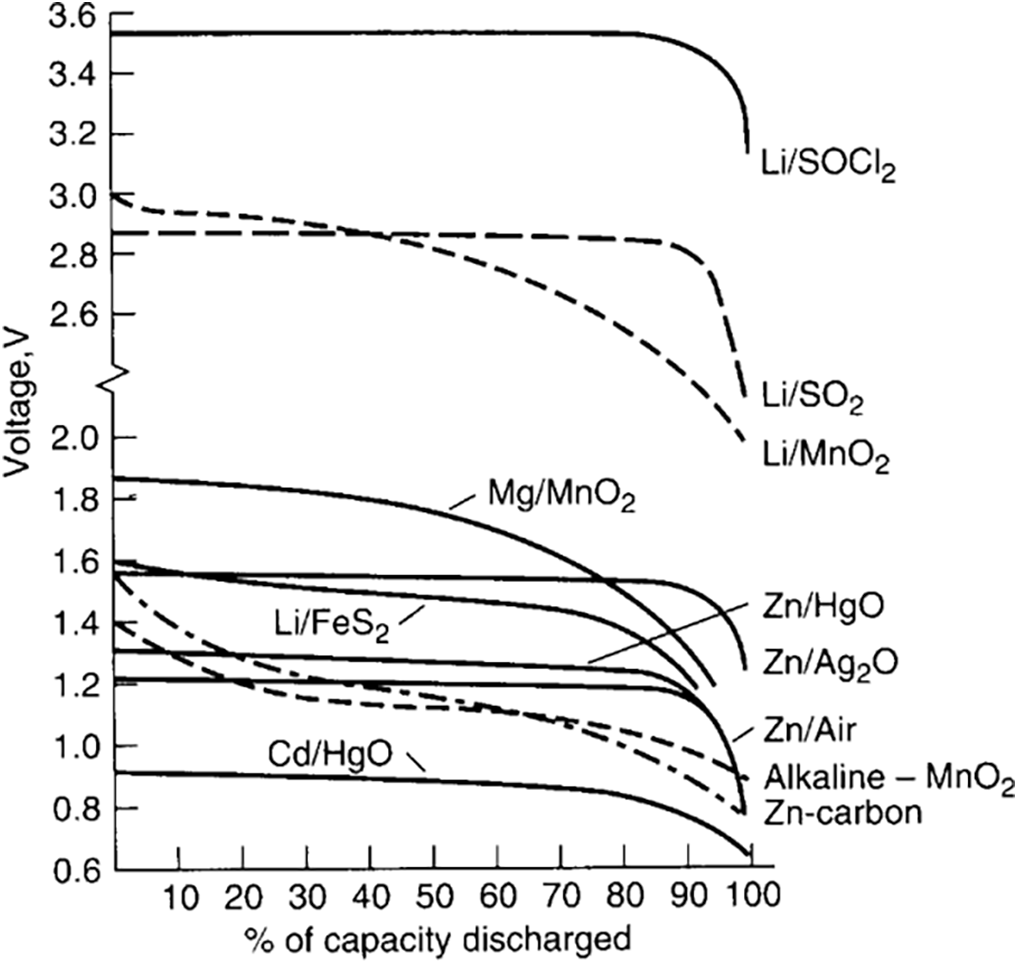
Figure 4: Batteries discharge curves—Extracted from [23]
The examples above show that the speed with which supercapacitors absorb energy is penalised by the speed with which they deliver this energy and how this compromises the voltage between their electrodes. Compared to batteries, there is a clear point of complementarity between the two and a significant gap to be filled with the evolution that supercapacitors have ahead.
3.3 Energy Density and Power Density (Mass and Volume)
There are two fundamental types of batteries: (1) primary cells, commonly referred to as non-rechargeable batteries, and (2) secondary cells, also known as rechargeable batteries [23]. Within this classification, other sub-genres are also used to better classify batteries based on particular structures or designs [25], some of these the following: (a) Stationary × Flow Batteries, (b) Dissolution/Deposition × Intercalation/De-intercalation-based Batteries, (c) Closed × Open Batteries, (d) Aqueous × Non-aqueous Batteries, (e) Solid Electrolyte (dry) × Liquid Electrolyte (wet) Batteries, (f) Acidic × Alkaline Batteries.
Still, according to [25], from a thermodynamic point of view, the potentials of typical batteries are almost constant in the operating potential window, evidenced by a plateau in charge-discharge profiles. A cell’s potential measures the maximum energy per unit charge available for work when the charge is transferred through an external circuit.
In other words, one Joule (J) of work is the work done to move one Coulomb (C) of electric charge between two points with a potential difference of one volt (V). However, if the work flows out of the system, it is assigned a negative sign, whereas the potential of such a system is positive. Considering that the charge of 1 mol of electrons is a constant called the Faraday constant (F = 96,485.33 C/moL). This is not to be confused here with Farad (F) = Coulomb/Volt, which is the capacitance measurement of the capacitors, shown below.
or
where n is the number of electrons transferred per mole, in batteries, electrons are transferred from one molecule or atom to another via redox reactions.
The Handbook of Batteries [23] states that the capacity of a cell can also be considered on an energy (watt-hour) basis by considering both the voltage and the quantity of electricity. This theoretical energy value is the maximum value that a specific electrochemical system can deliver:
The energy density, or specific energy (also called gravimetric energy density), of a battery system reflects the hours of service each battery type (normalised to 1 kg battery weight) will deliver at various power levels (discharge current, midpoint voltage) to an end voltage usually specified for that battery type. The following equation can determine the energy density.
or
or in SI units
In a Zn/Cl2 cell, for example, if the standard potential is taken as 2.12 V, the theoretical watt-hour capacity per gram of active material (theoretical gravimetric specific energy or theoretical gravimetric energy density) is:
In contrast to a conventional battery, where electrolyte-mediated isolation harnesses a spontaneous redox reaction between species with different potentials, conventional capacitors are formed by two identical conducting electrodes, which are polarised and store charge proportional to the voltage applied.
or
where q is the charge in coulombs (C), C is the capacitance in Farads (F), and E is the potential or voltage in volts (V).
Energy stored (J) in a Supercapacitor follows the equation.
From a geometric point of view, the capacitance (C) is directly proportional to the area of the electrodes (A) and inversely proportional to the separation distance (d) between them, which is separated by a dielectric with permittivity (
The conception of double-layer supercapacitors led to orders of magnitude improvement in energy density by storing charge at the interface between a carbon electrode and an electrolyte by forming a Helmholtz double layer upon polarisation [26].
Double-layer supercapacitors are sometimes called electrochemical double-layer capacitors (EDLC) [27]. Using carbide-derived carbons with pore sizes smaller than 1 nm showed that ions diffuse through these ultramicro pores upon desolvation and contribute to increased capacitance values [28].
The large capacitance (C), and hence energy storage potential of supercapacitors arises due to the small (<1 nm) separation (d) between electrolyte ions and carbon and high (typically 500 to 2000 m²/g) specific surface area (SSA) of carbon electrodes according to the equation above. According to [29], at least three main categories concerning electrode materials are carbon-based, metal oxides and polymeric. A comprehensive review of possible electrode materials suitable for supercapacitors is given by [30–33].
A geometrical observation of the effect of porosity and its importance for the SSA could be verified supposing the porous as perfect spheres and calculating the number of spheres (diameter of 1 nm) possible to fulfil a cube of 1 cm³, dividing 1E-6/(1E-9)³, that results in 1E21 spheres. The volume of these spheres would be, 1E21
Because SSA is explicitly related to pore size, understanding its effect on specific capacitance is especially important. Numerous studies have been conducted on this subject over the past decades [35–39]. The following studies can also be considered [40–43].
In their recent study on the construction of supercapacitors, Behzadi et al. [44] point out that various nanocomposites have been used to fabricate electrodes. However, nanocomposite electrodes based on two-dimensional (2D) nanomaterials have received much attention recently due to their unique properties. These authors emphasize that the recent development of supercapacitors has been summarized mainly concerning nanosheet electrodes. In their study, they also compare the types of supercapacitors based on electrode materials, cyclic stability, specific capacitance, power and energy densities for 2D nanomaterial electrodes. They discuss new findings of critical nanosheet-based supercapacitors, including MXenes, Graphene and Carbon nanomaterial electrodes.
As stated by Schneuwly and Gallay [45], supercapacitors may be used wherever high-power delivery or electrical energy storage is required. Therefore, numerous applications are possible. The use of supercapacitors allows the complementation of standard batteries. In combination with batteries, the supercapacitors improve the maximum instantaneous output power and the battery lifetime. A series connection can be implemented to increase the voltage across a supercapacitor device. The same authors propose an active voltage repartition device that ensures optimal efficiency and no overvoltage over any supercapacitor.
In recent studies with supercapacitors [46], an ionic liquid was used as the electrolyte reached an energy density of 63.3 Wh/kg at a power density of 300 W/k. As reported by Asl et al. [47], higher results are obtained in studies involving advanced materials such as electrodes [47].
Typical supercapacitors available on the market today [48,49] have the following specifications, worth briefly showing here: Capacity = 3000 F, Voltage = 2.7 V, Energy Storage Capacity = 3.04 Wh. The energy stored in a supercapacitor is obtained from the following equation, considering that 1 W ⋅ s = 1 J, or 1 W ⋅ h/3600 = 1 J, and therefore, 1 W ⋅ h = 3600 J [50].
The following equation can be used to relate the unit of energy stored in a supercapacitor to the typical unit used by batteries (Ah).
or
Typical stationary batteries used in Photovoltaic Solar Systems (PVS), found on the market today, are 270 Ah and 12 to 25.6 V. Therefore, taking into account only the amount of energy to be stored, to replace, for example, one 270 Ah battery with 1125 Ah Supercapacitors, 240 units would be needed.
Batteries can only discharge and store electricity over a relatively narrow range of temperatures. Battery performance is low at low and high temperatures, which shortens the battery life and causes serious safety hazards. The ability of supercapacitors to store and release high power in extremely cold environments is another reason why they are feasible for renewable energy applications [15]. Studies on the behaviour of solar panels in extreme temperatures also complement this subject [51].
Studies relating the various factors that influence supercapacitors’ power and energy density demonstrate the relevance of temperature in these results, as shown in the Ragone Plot (Fig. 5) extracted from [52]. At –25°C and 80°C, the maximum energy densities are 30.5 and 60.25 Wh/kg, respectively. The authors explain that as the temperature decreases, the viscosity of the gel electrolyte gradually increases, and the mobility of the internal ions decreases, and, with high current densities, this results in a sharper drop in performance at low temperatures than it does at higher temperatures.
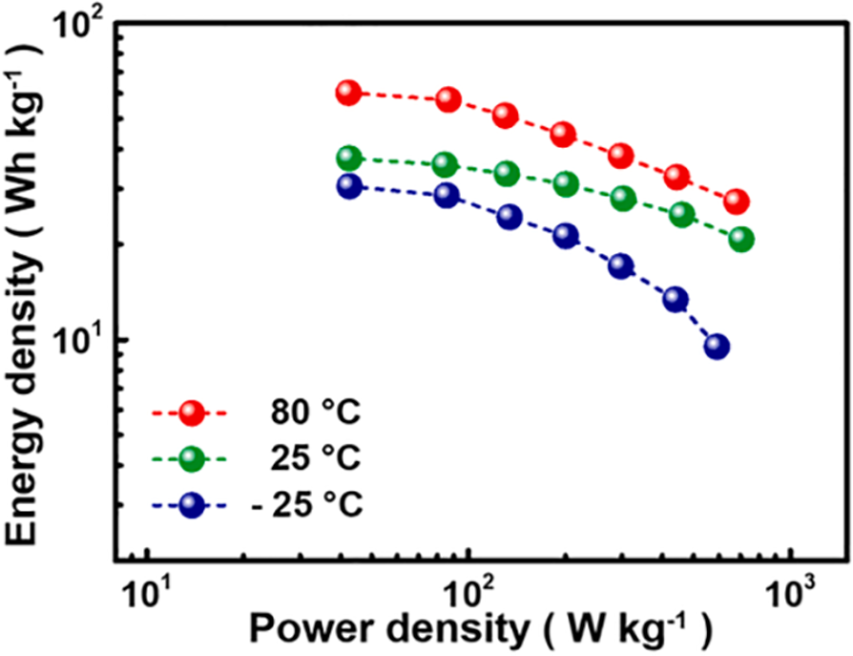
Figure 5: Ragone Plot related to temperature—Extracted from [52]
In a recently published literature review in the MDPI Batteries Journal [53] about the “Thermal Behaviors and Thermal Management Systems for Supercapacitors”, the authors state that, at present, lithium-ion batteries and supercapacitors are the two most extensively employed energy storage devices [54]. The same authors [53] reached conclusions that help us deepen the analysis of the thermal behaviour of supercapacitors, which are briefly mentioned in the following three paragraphs.
The temperature varies between various kinds of SC during the charging and discharging process. Therefore, several models have been derived to account for temperature changes. In practical situations, the appropriate model is selected to compute the temperature distribution by accuracy and calculation time. In addition, SC has been less studied in thermal runaway, concentrating on thermal failure, overcharge/over-discharge, and nail penetration tests.
Air cooling systems primarily employ airflow to alter capacitors’ surface temperature. Additional devices change the air flow rate, which influences heat dissipation. However, the forced air cooling system is constrained by the air duct design, making it impossible to guarantee temperature uniformity in capacitors. Liquid cooling systems require better sealing, with high demands on waterproofing, which is typically more complicated to devise than air cooling systems. In general, liquid cooling systems are relatively less researched in SC.
PCM (Phase Change Material) does not require additional energy consumption, thus suppressing the rise in the temperature of capacitors. Nevertheless, the low thermal conductivity of materials proves to be a problem. By adding an aluminium mesh to the PCM for capacitors and combining it with other thermal management systems, the heat between components is better transferred to decrease the capacitors’ temperature. Furthermore, with the relatively new usage of heat pipes in thermal management systems, there is a need to investigate further the potential of integrating heat pipes with active or passive cooling systems.
3.5 Comparison Points for Future Work
As stated before, this work aims to establish a dynamic list of factors used to compare energy storage systems (ESS), and the following topics can be included in future work due to their relevance, which are the following: (1) Current Source, (2) Energy Source, (3) Physical Aspects, (4) Charge/Discharge Time, (5) Charge/Discharge Limits, (6) Self-discharge Time, (7) Efficiency, (8) Life Cycle (Charge/Discharge Cycles), (9) Working Life Time, (10) Operational Risks, (11) Costs (€/W, €/Wh) and (12) Devices Association.
4.1 Scenario 1—Island’s PVS-Off-Grid
The Isolated Solar Power Plant with Batteries (off-grid) has several advantages, such as energy independence. It is recommended for remote locations or when consumers wish to be self-sufficient without depending on the electricity grid. Its operation is uninterrupted as long as adequate sizing and optimisation are carried out to provide energy even during periods of low sunlight or even outside the period of sunshine, as shown in the consumption profile purposely chosen for the simulations (Fig. 6).
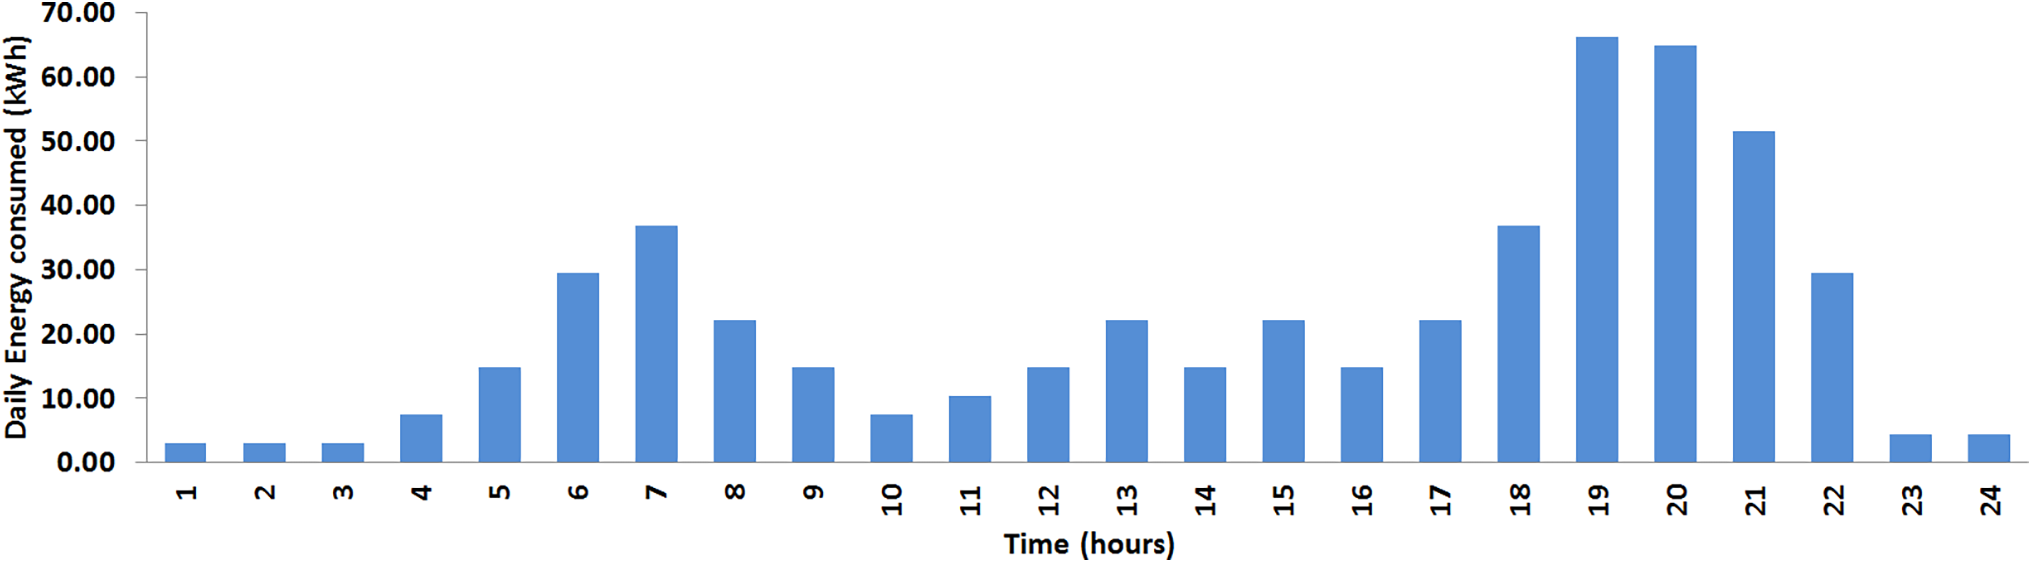
Figure 6: Daily energy consumption profile of islanders
This configuration is exempt from regulatory costs, such as transmission and distribution usage tariffs (such as TUSD—Distribution Services Usage Tariff, TUST—Transmission Services Usage Tariff) or changes in the compensation rules for energy injected/consumed on the grid. Among the disadvantages, we can mention the higher initial cost, as battery banks represent a significant portion of the initial investment (CAPEX).
The complete system can cost up to three times more than a grid-connected system, as shown below. Battery maintenance and life cycle are issues, as batteries have a limited useful life, generally between 5 and 10 years, with recurring replacement costs (higher OPEX). Energy efficiency in this configuration can be compromised due to charging/discharging time aspects of energy for storage, reducing overall efficiency. The hybrid use of supercapacitors, as mentioned, can mitigate this issue. The battery storage capacity to meet consumption profiles outside of the daytime period is another point of attention when sizing the battery bank, and here, we have an advantage when adopting the modelling, simulation and optimisation method.
The modelling of a hypothetical case of off-grid PVS on an Island allows the comparison of performance between batteries and supercapacitors and the feasibility analysis of the technical aspects of these energy storage solutions.
The island is located in Brazil (Fig. 7), in a river called Rio Verde, at a Longitude of 45°25′9″ W and Latitude of 21°36′19″ S degrees. It has an average altitude of 840 m and covers an area of 91,800 m². Customers demand the batteries’ energy daily, and their consumption habits peak at the beginning and end of the day. The energy simulated demand from the islanders is around 189.68 MWh/year.
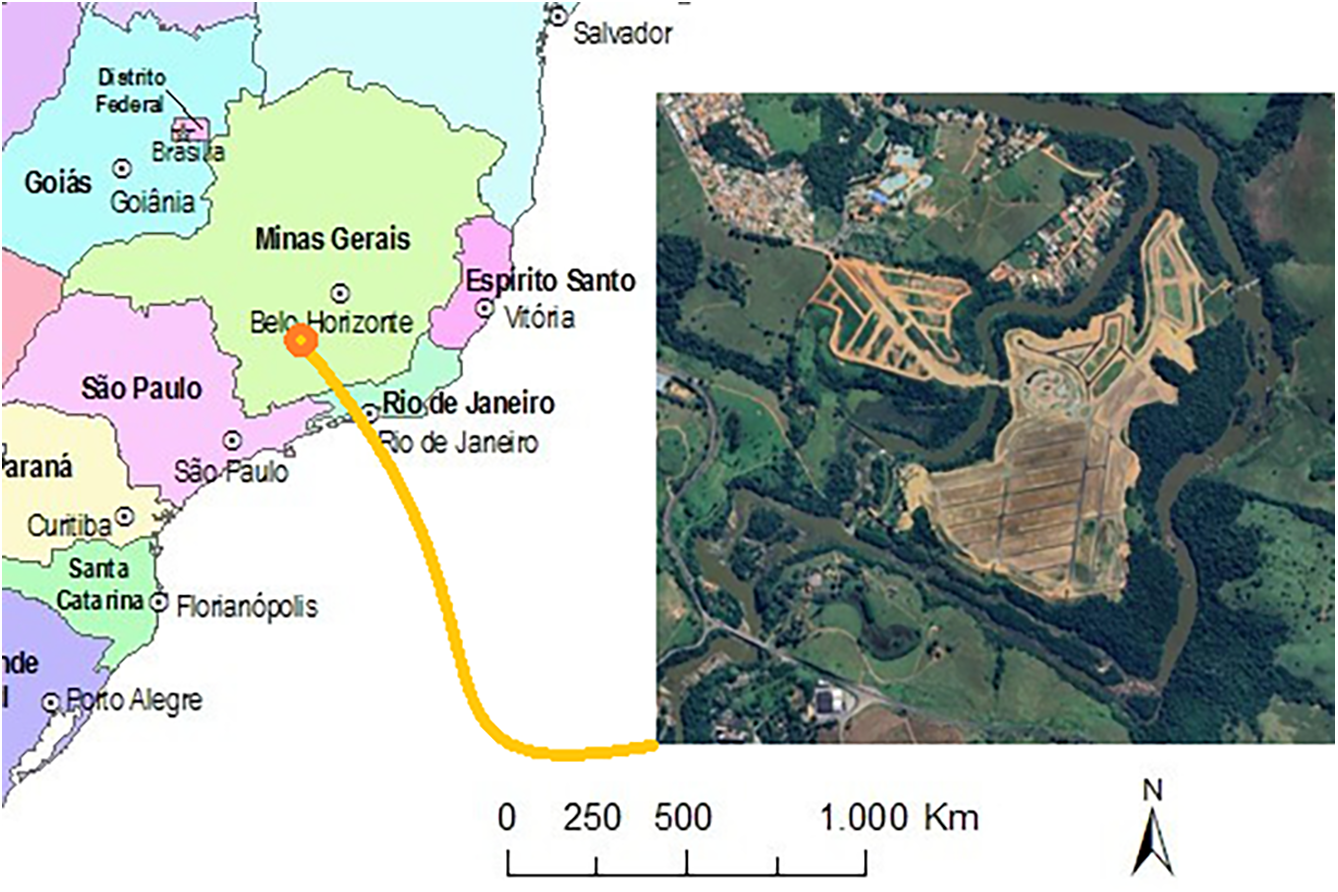
Figure 7: Island’s PVS-Ilha Grande-MG (Brazil)
Initially, the PVS model comprises 1056 solar panels with a power of 270 Wp and, therefore, with an installed power of 285.2 kW. The efficiency of the panels is 16.5%, and they have an area of 1.64 m² each, totalling 1728.46 m² of the area covered by the set of panels in a 3500 m² area reserved for the photovoltaic plant. This PVS initially contains 80 sets of batteries with a capacity of 270 Ah. Each set consists of two batteries, 25.6 V, and has a total energy storage capacity of 1.08 MWh.
Due to technical issues, the hourly insulation data for simulation, Energy Plus [20], were used about the location of Varginha-MG (Brazil), which is around 5 km from the island. Initial simulations, with the data mentioned, indicate the annual energy production capacity at 494.83 MWh, distributed by this way in MWh/Month, January 43.18, February 41.44, March 45.04, April 37.08, May 35.88, June 29.79, July 40.65, August 43.67, September 45.89, October 42.78, November 45.76, December 43.67, as shown below (Fig. 8).
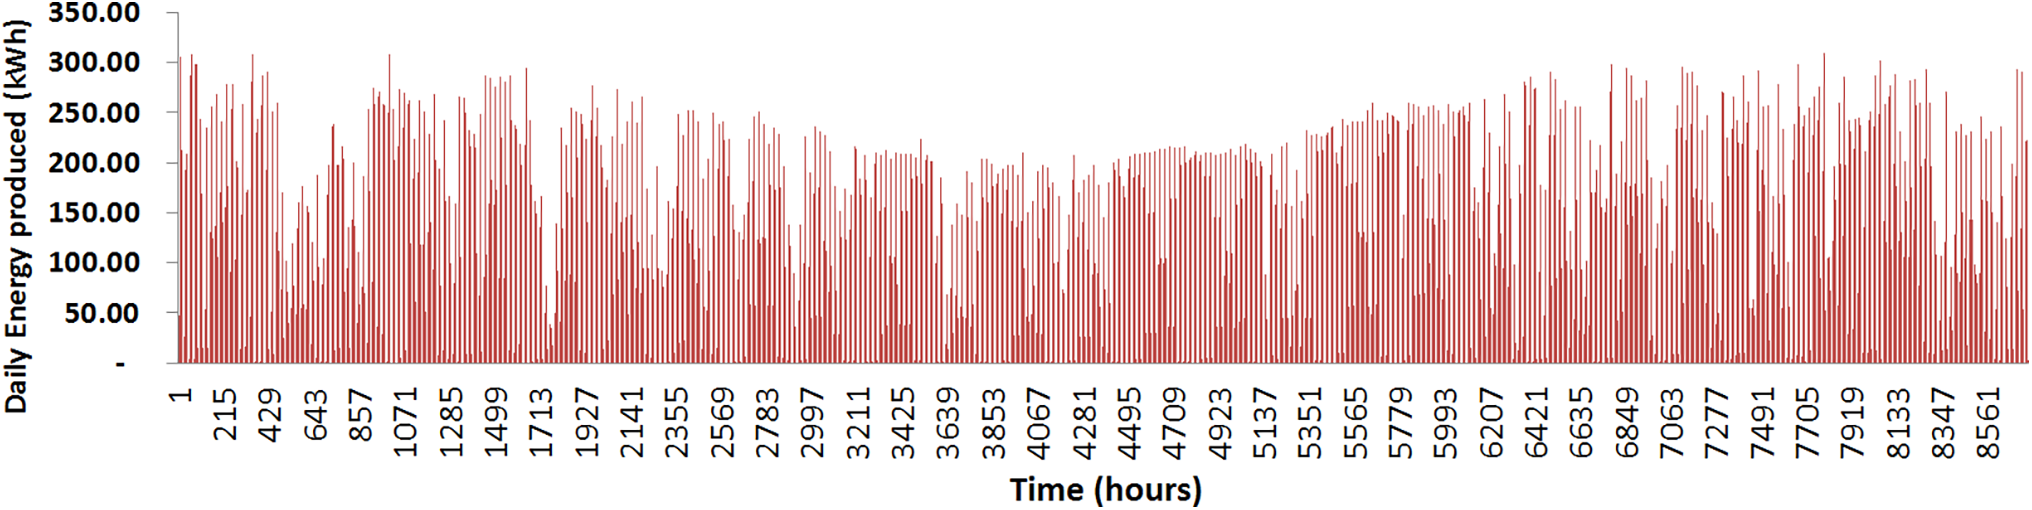
Figure 8: Simulated annual (8760 h) energy production of Island’s PVS (1056 Solar Panels)
From the 494.83 MWh produced annually, only 67.76 MWh matches with demand, and therefore 427.06 MWh are used to charge the batteries, which account for the complementary energy of 121.91 MWh of that total annual demand of 189.68 MWh. Therefore, the annual surplus with this set of 1056 panels, even after being directed to the batteries, remains 305.15 MWh, which would be the unused annual surplus. Fortunately, this is a hypothetical case that will be optimised below, as will be shown.
September had the highest energy production (45.89 MWh) (Fig. 9), and June had the lowest production (29.79 MWh) (Fig. 10).
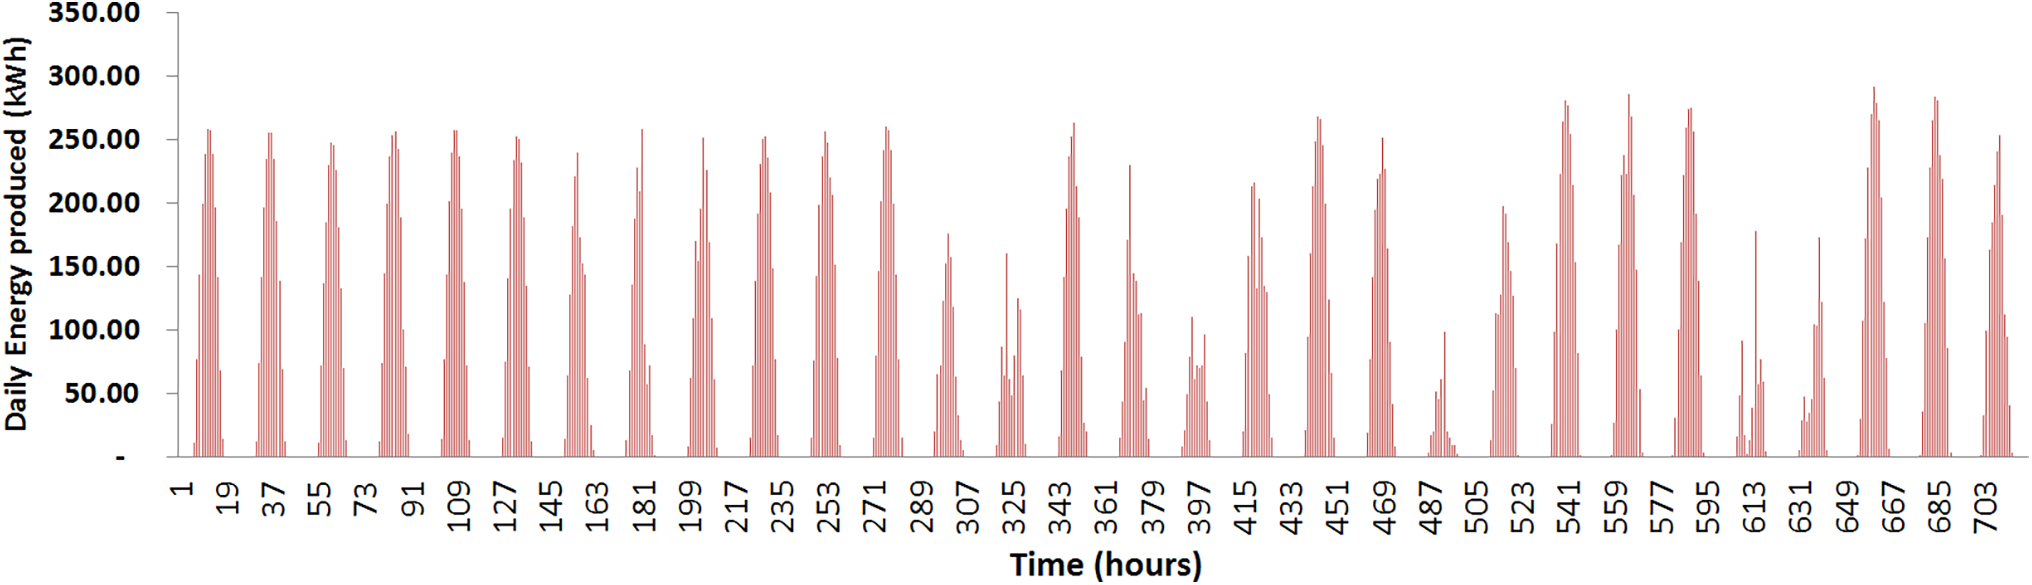
Figure 9: Simulated monthly (720 h) energy production of Island’s PVS (September/1056 Solar Panels)
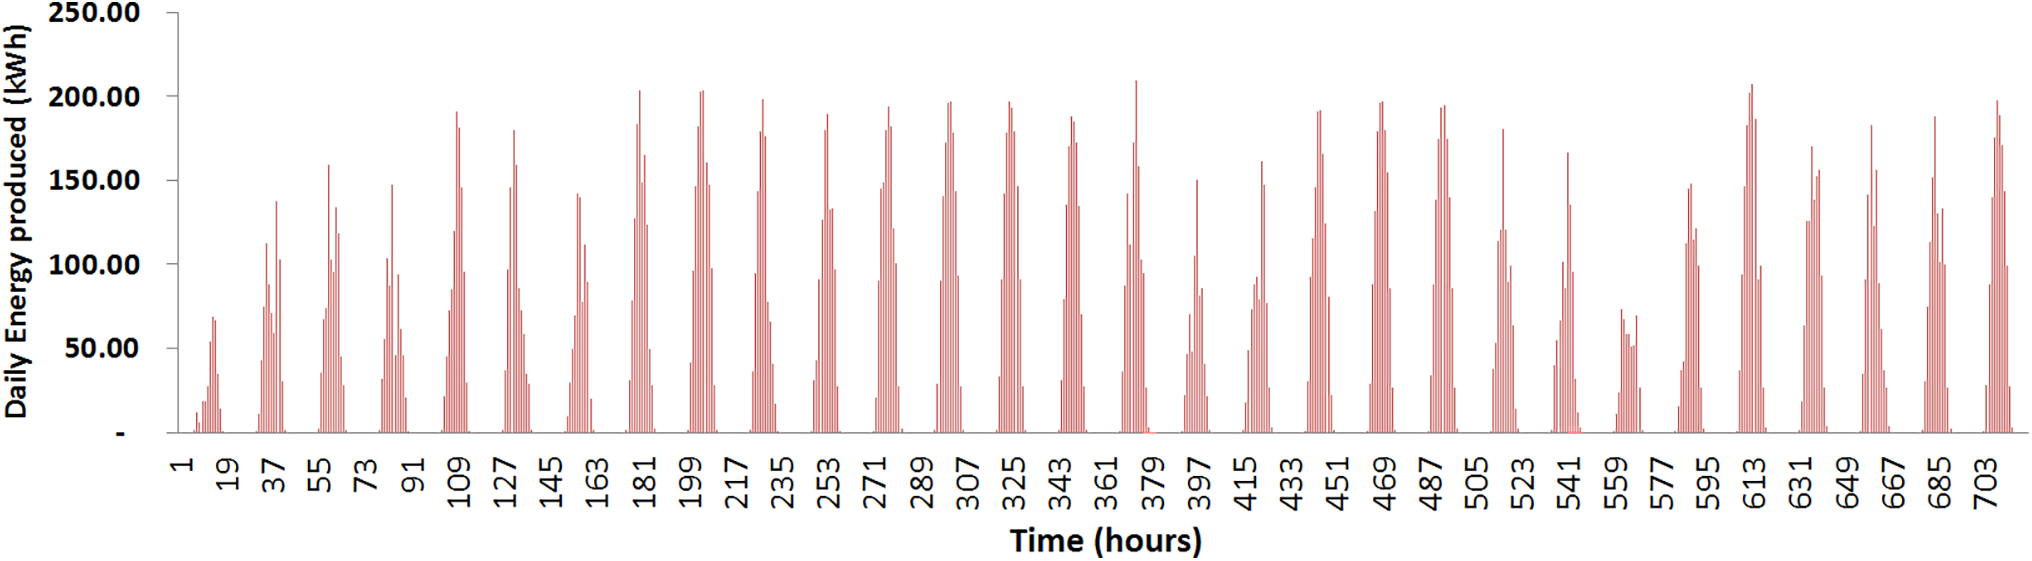
Figure 10: Simulated monthly (720 h) energy production of Island’s PVS (June/1056 Solar Panels)
Below (Fig. 11) is a typical day of production (January 03). As the profile of daily energy consumption compared to the energy production of the PVS demonstrates, it is important to observe the demand for the batteries here.
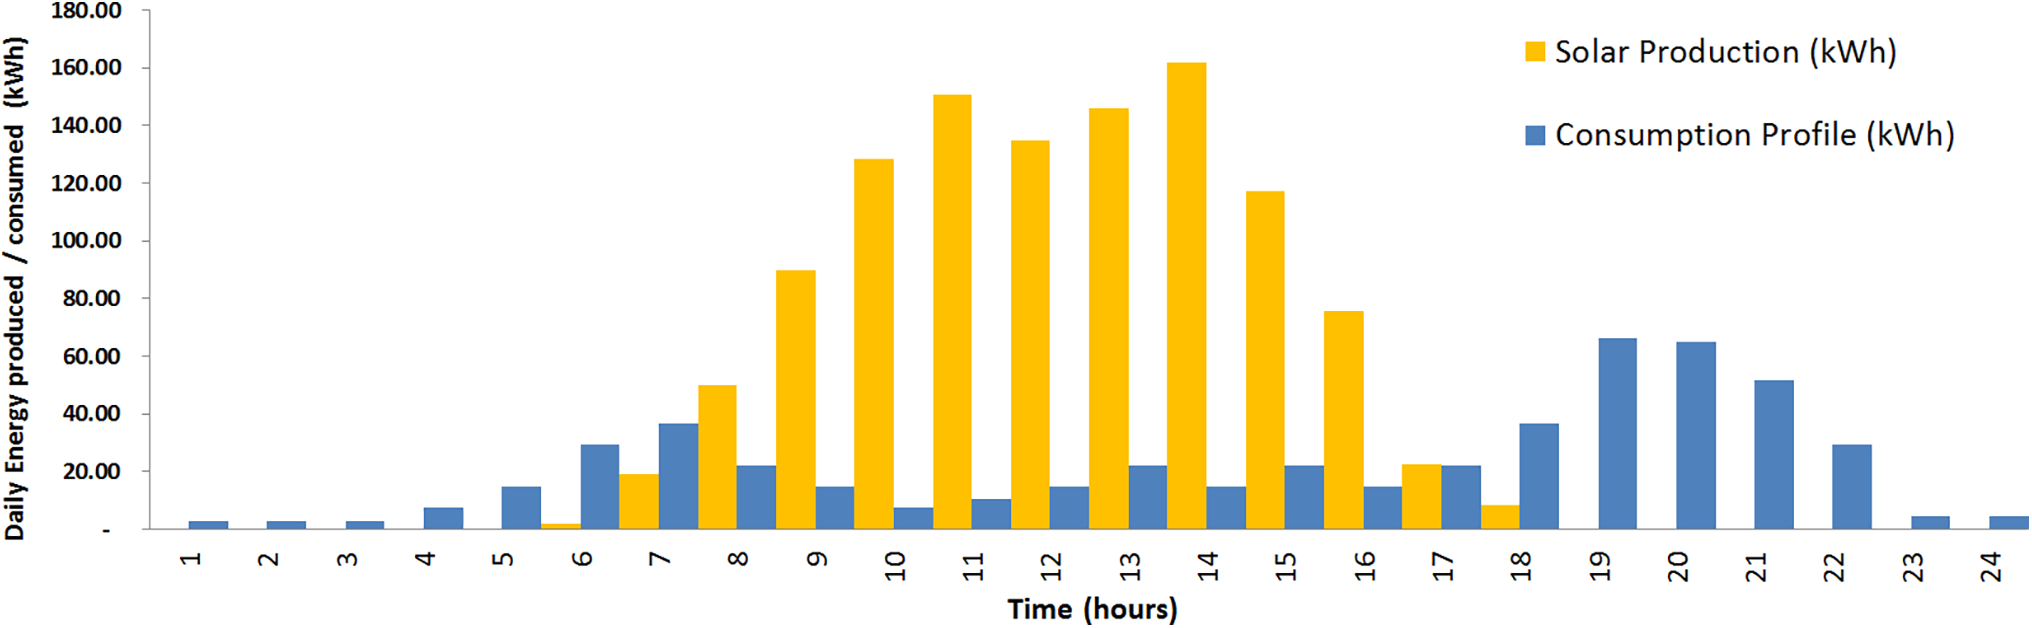
Figure 11: Simulated daily energy production (554 Solar Panels) and Consumption Daily Profile of PVS (January 03)
This case study clarifies the need for daily use of batteries and is limited to providing data on the amount of energy demanded from batteries (Fig. 11). By modelling this case, it is also possible to verify that the number of panels generates energy that could be stored, for example, in a Thermal Energy Store (TES), which can be combined with the use of HVAC in countries with a tropical climate, for cooling homes or food preservation or heating, depending on the local climate and the needs of the islanders.
In addition to the aspects discussed in the text referring to impediments such as fast discharge time, replacing batteries with supercapacitors is currently unfeasible due to the technical limitation of the number of supercapacitors that would be needed, as calculated below, assuming equalisation of the storage capacity of energy from the battery pack (1.08 MWh) with a set of supercapacitors.
The use of typical supercapacitors available at the market, as mentioned above, is Capacity = 3000 F, Voltage = 2.7 V and Energy Storage Capacity = 3.04 Wh.
Considering only the energy storage aspect, without going into details about the need to adapt the voltage of the supercapacitor sets to the inverters installed in the PVS, the number of supercapacitors needed to supply the energy of 1.08 MWh would be 355,263 units.
Regarding the installed capacity of the PVS (also the capacity, model, and configuration of the inverters), the modelling allows optimising the number of photovoltaic panels based on the energy demand profile (Fig. 11) to reduce the energy surplus, meeting for example, the need for the project to be implemented in phases with lower initial investments.
Extending the consumption profile (Fig. 6) in the PVS model from a daily perspective, 519.67 kWh, to a monthly average of 16,109.67 kWh and for an annual time frame, 189.68 MWh, it is possible to simulate the energy production and the installed capacity in order to reduce the surplus to the minimum without compromising the energy supply for the islanders.
Based on hourly insulation data (Energy Plus) and simulations of energy produced every hour over a year, with the hypothetical initial configuration of 1056 panels (Fig. 12a), compared to the island’s demand, it is possible to verify by extrapolation that 405 panels would be sufficient to meet the annual energy demand, which means a production of 189.77 MWh/year (Fig. 12c). However, according to the insulation data about the worst case, as mentioned above, it is prudent to consider the energy to be produced in June, which leads us to obtain the need for 554 panels capable of overcoming the production bottleneck and providing annual amount of energy of 259.59 MWh (Fig. 12b).
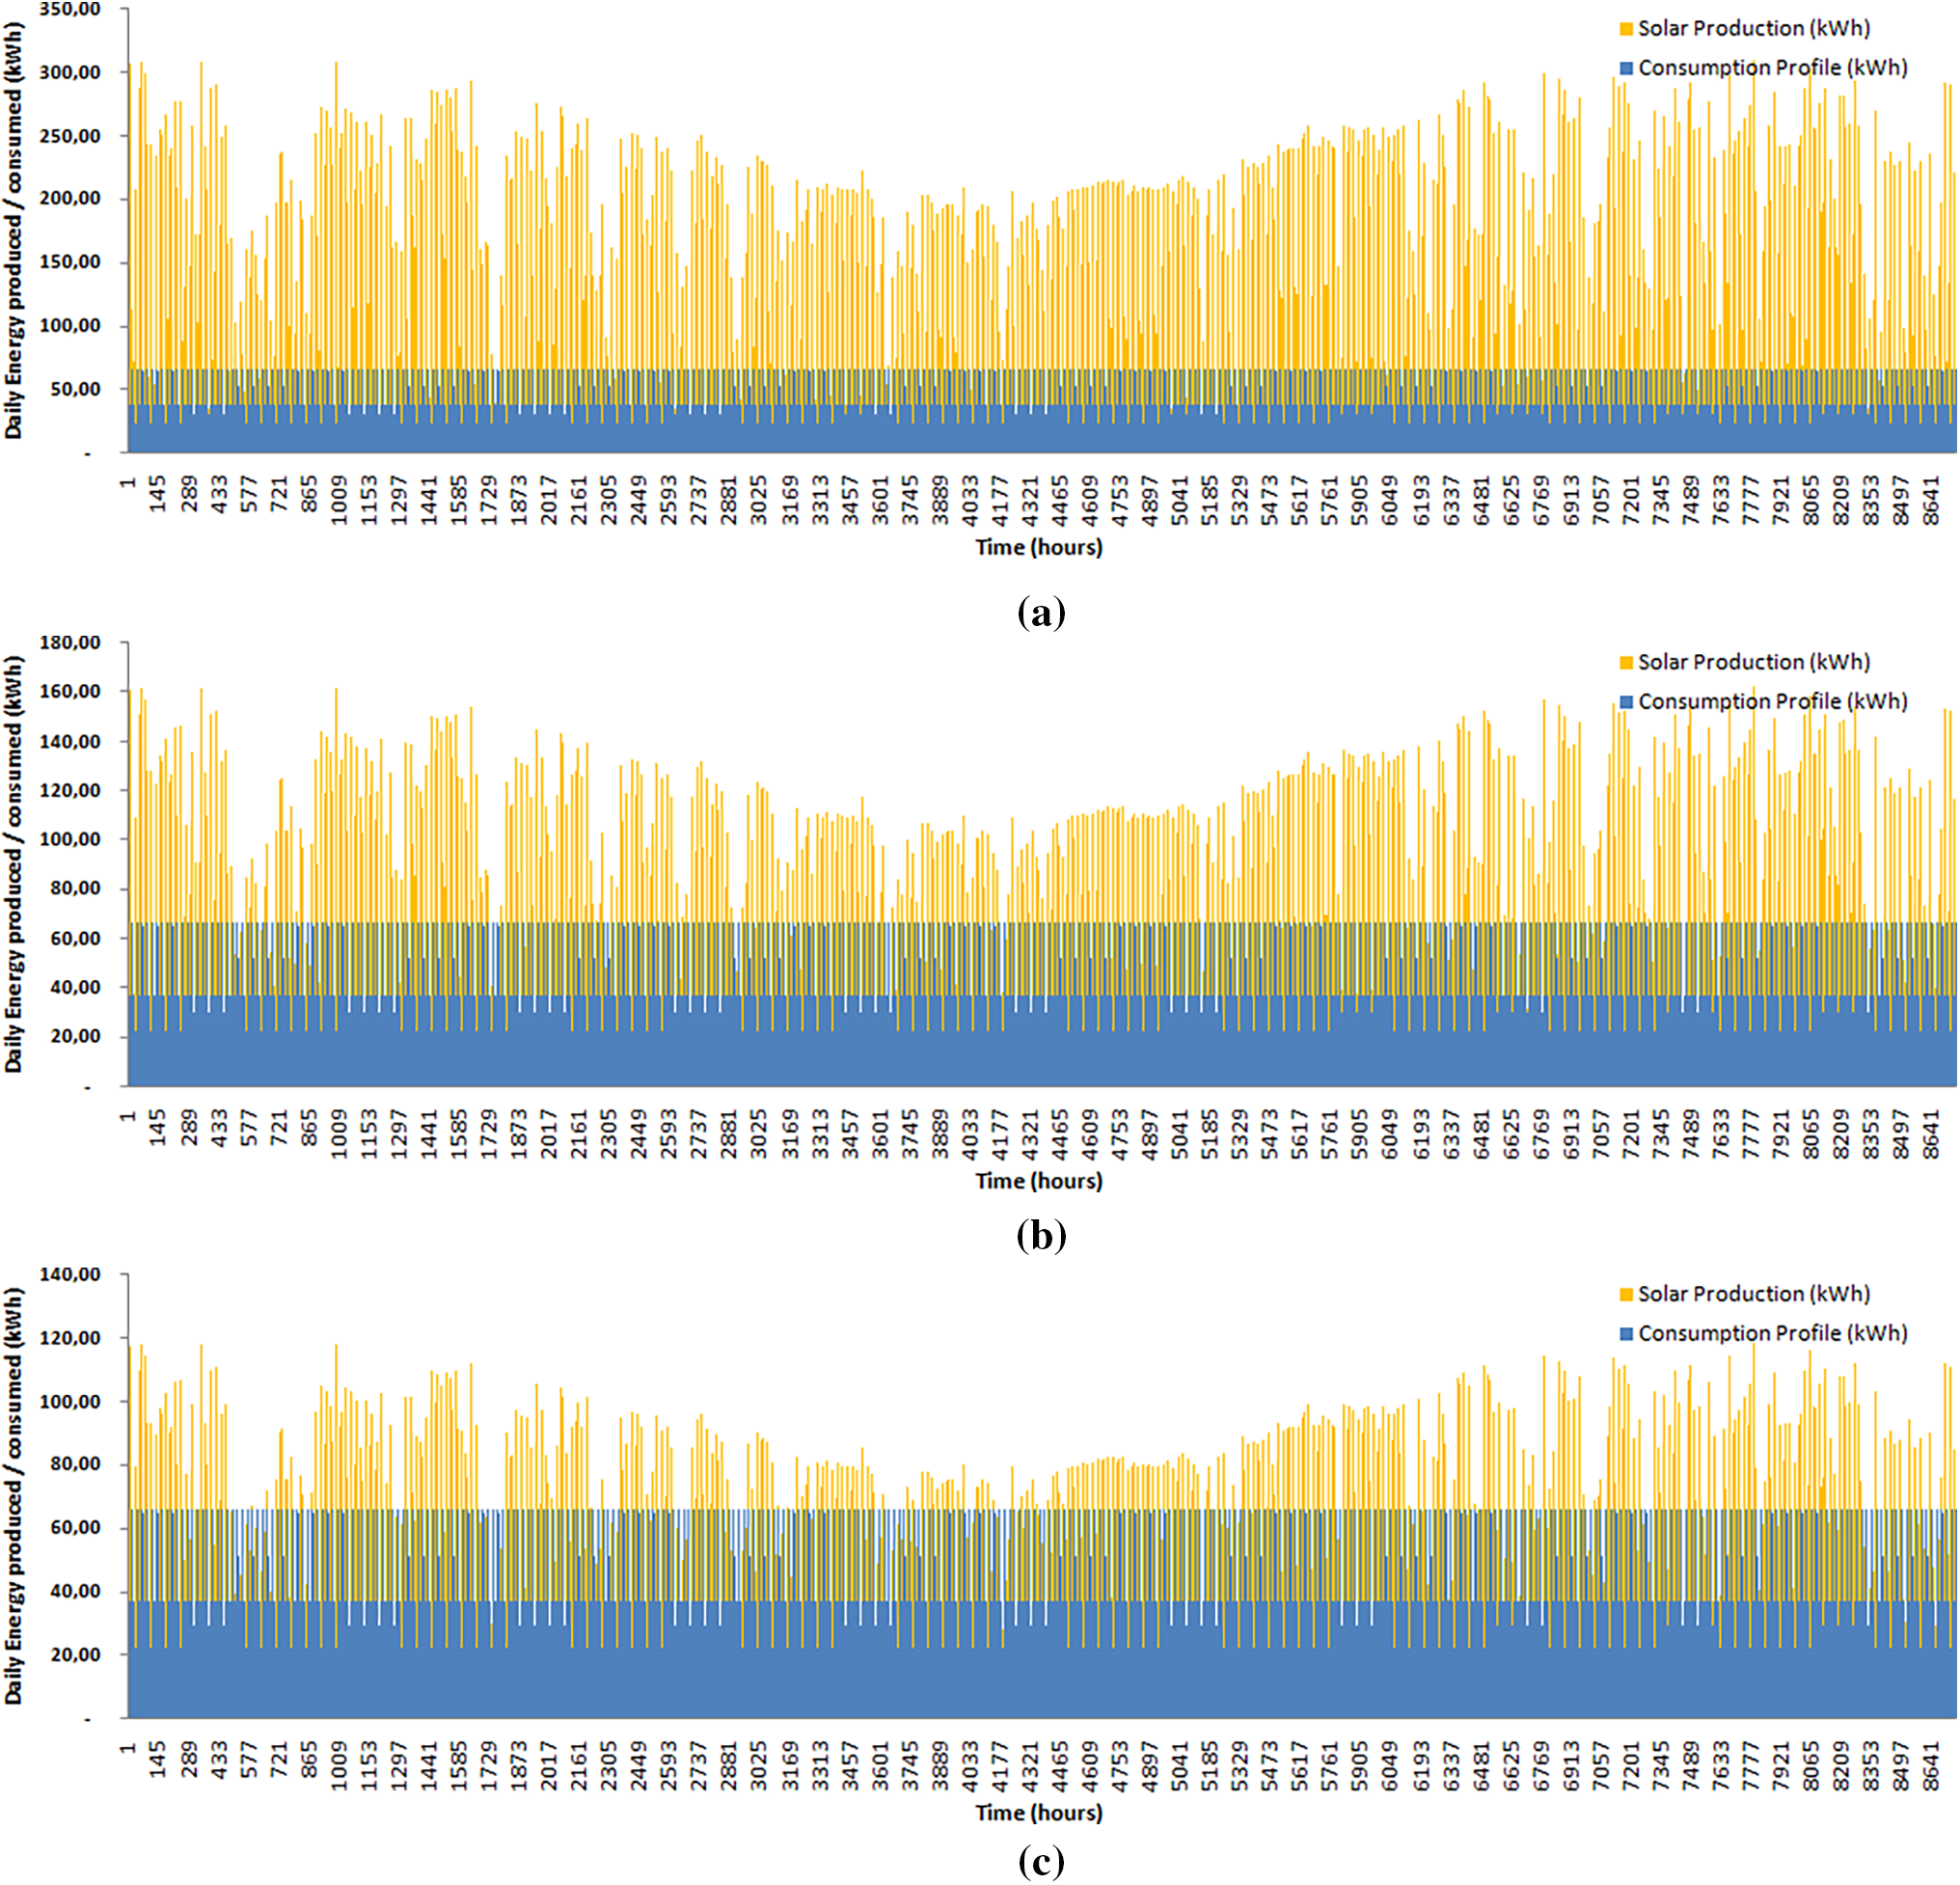
Figure 12: Off-grid-annual energy production of PVS vs. energy consumption profile of islanders. (a) 1056, (b) 554 and (c) 405 solar panels
The optimised Solar Power Plant (554 solar panels) produces 259.59 MWh annually, of which 62.11 MWh matches with demand. Therefore, 197.48 MWh are used to charge the batteries, which account for the complementary energy of 127.56 MWh of that total annual demand of 189.68 MWh. Even after being directed to the batteries, the annual surplus for this set of 554 panels remains 69.92 MWh, available for other consumption (Fig. 13). As mentioned above, some options exist for using this energy for an off-grid PVS.
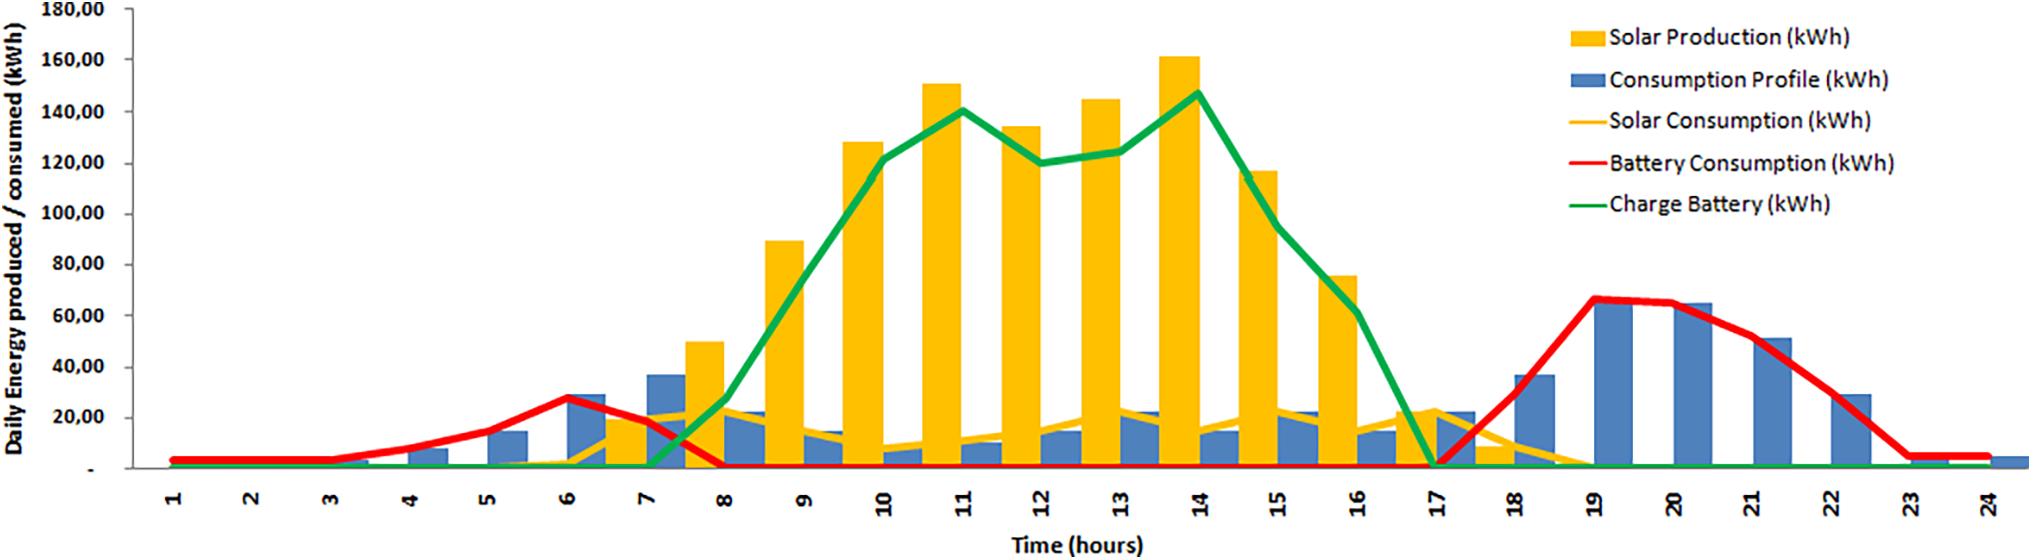
Figure 13: Off-grid-optimized PVS daily energy production (554 panels) and consumption daily profile of islanders (January 03)
Even if priority is given to sending the solar energy produced to charge the batteries, unlike what was done in the previous configuration, where priority was given to sending the energy directly to consumers, we will have that of the same 259.59 MWh produced annually, only 52.28 MWh will correspond to the demand of the users and, therefore, 207.31 MWh can be used to charge the batteries, of which 137.39 MWh will be consumed by the users of that total annual demand of 189.68 MWh. In other words, there will still be an annual surplus for this set of 554 panels of 69.92 MWh, which will be available for other consumption (Fig. 14).
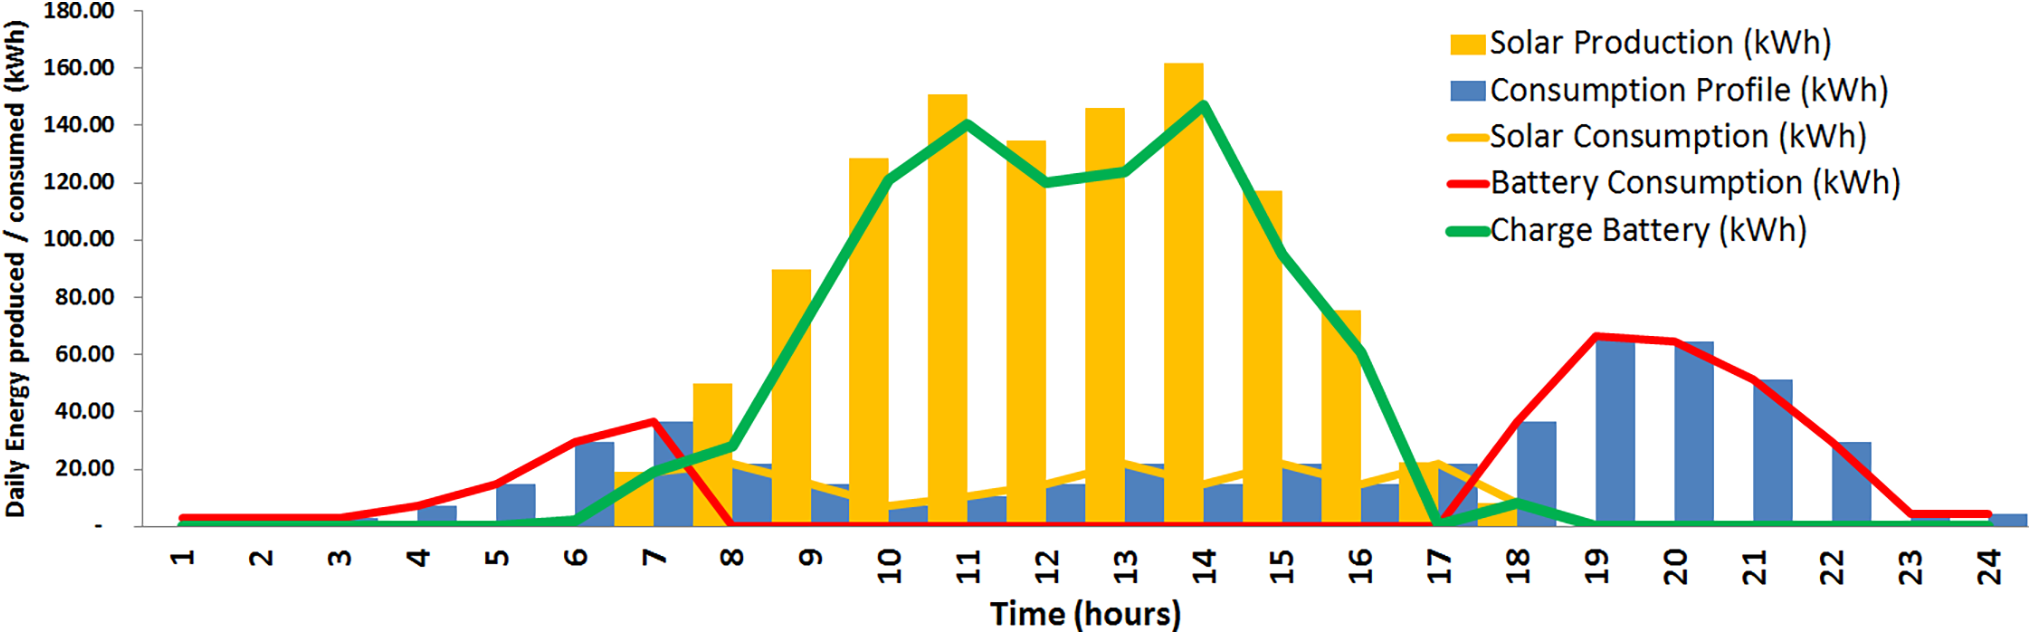
Figure 14: Off-grid-optimized PVS daily energy production (554 panels) and consumption daily profile of islanders (January 03)
In the following scenario, a similar PVS with the same energy demand will be shown; however, without batteries and connected to the grid, these most common configurations will be compared, that is, off-grid and on-grid.
Before continuing, it is important to highlight that with the optimisation of installed capacity and the possibility of hourly simulation of production and consumption data, the analysis of the new daily cycle allows us to verify that a smaller number of batteries can be used to meet demand.
The PVS was configured initially with 80 sets of batteries with a capacity of 270 Ah. Each set consists of two batteries, 25.6 V, with a total energy storage capacity of 1.08 MWh. After modelling and optimisation, it is possible to verify that in a daily cycle, the batteries will be demanded in 325.91 kWh/day and the solar will be demanded in 193.76 kWh/day in order to attend the typical daily demand of 519.67 kWh/day. Reminding that those 325.91 kWh/day will come from the PVS to recharge the batteries.
To meet the demand of 325.91 kWh/day, 24 sets of 270 Ah batteries would be needed, with two batteries of 25.6 V each, with a capacity of 331.77 kWh, however, in order to extend the useful life of batteries, a usage energy range between discharging up to 30% and charging up to 80% is a good practice [23]. In other words, we can consider using 50% of the battery capacity, which leads to 48 sets of 270 Ah batteries, which financially composes the CAPEX of Scenario 1, analysed in topic 5.
It is no less relevant to remember that the 554 plates, according to the simulations, can produce around 1105 kWh/day, which will meet both recharging the batteries with 325.91 kWh/day and the direct demand of consumers with 193.76 kWh/day. The daily surplus of 585.43 kWh/day remains, which has already been mentioned in the annual aspect, 69.92 MWh/year.
4.2 Scenario 2—Island’s PVS-On-Grid
This case study shows a similar PVS with the same energy demand; however, it will be without batteries and connected to the grid. Although this configuration presents some technical challenges, as mentioned by Li et al. [55] and Zhou et al. [56], it has been adopted in increasing numbers, mainly due to the attractive economic and financial return. The Brazilian rules for the connection and billing of micro generation and mini generation plants distributed in the National Electricity Distribution System, as well as the rules of the Electric Energy Compensation System, regulated by the ANEEL (Brazilian Electricity Regulatory Agency) are also a significant point of attention to the stakeholders [57].
Community solar farms (on-grid) have cost-efficiency as they take advantage of economies of scale, reducing installation and maintenance costs compared to individual systems. Furthermore, they avoid needing battery storage systems since the network is a backup. Another advantage is the possibility that governments and energy concessionaires have offered energy credits, where excess energy produced during the day is inserted into the grid, earning credits that can compensate for consumption in periods without sun. This configuration is more accessible for consumers who cannot install roof panels. Maintenance is centralised, and professionals carry out operations. The disadvantages include dependence on the grid, which can be vulnerable to grid outages, and dependence on utility policies regarding energy credits. Also, regulatory risks exist due to possible changes in net metering policies or tariffs that could affect the economic and financial returns mentioned.
According to the simulations, based on hourly insulation data (Energy Plus [20]), 405 panels would be sufficient to meet the annual energy demand, which means a production of 189.77 MWh/year, sufficient to meet the annual demand established by the consumption profile shown previously and also used in these on-grid simulations.
In this configuration, there is no need to overcome the June PVS production bottleneck, as the connection to the grid allows this greater monthly demand for energy from the grid to be compensated in another monthly cycle. In this way, the energy credits obtained tend to zero annually.
The simulation of annual generation compared to consumption allows us to obtain the optimised number of 405 panels for this new configuration and verify that the annual surplus will be 98.78 kWh, that is, 0.05% of the volume produced of 189.77 MWh (Fig. 15). The annual demand is 189.68 MWh.
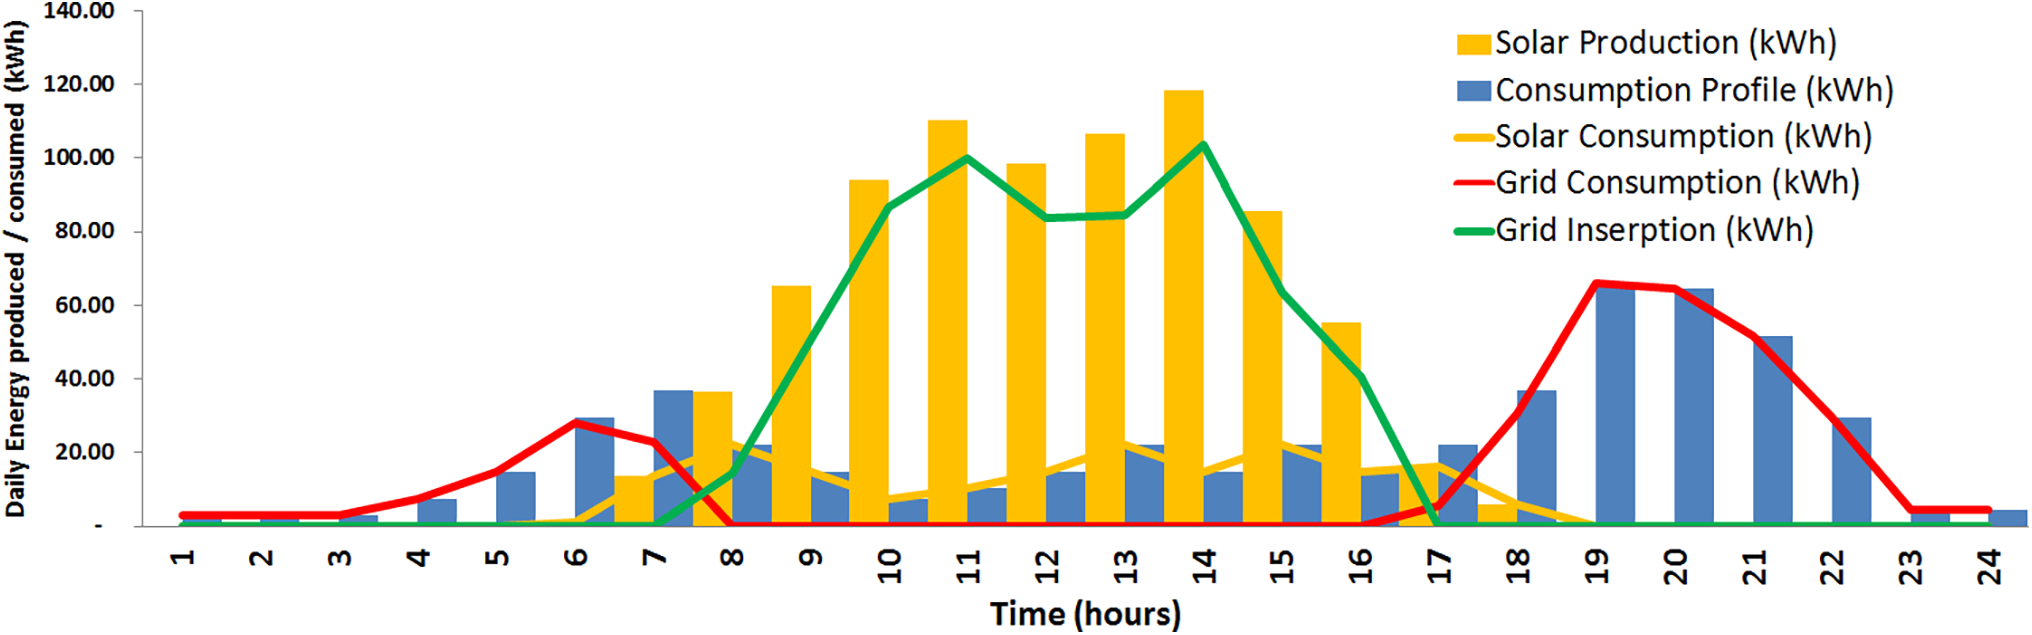
Figure 15: On-grid-optimized daily energy production energy (405 solar panels) and consumption daily profile of PVS (January 03)
Regarding the operational aspect of the Case Study (PVS of an Island), the initial simulations allowed the comparison of the energy generation profile of the PVS with the island’s consumption profile. However, there is a need for improvement in the detailed collection of data on solar irradiation and the electrical system (solar plates, inverters, batteries, transformers, distribution lines and energy metering of end users). However, the partial results of this study, with hourly simulations extended to the annual view, already demonstrate the potential for improvements that can be obtained, highlighting the surplus energy produced daily and seasonally.
5.1 Scenario 1—Island’s PVS-Off-Grid
The analysis of Scenario 1 demonstrates that the completely isolated solar plant configuration requires greater initial investments than Scenario 2. However, the payback is around 6 years (Fig. 16), considering an annual nominal discount rate of 7%, a typical value adopted by the Solar Industry [58]. The real discount rate, 3.38%, was calculated through Eq. (7), considering the Brazilian general energy price inflation as 3.50%.
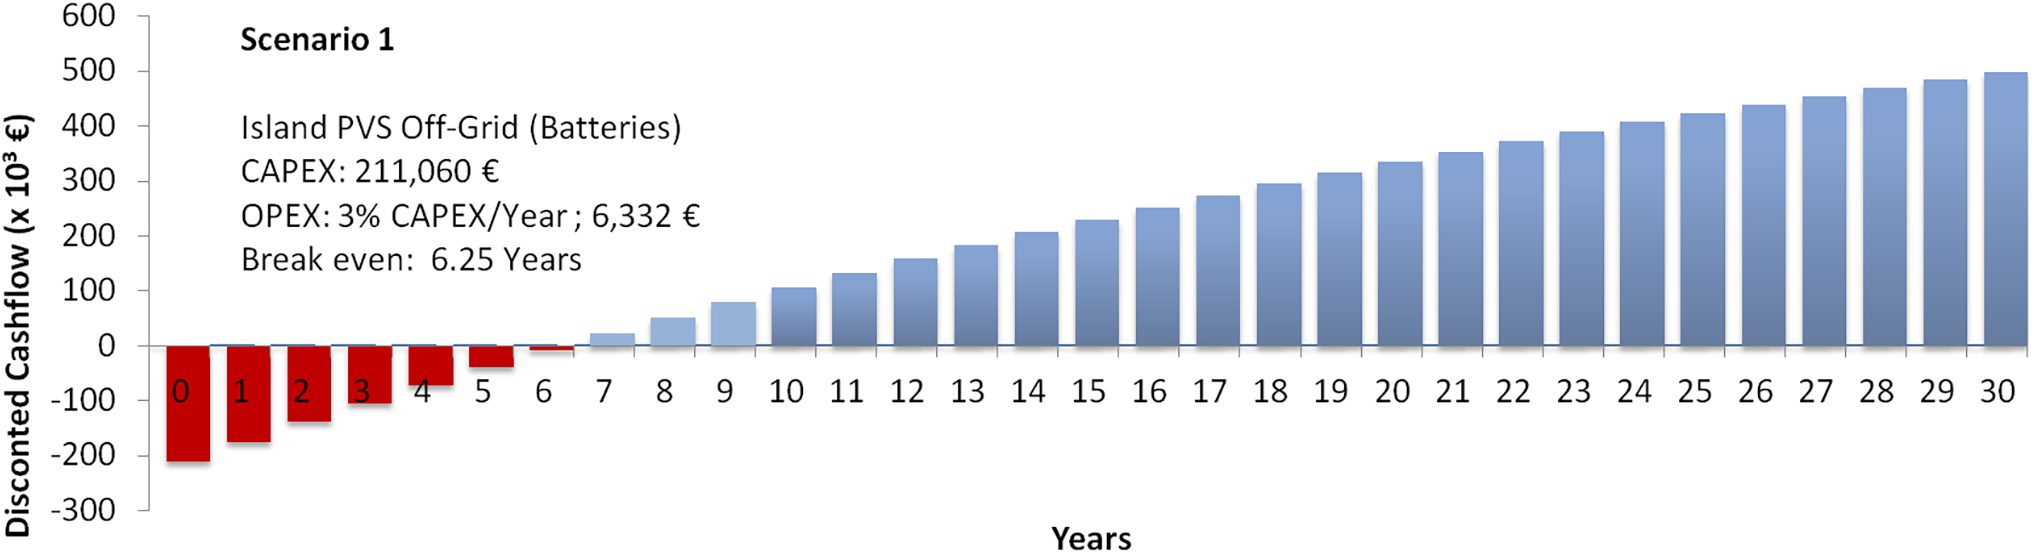
Figure 16: Off-Grid-Payback period (years)
The levelized cost of the energy produced (LCOE) over a 30-year timeframe is 0.068 Ȋ/KWh, which highlights the systems’ viability compared to the tariffs in the region adopted for the simulations. As shown in Eq. (6), the KWh for domestic consumers is around 0.17 €/KWh.
5.2 Scenario 2—Island’s PVS-On-Grid
The analysis of Scenario 2 demonstrates that the solar plant configuration connected to the grid requires lower initial investments and has a payback of around 3 years (Fig. 17), considering the same rates mentioned above in Scenario 1.
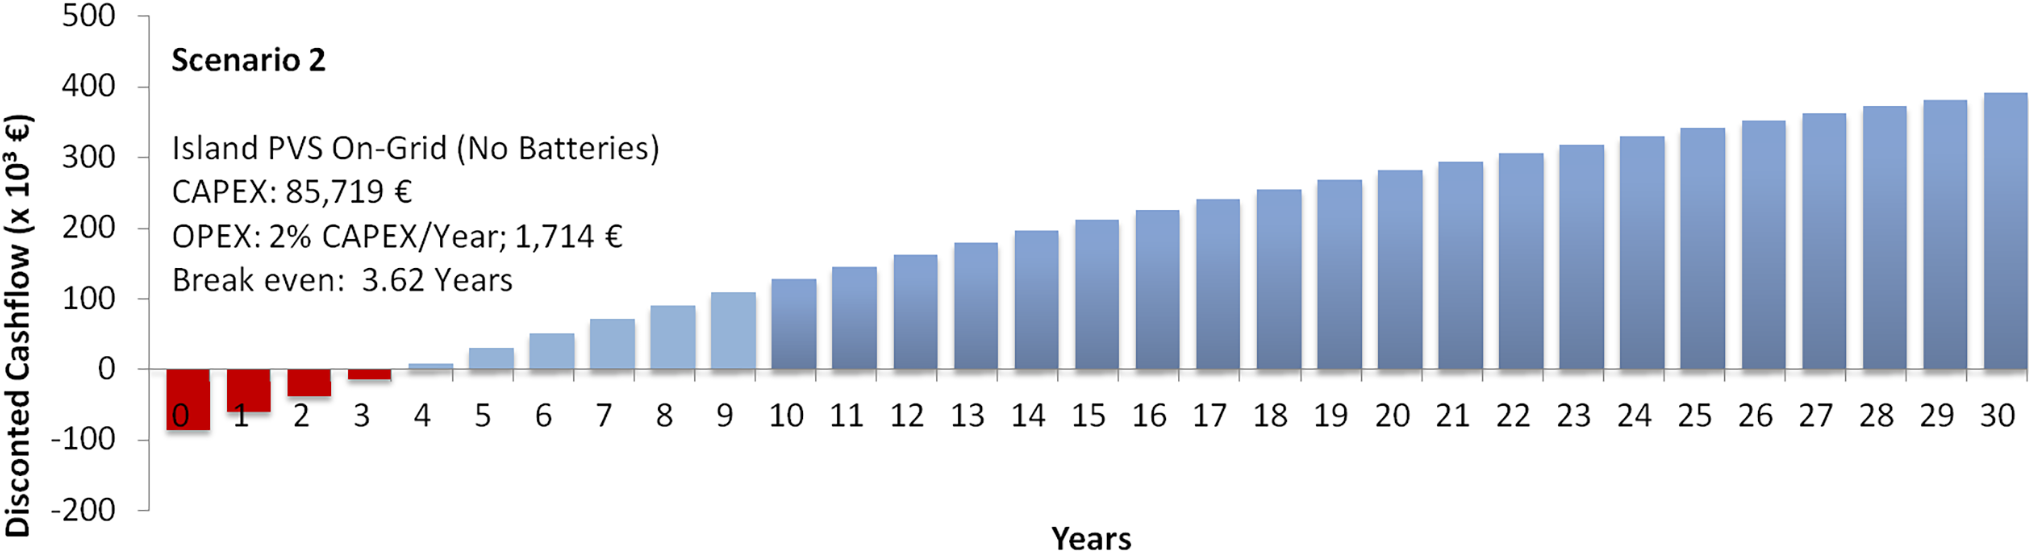
Figure 17: On-Grid-Payback period (years)
The levelized cost of the energy produced (LCOE) over a 30-year timeframe is 0.033 Ȋ/KWh, which highlights the viability of the systems compared to the tariffs in the region adopted for the simulations. The kWh for domestic consumers is around 0.17€/kWh, as shown in Eq. (6).
This study confirms batteries and supercapacitors distinct roles and potential complementarities in photovoltaic systems. Supported by the literature, it is clear that while supercapacitors demonstrate a specific power advantage, up to 100 times higher than batteries, the energy density of batteries remains 10 times superior in typical applications. These performance trade-offs underscore the practical benefits of hybrid energy storage systems (HESS), especially where fast response and long-duration storage are required.
The case study on the Brazilian island (Ilha Grande—MG) used an hourly-resolution model to simulate production and consumption profiles. Using Energy Plus [20] data for solar radiation and consumption estimates based on 4000 residents, we demonstrated the energy generation potential of a 554-panel configuration, optimised to reduce energy surplus while reliably meeting daily demand. This approach is consistent with best practices in energy modelling and has been used in prior literature on remote energy systems [59–62].
From a techno-economic standpoint, Scenario 1 (off-grid) requires a higher CAPEX, 211,060.97 €, primarily due to battery costs, with a payback of 6.25 years and an IRR of 17.88%, while Scenario 2 (on-grid) achieves a payback of 3.62 years and a higher IRR of 29.83% due to the elimination of storage costs and access to grid-based incentives. These figures align with real-world performance indicators from Brazilian energy investment funds, reinforcing the realism of our models. The value obtained for Scenario 2–On-grid in the hypothetical model is conservative. However, it is in line with values published by investors in Brazil, where they present in one of their publications the IRR values of 10 On-grid Photovoltaic Plants, which vary from 25.0% to 25.6%. These IRR values refer to the real estate fund SNEL11–SUNO ENERGIAS LIMPAS FII [63], which is a Suno Asset Real Estate Fund that invests in clean and renewable energies, traded on the São Paulo Stock Exchange (BOVESPA) under the code SNEL11.
The operation and maintenance annual costs (OPEX), around 3% of CAPEX, calculated at 6331.83 €;/Year, result in an NPV for this plant, in a 30-year timeframe, of 498,823.82 €. The payback (3.62 years) and an initial investment of Scenario 2, calculated in 85,719.81 €, and the annual operation and maintenance cost of around 2% of CAPEX, calculated in 1714.39 €Year, results in a VPN for this plant, in a 30-year timeframe, of 927,403.91 €.
The cash flow values shown above for the two scenarios also allow us to infer that the Return on Investment (ROI) in a 30-year timeframe is 236.34% and 457.22% for Scenarios 1 and 2, respectively. The annual ROI, on average, is 7.88% for Scenario 1 (off-grid) and 15.24% for Scenario 2 (on-grid).
Lastly, the environmental impact was quantified by comparing potential CO2 emission reductions. Based on regional benchmarks like the Abade Photovoltaic Plant, in São Bento Abade-MG, Brazil (21°32′28″ S 45°5′51.8″ W), with an installed capacity of 5 MWi and 7 MWp, that aims to reduce CO2 emissions into the atmosphere by 65,160 t in 25 years. To capture this amount of CO2 from the atmosphere, it would be necessary to have 812,865 trees. Making a linear conversion for the Photovoltaic Plant used in the model of this study, in this same region (21°36′19″ S 45°25′9″ W), for an installed capacity of 554 Solar Panels of 270 Wp, that is, 149.580 kWp, we would have an approximate reduction of 1670 t of CO2 emissions into the atmosphere in 30 years, equivalent to planting approximately 17,370 trees.
The findings of this study confirm the technical and financial viability of photovoltaic energy systems in isolated or grid-connected scenarios, with a particular focus on storage system selection. The comparative analysis of batteries and supercapacitors highlighted their complementary characteristics: batteries for sustained energy delivery and supercapacitors for high power bursts, consistent with findings in the broader literature on hybrid storage systems.
There is a consensus that supercapacitors and batteries are currently complementary. However, just as the notable evolution of solar panels was briefly demonstrated in the introduction to this work, there also seems to be plenty of space and willingness in academia to promote evolution in aspects that prevent supercapacitors from being used in more solutions for society today. The comparison parameters initially adopted in this work allowed for understanding some fundamental characteristics of the storage media studied. However, the parameters to be analysed in the continuation of this study should allow an adequate view of the State of the art of these two types of storage, as well as the possibilities of evolution in every aspect.
The proposed simulation and optimisation model, which used hourly solar radiation and load data, increased reliability and accuracy in determining storage needs and solar panel sizing. By optimising the system to 554 panels, the off-grid scenario reduced unnecessary energy surplus while still meeting all energy demands. This approach can inform similar projects across tropical and semi-urban settings, not only in the aspects of generation, storage and daily energy consumption but also in the seasonal storage of surplus energy and its use with a focus on energy efficiency.
From a financial perspective, both the off-grid and on-grid configurations were found to be profitable. However, on-grid solutions provide superior investment returns, with lower LCOE (€0.033/kWh) and faster ROI, aligning with national investor benchmarks such as SNEL11, also aligned with technical-financial reports from IEA (International Energy Agency) [21] and IRENA (International Renewable Energy Agency) [64,65].
The positive difference between the adopted annual nominal discount rate, 7%, which can also be called the Minimum Attractiveness Rate (MAR) and the Internal Rate of Return (IRR) of Scenarios 1 and 2, 17.88% and 29.83%, respectively, is evident. It demonstrates the viability and attractiveness of these investments. This factor is one of the drivers of the various Solar Power Plant projects emerging in Brazil, especially in this region.
Furthermore, the environmental benefits of deploying a well-designed PVS are substantial. Over its 30-year lifecycle, the optimised system can prevent over 1600 t of CO2 emissions, contributing directly to climate goals and enabling carbon offset comparable to tens of thousands of trees.
In conclusion, the study reinforces the role of data-driven modelling and hybrid storage strategies in the transition toward clean energy in remote or semi-urban areas. The dynamic framework proposed can guide future system design in technical terms and with strong financial and environmental validation.
Acknowledgement: The authors would like to thank the Environmental Engineering Program of the Federal University of Rio de Janeiro–UFRJ (Brazil), the Faculty of Engineering and Architecture of the Peruvian Union University–UPU (Peru), and the Department of Mechanical Engineering of the University Rovira i Virgili–URV (Spain) for their institutional support and collaboration throughout this research. The authors would like to acknowledge financial support from the Coordenação de Aperfeiçoamento de Pessoal de Nível Superior (CAPES) - Finance Code 001, Conselho Nacional de Desenvolvimento Científico e Tecnológico (CNPq), Fundação de Amparo à Pesquisa do Estado do Rio de Janeiro (Faperj) 2019-E-26/202.568/2019 (245653), and “Ministerio de Ciencia, Innovación y Universidades” of Spain [PID2021-123511OB-C33, MCIN/AEI/10.13039/501100011033/FEDER, EU].
Funding Statement: The authors would like to thank the financial support from: “Ministerio de Ciencia, Innovación y Universidades” of Spain (PID2021-127713OA-I00, PID2021-123511OB-C33, PID2021-124139NB-C22-CIN/AEI/10.13039/501100011033/FEDER, EU, TED2021-129851B-I00-/AEI/10.13039/501100011033/Unión Europea NextGenerationEU/PRTR and RED2022-134219-T); “Ministerio da Educação-MEC” of Brazil (CAPES PDPG-POSDOC 88887.807971/2023-00).
Author Contributions: The authors confirm their contribution to the paper as follows: study conception and design: Alex Ximenes Naves, Dieter Boer and Assed Haddad; data collection: Alex Ximenes Naves and Gladys Maquera; analysis and interpretation of results: Alex Ximenes Naves, Gladys Maquera, Dieter Boer and Assed Haddad; draft manuscript preparation: Alex Ximenes Naves. All authors reviewed the results and approved the final version of the manuscript.
Availability of Data and Materials: All data generated or analyzed during this study are included in this published article.
Ethics Approval: This research did not involve human participants or animals and did not require ethical approval per current guidelines or regulations.
Conflicts of Interest: The authors declare no conflicts of interest to report regarding the present study.
References
1. Gil A, Medrano M, Martorell I, Lázaro A, Dolado P, Zalba B, et al. State of the art on high temperature thermal energy storage for power generation. Part 1—concepts, materials and modellization. Renew Sustain Energy Rev. 2010;14(1):31–55. doi:10.1016/j.rser.2009.07.035. [Google Scholar] [CrossRef]
2. Ghosh S, Yadav R. Future of photovoltaic technologies: a comprehensive review. Sustain Energy Technol Assess. 2021;47(30):101410. doi:10.1016/j.seta.2021.101410. [Google Scholar] [CrossRef]
3. Dowling AW, Zheng T, Zavala VM. Economic assessment of concentrated solar power technologies: a review. Renew Sustain Energy Rev. 2017;72(10):1019–32. doi:10.1016/j.rser.2017.01.006. [Google Scholar] [CrossRef]
4. Singh GK. Solar power generation by PV (photovoltaic) technology: a review. Energy. 2013;53:1–13. doi:10.1016/j.energy.2013.02.057. [Google Scholar] [CrossRef]
5. Miller AI. Albert Einstein’s special theory of relativity; 1981. [Online]. [cited 2025 May 12]. Available from: https://link.springer.com/book/9780387948706. [Google Scholar]
6. Loferski JJ. The first forty years: a brief history of the modern photovoltaic age. Prog Photovolt Res Appl. 1993;1(1):67–78. doi:10.1002/pip.4670010109. [Google Scholar] [CrossRef]
7. Shockley W, Queisser HJ. Detailed balance limit of efficiency of p-n junction solar cells. J Appl Phys. 1961;32(3):510–9. doi:10.1063/1.1736034. [Google Scholar] [CrossRef]
8. Richter A, Hermle M, Glunz SW. Reassessment of the limiting efficiency for crystalline silicon solar cells. IEEE J Photovolt. 2013;3(4):1184–91. doi:10.1109/JPHOTOV.2013.2270351. [Google Scholar] [CrossRef]
9. Green MA. The path to 25% silicon solar cell efficiency: history of silicon cell evolution. Prog Photovolt Res Appl. 2009;17(3):183–9. doi:10.1002/pip.892. [Google Scholar] [CrossRef]
10. Green MA, Dunlop ED, Siefer G, Yoshita M, Kopidakis N, Bothe K, et al. Solar cell efficiency tables (version 61). Progress Photovoltaics. 2023;31(1):3–16. doi:10.1002/pip.3646. [Google Scholar] [CrossRef]
11. Zhou D, Liu Y, Wang X, Wang F, Jia Y. Research progress of photovoltaic power prediction technology based on artificial intelligence methods. Energy Eng. 2024;121(12):3573–616. doi:10.32604/ee.2024.055853. [Google Scholar] [CrossRef]
12. Wang Z, Ni F. Maximum power point tracking based on improved Kepler optimization algorithm and optimized perturb & observe under partial shading conditions. Energy Eng. 2024;121(12):3779–99. doi:10.32604/ee.2024.055535. [Google Scholar] [CrossRef]
13. Ye X, Tan F, Song X, Dai H, Li X, Mu S, et al. Modeling, simulation, and risk analysis of battery energy storage systems in new energy grid integration scenarios. Energy Eng. 2024;121(12):3689–710. doi:10.32604/ee.2024.055200. [Google Scholar] [CrossRef]
14. Yang J, Liu Y, Wang X, Xu S. Zero-carbon emission microgrid control based on photovoltaic battery-supercapacitor hybrid energy storage. In: 2023 International Conference on Smart Electrical Grid and Renewable Energy (SEGRE); 2023 Jun 16–19; Changsha, China: IEEE; 2023. p. 276–81. doi:10.1109/SEGRE58867.2023.00049. [Google Scholar] [CrossRef]
15. Wang Y, Wang L, Li M, Chen Z. A review of key issues for control and management in battery and ultra-capacitor hybrid energy storage systems. eTransportation. 2020;4(5):100064. doi:10.1016/j.etran.2020.100064. [Google Scholar] [CrossRef]
16. Christen T, Carlen MW. Theory of ragone plots. J Power Sources. 2000;91(2):210–6. doi:10.1016/S0378-7753(00)00474-2. [Google Scholar] [CrossRef]
17. Huang J, Huang Z, Wu Y, Liao H, Liu Y, Li H, et al. Optimal filter-based energy management for hybrid energy storage systems with energy consumption minimization. In: 2020 IEEE International Conference on Systems, Man, and Cybernetics (SMC); 2020 Oct 11–14; Toronto, ON, Canada: IEEE; 2020. p. 1822–7. doi:10.1109/smc42975.2020.9283163. [Google Scholar] [CrossRef]
18. Nambisan P, Khanra M. Optimal energy management of battery supercapacitor aided solar PV powered agricultural feed mill using Pontryagin’s minimum principle. IEEE Trans Power Electron. 2022;37(2):2216–25. doi:10.1109/TPEL.2021.3104347. [Google Scholar] [CrossRef]
19. Agharid AP, Permana I, Singh N, Wang F, Gustiyana S. Energy-efficient and cost-effective approaches through energy modeling for hotel building. Energy Eng. 2024;121(12):3549–71. doi:10.32604/ee.2024.056398. [Google Scholar] [CrossRef]
20. Energy Plu. Energy simulation software: weather data. [cited 2024 Mar 1]. Available from: https://energyplus.net/weather. [Google Scholar]
21. IEA. Levelised cost of electricity-LCOE calculator; 2020. [cited 2024 Feb 4]. Available from: https://www.iea.org/data-and-statistics/data-tools/levelised-cost-of-electricity-calculator. [Google Scholar]
22. Dell RM, Rand DAJ. Alkaline batteries. in: understanding batteries. Royal Soc Chem. 2001;126–42. doi:10.1039/9781847552228-00126. [Google Scholar] [CrossRef]
23. Linden D, Reddy T. Handbook of batteries. McGraw-Hill Education; 2001. [Online]. [cited 2025 May 12]. Available from: https://books.google.com.br/books?id=XquySsZp5jsC. [Google Scholar]
24. Dubal DP, Ayyad O, Ruiz V, Gómez-Romero P. Hybrid energy storage: the merging of battery and supercapacitor chemistries. Chem Soc Rev. 2015;44(7):1777–90. doi:10.1039/c4cs00266k. [Google Scholar] [PubMed] [CrossRef]
25. Noori A, El-Kady MF, Rahmanifar MS, Kaner RB, Mousavi MF. Towards establishing standard performance metrics for batteries, supercapacitors and beyond. Chem Soc Rev. 2019;48(5):1272–341. doi:10.1039/c8cs00581h. [Google Scholar] [PubMed] [CrossRef]
26. Conway BE. Electrochemical capacitors based on pseudocapacitance. In: Electrochemical supercapacitors. Boston, MA: Springer US; 1999. p. 221–57. doi: 10.1007/978-1-4757-3058-6_10. [Google Scholar] [CrossRef]
27. Kötz R, Carlen M. Principles and applications of electrochemical capacitors. Electrochim Acta. 2000;45(15–16):2483–98. doi:10.1016/S0013-4686(00)00354-6. [Google Scholar] [CrossRef]
28. Chmiola J, Yushin G, Gogotsi Y, Portet C, Simon P, Taberna PL. Anomalous increase in carbon capacitance at pore sizes less than 1 nanometer. Science. 2006;313(5794):1760–3. doi:10.1126/science.1132195. [Google Scholar] [PubMed] [CrossRef]
29. Kelly-Holmes H. Electro chemical capacitors. Advert As Multiling Commun. 2016;45:1–206. doi:10.1057/9780230503014. [Google Scholar] [CrossRef]
30. Sarangapani S, Tilak BV, Chen CP. Materials for electrochemical capacitors: theoretical and experimental constraints. J Electrochem Soc. 1996;143(11):3791–9. doi:10.1149/1.1837291. [Google Scholar] [CrossRef]
31. Sharma P, Kumar V. Study of electrode and electrolyte material of supercapacitor. Mater Today Proc. 2020;33:1573–8. doi:10.1016/j.matpr.2020.04.694. [Google Scholar] [CrossRef]
32. Da Silva LM, De Sousa LG, Vicentini R, Aguiar JP, Doubek G, Zanin H. Proposal of a novel methodology for the electrochemical characterization of well-behaved redox-active materials used in supercapacitors. Electrochim Acta. 2023;457:142458. doi:10.1016/j.electacta.2023.142458. [Google Scholar] [CrossRef]
33. Bhat TS, Patil PS, Rakhi RB. Recent trends in electrolytes for supercapacitors. J Energy Storage. 2022;50:104222. doi:10.1016/j.est.2022.104222. [Google Scholar] [CrossRef]
34. ACS Material. Advanced chemicals supplier; 2024. [cited 2024 Oct 3]. Available from: https://www.acsmaterial.com/porous-carbon.html. [Google Scholar]
35. Gamby J, Taberna PL, Simon P, Fauvarque JF, Chesneau M. Studies and characterisations of various activated carbons used for carbon/carbon supercapacitors. J Power Sources. 2001;101(1):109–16. doi:10.1016/S0378-7753(01)00707-8. [Google Scholar] [CrossRef]
36. Frackowiak E, Béguin F. Carbon materials for the electrochemical storage of energy in capacitors. Carbon N Y. 2001;39(6):937–50. doi:10.1016/S0008-6223(00)00183-4. [Google Scholar] [CrossRef]
37. Pandolfo AG, Hollenkamp AF. Carbon properties and their role in supercapacitors. J Power Sources. 2006;157(1):11–27. doi:10.1016/j.jpowsour.2006.02.065. [Google Scholar] [CrossRef]
38. Simon P, Burke A. Nanostructured carbons: double-layer capacitance and more. Electrochem Soc Interface. 2008;17(1):38–43. doi:10.1149/2.f05081if. [Google Scholar] [CrossRef]
39. Pan H, Li J, Feng Y. Carbon nanotubes for supercapacitor. Nanoscale Res Lett. 2010;5(3):654–68. doi:10.1007/s11671-009-9508-2. [Google Scholar] [PubMed] [CrossRef]
40. Helseth LE. Comparison of methods for finding the capacitance of a supercapacitor. J Energy Storage. 2021;35:102304. doi:10.1016/j.est.2021.102304. [Google Scholar] [CrossRef]
41. Munhoz MGdC. Compósito nanoestruturado de esferas de carbono poroso sobre feltro de fibra de carbono para eletrodos de supercapacitores; 2020. [Online]. [cited 2025 May 12]. Available from: urlib.net/8JMKD3MGP7W/3E9NUHP. [Google Scholar]
42. Lobato B, Suárez L, Guardia L, Centeno TA. Capacitance and surface of carbons in supercapacitors. Carbon N Y. 2017;122:434–45. doi:10.1016/j.carbon.2017.06.083. [Google Scholar] [CrossRef]
43. Chanut N, Stefaniuk D, Weaver JC, Zhu Y, Shao-Horn Y, Masic A, et al. Carbon-cement supercapacitors as a scalable bulk energy storage solution. Proc Natl Acad Sci U S A. 2023;120(32):e2304318120. doi:10.1073/pnas.2304318120. [Google Scholar] [PubMed] [CrossRef]
44. pour Behzadi G, aval Fekri L, Kianfar E. Comparative studies of nanosheet-based supercapacitors: a review of advances in electrodes materials. Case Stud Chem Environ Eng. 2024;9:100584. doi:10.1016/j.cscee.2023.100584. [Google Scholar] [CrossRef]
45. Schneuwly A, Gallay R. Properties and applications of supercapacitors from the state-of-the-art to future trends. In: Proceeding PCIM 2000; 2000; Nuremberg, Germany. p. 1–10. [Google Scholar]
46. Yin Y, Liu Q, Zhao Y, Chen T, Wang J, Gui L, et al. Recent progress and future directions of biomass-derived hierarchical porous carbon: designing, preparation, and supercapacitor applications. Energy Fuels. 2023;37(5):3523–54. doi:10.1021/acs.energyfuels.2c04093. [Google Scholar] [CrossRef]
47. Asl MS, Hadi R, Salehghadimi L, Tabrizi AG, Farhoudian S, Babapoor A, et al. Flexible all-solid-state supercapacitors with high capacitance, long cycle life, and wide operational potential window: recent progress and future perspectives. J Energy Storage. 2022;50(1):104223. doi:10.1016/j.est.2022.104223. [Google Scholar] [CrossRef]
48. Maxwell Technologies. Ultracapacitor overview; 2024. [cited 2024 Oct 3]. Available from: https://maxwell.com/products/ultracapacitors/. [Google Scholar]
49. EATON. Supercapacitors; 2024. [cited 2024 Oct 3]. Available from: https://www.eaton.com/gb/en-gb/products/electronic-components/supercapacitors.html. [Google Scholar]
50. Kameya T, Takami H, Uddin J, Ghann W, Suzuki G, Katsuma H. Potential of energy storage and rapid charge system using electric double layer capacitors for the solar right rail. In: IEA SHC International Conference on Solar Heating and Cooling for Buildings and Industry; 2017; AbuDhabi, United Arab Emirates. p. 25–32. doi:10.18086/swc.2017.02.01. [Google Scholar] [CrossRef]
51. Zhao Y, Wang B, Wang S, Xu W, Ma G. Photovoltaic power generation power prediction under major extreme weather based on VMD-KELM. Energy Eng. 2024;121(12):3711–33. doi:10.32604/ee.2024.054032. [Google Scholar] [CrossRef]
52. Gong K, Lee H, Choi Y, Jung G, Keum K, Kim JW, et al. A flexible supercapacitor with high energy density and wide range of temperature tolerance using a high-concentration aqueous gel electrolyte. Electrochim Acta. 2024;475:143585. doi:10.1016/j.electacta.2023.143585. [Google Scholar] [CrossRef]
53. Zhou W, Liu Z, Chen W, Sun X, Luo M, Zhang X, et al. A review on thermal behaviors and thermal management systems for supercapacitors. Batteries. 2023;9(2):128. doi:10.3390/batteries9020128. [Google Scholar] [CrossRef]
54. Pomerantseva E, Bonaccorso F, Feng X, Cui Y, Gogotsi Y. Energy storage: the future enabled by nanomaterials. Science. 2019;366(6468):eaan8285. doi:10.1126/science.aan8285. [Google Scholar] [PubMed] [CrossRef]
55. Li K, Wei Y, Zhang J. Research on control strategy of DC microgrid based on linear active disturbance rejection control. In: 2024 IEEE 2nd International Conference on Power Science and Technology (ICPST); 2024 May 9–11; Dali, China: IEEE; 2024. p. 1348–53. doi:10.1109/ICPST61417.2024.10601865. [Google Scholar] [CrossRef]
56. Zhou Z, Chen Y, Dai W. Modeling the proposal of the simultaneous purchases and sales of electricity and gas for the energy market in a microgrid using the harmony search algorithm. Energy Eng. 2022;119(6):2681–709. doi:10.32604/ee.2022.021410. [Google Scholar] [CrossRef]
57. ANEEL. RESOLUÇÃO NORMATIVA ANEEL No 1.059; 2023. [cited 2024 Oct 3]. Available from: https://www2.aneel.gov.br/cedoc/pubren20231059.pdf. [Google Scholar]
58. Guaita-Pradas I, Blasco-Ruiz A. Analyzing profitability and discount rates for solar PV plants. a Spanish case. Sustainability. 2020;12(8):3157. doi:10.3390/su12083157. [Google Scholar] [CrossRef]
59. Fahmi MI, Rajkumar RK, Arelhi R, Isa D. Study on the effect of supercapacitors in solar PV system for rural application in Malaysia. In: 2015 50th International Universities Power Engineering Conference (UPEC); 2015 Sep 1–4; Stoke on Trent, UK: IEEE; 2015. p. 1–5. doi:10.1109/UPEC.2015.7339921. [Google Scholar] [CrossRef]
60. Costa TS, Villalva MG. Technical evaluation of a PV-diesel hybrid system with energy storage: case study in the tapajós-arapiuns extractive reserve, Amazon. Brazil Energies. 2020;13(11):2969. doi:10.3390/en13112969. [Google Scholar] [CrossRef]
61. Luerssen C, Wahed A, Reindl T, Miller C, Cheong KWD, Sekhar C. Energy storage for PV-driven air-conditioning for an off-grid resort—a case study. In: Proceedings of SWC2017/SHC2017; 2017 Oct 29–Nov 2; Abu Dhabi: International Solar Energy Society. p. 1–11. doi:10.18086/swc.2017.28.14. [Google Scholar] [CrossRef]
62. Stambaugh M, Zahnd A, Sturdivant R, Yeh J. Improving the utilization factor of islanded renewable energy systems. In: Proceedings of SWC2017/SHC2017; 2017 Oct 29–Nov 2; Abu Dhabi: International Solar Energy Society; 2017. p. 1–8. doi:10.18086/swc.2017.16.04. [Google Scholar] [CrossRef]
63. Suno ASSET. SNEL 11-SUNO ENERGIAS LIMPAS FII, SUNO ASSET; 2024. [cited 2024 Oct 10]. Available from: https://www.suno.com.br/asset/fundos/snel11/. [Google Scholar]
64. International Renewable Energy Agency. Renewable power generation costs in 2023; 2023. [cited 2025 May 12]. Available from: https://www.irena.org/Publications/2024/Sep/Renewable-Power-Generation-Costs-in-2023. [Google Scholar]
65. International Renewable Energy Agency. Renewable Capacity Statistics 2023; 2023. [Online]. [cited 2025 May 12]. Available from: www.irena.org. [Google Scholar]
Cite This Article
 Copyright © 2025 The Author(s). Published by Tech Science Press.
This work is licensed under a Creative Commons Attribution 4.0 International License , which permits unrestricted use, distribution, and reproduction in any medium, provided the original work is properly cited.
 Downloads
 Citation Tools