
 Submit a Paper
 Propose a Special lssue
 Open Access
ARTICLE

Transient Stability Assessment Model and Its Updating Based on Dual-Tower Transformer
1 Key Laboratory of Modern Power System Simulation and Control & Renewable Energy Technology, Ministry of Education (Northeast Electric Power University), Jilin, 132012, China
2 School of Electrical Engineering, Northeast Electric Power University, Jilin, 132012, China
3 State Grid Jilin Electric Power Co., Ltd., Siping Power Supply Company, Siping, 136000, China
* Corresponding Author: Nan Li. Email:
(This article belongs to the Special Issue: Emerging Technologies for Future Smart Grids)
Energy Engineering 2025, 122(7), 2957-2975. https://doi.org/10.32604/ee.2025.062667
Received 24 December 2024; Accepted 20 March 2025; Issue published 27 June 2025
 View Full Text
 Download PDF
Abstract
With the continuous expansion and increasing complexity of power system scales, the binary classification for transient stability assessment in power systems can no longer meet the safety requirements of power system control and regulation. Therefore, this paper proposes a multi-class transient stability assessment model based on an improved Transformer. The model is designed with a dual-tower encoder structure: one encoder focuses on the time dependency of data, while the other focuses on the dynamic correlations between variables. Feature extraction is conducted from both time and variable perspectives to ensure the completeness of the feature extraction process, thereby enhancing the accuracy of multi-class evaluation in power systems. Additionally, this paper introduces a hybrid sampling strategy based on sample boundaries, which addresses the issue of sample imbalance by increasing the number of boundary samples in the minority class and reducing the number of non-boundary samples in the majority class. Considering the frequent changes in power grid topology or operation modes, this paper proposes a two-stage updating scheme based on self-supervised learning: In the first stage, self-supervised learning is employed to mine the structural information from unlabeled data in the target domain, enhancing the model’s generalization capability in new scenarios. In the second stage, a sample screening mechanism is used to select key samples, which are labeled through long-term simulation techniques for fine-tuning the model parameters. This allows for rapid model updates without relying on many labeled samples. This paper’s proposed model and update scheme have been simulated and verified on two node systems, the IEEE New England 10-machine 39-bus system and the IEEE 47-machine 140-bus system, demonstrating their effectiveness and reliability.Graphic Abstract
Keywords
In recent years, the integration of new energy sources has introduced numerous power electronics into the power system, complicating grid structure and posing significant challenges to its safe, stable operation.
Data-driven transient stability assessment (TSA) methods, leveraging their powerful feature extraction and data processing capabilities, have been widely applied in the TSA of power systems, including methods such as support vector machine (SVM) [1,2], convolutional neural network (CNN) [3,4], and deep belief network [5,6]. However, these studies mainly focused on binary classification, neglecting the diverse instability modes, which include both aperiodic instability due to insufficient synchronous torque and oscillatory instability caused by factors like inadequate damping torque. In the case of aperiodic instability, the primary solutions involve tripping, reducing generator mechanical power, and maintaining system stability through excitation regulation [7]. In contrast, the main solutions for oscillatory instability involve activating power system stabilizers [8] or adding broadband damping controllers to flexible AC transmission systems devices to suppress oscillations [9]. The causes and countermeasures for these two instability modes differ. Therefore, traditional binary classification assessment methods fail to provide comprehensive and accurate decision support for power grid dispatchers, thereby increasing the safety risks of power grid operation. Against this background, conducting multi-class transient discrimination holds significant research importance.
Currently, compared to simple binary classification for discrimination, research on multi-class TSA is relatively scarce. Wang et al. [10] utilized a noise-resistant Gaussian process model to achieve discrimination among stable, critical, and unstable conditions. The Gaussian process model, which is established through probabilistic theory, demonstrates excellent performance in processing power data containing significant uncertainties and noise. Shi et al. [11] optimized a CNN model using stochastic gradient descent with warm restarts, enabling continuous refinement of extracted features to differentiate between stable, aperiodic instability, and oscillatory instability. Li et al. [12] utilized a fusion model combining XGBoost and decision trees to perform feature extraction, to distinguish between stable conditions and two types of unstable modes. Li et al. [13] refined the extraction of data features using three different deep-learning models for a more comprehensive assessment of various stability margins and instability degrees. Despite these studies having made preliminary progress in multi-class TSA research, they still face challenges when dealing with high-dimensional time-series data in power systems: The time dependence of multivariate variables embedded in high-dimensional power data reflects the evolution patterns of these variables over time, providing crucial information about the macroscopic system state. Meanwhile, the dynamic correlation among multivariate variables uncovers intrinsic links between different variables in the sequence, crucial for understanding interactions and influences within the power system. However, current research lacks full integration of power data’s global and local features and overlooks complete data extraction, limiting further enhancements in multi-class discrimination accuracy. Moreover, the aforementioned studies on multi-class TSA have not considered the biased tendency of the model caused by the issue of sample imbalance [14], which reduces the model’s discrimination accuracy for minority-class samples.
When the topology or operation mode of the power system changes, the performance of data-driven models tends to decline or even fail [15]. Retraining the model for a new system structure demands time and risks losing accumulated knowledge. Existing research findings can be broadly summarized into two categories: (1) Efforts are focused on achieving rapid model updates under the condition of limited samples in the target domain: Wang et al. [16] utilized the data inheritance method to retain original data information, allowing rapid model updates with minimal new samples. Zhou et al. [17] utilized active learning to screen high-value samples, allowing the model to achieve good evaluation performance based on only a restricted quantity of key samples. (2) Efforts are focused on expanding the number of training samples available for model updates, thereby enhancing the model’s evaluation performance: Zhan et al. [18] utilized an improved generative adversarial network to generate many samples with the same distribution, which are then merged with transfer samples from the source domain to fine-tune the model, effectively reducing the number of target domain samples required. Tang et al. [19] employed a method integrating sample and feature transfer to augment training samples for model updates at both levels. However, both of these solutions have limitations: Implementing model updates in the target domain with a small sample size may reduce update time, but it may lead to overfitting of the model, thereby limiting its generalization ability. Generating more available samples for model updates can improve model performance, but it will significantly increase the update time.
Given all the above concerns, this paper proposes a multi-class TSA method and a two-stage update scheme based on an improved Transformer model. The main contributions of the paper are highlighted as follows:
1. Addressing the issue of information completeness in model feature extraction, this paper proposes a dual-tower Transformer encoder network. This network comprehensively extracts features from both temporal and variable dimensions to enhance the accuracy of multi-class transient state classification. Additionally, to tackle the model bias caused by imbalanced samples, this paper introduces a hybrid sampling strategy based on sample boundaries, which addresses the issue of sample imbalance by increasing the number of boundary samples in the minority class and reducing the number of non-boundary samples in the majority class.
2. In response to the need for online model updates, this paper designs a two-stage update scheme based on self-supervised learning: In the first stage, self-supervised learning is employed to learn rich internal representations of unlabeled data, enhancing the model’s generalization performance during the transition period. In the second stage, a key sample selection mechanism is used to screen and annotate key samples, which are then utilized to optimize the model.
2 Feature Extraction Network Based on a Dual-Tower Transformer Encoder Model
When analyzing power system status using a data-driven model, the completeness and adequacy of feature extraction are crucial for determining model performance. Due to the topological interconnectivity among nodes in the power system, various physical quantities also have a certain correlation with each other. As time progresses, the interactions of these physical quantities evolve dynamically in intensity and pattern. Therefore, accurately extracting temporal dependence and dynamic correlations among multivariate variables is crucial in power data analysis. The Standard Transformer model, featuring its unique multi-head attention, focuses adaptively on high-value information [20]. So, it has been widely applied in multiple fields [21–23]. However, when processing time-series data, the standard Transformer only extracts the temporal dependence of multivariate variables, neglecting the dynamic correlation among them. Considering the limitations of the standard Transformer and the unique features of power data, this paper proposes a dual-tower Transformer encoder model, as shown in Fig. 1.
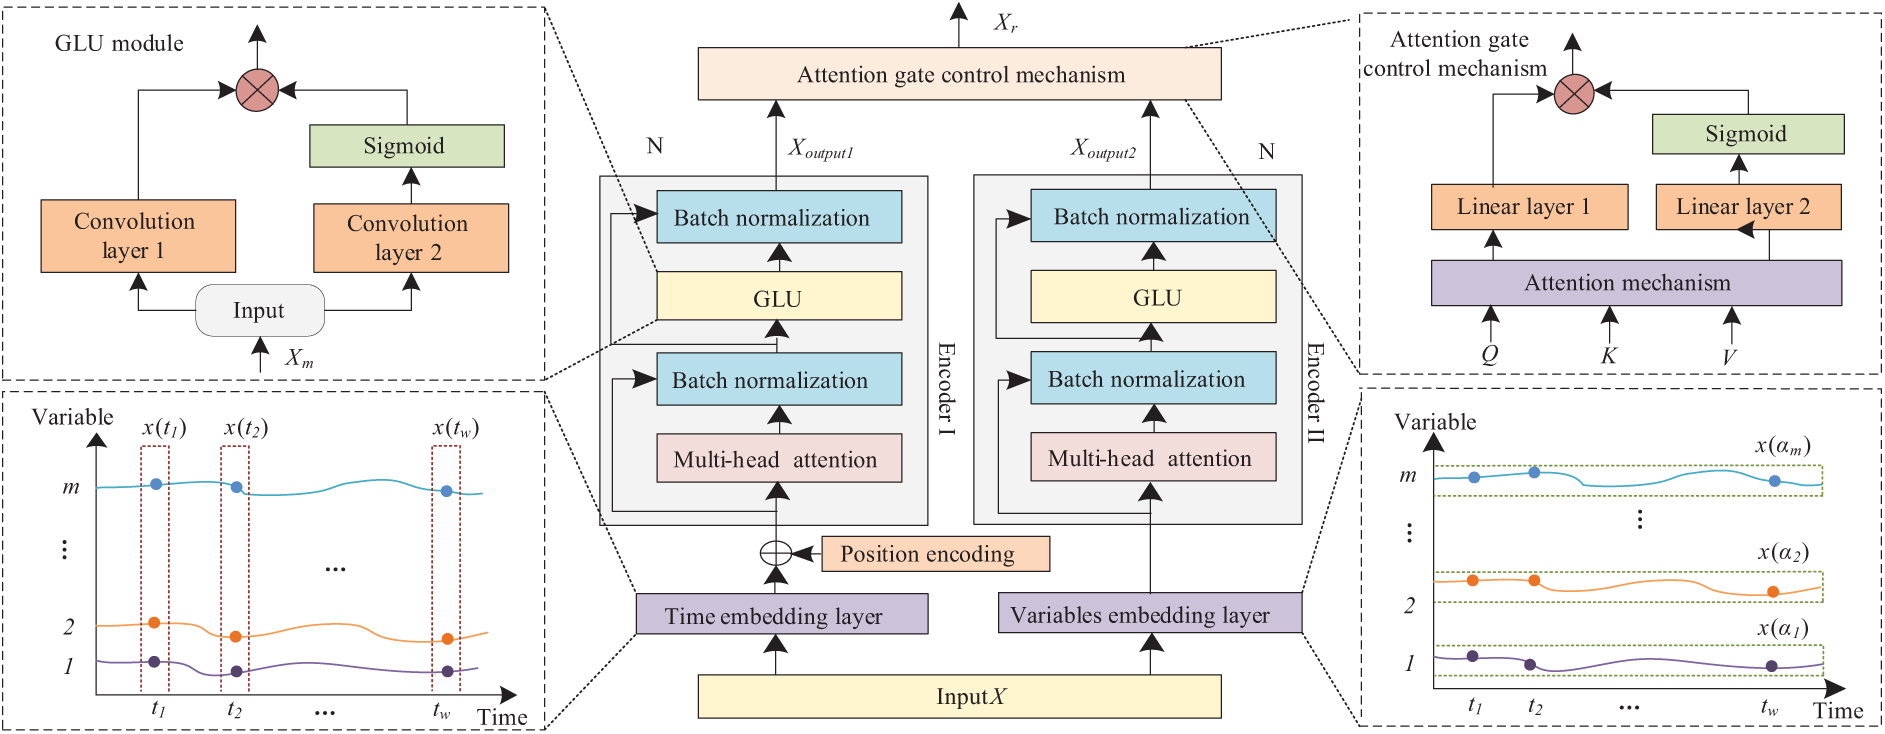
Figure 1: Dual-tower transformer encoder network
The feature extraction network is composed of two independent encoder structures connected in parallel through an attention-gate control mechanism. Encoder I is designed to focus on the temporal dependence of multivariate variables and deeply extract their evolutionary rules over time. Encoder II focuses on dynamic correlations between multivariate variables, revealing intrinsic relationships within the sequence. The attention gate control mechanism can adaptively allocate weight to the feature information of time and variable dimensions, and enhance the model’s sensitivity to important features, making the model have good interpretability. In addition, this paper uses the gated linear unit (GLU) to replace the feedforward neural network (FNN) for the nonlinear transformation of features, reducing the model’s computational overhead.
2.1 Parallel Embedding Layer Design
The input data
where
The output feature matrix
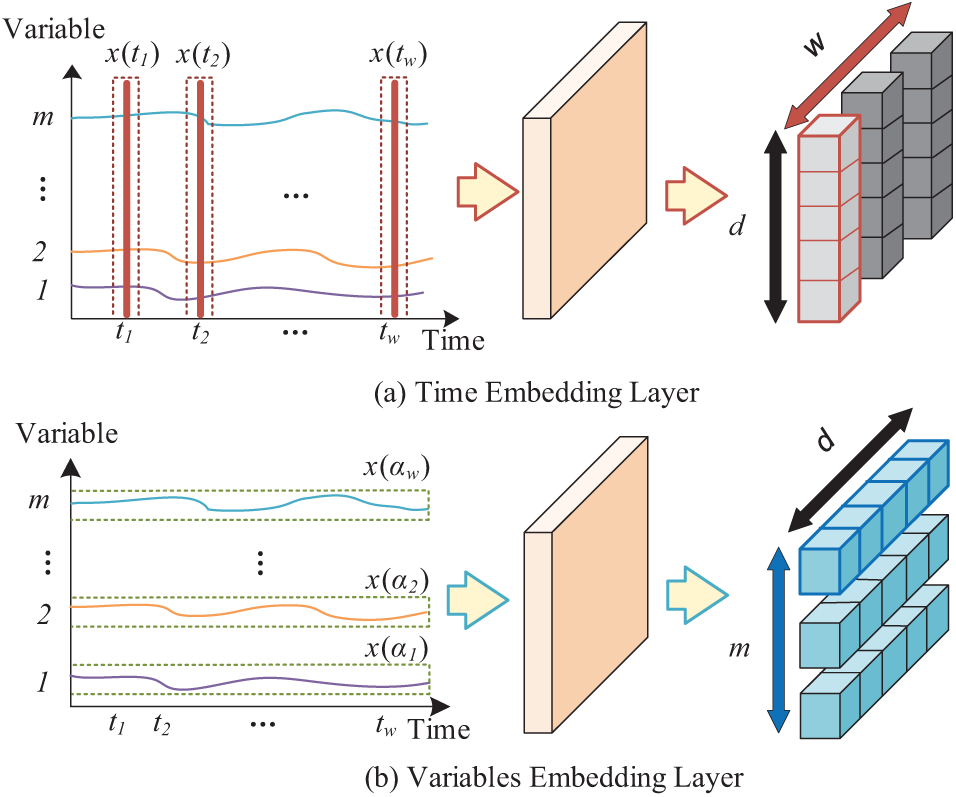
Figure 2: Parallel embedding layer
Fig. 2a shows the temporal embedding layer, which retains the feature embedding approach used in the standard Transformer model, and this operation ensures that the model can fully capture the evolution patterns of the sequence along the time axis. Fig. 2b shows the variable embedding layer, which embeds all the sample values of a single variable at all time points into a d-dimensional vector, and after embedding, the m variables form the matrix
where
The output matrix
2.2 Attention-Gate Control Mechanism
To effectively integrate the outputs of the dual-tower encoder, this paper designs an attention-gate control mechanism. The attention gate control mechanism is composed of an attention module and a GLU module, which realizes the nonlinear integration of the output matrices
(1) Feature Linear Transformation: Linear transformation is applied to the feature matrices
where
(2) Attention score calculation: Multiply matrix
(3) Feature Integration: The obtained attention values are integrated through a gate mechanism to obtain the output feature
where
3 A Multi-Stage TSA Based on the Dual-Tower Transformer
This paper employs busbar voltage magnitude data of individual nodes in the power system as the original dataset. The voltage curves under different system states are shown in Fig. 3a,b. As evident from these figures, when the system is subjected to a certain disturbance, the busbar voltage in a stable state can recover to its original stable state or attain a new stable state over time. However, in an unstable state, the busbar voltage fluctuates continuously with varying vibration trends. Combining the changes in rotor angle curves can demonstrate the differences between the two instability modes, as shown in Fig. 3c.
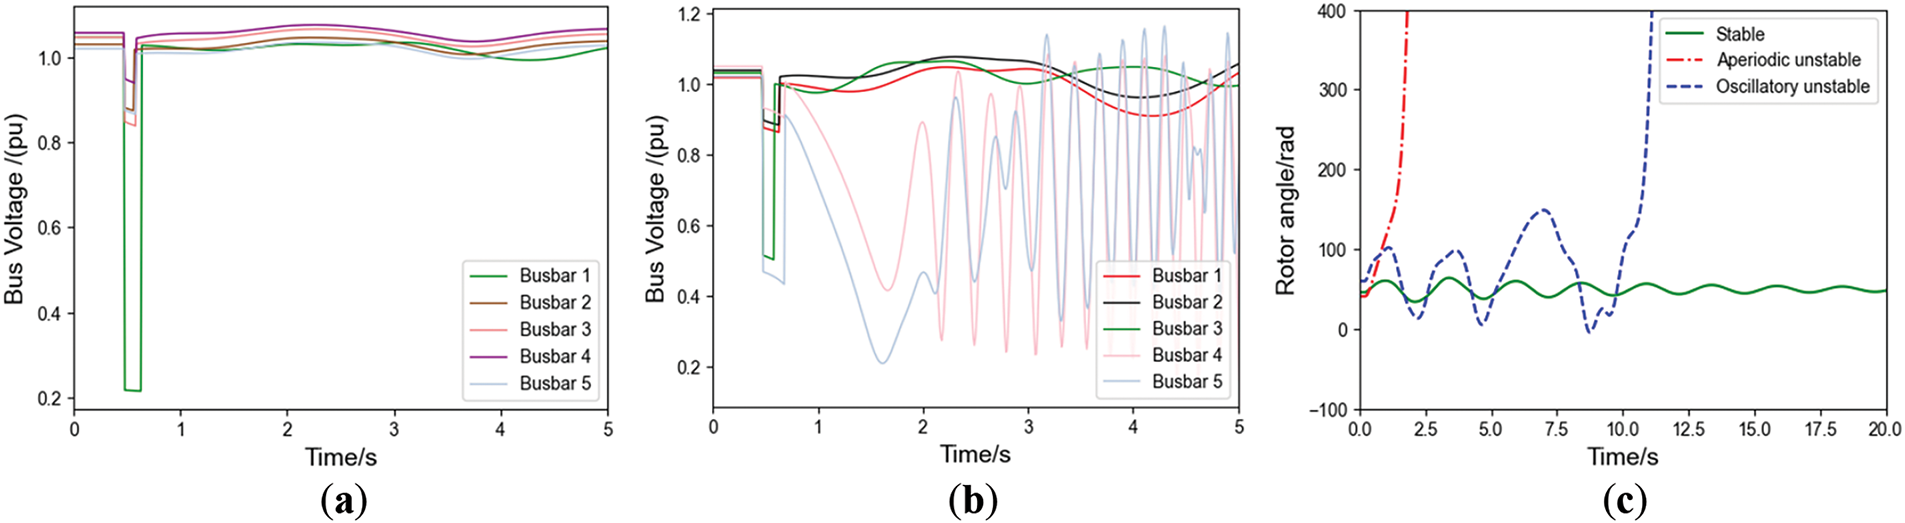
Figure 3: Curve diagrams for stable state, aperiodic instability state, and oscillatory instability state. (a) Under stability conditions; (b) Under instability condition; (c) Rotor angle curve diagram
Considering the potential data loss during PMU data collection, this paper constructs a 30-dimensional trajectory cluster dataset based on the original dataset to prevent the data-driven model from becoming inoperable due to the loss of busbar data [24]. The operating state of the power system is divided into three cases: the stable state is labeled 0, the aperiodic unstable state is labeled 1, and the oscillatory unstable state is labeled 2. The stability of the power system is judged by the transient stability index (TSI) of the generator rotor angle after the fault, and the aperiodic instability and oscillatory instability are further distinguished based on the divergence of the power angle curve. TSI calculation formula is as shown in Eq. (6):
where
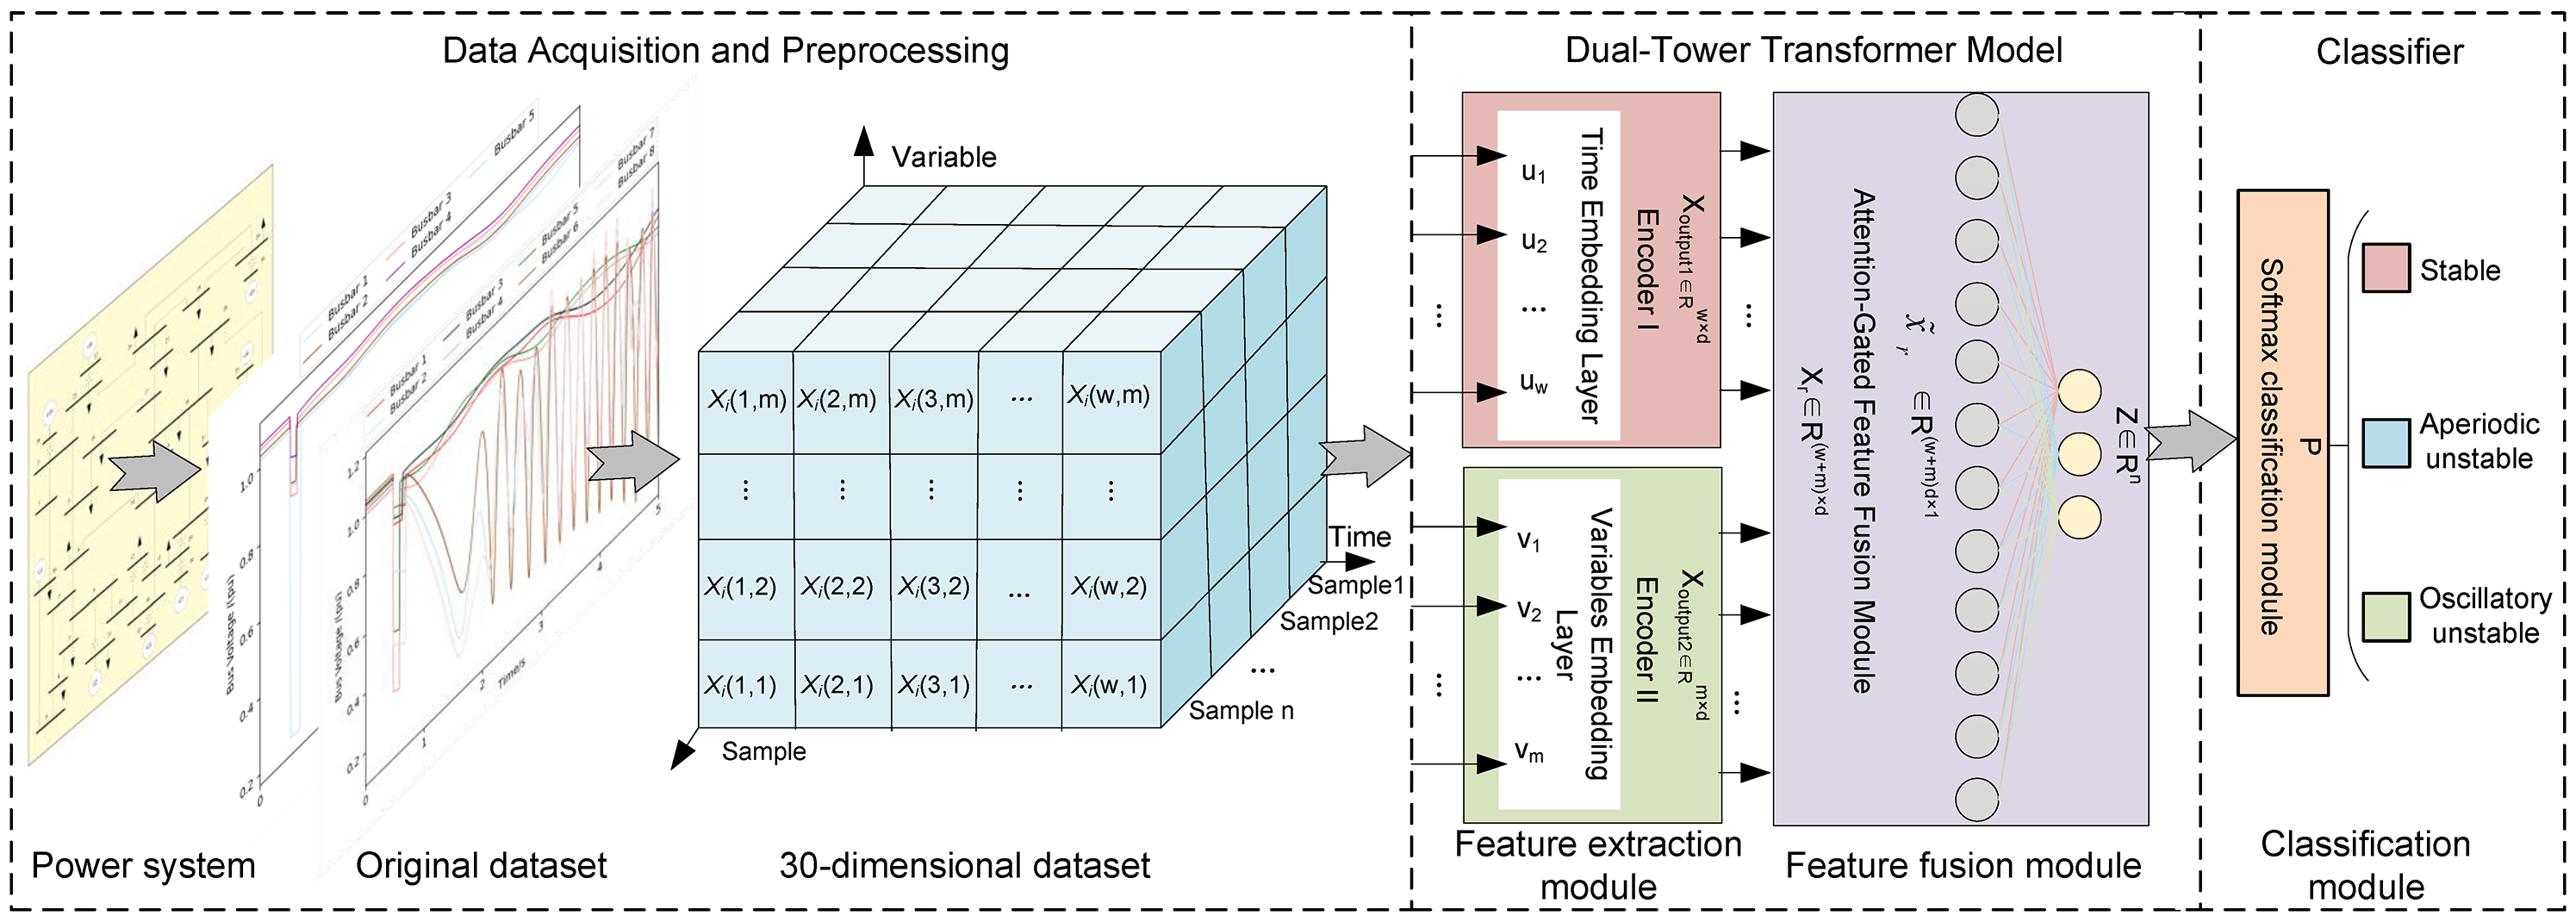
This paper designs a TSA model composed of the dual-tower Transformer encoder, fully connected layer, and Softmax classifier, as shown in Fig. 4. The model assessment process is as follows:
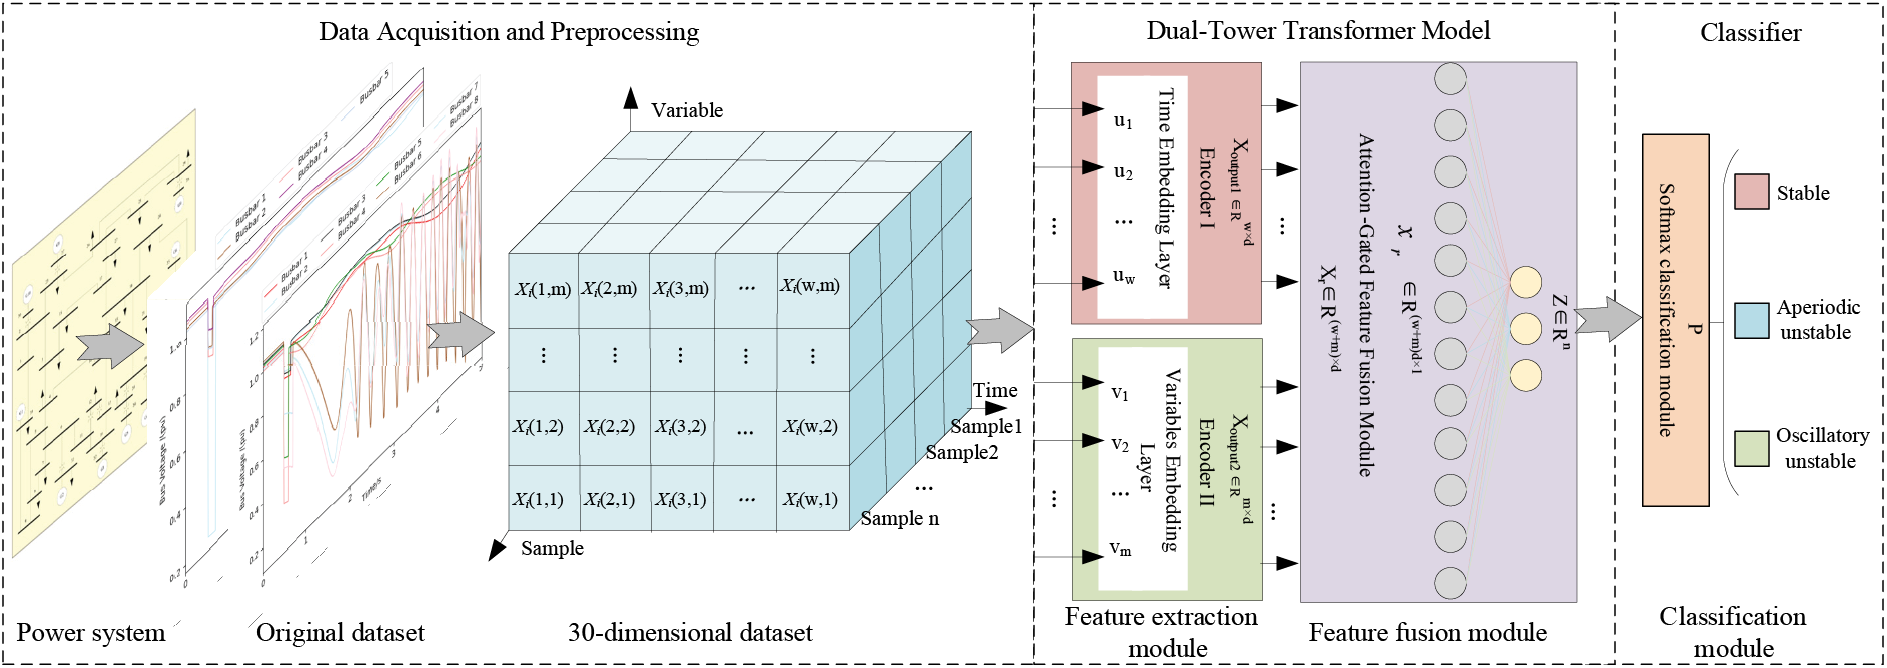
Figure 4: Model framework diagram
(1) A 30-dimensional trajectory cluster dataset is obtained from the power system, as shown in the data processing section of Fig. 4, where
(2) Input
(3) Convert the vectors in the matrix
(4) The output vector
where
In order to effectively reduce the probability of misclassification of unstable samples, this paper has developed a multi-stage TSA method, which includes pre-training, re-training, and online assessment stages.
Initially trained on a large-scale dataset, the model captures data features comprehensively. To measure and optimize performance, it employs cross-entropy loss with the RAdam algorithm for dynamic, adaptive parameter adjustment. Meanwhile, to effectively curb overfitting caused by excessive model complexity, L2 regularization is introduced to impose constraints on model parameters, generating a pre-trained model.
To address the model bias caused by sample imbalance, this paper designs a hybrid sampling strategy based on sample boundaries:
(1) Use the pre-trained model to evaluate each training sample individually, set the evaluation probability threshold γ = 0.9, and when the accuracy rate of a sample is greater than or equal to γ, it is classified as a non-boundary sample, otherwise, it is classified as a boundary sample.
(2) For the minority class samples in the boundary samples, use the smote algorithm for over-sampling, and for the stable samples in the non-boundary samples, perform random under-sampling. Finally, form a hybrid sampling training set.
(3) Use the hybrid sampling training set to re-train the pre-trained model to improve the model’s discriminative accuracy rate for minority classes. When the model’s assessment accuracy rate meets the assessment requirements, save the model parameters and generate an assessment model.
Real-time sampling of grid data is conducted, and the TSA model is used to assess the sampled data. The probabilities
4 A Two-Stage Updating Scheme Based on the Dual-Tower Transformer
When changes occur in the topology or operational mode of the power grid, there often emerges a significant distribution discrepancy between the newly formed target domain data and the source domain data. This discrepancy greatly diminishes the evaluation accuracy of the source domain model on the target domain. To quantify the degree of difference between the target domain and the source domain, this paper adopts maximum mean discrepancy (MMD) [25] technology as an evaluation tool. Based on different MMD values IMMD, differentiated transfer paths are designed, with the update process illustrated in Fig. 5.
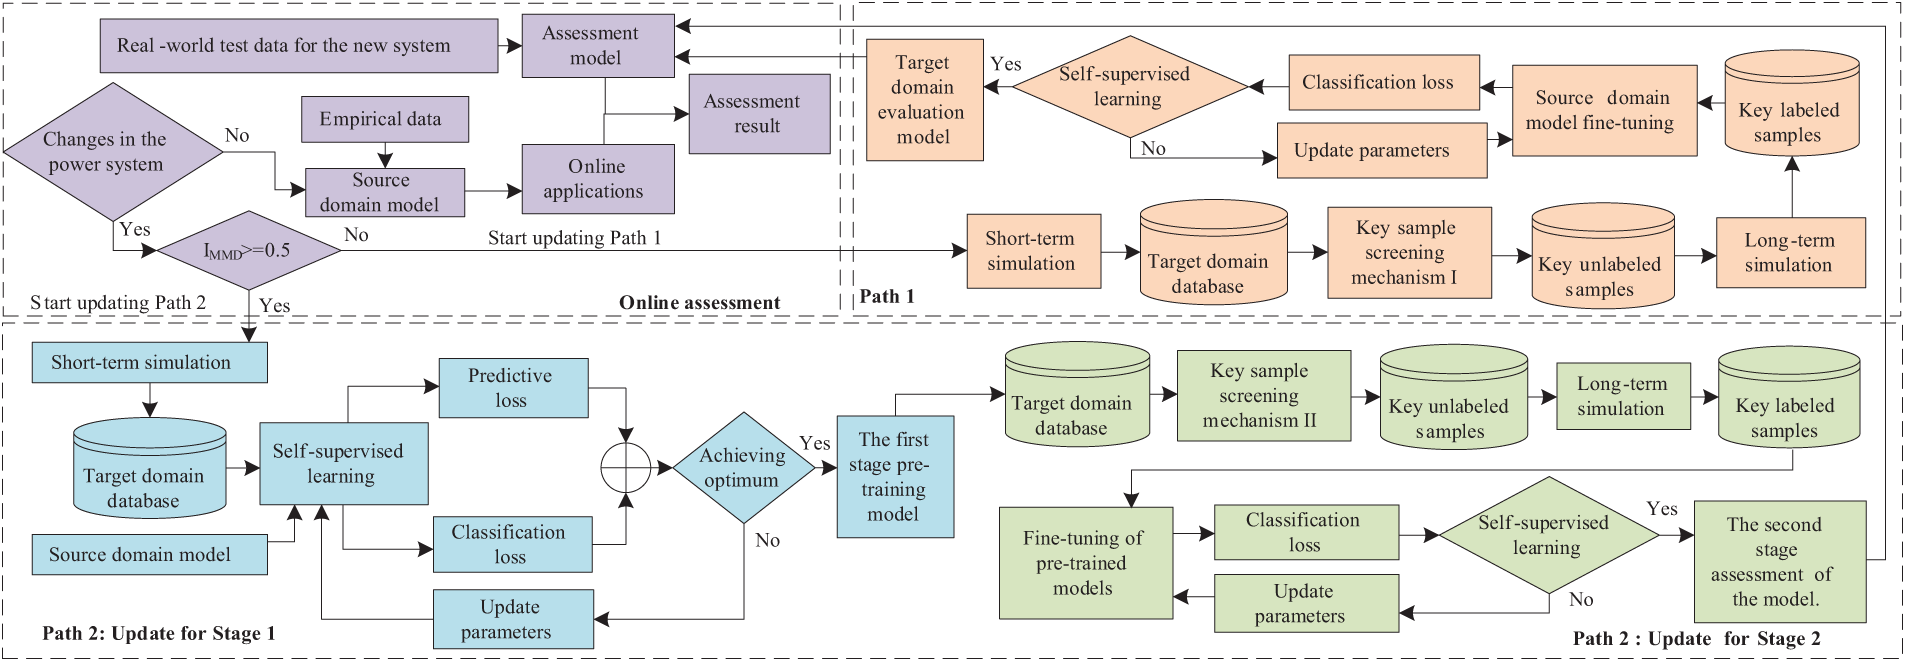
Figure 5: Flowchart of the updating scheme
Path 1: When IMMD ≤ 0.5, the difference between target domain data and source domain data is relatively small. The source domain model is used to evaluate unlabeled samples in the target domain, and the
Path 2: When IMMD > 0.5, significant data discrepancy exists between target and source domains, rendering output layer fine-tuning insufficient for model evaluation accuracy. Considering the issues present in current research approaches: (1) Relying solely on a small number of samples for updates can improve the update speed but cannot meet the accuracy requirements for evaluation; (2) Generating more training samples can enhance model performance but increases time costs. Therefore, this paper proposes a two-stage updating scheme based on self-supervised learning.
4.1 Stage 1: Regression Prediction Based on Self-Supervised Learning
Self-supervised learning [26], as an important branch of unsupervised learning [27], possesses the ability to autonomously mine and extract the intrinsic representation characteristics of unlabeled data. In this paper, we introduce the masked prediction task into self-supervised learning as an auxiliary strategy, utilizing unlabeled samples to conduct pseudo-supervised training of the model. The specific operation of self-supervised learning based on masked prediction is as follows:
(1) Data masking: For each unlabeled input sample
(2) Regression prediction: Input the masked input data into the source domain model, predict and reshape the masked segments of the masked data
4.2 Stage 2: Model Optimization
The initial update in Stage 1 alone cannot enhance the model’s assessment performance to meet the predetermined standard. However, after the initial update in Stage 1, the model has learned rich data representations of the new system from unlabeled samples. So, when optimizing the pre-trained model in Stage 1, no more labeled samples are needed, greatly reducing the time required for sample generation. The update steps are as follows:
(1) Key Sample Selection Mechanism II: Using the pre-trained model from the first stage, perform masked predictions on unlabeled samples, and define the top
(2) By conducting long-term simulation to label key unlabeled samples, and then using parameter fine-tuning techniques to update model parameters, the evaluation performance of the model is improved, and a second stage transient stability assessment model is generated.
5.1 Data Set and Assessment Indicators
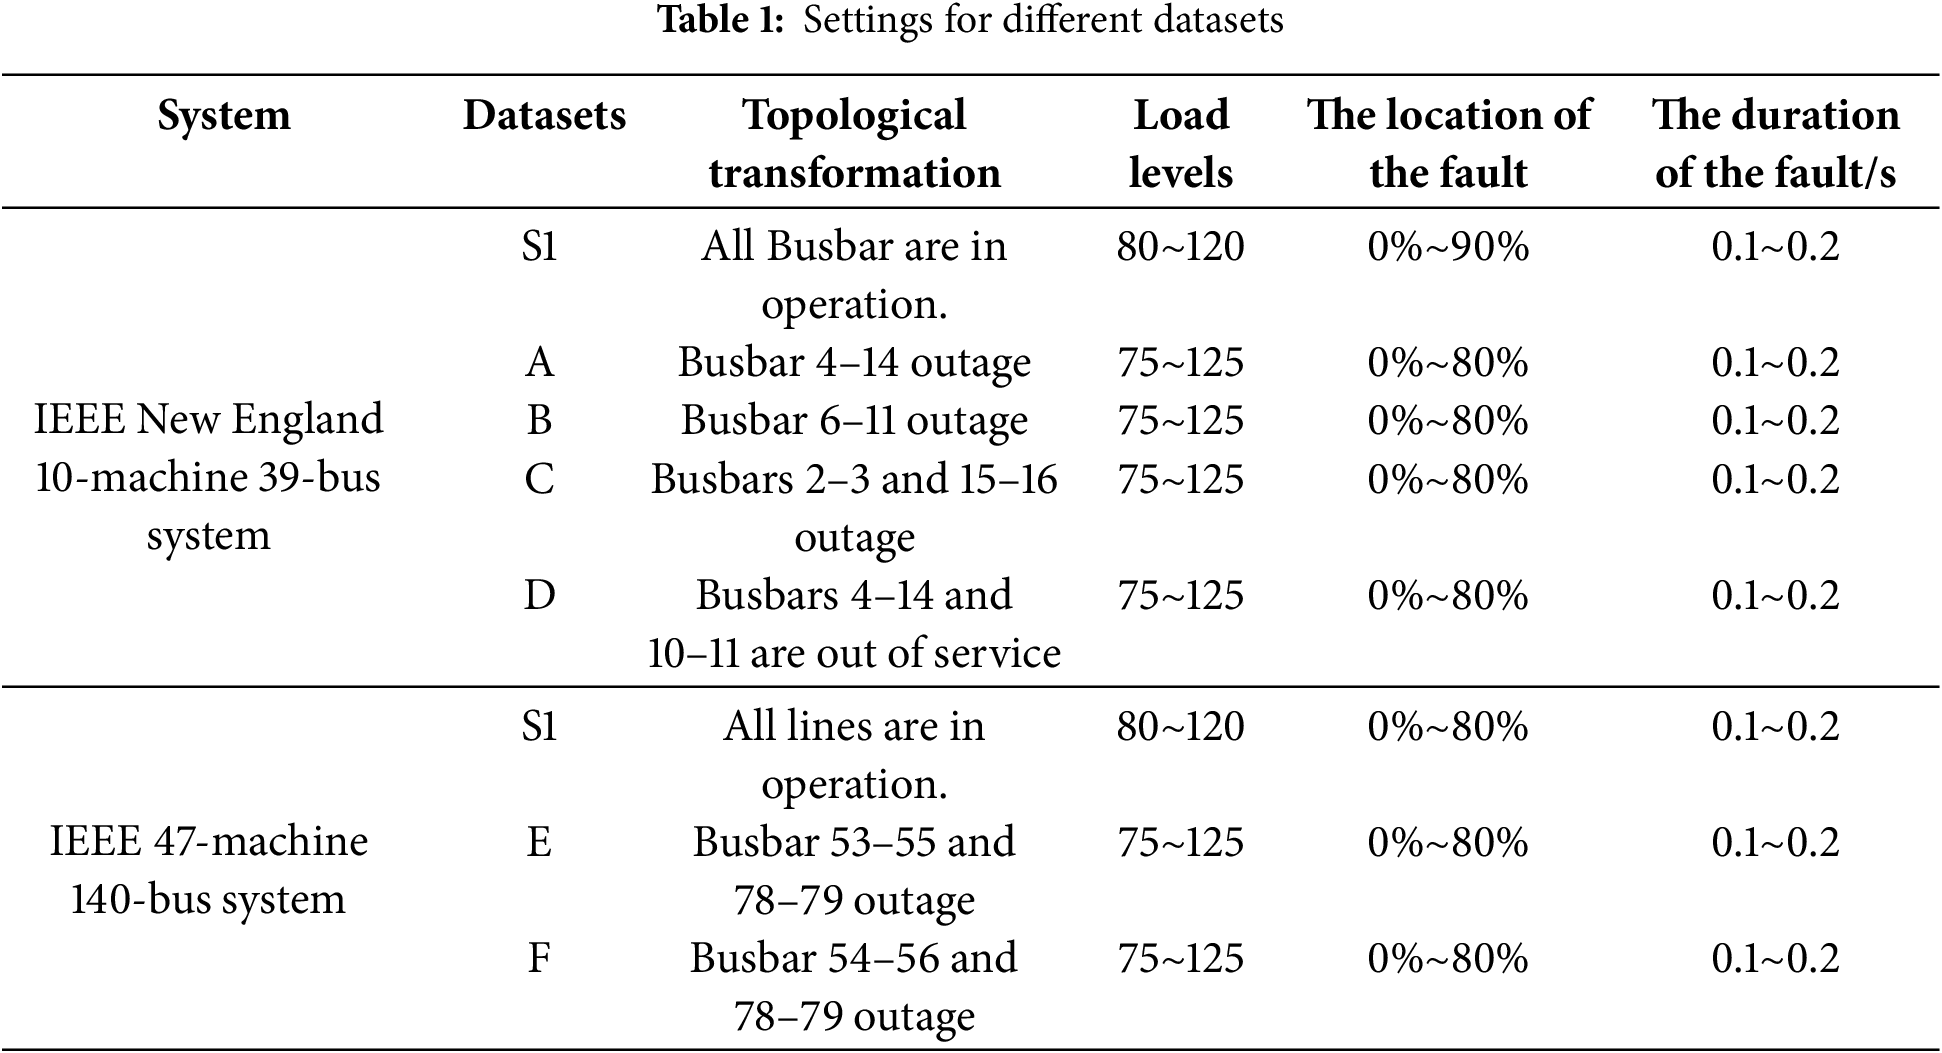
In this simulation, the software uses PSD-BPA software, the assembly language is Python, and the deep learning framework is PyTorch. The case study uses the IEEE New England 10-machine 39-bus system and IEEE 47-machine 140-bus system for simulation experiments. The database setting is shown in Table 1, where S1 and S2 are the source domain databases, and A-F are the target domain databases. The case study considers 9 load levels at 80%, 85%, 90%, … , 120%, and the fault location is selected at 0%, 10%, 20%, … , 90% of the line, with the fault type set as a three-phase short-circuit fault. The fault duration is randomly set within 0.1 to 0.2 s, and the simulation time is 20 s. The S1 database has 12,240 samples, including 7986 stable samples, 3042 aperiodic unstable samples, and 1212 oscillatory unstable samples. The S2 database has 22,140 samples, comprising 15,201 stable samples, 3853 aperiodic unstable samples, and 3086 oscillatory unstable samples. The datasets are divided into training, validation, and test sets in an 8:1:1 ratio.
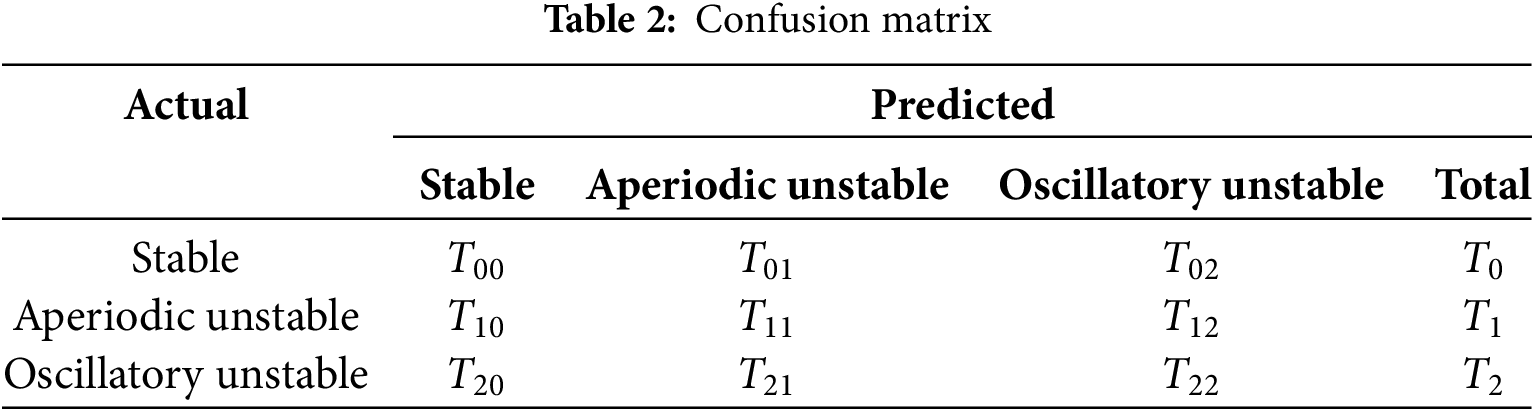
To evaluate the model performance comprehensively, we introduced a confusion matrix, as shown in Table 2, and three classification assessment indicators, as shown in Eqs. (8)–(10):
where
5.2 Comparison of Assessment Performance among Different Models
To assess the dual-tower Transformer’s performance, we compared it with six other models: dual-tower FNN-Transformer, standard Transformer, CNN+LSTM, LSTM, CNN, and SVM. The dual-tower FNN-Transformer integrates an FNN module for nonlinear transformation, while the CNN+LSTM model separately extracts and analyzes spatial and temporal features. The model parameters are as follows: the dual-tower Transformer and standard Transformer models have 8-head attention mechanisms and 4 sub-modules. The LSTM algorithm uses 4 hidden layers with a hidden layer dimension of 150. The CNN model comprises 4 convolutional layers with a kernel size of 3 × 3, and each layer is followed by a 2 × 2 max pooling layer. The SVM kernel function uses the radial basis function, with hyperparameters C = 10 and kernel function parameters. All models are set with an Epoch size of 200, a Batch size of 128, an initial learning rate of Lr = 0.001, and an L2 regularization term of 0.1. The average of 20 repeated experiments is taken as the evaluation result, as shown in Table 3. Simultaneously, to test the working efficiency of the dual-tower Transformer model, the training durations of both the dual-tower Transformer model and the dual-tower FNN-Transformer model were recorded, with the results shown in Table 4.
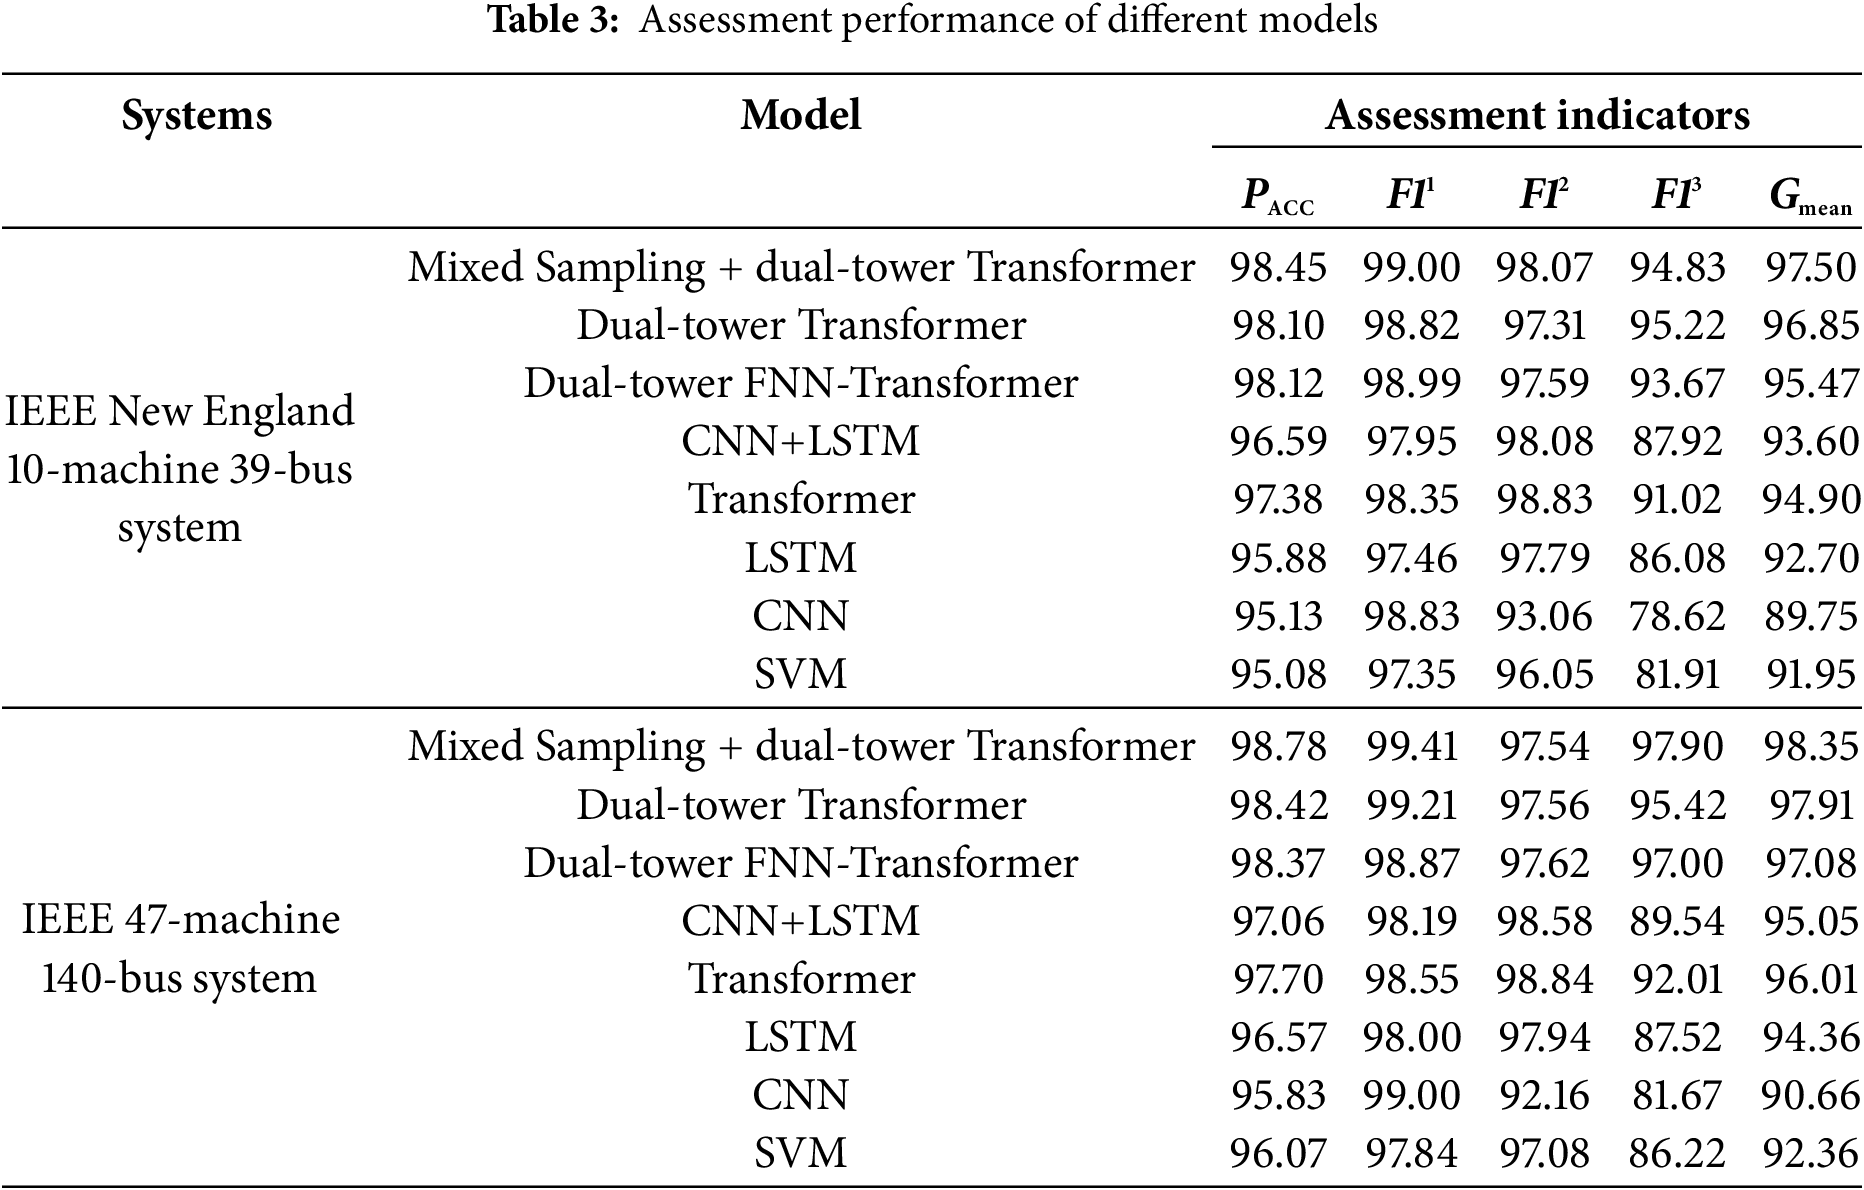
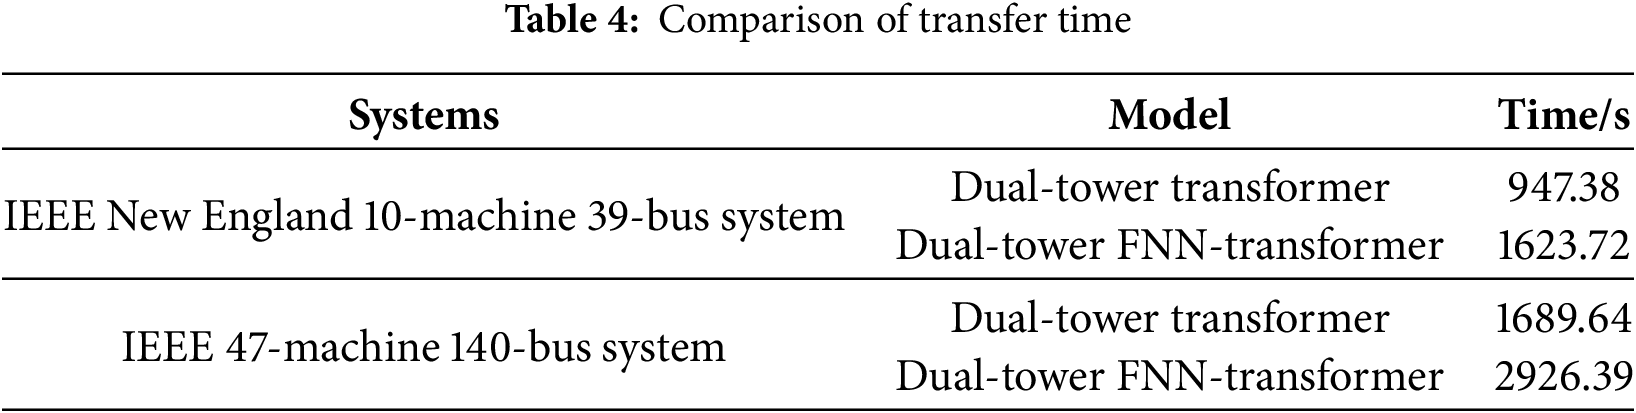
Table 3 demonstrates that the Transformer model outperforms LSTM, CNN, and SVM in assessment tasks, due to its multi-head attention mechanism that targets key features. The dual-tower Transformer, which extracts data from both time and variable dimensions, exhibits superior performance. Although the CNN+LSTM model, which captures features from both dimensions, performs better than each model, it still lags behind the dual-tower Transformer. Retraining the dual-tower Transformer using a mixed sampling set significantly enhanced indicators
5.3 Visualization of Attention Weight Distribution
To verify the effectiveness and explainability of the designed dual-tower Transformer in allocating attention to feature information, this experiment randomly selected 50 samples for testing. Heatmaps in Figs. 6 and 7 visualize the evolution process of attention weight allocation in Encoder I and Encoder II, respectively, with color depth indicating weight (darker means higher).
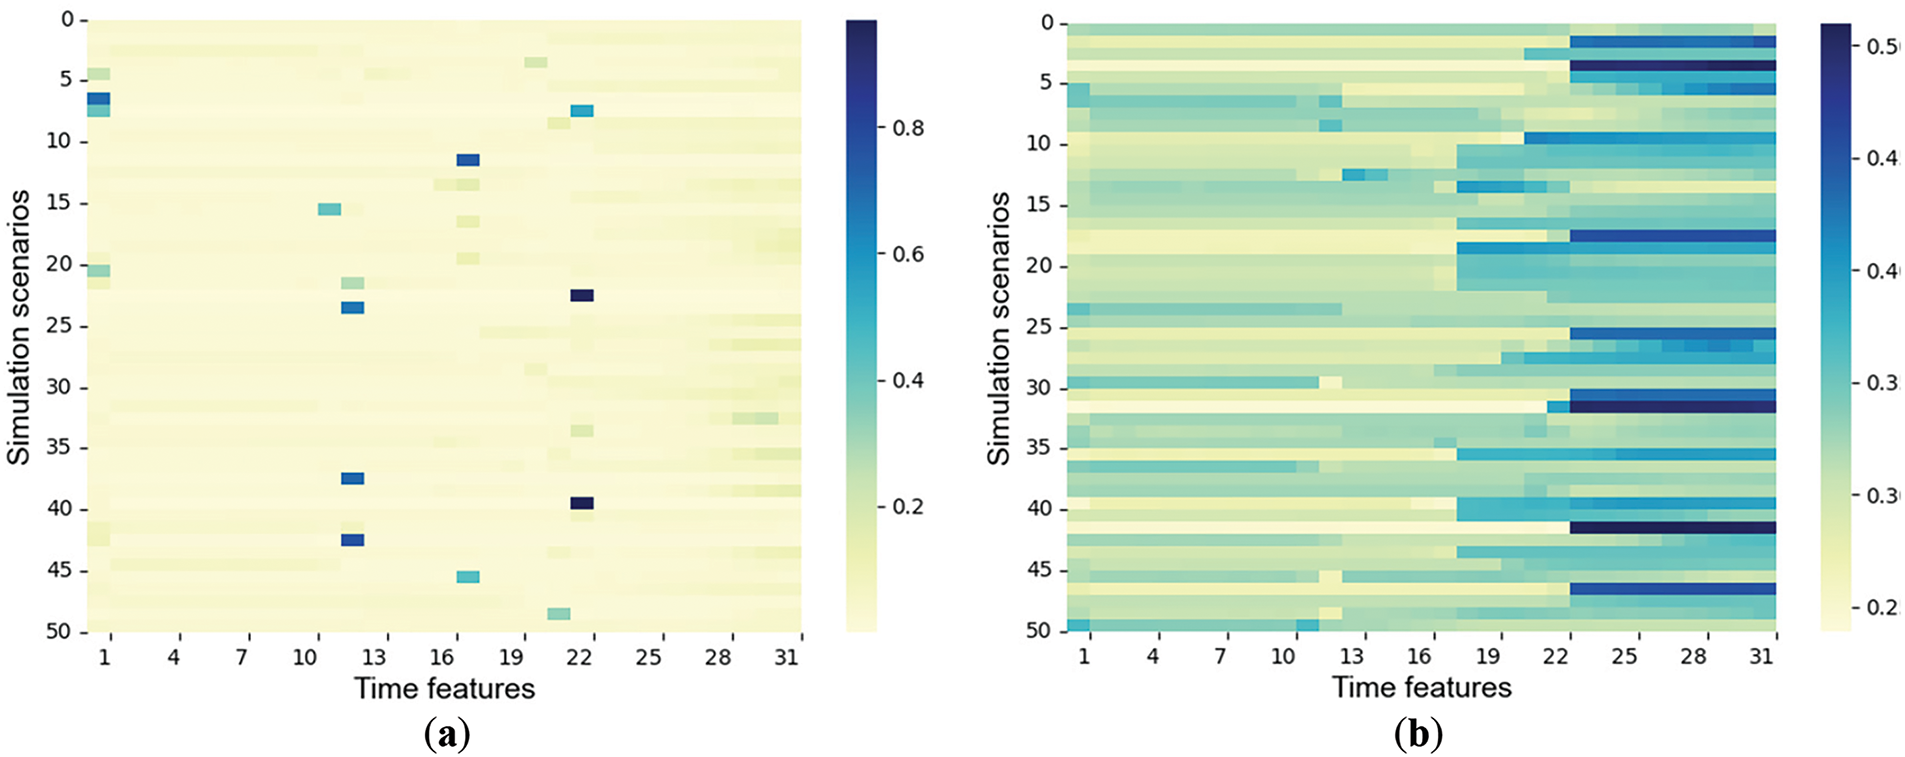
Figure 6: Time attention distribution. (a) The 5th round of time attention distribution; (b) The 100th round of time attention distribution
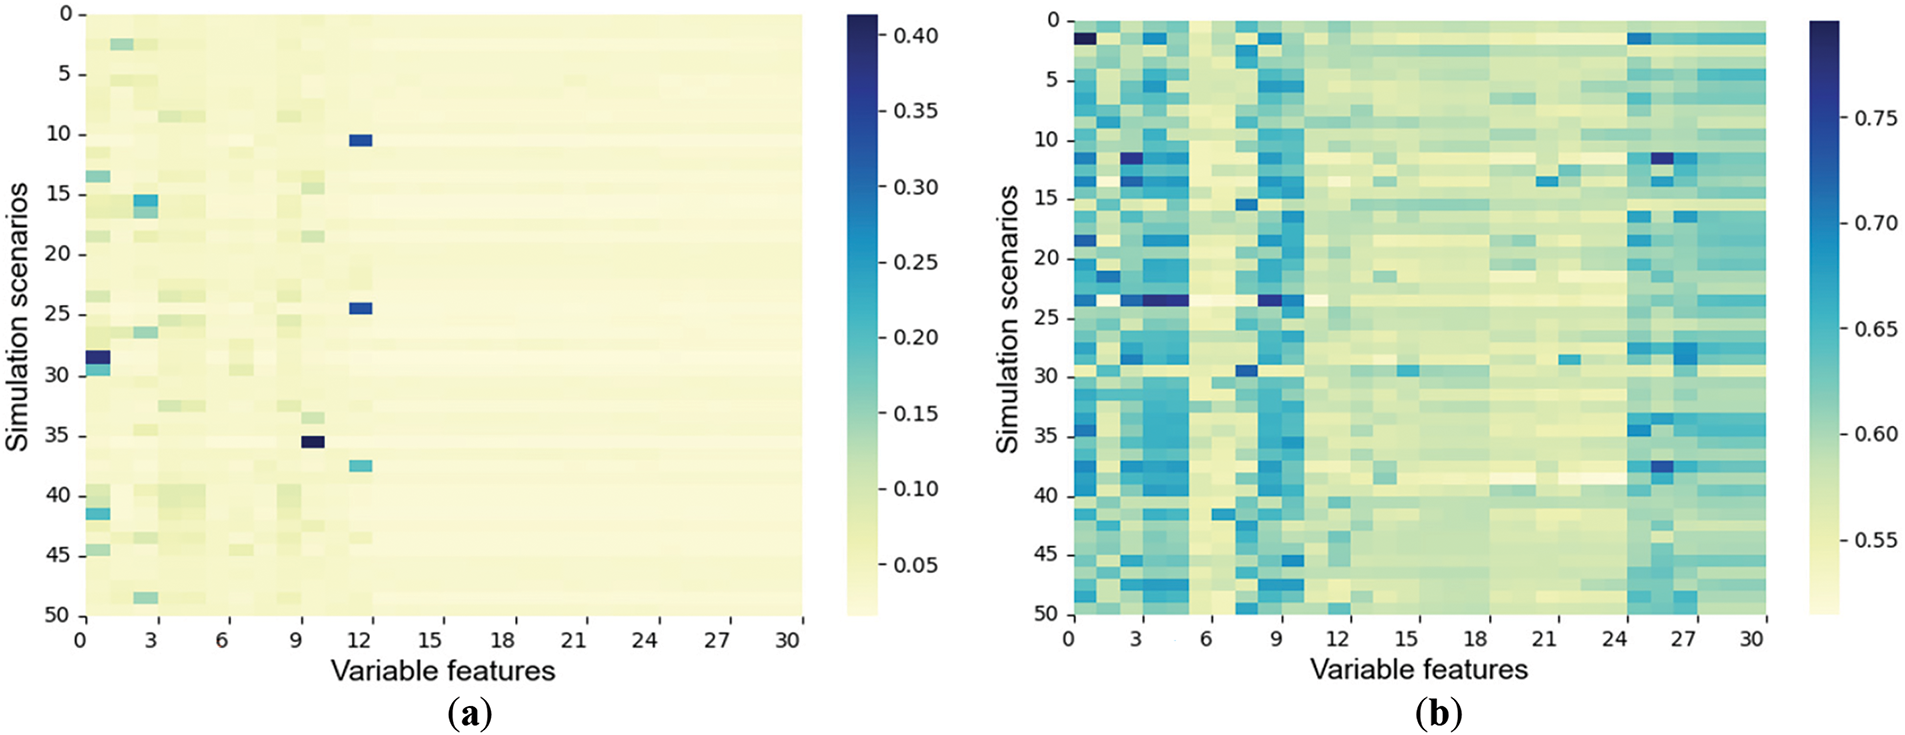
Figure 7: Variable attention distribution. (a) The 5th round of variable attention distribution; (b) The 100th round of variable attention distribution
Figs. 6 and 7 illustrate the changes in attention weights of the tower encoder in time and variable dimensions over training epochs. In Fig. 6, as the number of training rounds increases, the attention mechanism of Encoder I increasingly focuses on features from later periods, and this conforms to the system’s state gradually becoming clearer as time passes after the fault occurs. In Fig. 7, the attention weights of Encoder II are evenly distributed among features initially but develop a clear bias by the 100th round, showing the model learns to emphasize key features. The figures demonstrate that the feature extraction network based on the model can dynamically adjust the feature weights and verify its interpretability.
5.4 Performance Testing of Transferability in Different Target Domains
The source domain model is tested on different target domain datasets, respectively, and the average of 20 repeated experiments is taken as the evaluation result. The results are shown in Table 5.
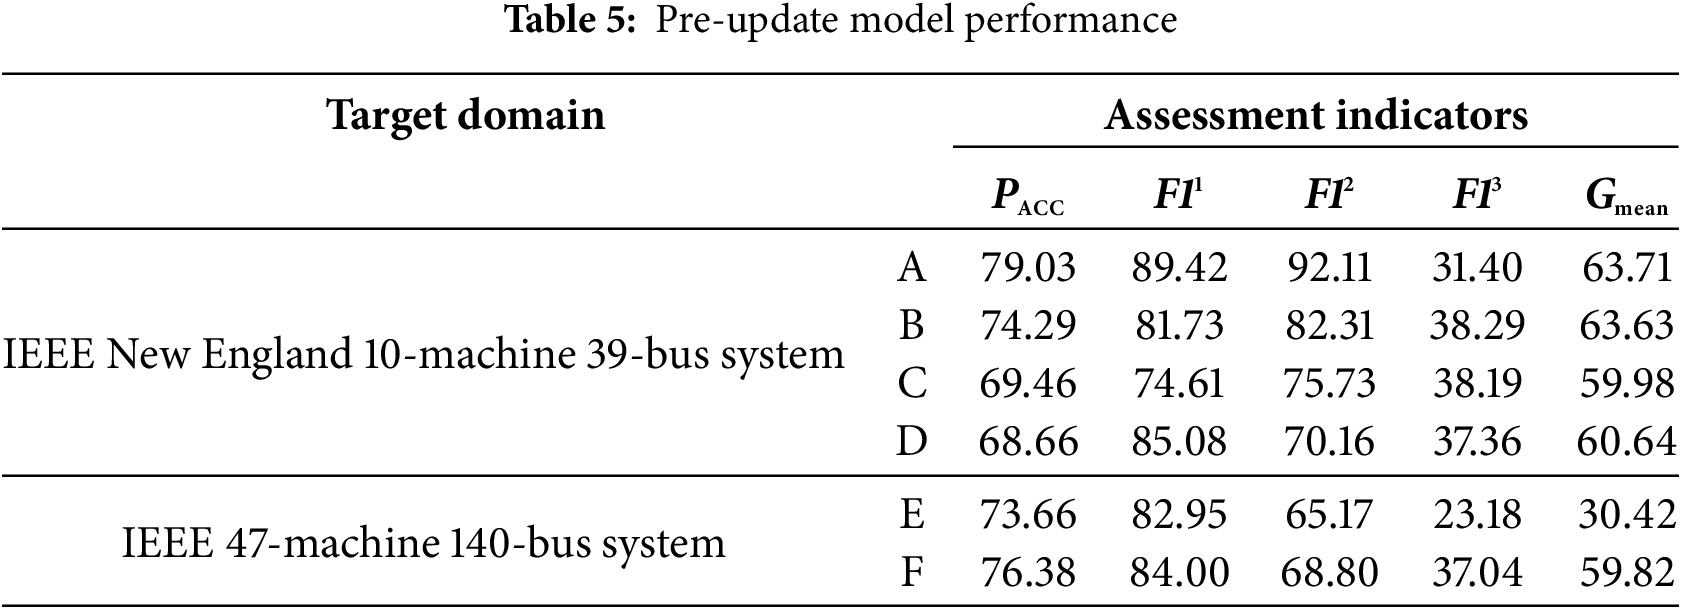
Table 5 shows that the evaluation performance of the source domain model in each target domain has dropped sharply, with accuracy rates below 80%, which fails to meet the accuracy requirements for transient stability assessment. Therefore, the source domain model needs to be updated to adapt to the new system structure. Since the IMMD values between the six target domains and the source domain dataset are all greater than 0.5, this paper utilizes the two-stage updating scheme to update the source domain model.
In the first stage update, the mask ratio is set to 0.15, with a geometric distribution whose mathematical expectation is 3. In the second stage, 1500 critical samples are used, the initial learning rate is set to 0.001, and 100 epochs are run, with other settings remaining the same as in Section 5.2. The assessment result is the average of 20 repeated experiments, as shown in Table 6.
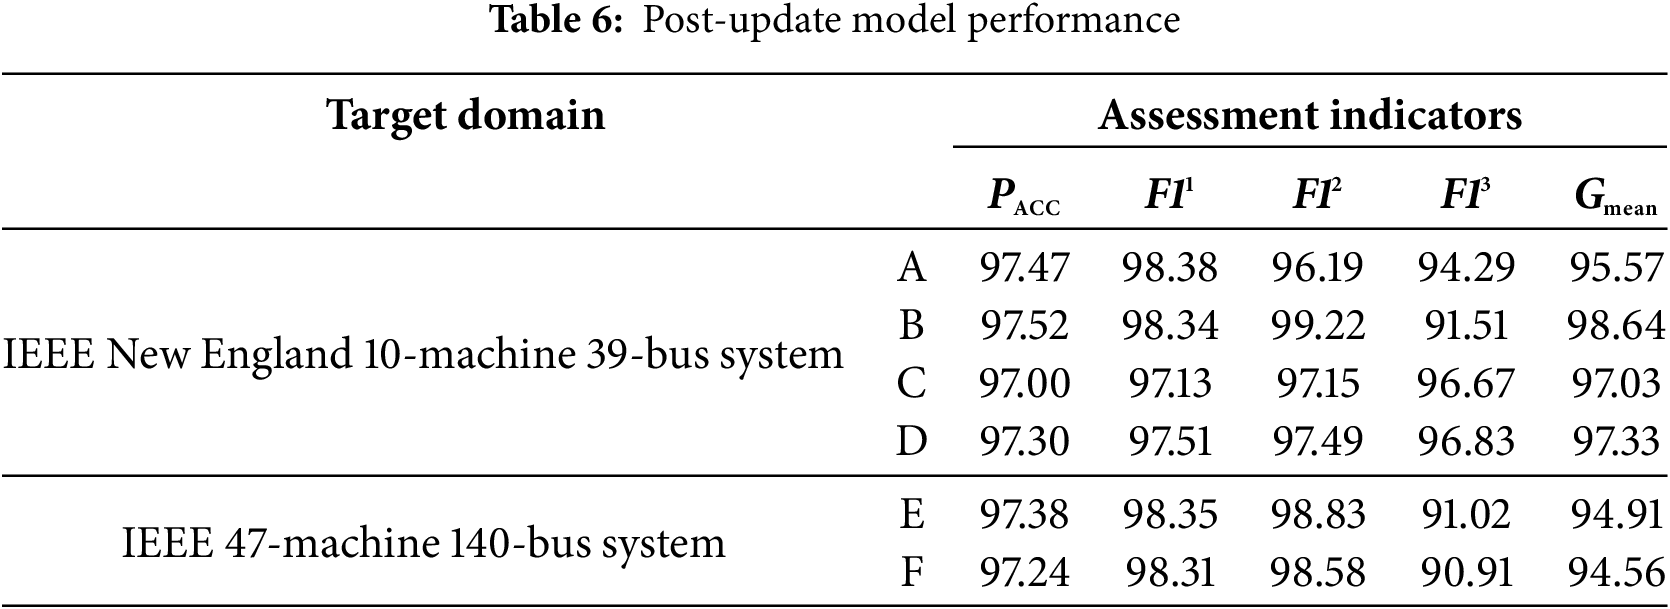
Table 6 shows that the model’s assessment performance significantly improves after two-stage updating, achieving over 97% accuracy even in cases of two bus outages, verifying the scheme’s effectiveness.
To verify the performance of the key sample selection mechanism based on the first-stage transfer model, 1500 key samples selected by the selection mechanism were compared with 1500 random samples through t-random nearest neighbor embedding dimensionality reduction visualization, the distribution of samples as shown in Fig. 8.
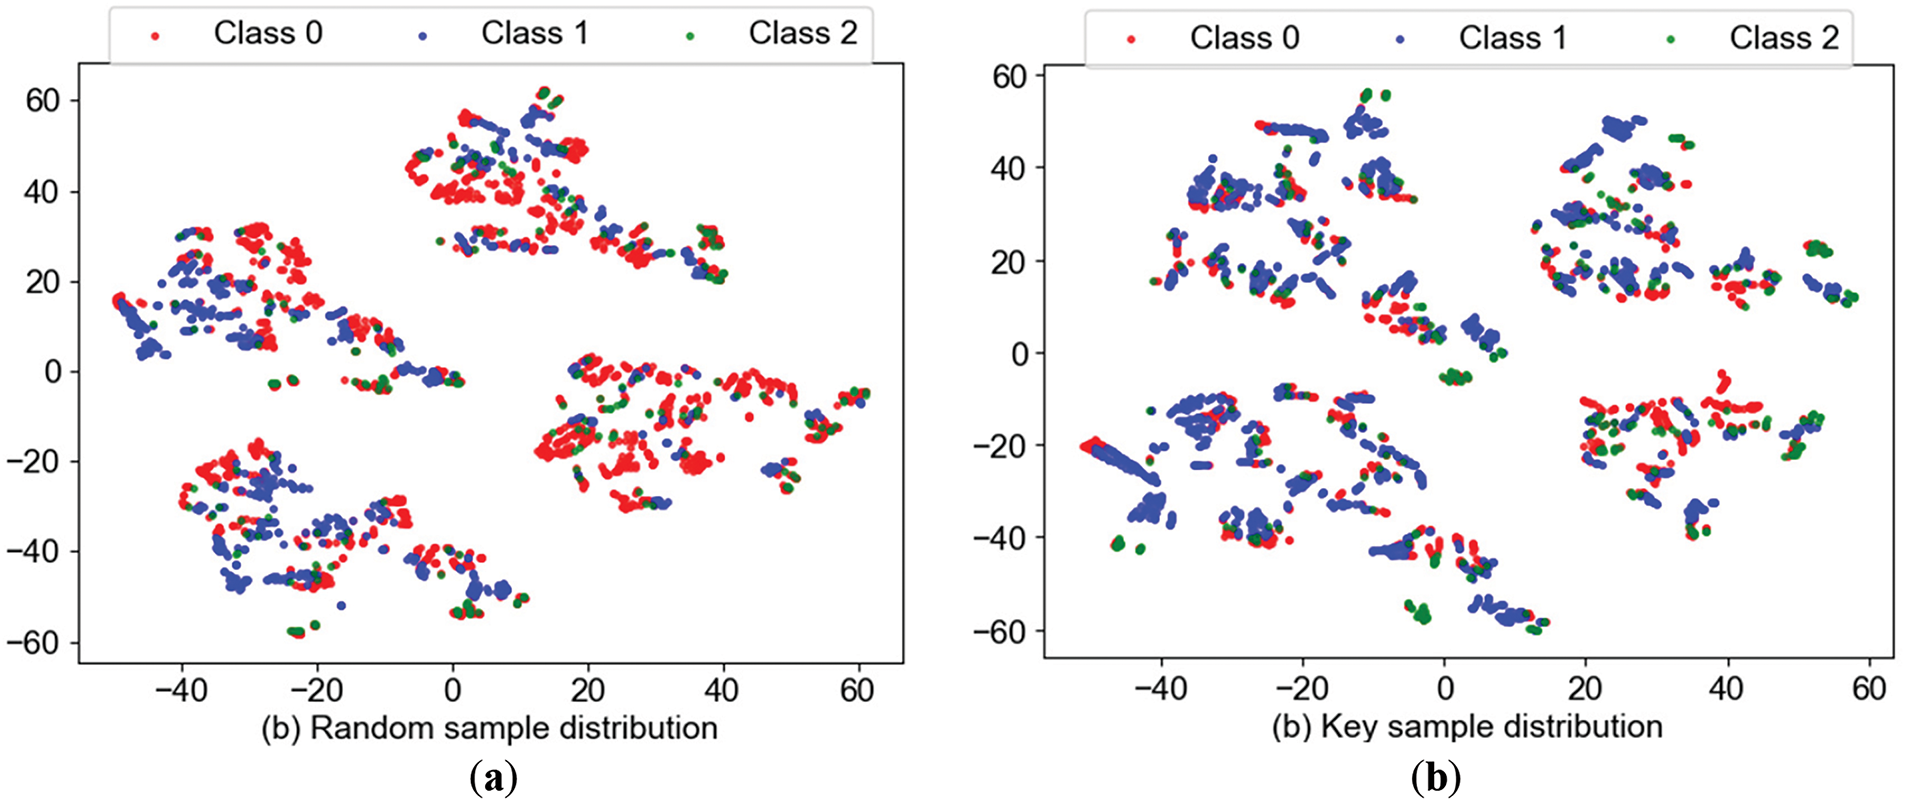
Figure 8: Sample distribution chart. (a) Random sample distribution; (b) Key sample distribution
From Fig. 8, it can be seen that the overlap among the key samples is more significant than that among the random samples, and the proportion of minority class samples increases. This is because the samples in the overlapping area and the minority class samples are more difficult to distinguish. Therefore, these key samples have higher value information, verifying the effectiveness of the key sample selection mechanism.
5.5 Comparison of Different Updating Schemes
To further verify the effectiveness of the two-stage model updating schemes, this paper designs four additional updating schemes for comparison testing:
Option 1: Retrain the model using all labeled samples.
Option 2: Based on the source domain model, randomly select 1500 samples for labeling, and fine-tune the output layer parameters of the model.
Option 3: Use self-supervised learning to initially improve the model’s generalization performance. Then, randomly select 1500 unlabeled samples and label them using long-term simulation techniques. Finally, fine-tune the model using the labeled samples.
Option 4: Utilize active learning to screen high-value samples, and subsequently subject the screened 1500 unlabeled samples to long-term simulation to generate labels. These labeled samples are then used to further optimize the model.
Option 5: The two-stage update scheme proposed in this paper.
To test the update effectiveness of each scheme, experiments were conducted on different target domains for the five update schemes, with two performance indicators,
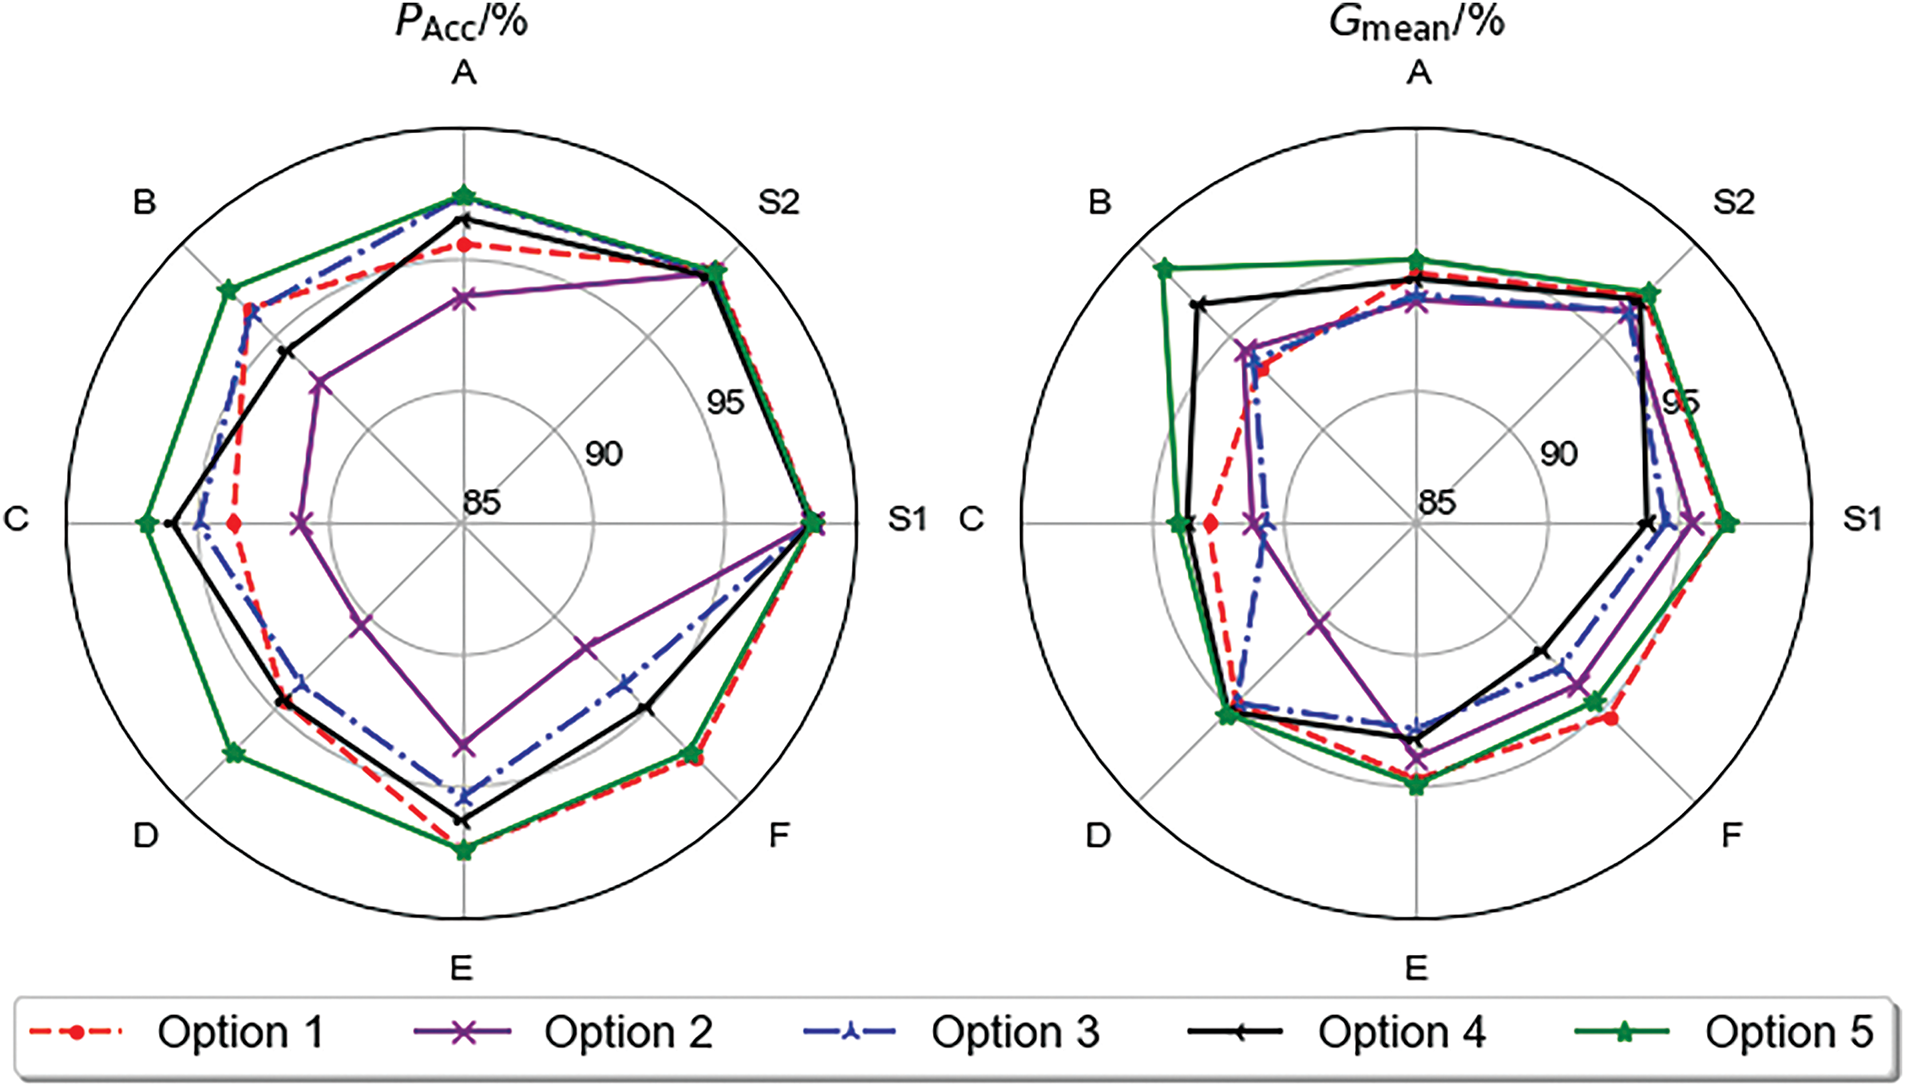
Figure 9: Performance comparison of migration solutions
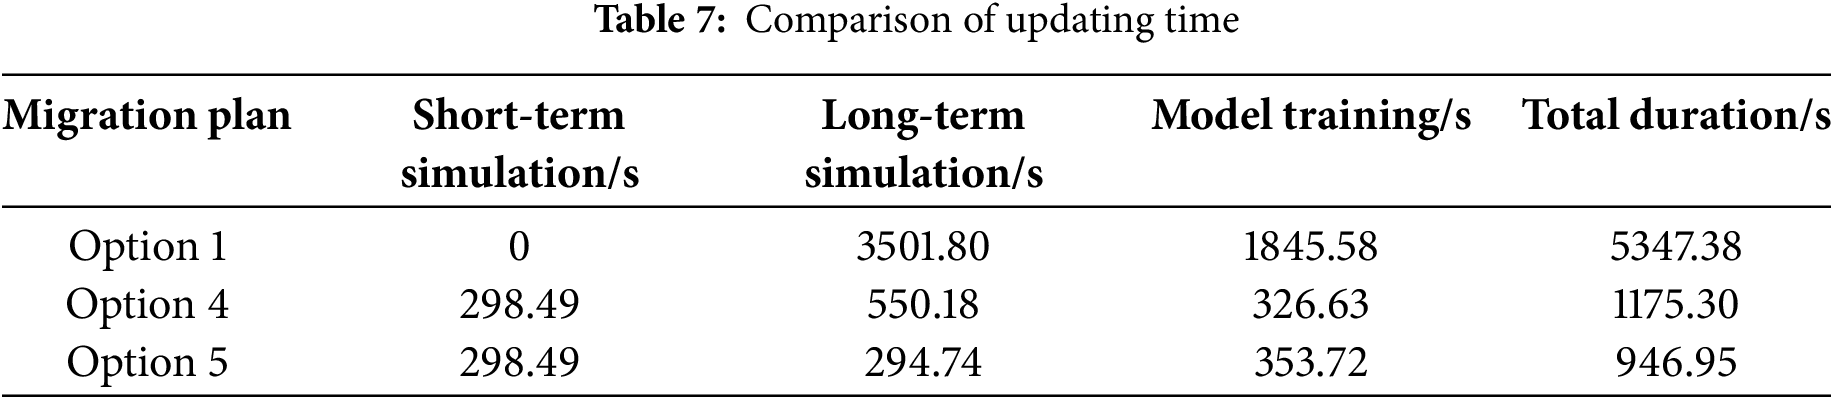
From Fig. 9, although Option 1 can improve the evaluation performance of the model through a large number of training samples and demonstrates similar performance to the proposed update scheme in this paper on the target domain F, according to Table 7, the retraining time required for Option 1 is 5347.38 s, far exceeding that of Option 5, and cannot meet the timely demand for model updates. The performance of Option 2 is inferior to that of Option 5, because when IMMD > 0.5, the distribution difference between the target domain data and the source domain data is significant, and merely fine-tuning the output layer cannot fully capture the sample characteristics under the new system. Although Option 3 utilizes self-supervised learning in the first stage to enhance the model’s generalization performance, the randomly selected labeled samples are not representative, leading to lower update performance across various target domains compared to Option 5. Option 4 employs active learning to update the model, but the performance after the update is significantly lower than that achieved using Option 5.
To verify the impact of sample size on the transfer results, we selected 500 to 3100 key samples from the target domain, with 200 samples as the interval, according to the five updating schemes, and tested them. The results are shown in Fig. 10.
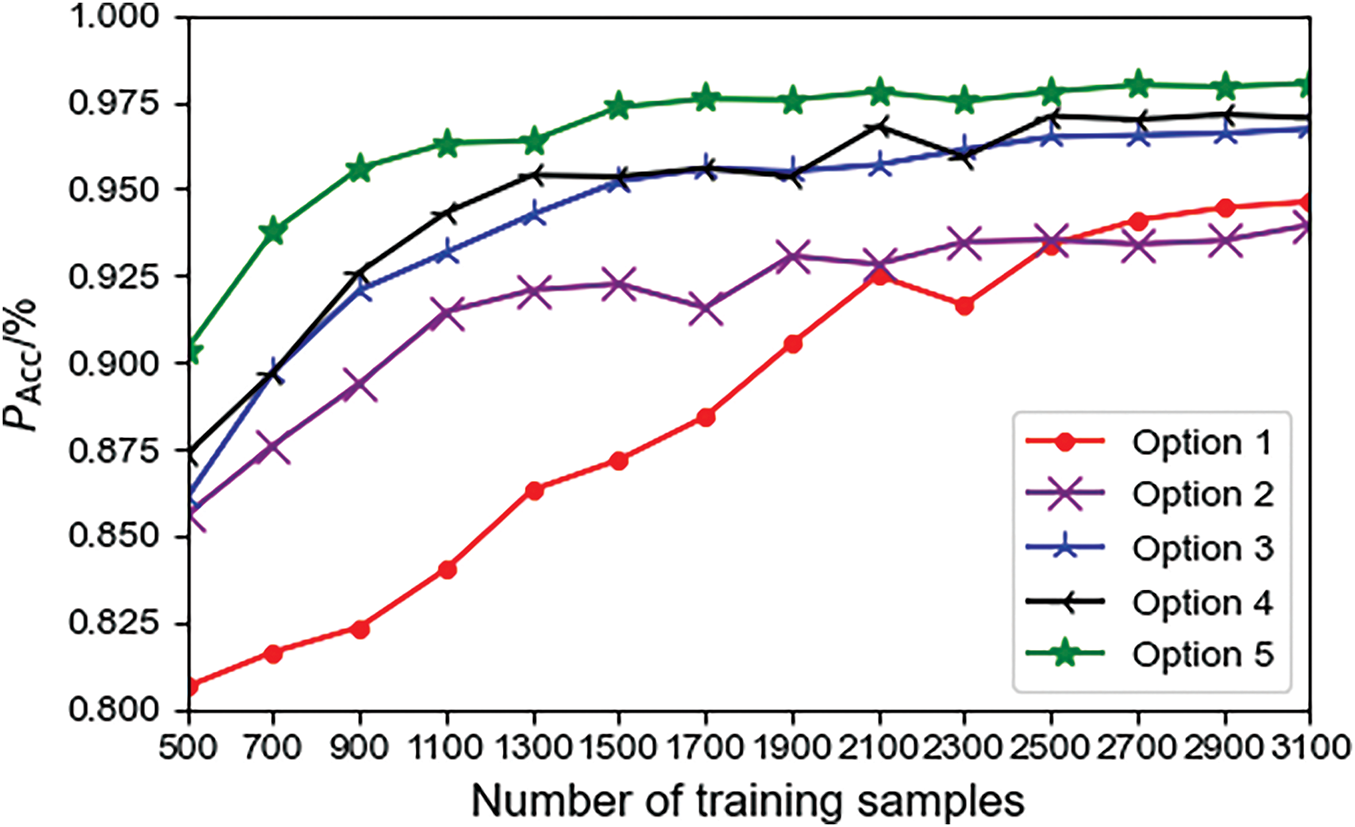
Figure 10: Comparison of migration scheme performance under different training samples
From Fig. 10, with just 900 labeled samples, the updated model’s accuracy in option 5 is notably higher, outperforming other schemes. This is due to the proposed scheme enhancing model generalization through self-supervised learning in stage 1, and a sample selection mechanism identifying valuable samples. Thus, the model significantly improves with limited labeled samples, validating the two-stage updating scheme’s effectiveness.
This paper presents a dual-tower Transformer-based evaluation model and a two-stage update strategy, aiming to improve the model’s multiclass transient assessment performance and update efficiency. Experimental verification was conducted on the two power systems, and the conclusions are as follows:
(1) The dual-tower Transformer model in this paper effectively extracts features from temporal and variable dimensions, ensuring complete extraction and significantly enhancing accuracy in multiclass transient stability assessment for power systems. Additionally, the hybrid sampling strategy proposed in this paper effectively improves the classification accuracy for minority class samples by balancing the sample distribution.
(2) This paper employs deep transfer learning, combining self-supervised learning and supervised learning, to achieve efficient model updates. This approach significantly reduces the dependence on external labeled samples during the model update process, greatly saves the time required for generating labeled samples, and improves the efficiency of model updates.
In this paper, the model update strategy focuses on effectively updating the model using unlabeled samples and a limited number of labeled samples in the target domain, significantly reducing the time cost of model updating. Meanwhile, the source domain boasts abundant labeled sample resources, and some of these samples have similar data distributions to those in the target domain. However, these similarly distributed samples have not been effectively utilized in the model update process. To further enhance the accuracy of model updates, our future research direction will be to leverage these source domain samples with similar distributions to implement sample-level transfer learning. We aim to further improve the accuracy of model updates by incorporating valuable sample information from the source domain.
Acknowledgement: Not applicable.
Funding Statement: This project is funded by the National Natural Science Foundation of China (5227-7084).
Author Contributions: The authors confirm contribution to the paper as follows: study conception and design: Nan Li, Jingxiong Dong; data collection: Nan Li, Jingxiong Dong; analysis and interpretation of results: Nan Li, Jingxiong Dong, Liang Huang, Liang Tao; draft manuscript preparation: Nan Li, Jingxiong Dong. All authors reviewed the results and approved the final version of the manuscript.
Availability of Data and Materials: The datasets used and/or analyzed during the current study are available from the corresponding author upon reasonable request.
Ethics Approval: Not applicable.
Conflicts of Interest: The authors declare no conflicts of interest to report regarding the present study.
References
1. Wang Q, Pang C, Hashim A. Transient stability assessment of a power system using multi-layer SVM method. IEEE Trans Power Syst. 2021;35(1):821–4. doi:10.1109/TPEC51183.2021.9384918. [Google Scholar] [CrossRef]
2. Hu W, Lu Z, Wu S, Zhang W, Dong Y, Yu R. Real-time transient stability assessment in power system based on improved SVM. J Mod Power Syst Clean Energy. 2019;7(1):26–37. doi:10.1007/s40565-018-0453-x. [Google Scholar] [CrossRef]
3. Tan B, Yang J, Pan X, Li J, Xie P, Zeng C. Representational learning approach for power system transient stability assessment based on convolutional neural network. J Eng. 2017;2017(13):1847–50. doi:10.1109/CIASG.2013.6611493. [Google Scholar] [CrossRef]
4. Yan R, Geng G, Jiang Q, Li Y. Fast transient stability batch assessment using cascaded convolutional neural networks. IEEE Trans Power Syst. 2019;34(4):2802–13. doi:10.1109/TPWRS.2019.2895592. [Google Scholar] [CrossRef]
5. Wu S, Zheng L, Hu W, Yu R, Liu B. Improved deep belief network and model interpretation method for power system transient stability assessment. J Mod Power Syst Clean Energy. 2019;8(1):27–37. doi:10.35833/MPCE.2019.000058. [Google Scholar] [CrossRef]
6. Zhao Q, Cai X, Chen C, Lv L, Chen M. Commented content classification with deep neural network based on attention mechanism. In: 2017 IEEE 2nd Advanced Information Technology, Electronic and Automation Control Conference (IAEAC); 2017 Mar 25–26; Chongqing, China. p. 2016–9. doi:10.1109/IAEAC.2017.8054369. [Google Scholar] [CrossRef]
7. Kundur P. Power system stability and control. New York, NY, USA: CRC Press; 2007. 360 p. [Google Scholar]
8. Yao W, Jiang L, Wen J, Wu QH, Cheng S. Wide-area damping controller of FACTS devices for inter-area oscillations considering communication time delays. IEEE Trans Power Syst. 2013;29(1):318–29. doi:10.1109/TPWRS.2013.2280216. [Google Scholar] [CrossRef]
9. Shen Y, Yao W, Wen J, He H, Jiang L. Resilient wide-area damping control using GrHDP to tolerate communication failures. IEEE Trans Smart Grid. 2018;10(3):2547–57. doi:10.1109/TSG.2018.2803822. [Google Scholar] [CrossRef]
10. Wang Q, Zhang J, Li S. Transient voltage stability assessment of wind power system based on noisy input multi-class gaussian process. South Power Syst Technol. 2024;18(9):126–37. (In Chinese). doi:10.13648/j.cnki.issn1674-0629.2024.09.014. [Google Scholar] [CrossRef]
11. Shi Z, Yao W, Zeng L, Wen J, Fang J, Ai X, et al. Convolutional neural network-based power system transient stability assessment and instability mode prediction. Appl Energy. 2020;263(6419):114586. doi:10.1016/j.apenergy.2020.114586. [Google Scholar] [CrossRef]
12. Li N, Zhang J. A transient stability assessment method of power system based on XGboost-DF. Electr Meas Instrum. 2024;61(10):119–27. (In Chinese). doi:10.19753/j.issn1001-390.2024.10.016. [Google Scholar] [CrossRef]
13. Li B, Wu J, Zhang R, Qiang Z, Qin L, Wang C, et al. Adaptive assessment of transient stability for power system based on transfer multi-type of deep learning model. Electr Power Autom Equip. 2023;43(1):184–92. (In Chinese). doi:10.16081/j.epae.202206002. [Google Scholar] [CrossRef]
14. Li N, Li B, Han Y, Gao L. Dual cost-sensitivity factors based power system transient stability assessment. IET Gener Transm Distrib. 2020;14(24):5858–69. doi:10.1049/iet-gtd.2020.0365. [Google Scholar] [CrossRef]
15. An J, Yu J, Li Z, Zhou Y, Mu G. A data-driven method for transient stability margin prediction based on security region. J Mod Power Syst Clean Energy. 2020;8(6):1060–9. doi:10.35833/MPCE.2020.000457. [Google Scholar] [CrossRef]
16. Wang Q, Zhang C, Lu Y, Yu Z, Tang Y. Data inheritance-based updating method and its application in transient frequency prediction for a power system. Int Trans Electr Energy Syst. 2019;29(6):e12022. doi:10.1002/2050-7038.12022. [Google Scholar] [CrossRef]
17. Zhou Y, Guo Q, Sun H, Yu Z, Wu J, Hao L. A novel data-driven approach for transient stability prediction of power systems considering the operational variability. Int J Electr Power Energy Syst. 2019;107(3):379–94. doi:10.1016/j.ijepes.2018.11.031. [Google Scholar] [CrossRef]
18. Zhan X, Han S, Rong N, Cao Y. A hybrid transfer learning method for transient stability prediction considering sample imbalance. Appl Energy. 2023;333(2):120573. doi:10.1016/j.apenergy.2022.120573. [Google Scholar] [CrossRef]
19. Tang Y, Cui H, Dang J. Transient stability prediction of time-varying power systems based on inheritance. Proc CSEE. 2021;41(15):5107–19. (In Chinese). doi:10.13334/j.0258-8013.pcsee.200829. [Google Scholar] [CrossRef]
20. Vaswani A, Shazeer N, Parmar N, Uszkoreit J, Jones L, Gomez AN, et al. Attention is all you need. In: Advances in Neural Information Processing Systems; 2017 Dec 4–9; Long Beach, CA, USA. p. 6000–10. [Google Scholar]
21. Bei T, Xiao J, Wang X. Transient stability assessment of power systems based on the transformer and neighborhoodrough set. Electronics. 2024;13(2):270. doi:10.3390/electronics13020270. [Google Scholar] [CrossRef]
22. Fang J, Liu C, Zheng L, Su C. A data-driven method for online transient stability monitoring with vision-transformer networks. Int J Electr Power Energy Syst. 2023;149(2):109020. doi:10.1016/j.ijepes.2023.109020. [Google Scholar] [CrossRef]
23. Li Y, Cao J, Xu Y, Zhu L, Dong Z. Deep learning based on Transformer architecture for power system short-term voltage stability assessment with class imbalance. Renew Sustain Energy Rev. 2024;189(4):113913. doi:10.1016/j.rser.2023.113913. [Google Scholar] [CrossRef]
24. Ji L, Wu J, Zhou Y, Hao L. Using trajectory clusters to define the most relevant features for transient stability prediction based on machine learning method. Energies. 2016;9(11):898. doi:10.3390/en9110898. [Google Scholar] [CrossRef]
25. Zhu S, Chen B, Chen Z, Yang P. Asymptotically optimal one- and two-sample testing with kernels. IEEE Trans Inf Theory. 2021;67(4):2074–92. doi:10.1109/TIT.2021.3059267. [Google Scholar] [CrossRef]
26. Zhang K, Wen Q, Zhang C, Cai R, Jin M, Liu Y, et al. Self-supervised learning for time series analysis: taxonomy, progress, and prospects. IEEE Trans Pattern Anal Mach Intell. 2024;46(10):6775–94. doi:10.1109/TPAMI.2024.3387317. [Google Scholar] [PubMed] [CrossRef]
27. Hinton GE, Osindero S, Teh YW. A fast learning algorithm for deep belief nets. Neural Comput. 2006;18(7):1527–54. doi:10.1162/neco.2006.18.7.1527. [Google Scholar] [PubMed] [CrossRef]
Cite This Article
 Copyright © 2025 The Author(s). Published by Tech Science Press.
This work is licensed under a Creative Commons Attribution 4.0 International License , which permits unrestricted use, distribution, and reproduction in any medium, provided the original work is properly cited.
 Downloads
 Citation Tools