
 Submit a Paper
 Propose a Special lssue
 Open Access
ARTICLE

Collaborative State Estimation for Coupled Transmission and Distribution Systems Based on Clustering Analysis and Equivalent Measurement Modeling
1 State Grid Jiangsu Electric Power Co., Ltd., Nanjing, 210024, China
2 College of Electrical and Power Engineering, Hohai University, Nanjing, 211100, China
3 State Grid Jiangsu Electric Power Research Institute, Nanjing, 211103, China
* Corresponding Author: Guoqiang Sun. Email:
Energy Engineering 2025, 122(7), 2977-2992. https://doi.org/10.32604/ee.2025.064206
Received 08 February 2025; Accepted 25 April 2025; Issue published 27 June 2025
 View Full Text
 Download PDF
Abstract
With the continuous expansion of the power system scale and the increasing complexity of operational mode, the interaction between transmission and distribution systems is becoming more and more significant, placing higher requirements on the accuracy and efficiency of the power system state estimation to address the challenge of balancing computational efficiency and estimation accuracy in traditional coupled transmission and distribution state estimation methods, this paper proposes a collaborative state estimation method based on distribution systems state clustering and load model parameter identification. To resolve the scalability issue of coupled transmission and distribution power systems, clustering is first carried out based on the distribution system states. As the data and models of the transmission system and distribution systems are not shared. For the transmission system, equating the power transmitted from the transmission system to the distribution system is the same as equating the distribution system. Further, the power transmitted from the transmission system to different types of distribution systems is equivalent to different polynomial equivalent load models. Then, a parameter identification method is proposed to obtain the parameters of the equivalent load model. Finally, a transmission and distribution collaborative state estimation model is constructed based on the equivalent load model. The results of the numerical analysis show that compared with the traditional master-slave splitting method, the proposed method significantly enhances computational efficiency while maintaining high estimation accuracy.Keywords
Recently, the integration of renewable energy sources, especially wind and solar power, into the power system has witnessed a substantial increase. Distribution systems have evolved from passive systems to active ones, with bidirectional power flows emerging between transmission and distribution systems. This transformation has significantly intensified the interdependence between transmission and distribution systems [1]. With the ongoing growth of the economy, power systems are expanding in scale and complexity, creating a need for more computationally efficient state estimation methods. Privacy concerns hinder the sharing of models and data across dispatch centers [2,3], which complicates direct state estimation for coupled transmission and distribution systems (CTDS). To achieve a unified analysis of the transmission and distribution system, an efficient state estimation method that can provide real-time, accurate system information is urgently needed, thereby ensuring the safe, low-carbon, and stable operation of power systems.
Currently, two methods are commonly used for calculating coordinated power flow and state estimation in traditional power systems [4]. The first method combines transmission and distribution system models for unified calculations, whereas the second method calculates each system independently and coordinates results through interactive mechanisms known as distributed state estimation. Unified calculations face implementation challenges due to the differing management centers and characteristics of transmission and distribution systems. When combined, these systems often result in issues such as large-scale computations and convergence difficulties. Distributed state estimation addresses these challenges effectively and represents a key area of research for achieving collaborative state computations in transmission and distribution systems [5].
Numerous works have extensively studied distributed state estimation methods for CTDS. Ref. [6] proposed a decentralized CTDS state estimation method. Refs. [7,8] introduced the master-slave splitting method, marking the first successful implementation of distributed power flow calculations for CTDS. The method relies on a collaborative model of transmission and distribution systems, where the distribution system is treated as a constant power load during the state estimation of the transmission system and as a constant voltage source during distribution system state estimations. Coordination is achieved through the exchange of boundary node information and iterative calculations, enabling distributed power flow computations for transmission and distribution. While this approach achieves the same level of convergence accuracy as a unified global algorithm [9], it involves repeated master-slave iterations, which result in high computational overhead and reduced efficiency.
Current research on state estimation methods for transmission and distribution coordination primarily addresses two key challenges: algorithm convergence and computational efficiency. Regarding the convergence of the algorithm, as the number of feeders under the same substation increases, the convergence of the master-slave splitting method will deteriorate [7]. The authors of [10] proposed a triangular decomposition method to improve the convergence performance. In [11], a solution was proposed to mitigate pathological divergence by leveraging trust domain principles. Ref. [12] restructured the system model for transmission and distribution state estimation, introducing a traditional synchronization algorithm for CTDS, which, however, failed to accommodate communication delays. Refs. [13,14] elaborated on the mathematical foundation of state estimation for transmission and distribution coordination. They also discussed synchronization algorithms designed for interactive global state estimation in CTDS. Regarding efficiency, Ref. [15] applied the Thevenin equivalence method to enhance situation awareness in transmission and distribution coordination. By adjusting Thevenin equivalence parameters to account for fluctuations in the distribution system, the speed of state estimations was significantly improved. In [16], the authors introduced an adaptive L-M algorithm that leverages graphics processor parallel acceleration technology to greatly enhance the speed and accuracy of large-scale power flow calculations for CTDS greatly. The method presented in [17] developed a power flow fitting function for distribution systems, incorporating voltage and power characteristics. Coordination at boundary points alternates between the fitting results and precise master-slave iteration outputs, reducing computational complexity and minimizing interactions between transmission and distribution systems. However, this method does not account for system fluctuations and changes.
The above discussion indicates that, in the problem of collaborative distributed state estimation for transmission and distribution, when the scale of the transmission and distribution system increases, the time for state estimation of each system will also increase accordingly. In addition, due to the influence of communication conditions, the updated data of the distribution system is likely to be transmitted not in time, resulting in a significant reduction in the convergence speed of the traditional master-slave splitting method and negative impacts on the calculation efficiency. To overcome these weaknesses, this paper proposes a collaborative state estimation method for CTDS with the following contributions.
• A distribution system equivalent model is constructed that represents the power flow from the transmission system as a voltage-dependent polynomial function, significantly reducing the overall computational complexity of the collaborative state estimation while maintaining high accuracy.
• A collaborative state estimation method for CTDS is proposed, based on cluster analysis and equivalent system modeling, which eliminates the requirement for the transmission system to wait for computation results from all connected distribution systems, enhancing the timeliness of collaborative state estimation for CTDS.
2.1 Weighted Least Square Method
The Weighted Least Squares (WLS) method is considered optimal for state estimation when measurement errors follow a Gaussian distribution [18]. This method employs real-time measurement data to iteratively solve the nonlinear model of power systems, utilizing the relationship between measurements and state variables (i.e., the measurement functions) to obtain the system states. The measurement obtained by the measurement system includes branch active and reactive power, injected active and reactive power, and node voltage amplitudes. The state variables include the voltage amplitude and phase angle of each node. Given a known topology and system parameters, the measurement equation can be formulated as follows:
where z is the m-dimensional measurement vector, x is the n-dimensional state vector, h(x) denotes the nonlinear relationship between measurements and state variables, ε represents the measurement error vector. If the measurement errors are independent and follow a zero-mean Gaussian distribution, the maximum likelihood estimation of state variables leads to the following WLS objective function:
where R is the m-dimensional measurement covariance matrix, acting as a weighting factor. The state estimation vector
2.2 Collaborative State Estimation
This study employs the master-slave splitting method to break down the global power system state estimation problem into separate sub-problems for the transmission system and multiple distribution systems [19–21]. This method effectively divides large-scale global analysis into generation, transmission, and smaller distribution system sub-problems, enabling efficient online distributed computing for global analysis.
Node voltage amplitude and phase angle serve as state variables in both transmission and distribution systems. The WLS optimization problem can be decoupled, as illustrated in the following equation:
where the subscripts T and D denote the transmission and distribution systems, respectively. During the state estimation process of the distribution system, the transmission system provides intermediate variables (boundary node voltage amplitudes) for iteration to capture its influence. For the state estimation of the transmission system, the distribution system supplies boundary node states (line power) to define the state of the transmission system. The boundary state variable is denoted by xB. The iterative process of the master-slave splitting method is as follows:
(1) The boundary state
(2) Determine the operational state
(3) Utilize the updated boundary state
(4) Check if the difference in boundary state variables
The iterative process involving alternating calculations between the transmission system and the distribution system is termed a master-slave iteration, with k representing the iteration count.
3 Collaborative State Estimation Based on Equivalent Pseudo Measurement
In the traditional master–slave-splitting method, the transmission and distribution systems interact until the boundary state converges. However, in practical applications, the inherent complexity and large-scale nature of distribution systems lead to a significant decline in the convergence speed of traditional state estimation methods as the power system continues to expand. This paper proposes an alternative method where the power transferred from the transmission system to the distribution system is treated as an equivalent load model linked to a boundary node. By matching real-time distribution system data, equivalent load pseudo-measurements are generated and sent to the transmission system for state estimation [22,23]. The distribution system then uses the estimated boundary node voltage amplitude of the transmission system as a pseudo-measurement for its state estimation. This approach will be referred to as the equivalent method. The entire calculation process is illustrated in Fig. 1.

Figure 1: Flowchart of the proposed collaborative state estimation method
In the offline stage, historical operational data from the distribution system is clustered using the k-means algorithm, grouping the data into several typical operational states. For each state, a polynomial load model is constructed, and its parameters are identified using the corresponding historical data set. This process employs the least squares method to build a database of load models for different operational states.
In the online stage, measurement data from the transmission and distribution systems is collected to determine the operational state of the distribution system. Based on this classification, the transmission system retrieves appropriate load model parameters from the database and computes equivalent load pseudo-measurements using the boundary voltage measurements. This enables state estimation for the transmission system, yielding state information for both the transmission system and its boundary points. The boundary state information is then sent to the distribution system. The distribution system uses the boundary node data as pseudo-measurements for its state estimation. This process facilitates determining the operational state of the CTDS. State estimation for both systems is carried out using the weighted least squares method.
In practical power systems, the distribution system is significantly larger in scale than the transmission system. The proposed method simplifies the state estimation of the distribution system through equivalent processing, thereby substantially reducing the computational effort required for coordinated state estimation of the CTDS.
The first step of the proposed method involves performing cluster analysis on the historical states of the distribution system. Since load fluctuations in the distribution system are prominently reflected in the power injections, the historical data of power injections is clustered using the k-means algorithm. The k-means algorithm groups data based on sample similarity by calculating the Euclidean distance between data points and cluster centers in the feature space. The Euclidean distance formula is formulated as follows:
where x represents the data object, which corresponds to the power injection as part of the operational state variables for each time interval of the distribution system; Ci denotes the ith cluster center; m is the dimension of the data object (i.e., the dimensions of the power injection); xj is the power injection state of the jth node, and Cij is the jth attribute value of Ci, corresponding to xj.
Initially, k centroids are chosen as clustering centers. The value of k can either be predetermined based on specific requirements or calculated using metrics such as the silhouette coefficient and the Davies-Bouldin Index (DBI). This paper utilizes the DBI to determine the optimal number of clusters, which is defined as follows:
where
The DBI coefficient is first computed from historical data to determine the optimal number of clusters k. Subsequently, k-means clustering is applied to group the historical operational states of the distribution system into k categories. The resulting clustered state data serves as a foundation for identifying load model parameters in later steps.
3.2 Equivalent Load Model Identification
The second step of the proposed method involves identifying the load model for each state type to enable subsequent equivalent processing. The core concept of load modeling is to consider all loads at a modeling node as a single entity. By recording historical power and voltage curves using load characteristic acquisition devices in the system, the load model and its parameters are determined through system identification techniques [24,25].
In this approach, the line power transferred from the transmission system to the distribution system is treated as an equivalent load model for the transmission system, dependent on the boundary node voltage. The quadratic polynomial model is used for the load, and state estimation is performed by constructing pseudo-measurements based on this model. Under steady-state conditions, the static model of load describes the relationship between the power consumed by load and node voltage and frequency. It is usually a set of algebraic equations of power (i.e., active power P and reactive power Q) between node voltage (i.e., U) and frequency (i.e., f). This form can be expressed in either polynomial form or power function form, depending on the requirements [26,27]. In real-world power systems, frequency variations are much smaller compared to voltage variations, allowing the effect of frequency on load power to be neglected. Consequently, the basic quadratic polynomial form of the static load model can be formulated as:
where U0, Ps0, and Qs0 represent the rated voltage of the equivalent load node, and the active and reactive power of the load under rated voltage, respectively, ap, bp, and cp are the active power coefficients in the polynomial load model, representing the components of active power related to the square of the voltage, the first power of the voltage, and independent of the voltage, respectively. Similarly, aq, bq, and cq are the corresponding reactive power coefficients.
For each category of historical data, the 10% of data points closest to the cluster center are selected as the typical data set for that category. The ratio here is only a set value, which can be adjusted according to the actual situation. The least squares method is then applied to identify the load model parameters for these typical data sets [28]. In this context, the typical data set includes an independent variable vector X and a dependent variable vector Y, which correspond to the node voltage and load power, respectively, in the load model. It is assumed that a mapping relationship exists between the dependent variable vector Y and the n-dimensional independent variable vector
where a represents the coefficient vector to be determined. The goal of parameter identification is to find the optimal set of coefficients that satisfy the following objective function:
The optimal values of the parameters can be obtained by directly solving the following equation, which is the identification result of the load model parameters.
3.3 Collaborative State Estimation Based on Equivalent Pseudo Measurement
This paper employs a quadratic polynomial model for load equivalents. When the influence of frequency is ignored, the model is expressed as follows:
where U, P, and Q are unit values. In Formula (7), U corresponds to the independent variable X, while Peq and Qeq correspond to the dependent variable Y, the parameters a, b, and c are parameters to be identified.
When a segment measurement is obtained, the transmission system computes the equivalent load pseudo-measurements for all boundary nodes connected to the distribution system based on the voltage measurements at the boundary nodes. In particular, Peq and Qeq are substituted into the power injection values within the measurement vector z from (1). The state estimation is then performed by solving the optimization problem described in (2), yielding the state variables for the boundary nodes. The distribution system subsequently determines the boundary node states (i.e., the voltage amplitude), and uses this as the pseudo-measurement for the root node. This process enables the determination of the operational state of the CTDS.
4.1 Experimental Configuration
In the simulations, the 30-node test system standardized by the Institute of Electrical and Electronics Engineers (IEEE) is chosen as the transmission system. The 23rd, 24th, 26th, 29th, and 30th nodes serve as boundary nodes linking the transmission system to the IEEE 33-node distribution system. The corresponding system topologies are depicted in Fig. 2. The blue network is the transmission system and the red network is the distribution system.

Figure 2: Topology of CTDS (The red circle mark represents the boundary node connecting the transmission system and distribution system)
In the modeling process, the root node of the distribution system is considered equivalent to the load node of the transmission system. To preserve the original operating conditions of the transmission system, the power supplied to the distribution system is adjusted to align closely with the original load of the transmission system. This is achieved by scaling the total power of the distribution system using a scaling factor
4.2 Simulation Parameter Settings
In this approach, the loads of each distribution system are adjusted by multiplying them by factors of 0.8, 0.9, 1.0, 1.1, and 1.2 to create five distinct operating states. Measurement data are generated by introducing Gaussian white noise to the real values obtained from each operational state. The measurements are fully configured. The standard deviations for power and voltage are set to 0.01 p.u. and 0.005 p.u., respectively. For each operating state, 200 data samples are created, resulting in a cumulative total of 1000 samples.
K-means clustering is applied to the power injection measurement data from 1000 samples of the distribution system. The ideal number of clusters is determined prior to the clustering process. From each cluster, 10% of the sample data closest to the cluster center are selected from the historical data. This subset serves as the representative dataset for identifying load model parameters.
The power flow transferred from the transmission system to the distribution system is modeled as an equivalent representation of the transmission system load, influenced by the voltage at the boundary node. The parameters of this model are estimated using the least squares method on a representative dataset. In this analysis, the boundary node voltage amplitude serves as the independent variable, while the transferred line power functions as the dependent variable. The clustering outcomes for the power data are illustrated in Figs. 3 and 4. In these figures, the red points represent the power measurements at the boundary branches (vertical axis) alongside their corresponding boundary voltage amplitudes (horizontal axis) for each historical section. Each green curve represents the equivalent load model for a specific operational state of the distribution system. With five operational states across five distribution systems, a total of 25 fitted curves are generated. The figure demonstrates that the load curves align well with the various operational states of the distribution system. This alignment confirms the accuracy of the equivalent load model and parameter identification, laying the groundwork for the subsequent generation of equivalent pseudo-metrics.

Figure 3: Comparison of active power clustering and fitting results

Figure 4: Comparison of reactive power clustering and fitting results
The fitted curves of the equivalent load model are shown in Figs. 5 and 6, encompassing all states across the distribution systems with voltage amplitudes and power flows. Each curve represents a specific operational state of the equivalent load model. A wider curve indicates smoother conditions with smaller load fluctuations, while a narrower curve represents larger load fluctuations.

Figure 5: Equivalent load model curve of active power for each distribution system

Figure 6: Equivalent load model curve of reactive power for each distribution system
In real-time calculations, once the distribution system measurement data is collected, the Euclidean distance is computed between the current section data and each cluster center to identify the corresponding category of the current section. Subsequently, the relevant load model parameters (ap, bp, cp; aq, bq, cq) are retrieved from the database, and the equivalent load pseudo-measurement is calculated to collaborative state estimation. Finally, the voltage amplitude of the CTDS is obtained, as illustrated in Fig. 7. Fig. 8 further presents the errors between the estimated and real voltage amplitudes. Fig. 9 shows the estimated phase angle, while Fig. 10 illustrates the errors between the estimated and real phase angle. These results indicate that the calculations for both voltage amplitude and phase angle closely approximate the real values, with estimation errors within the range of 10−3, thus satisfying the accuracy requirements.
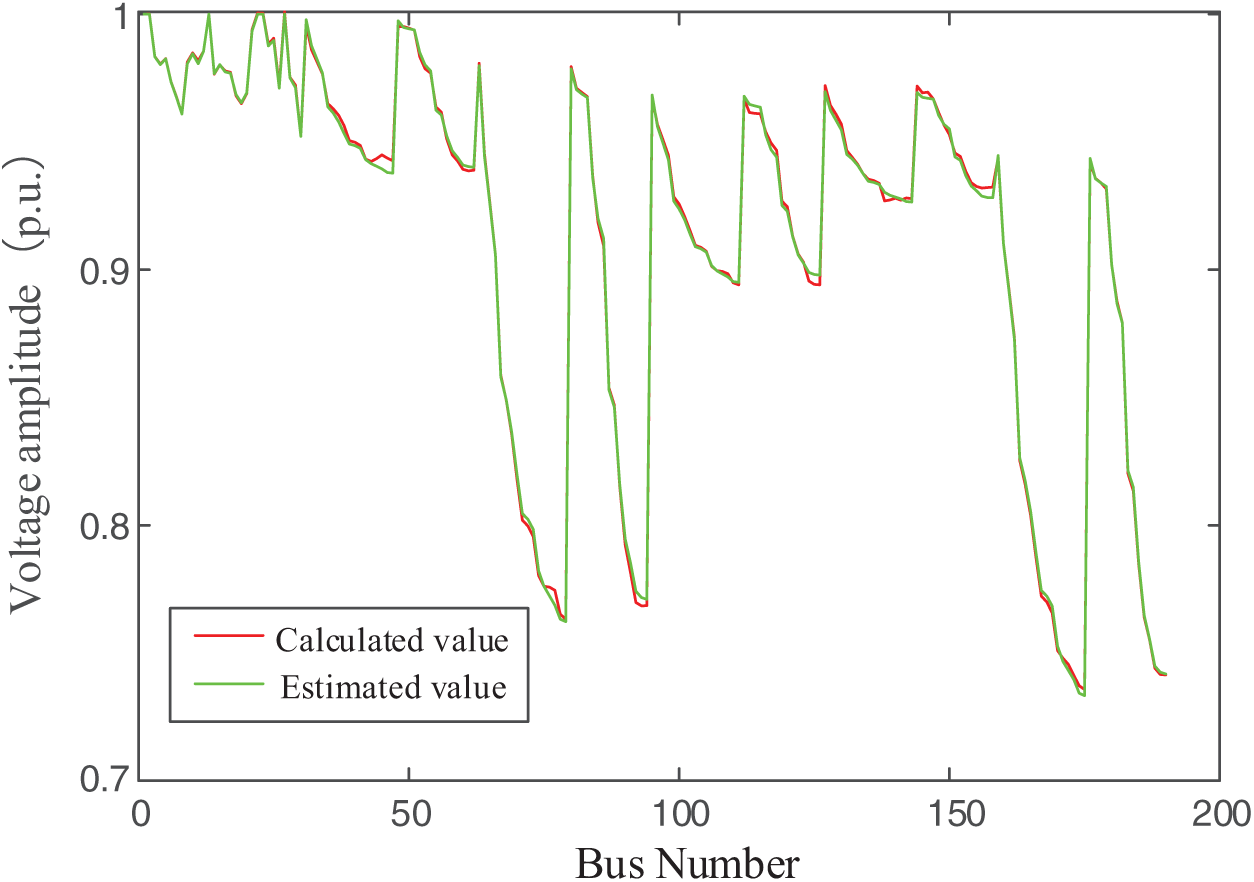
Figure 7: Estimation results of voltage amplitude for CTDS

Figure 8: Voltage amplitude estimation error for CTDS
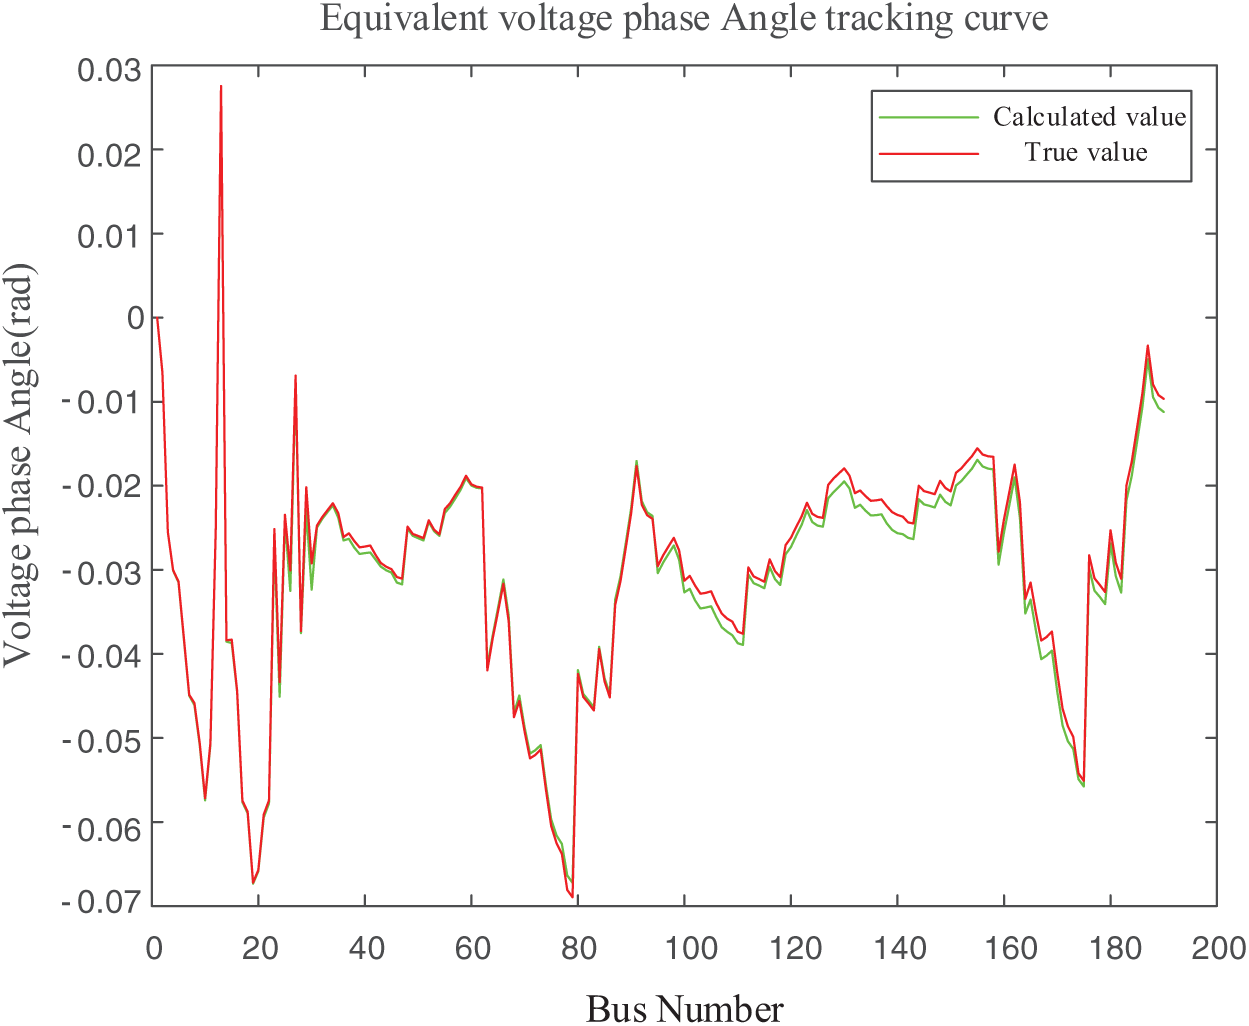
Figure 9: Estimation results of phase angle for CTDS

Figure 10: Phase angle estimation error for CTDS
The proposed method is evaluated against the traditional state estimation approach [5], which uses the master-slave splitting method. A key distinction lies in how each method processes information at the system boundaries. Fig. 11 displays the estimated voltage amplitude at each boundary node. A comparison of the results from both methods shows that the voltage amplitude obtained through the equivalence method closely aligns with that estimated by the master-slave splitting method, both approximating the real value effectively.

Figure 11: Estimation results of voltage amplitude at boundary nodes
To assess estimation accuracy, the Mean Absolute Error (MAE) is utilized to compare the two methods, which is defined as:
where n is the number of states, y is the real value,
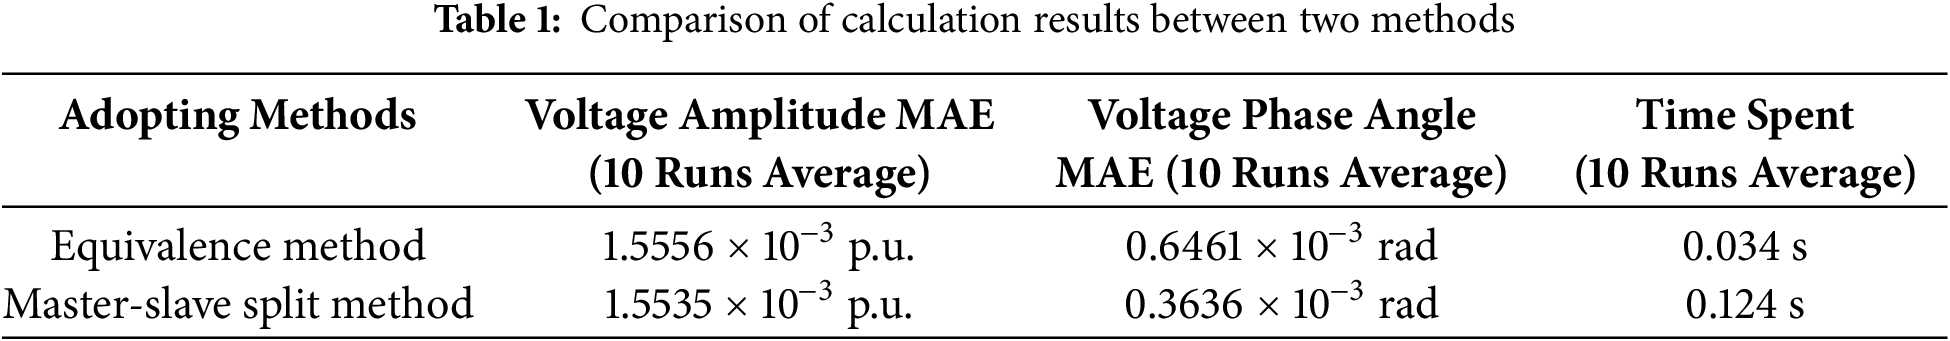
In summary, the accuracy of the proposed method is nearly as accurate as the traditional master-slave splitting method, while offering a significant increase in computational efficiency. In real-world applications, the proposed method preserves both the accuracy and real-time monitoring capabilities for the CTDS, thereby facilitating timely control and decision-making processes.
This paper proposes a state estimation method for the CTDS based on equivalent pseudo measurements. The method constructs an equivalent load model database through clustering analysis and parameter identification in the offline stage and then matches the operating states of each distribution system with the load model database in the real-time calculation stage to carry out equivalent-based transmission and distribution collaborative state estimation, thereby obtaining the real-time and accurate state of the CTDS. The proposed method reduces the execution times of the distribution system and the interaction times between the transmission and distribution systems through equivalent processing. The simulations carried out on the IEEE 30 node transmission system and the IEEE 33 node distribution system show that compared with the traditional master-slave splitting method, the proposed method significantly improves the computational efficiency while maintaining a similar accuracy level.
However, in the process of real-time type judgment of distribution system, this paper does not consider the inaccurate type matching caused by the missing measurement data of distribution system, which can be improved from the in-depth study of cluster analysis method in the future.
Acknowledgement: None.
Funding Statement: This research was funded by State Grid Jiangsu Electric Power Co., Ltd. Technology Project (J2023121).
Author Contributions: Study conception and design: Hao Jiao, Guoqiang Sun; Data collection: Chen Wu, Chunlei Xu, Zhijun Zhou, Ye Chen; Analysis and interpretation of results: Xinyu Liu, Chen Wu, Chunlei Xu, Zhijun Zhou, Ye Chen; Draft manuscript preparation: Xinyu Liu. All authors reviewed the results and approved the final version of the manuscript.
Availability of Data and Materials: The data that support the findings of this study are available from the corresponding author, Guoqiang Sun, upon reasonable request.
Ethics Approval: Not applicable.
Conflicts of Interest: The authors declare no conflicts of interest to report regarding the present study.
Glossary
| z | M-dimensional measurement vector |
| x | n-dimensional state vector |
| h | Nonlinear relationship between measurements and state variables |
| e | Measurement error vector |
| R | M-dimensional measurement covariance matrix |
| J | Optimization problem objective function |
| T | Transmission |
| D | Distribution |
| B | Boundary |
| k | Iteration count |
| Ci | The ith cluster center |
| m | The dimension of the data object |
| Cij | The jth attribute value of Ci |
| K | The number of clusters |
| The value of the DBI coefficient | |
| The average distance from the sample in the ith category to its cluster center | |
| The category center distance of the ith and jth categories | |
| U0 | The rated voltage of the equivalent load node |
| Ps0 | The active power of the load under rated voltage |
| Qs0 | The reactive power of the load under rated voltage |
| ap, bp, and cp | The active power coefficients in the polynomial load model |
| aq, bq, and cq | The corresponding reactive power coefficients |
| X | Independent variable vector of the typical data set |
| Y | Dependent variable vector of the typical data set |
| Sd | The load power at the transmission system connection point |
| SG | The power at the root node of the distribution system |
| Pd | The real parts of load power, respectively |
| Qd | The imaginary parts of load power, respectively |
| kp | The scaling factors for active power |
| kq | The scaling factors for reactive power |
| n | The number of states |
| The estimated value | |
| y | The real value |
References
1. Jain H, Rahimi K, Tbaileh A, Broadwater RP, Jain AK, Dilek M. Integrated transmission & distribution system modeling and analysis: need & advantages. In: Proceedings of the 2016 IEEE Power and Energy Society General Meeting (PESGM); 2016 Jul 17–21; Boston, MA, USA. [Google Scholar]
2. Wang M, Chang NC, Wang L, Chen ZY, Lu Y, Chen XJ, et al. Architecture of network analysis service based on dispatching and control cloud. Power Syst Technol. 2018;42(8):2659–65 (In Chinese). [Google Scholar]
3. Zheng ZQ, Han B, Shan X, Su DW, Zhao JQ, Xu X. Analysis on key technologies for coordinated operation of advanced application software in transmission and distribution network. Autom of Electr Power Syst. 2017;41(6):122–8 (In Chinese). [Google Scholar]
4. Li Z, Wang J, Sun HB, Guo Q. Transmission contingency analysis based on integrated transmission and distribution power flow in smart grid. IEEE Trans Power Syst. 2015;30(6):3356–67. doi:10.1109/TPWRS.2014.2381879. [Google Scholar] [CrossRef]
5. Wang Z, Chen G, Li HQ. An efficient distributed algorithm for economic dispatch considering communication asynchrony and time delays. Energy Convers Econ. 2022;3(4):214–26. doi:10.1049/enc2.12061. [Google Scholar] [CrossRef]
6. Zhang Y, Chen YB, Wang JH, Meng Y, Zhao TQ. Decentralized coordinated state estimation in integrated transmission and distribution systems. In: Proceedings of the 2022 IEEE Power & Energy Society Innovative Smart Grid Technologies Conference (ISGT); 2022 Apr 24–28; New Orleans, LA, USA. [Google Scholar]
7. Sun HB, Guo Q, Zhang BM, Guo Y, Li Z, Wang J. Master-slave-splitting based distributed global power flow method for integrated transmission and distribution analysis. IEEE Trans Smart Grid. 2015;6(3):1484–92. doi:10.1109/TSG.2014.2336810. [Google Scholar] [CrossRef]
8. Li ZS, Sun HB, Guo QL. Generalized master-slave-splitting method and application to transmission-distribution coordinated energy management. IEEE Trans Power Syst. 2019;34(6):5169–83. doi:10.1109/TPWRS.2018.2890169. [Google Scholar] [CrossRef]
9. Tang KJ, Dong SF, Song Y. Successive-intersection-approximation-based power flow method for integrated transmission and distribution networks. IEEE Trans Power Syst. 2020;35(6):4836–46. doi:10.1109/TPWRS.2020.2994312. [Google Scholar] [CrossRef]
10. Korres GN. A robust algorithm for power system state estimation with equality constraints. IEEE Trans Power Syst. 2010;25(3):1531–41. doi:10.1109/TPWRS.2010.2041676. [Google Scholar] [CrossRef]
11. Seshadri SKV, Dhadbanjan T. State estimation in power systems using linear model infinity norm-based trust region approach. IET Gener Transm Dis. 2010;7(5):500–10. [Google Scholar]
12. Tang KJ, Dong SF, Ma X. Heterogeneous-decomposition-based coordinated optimisation for integrated transmission and distribution networks considering communication conditions. IET Gener Transm Dis. 2020;14(13):2558–65. doi:10.1049/iet-gtd.2019.1772. [Google Scholar] [CrossRef]
13. Sun HB, Zhang BM. Global state estimation for whole transmission and distribution networks. Electr Power Syst Res. 2004;74(2):187–95. doi:10.1016/j.epsr.2004.10.011. [Google Scholar] [CrossRef]
14. Ali RA, Ali RS. A new coordinated approach to state estimation in integrated power systems. Int J Electr Power Energy Syst. 2013;45(1):152–8. doi:10.1016/j.ijepes.2012.08.058. [Google Scholar] [CrossRef]
15. Yun ZH, Cui XH, Ma KG. Online thevenin equivalent parameter identification method of large power grids using LU factorization. IEEE Trans Power Syst. 2019;34(6):4464–75. doi:10.1109/TPWRS.2019.2920994. [Google Scholar] [CrossRef]
16. Housos EC, Irisarri G, Porter RM, Sasson AM. Steady state network equivalents for power system planning applications. IEEE Trans Power Apparatus Syst. 1980;PAS-99(6):2113–20. doi:10.1109/TPAS.1980.319789. [Google Scholar] [CrossRef]
17. Lrisarri G, Sasson AM, Dopazo JF. Real-time external system equivalent for on-line contingency analysis. IEEE Trans Power Apparatus Syst. 2007;PAS-98(6):2153–71. doi:10.1109/TPAS.1979.319415. [Google Scholar] [CrossRef]
18. Abur A, Expósito GA. Power system state estimation. Boca Raton, FL, USA: CRC Press; 2004. 346 p. [Google Scholar]
19. Fan GS, Lin SJ, Feng XY, Wang Q, Liu MB. Stochastic economic dispatch of integrated transmission and distribution networks using distributed approximate dynamic programming. IEEE Syst J. 2022;16(40):5985–96. doi:10.1109/JSYST.2022.3158959. [Google Scholar] [CrossRef]
20. Tang KJ, Dong SF, Song Y. A least-squares-based iterative method with better convergence for PF/OPF in integrated transmission and distribution networks. CSEE J Power Energy Syst. 2024;10(3):953–62. doi:10.17775/CSEEJPES.2021.03680. [Google Scholar] [CrossRef]
21. Zhao JQ, Fan XL, Lin CN, Wei WH. Distributed continuation power flow method for integrated transmission and active distribution network. J Mod Power Syst Clean Energy. 2015;3(4):573–82. doi:10.1007/s40565-015-0167-2. [Google Scholar] [CrossRef]
22. Xu DL, Xu JJ, Qian C, Wu ZJ, Hu QR. A pseudo-measurement modelling strategy for active distribution networks considering uncertainty of DGs. Prot Control Mod Power Syst. 2024;9(5):1–15. doi:10.23919/PCMP.2023.000189. [Google Scholar] [CrossRef]
23. Wang YJ, Gu J, Yuan L. Distribution network state estimation based on attention-enhanced recurrent neural network pseudo-measurement modeling. Prot Control Mod Power Syst. 2023;8(2):1–16. doi:10.1186/s41601-023-00306-w. [Google Scholar] [CrossRef]
24. Gulakhmadov A, Tavlintsev A, Pankratov A, Suvorov A, Kovaleva A, Lipnitskiy I. A statistical-based approach to load model parameter identification. IEEE Access. 2021;9:66915–28. doi:10.1109/ACCESS.2021.3076690. [Google Scholar] [CrossRef]
25. Knyazkin V, Canizares CA, Soder LH. On the parameter estimation and modeling of aggregate power system loads. IEEE Trans Power Syst. 2004;19(2):1023–31. doi:10.1109/TPWRS.2003.821634. [Google Scholar] [CrossRef]
26. Choi BK, Chiang HD, Li YH, Li H, Chen YT, Huang DH, et al. Measurement-based dynamic load models: derivation, comparison, and validation. IEEE Trans Power Syst. 2006;21(3):1276–83. doi:10.1109/TPWRS.2006.876700. [Google Scholar] [CrossRef]
27. Ma ZX, Wang ZY, Wang YS, Diao RS, Shi D. Mathematical representation of WECC composite load model. J Mod Power Syst Clean Energy. 2020;8(5):1015–23. doi:10.35833/MPCE.2019.000296. [Google Scholar] [CrossRef]
28. Wang C, Wang ZY, Wang JH, Zhao DB. SVM-based parameter identification for composite ZIP and electronic load modeling. IEEE Trans Power Syst. 2019;34(1):182–93. doi:10.1109/TPWRS.2018.2865966. [Google Scholar] [CrossRef]
Cite This Article
 Copyright © 2025 The Author(s). Published by Tech Science Press.
This work is licensed under a Creative Commons Attribution 4.0 International License , which permits unrestricted use, distribution, and reproduction in any medium, provided the original work is properly cited.
 Downloads
 Citation Tools