
 Submit a Paper
 Propose a Special lssue
 Open Access
ARTICLE

Forecasting Solar Energy Production across Multiple Sites Using Deep Learning
1 Department of Computer Science, Research in Optimization, Emerging Systems, Networks and Imaging Laboratory (LAROSERI), Faculty of Sciences, University of Chouaib Doukkali, El Jadida, 24000, Morocco
2 Laboratory of Energy Science Engineering (LabSipe), National School of Applied Sciences, University of Chouaib Doukkali, El Jadida, 24000, Morocco
3 Laboratory of Information Technologies (LTI), National School of Applied Sciences, University of Chouaib Doukkali, El Jadida, 24000, Morocco
* Corresponding Author: Samira Marhraoui. Email:
(This article belongs to the Special Issue: Modelling, Optimisation and Forecasting of Photovoltaic and Photovoltaic thermal System Energy Production)
Energy Engineering 2025, 122(7), 2653-2672. https://doi.org/10.32604/ee.2025.064498
Received 17 February 2025; Accepted 09 May 2025; Issue published 27 June 2025
 View Full Text
 Download PDF
Abstract
Photovoltaic (PV) power forecasting is essential for balancing energy supply and demand in renewable energy systems. However, the performance of PV panels varies across different technologies due to differences in efficiency and how they process solar radiation. This study evaluates the effectiveness of deep learning models in predicting PV power generation for three panel technologies: Hybrid-Si, Mono-Si, and Poly-Si, across three forecasting horizons: 1-step, 12-step, and 24-step. Among the tested models, the Convolutional Neural Network—Long Short-Term Memory (CNN-LSTM) architecture exhibited superior performance, particularly for the 24-step horizon, achieving R2 = 0.9793 and MAE = 0.0162 for the Poly-Si array, followed by Mono-Si (R2 = 0.9768) and Hybrid-Si arrays (R2 = 0.9769). These findings demonstrate that the CNN-LSTM model can provide accurate and reliable PV power predictions for all studied technologies. By identifying the most suitable predictive model for each panel technology, this study contributes to optimizing PV power forecasting and improving energy management strategies.Keywords
Solar photovoltaic (PV) energy plays a crucial role in developing cleaner energy systems. As global energy demand continues to rise and the need to reduce greenhouse gas emissions becomes more urgent, solar PV energy is emerging as a clean, renewable, and abundant source [1]. PV technology is being rapidly adopted due to its low operational costs and versatility, allowing integration into residential, industrial, and large-scale applications. However, solar power generation faces significant challenges, particularly its intermittency. PV production depends heavily on fluctuating weather conditions, such as sunshine, temperature, and cloud cover [2]. Furthermore, the performance of PV panels varies based on the technology used, the quality of the materials, and their efficiency in converting solar energy [3]. We will be able to overcome the effect of panel temperature by using nanofluids to improve heat dissipation and maintain panel efficiency [4]. In addition, the integration of aluminum reflectors and latent heat storage units has been shown to improve the thermodynamic and economic efficiency of photovoltaic panels through passive cooling mechanisms [5]. These advances help mitigate efficiency losses due to temperature fluctuations and improve overall energy yield. While fluctuating weather conditions, such as sunshine, temperature, and cloud cover, remain unpredictable, these factors complicate energy production forecasting, making it more difficult to maintain prediction accuracy across panels with different technologies. Each technology has a unique efficiency and converts sunlight differently, resulting in varying power outputs. In this context, it is essential to develop accurate and reliable models that can efficiently predict PV power.
Deep learning techniques have proven highly effective in forecasting PV power [6]. By processing large amounts of complex data, these models can capture the nonlinear relationships between meteorological variables and solar panel performance [7]. Architectures such as convolutional neural networks (CNNs) for spatial feature extraction [8], long short-term memory (LSTM) networks for modeling temporal dependencies [9,10], and gated recurrent units (GRUs) for enhancing computational efficiency offer robust solutions for predicting production variations [11]. Furthermore, hybrid models such as CNN-LSTM and CNN-GRU combine the advantages of both approaches, efficiently capturing spatial and temporal features [12,13].
This study proposes a comparative approach of several deep learning models (LSTM, GRU, one-dimensional (1D) CNN, CNN-LSTM, and LSTM with attention) applied to three PV panel sites of different technologies (hybrid, monocrystalline, and polycrystalline) [14]. These sites are located in the same geographical area, in order to eliminate the impact of climate conditions [15]. Each type of panel has characteristics that directly influence production: hybrid panels are characterized by good absorption of the solar spectrum [16], monocrystalline panels offer high performance under direct sunlight, but are sensitive to light variations, while polycrystalline panels, although less efficient, ensure more stable production under variable conditions [17]. This study aims to identify the PV technology that achieves the highest forecasting performance and determine the most suitable deep learning model for each technology. Unlike existing studies, which typically evaluate a single type of predictive model or PV technology, our approach is based on:
1. A cross-comparison between several PV technologies and various deep learning models (LSTM, GRU, 1D CNN, CNN-LSTM, CNN-GRU);
2. An analysis of the performance of each model on each technology to identify the most accurate and robust associations for energy forecasting;
3. Hyperparameter optimization using GridSearch [18] to identify the best configurations for each model, thus improving their predictive performance;
4. The exploration of the impact of the forecast horizon by evaluating three time scales: a 5-min forecast (one-step), a one-hour forecast (12 steps), and a two-hour forecast (24 steps). This analysis makes it possible to observe the evolution of model accuracy as a function of forecast duration and to evaluate their ability to adapt to temporal variations;
This study thus aims to provide strategic recommendations on the choice of the optimal model based on the PV technology used. Therefore, contributing to better management of renewable energies and improving the stability of the electricity grid.
The remainder of this paper is structured as follows: Section 2 presents a detailed literature review on PV power forecasting, including various prediction models. Section 3 describes the experimental setup designed to achieve the study’s objectives. Section 4 discusses the results in detail. Finally, the conclusion summarizes the key findings and outlines potential future research directions.
To improve PV energy forecasting, recent studies have examined different combinations of deep learning models. For instance, authors in [19] introduced the CNN-GRU-Attention model by integrating CNN, which captures the spatial features of the data, GRU to capture the temporal features, and an attention mechanism that serves to highlight important features. Similarly, [20] proposed a hybrid model combining CNN and LSTM, optimized using a Bayesian approach. Their results demonstrated improved accuracy for short-term forecasts. Another work [21] proposed Theory-Guided Attention-based CNN-LSTM (TG-A-CNN-LSTM), a hybrid approach to predict the PV power generation in different regions. The model incorporates relevant theoretical knowledge of solar energy to enhance prediction accuracy while maintaining physical interpretability. The model utilizes CNN to capture spatial correlations across different regions and employs LSTM networks to represent temporal dependencies in time series data. Additionally, an attention mechanism is integrated to assign weights to temporal data based on its significance. Experimental results demonstrate the model’s superior accuracy Root Mean Squared Error (RMSE): 11.07, Mean Absolute Error (MAE): 4.98, R2: 0.94), outperforming conventional models. Notably, the TG-A-CNN-LSTM approach also exhibits enhanced robustness to limited data, highlighting its applicability in multi-region settings, where climate variability poses significant modeling challenges.
In [22], the authors proposed a hybrid model combining CNN, Bidirectional Long Short-Term Memory (BiLSTM), and an attention mechanism for short-term PV power prediction. The CNN extracts spatial features from the time series, while the BiLSTM captures bidirectional dependencies. Additionally, the attention mechanism highlights the most relevant information. The results demonstrate improved performance, with an MAE of 18.49 kW and an RMSE of 20.70 kW. Furthermore, the high coefficient of determination (R2 = 0.9913) indicates an excellent fit between predicted and actual values, significantly outperforming eight other deep learning models used for comparison.
An enhanced model for multi-step PV energy prediction, based on an LSTM network integrated with an attention mechanism, was proposed in [23]. This model leverages forecasted weather data to improve prediction accuracy. Experimental results on real-world data from Japan demonstrate its significant superiority over other methods. Specifically, R2 improved by 26.4%, while RMSE and MAE were reduced to 0.651 and 0.306 kW, respectively. As a robust solution for both short- and long-term forecasting, the model effectively captures temporal relationships and multivariate correlations within time series data.
In [24], short-term PV generation forecasting was conducted using three deep neural network models: Bi-LSTM, GRU, and 1D-CNN. The study focused on a grid-connected amorphous silicon-based PV system located in Errachidia, Morocco. Performance evaluation revealed that the Bi-LSTM and GRU models achieved similar results in terms of RMSE, MAE, and R2, with a daytime forecast correlation ranging from 96.9% to 97.2%. The 1D-CNN model exhibited superior accuracy only in the second scenario, which included only daytime values but performed worse than the Bi-LSTM and GRU models in both scenarios overall. The RMSE for the Bi-LSTM and GRU models was approximately 0.088 kW, while the 1D-CNN model had an RMSE of 0.091 kW. These findings highlight the effectiveness of neural network models in improving PV energy forecasting while also underscoring the challenges posed by partly cloudy conditions.
An optimized hybrid BiGRU model for short-term PV production prediction was proposed in [25]. Feature selection was performed by processing the signals with the LOWESS (Locally Weighted Scatterplot Smoothing) method for data smoothing, followed by the use of the Pearson correlation coefficient (PCC) and Random Forest for feature selection. The main prediction model employed a BiGRU neural network with an attention mechanism and a CNN layer to capture the relevant features of the data. This model improves prediction accuracy and robustness through the ensemble bagging algorithm. Experimental results, conducted in parallel at two locations (Shanghai, China, and Alice Springs, Australia), demonstrated that the model outperformed other commonly used forecasting models, with a nearly 60.4% reduction in mean square error (MSE), alongside an MAE of 0.28 kW and RMSE of 0.37 kW. The results suggest that the model enhances the accuracy and stability of PV forecasts, particularly under conditions of frequent weather changes.
An enhancement of LSTM models for forecasting daily PV generation, named LSTM-BOA (Bayesian Optimization Algorithm), was presented in Reference [26] by combining data preprocessing and Bayesian hyperparameter optimization. This way, the key hyperparameters of the LSTM model get fine-tuned, which improves the forecast accuracy. A comparison of the prediction performance of the LSTM-BOA method vs. other methods shows that it produces the smallest mean absolute error (MAE) of 0.0117 MW, root-mean-square error (RMSE) of 0.0145 MW, and R2 value of 0.9945. According to the results, the LSTM-BOA model was especially accurate when estimating during good weather conditions, for example, sunny days with an MAE of 0.0041 MW and R2 of 0.9989. The results from the optimization show that Bayesian hyperparameter optimization clearly enhances the performance of LSTM models for use with the PF algorithm under a variety of conditions.
Authors in [25] propose a deep learning method for ultra-short-term forecasting of PV power generation. They introduced a GRU network-based model with dual-attention and Encoder-Decoder architecture to predict power generation 2 h ahead. In comparison with conventional models, such as neural networks and machine learning models, the DA-GRU algorithm demonstrated superior performance. For a single-step forecast (15 min ahead), the model achieved an RMSE of 1.886 kW, an MAE of 0.598 kW, and an RMSE of 4.01%. It outperformed methods like CNN-LSTM, XGBoost, and random forests, especially in multi-step forecasting. The results of the DA-GRU model for very short-term PV production forecasting highlight its technical contributions in improving accuracy and managing energy systems.
While these studies have achieved significant advancements in forecasting PV generation using deep learning models, they have not fully explored how different PV technologies influence the accuracy of predictive models. Specifically, hybrid, monocrystalline, and polycrystalline panels exhibit distinct characteristics that make them more or less responsive to environmental conditions. Our study aims to fill this gap by conducting a deeper comparative analysis of various deep learning models, taking into account the different technologies of the panels used across different forecasting horizons, making our research unique. This analysis not only enhances the accuracy of solar energy predictions based on the technical specifications of the panels but also provides a clearer understanding of panel characteristics for improved model predictions.
The models used in this study are LSTM, CNN, GRU, and LSTM-CNN, as they have demonstrated promising performance in the literature. These models will be compared using Hybrid-Si, Mono-Si, and Poly-Si panel technologies, which are among the most commonly used in the literature due to their favorable cost-to-efficiency ratio. The models will be evaluated across different forecasting horizons, ranging from 5 min to 2 h.
LSTM can be considered a specialized type of RNN, designed to address the limitations of classical RNNs, which struggle to maintain long-term temporal dependencies. The LSTM architecture includes regulation mechanisms (input, forget, and output gates) that allow it to retain or discard information over long sequences, thus avoiding the vanishing gradient problem commonly encountered in traditional RNNs [8]. This ability to retain relevant past information makes LSTM an ideal choice for time series forecasting, where prior occurrences must be considered when making future predictions, such as in energy generation forecasting, where weather fluctuations are common [10]. A detailed architecture of LSTM, including its internal mechanisms, is shown in Fig. 1.
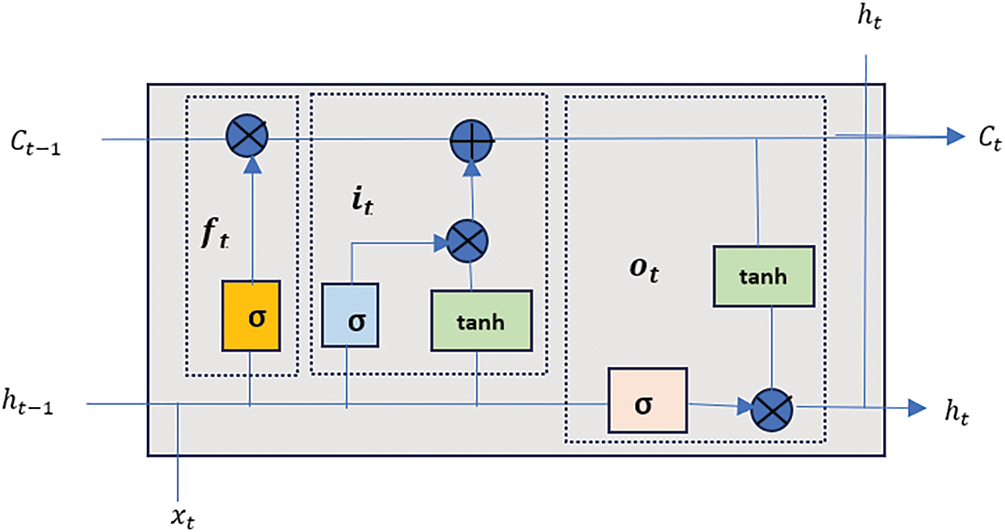
Figure 1: Architecture of the LSTM model
GRU which is a simpler version of the LSTM architecture that captures long-temporal dependencies while being more lightweight. GRU differs from LSTM by having only two gates: the update gate and the reset gate. The simplicity of this structure allows GRU to capture temporal dependencies as effectively as LSTM while requiring fewer computational resources, making it a strong model for real-time energy forecasting applications [27]. The architecture of GRU is described in Fig. 2.
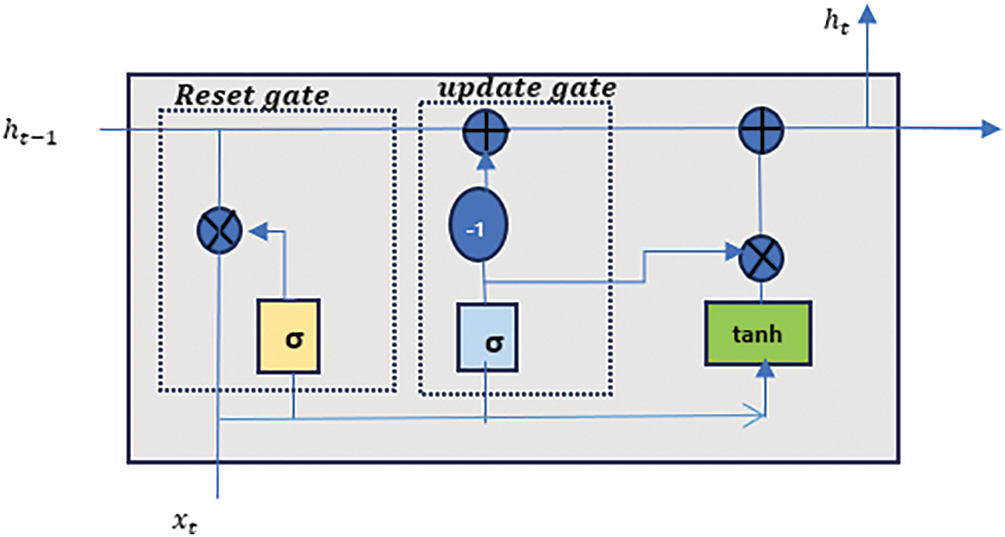
Figure 2: Architecture of the GRU model
3.1.3 Convolutional Neural Network
1D-CNN or Conv1D is a neural network layer designed for processing sequential data by convolving filters along one dimension (usually the temporal dimension). This approach employs fixed-size filters that slide across the sequence, effectively detecting regular patterns and anomalies in the data. Following convolution, a pooling operation is typically applied to reduce the data size while preserving essential features, thereby enhancing computational efficiency without compromising forecast accuracy. In summary, 1D-CNN is well-suited for capturing short-term fluctuations, making it valuable for solar energy production monitoring, where rapid recognition and precise prediction are crucial. Fig. 3 illustrates the architecture of 1D-CNN, highlighting the convolution and pooling processes.
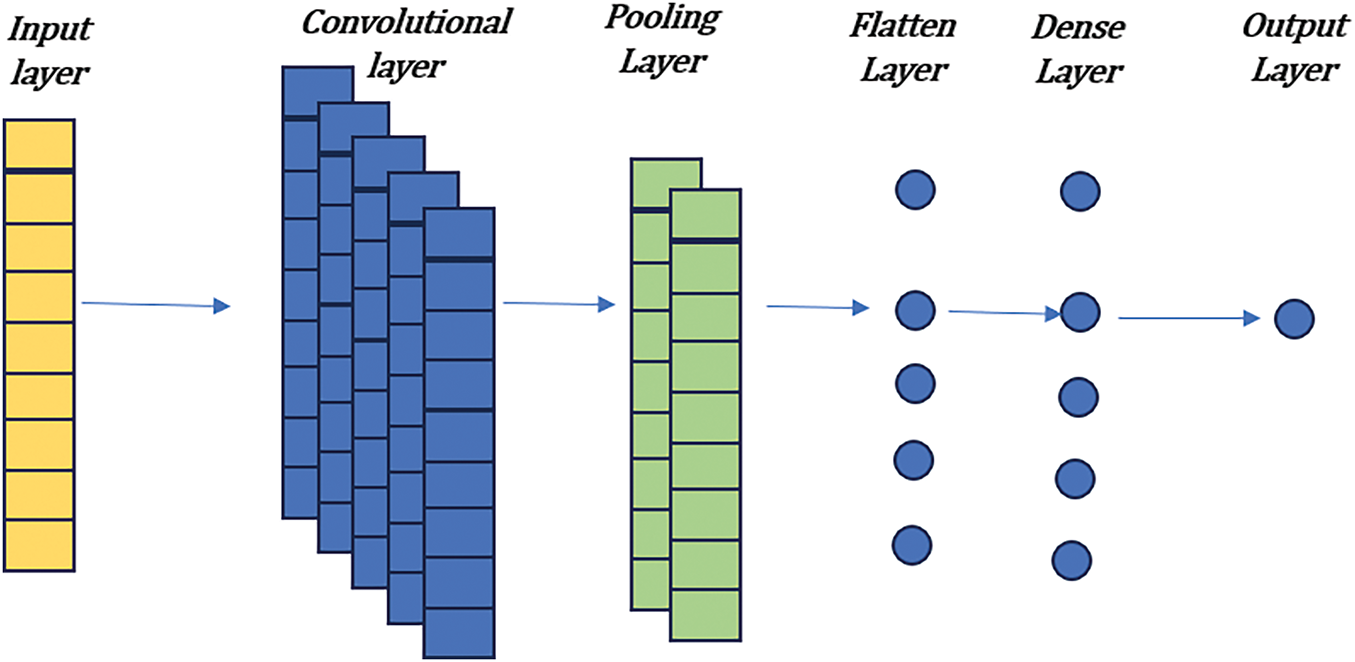
Figure 3: Architecture of the Conv1D model
This hybrid architecture combines the strengths of CNN and LSTM by stacking convolutional layers followed by LSTM layers. The CNN utilizes convolutional filters for spatial feature extraction from input weather data (i.e., radiation or temperature) and identifies local patterns. The extracted features are fed into the LSTM layers, which are capable of modeling temporal dependencies and long-term relations in the sequential data [28]. The dual architecture, as shown in Figs. 1 and 3, allows the model to effectively handle both spatial and temporal information [24].
3.1.5 LSTM with Attention Mechanism
This LSTM variant utilizes an attention mechanism, allowing the model to focus on the most relevant segments of the data at each time step. This mechanism enhances the model’s performance by enabling it to identify crucial patterns and relationships within the sequence [29]. The architecture of this attention-enhanced LSTM is presented in Fig. 4.
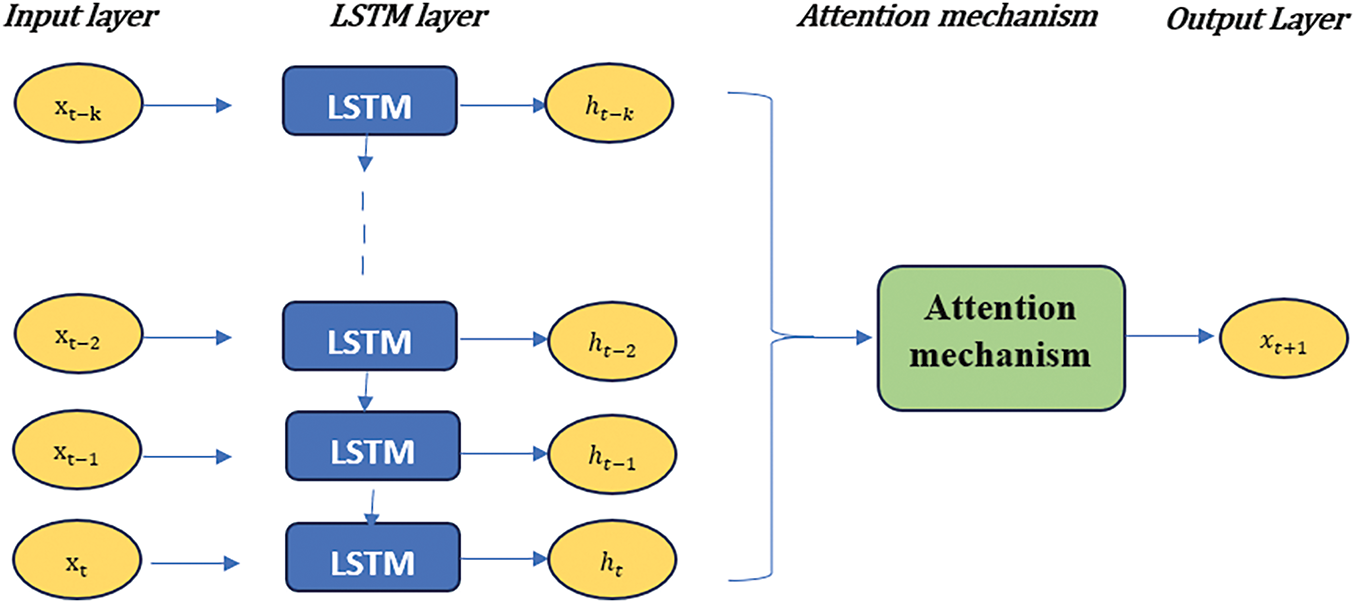
Figure 4: Architecture of the LSTM with attention
3.1.6 Model Architecture and Training Setup
The training and testing processes were conducted on a computing workstation equipped with an Intel(R) Xeon(R) Silver 4214R CPU @ 2.40 GHz, 64 GB RAM, and a 64-bit operating system. This architecture facilitated faster execution and enabled the training of complex models such as CNN-LSTM and LSTM with attention across various forecasting horizons.
Table 1 presents the architectures of five deep learning models used in this study, indicating the layers used and the total number of neurons for all forecast horizons (1-step, 12-step, and 24-step). The Grid Search technique was used to fine-tune the model parameters, determining the optimal number of layers and neurons to select the best architecture for each model. All models were trained for 30 epochs with a batch size of 64 using the Adam optimizer with a learning rate of 0.001. The experiments were conducted on the Anaconda 2.6.3 platform using Jupyter Notebook 7.2.2.

Various metrics were utilized to evaluate the performance of the deep learning models and determine their effectiveness in making accurate predictions. The metrics used are as follows:
• MAE: As described in Eq. (1), MAE measures the magnitude of the errors, providing a direct assessment of the overall size of the prediction error.
where
• MSE: Calculates the square of the errors, thereby giving more weight to larger errors. This characteristic makes MSE particularly useful for identifying significant variations in the prediction performance (see Eq. (2)):
• RMSE: Is the square root of the MSE, RMSE measures the error in the same units as the observed variable. This property is crucial for interpreting the magnitude of errors in relation to the actual values (see Eq. (3)):
• R2: It is the Coefficient of Determination. It describes the amount of variance in the observed data that can be explained by the model and thus measures the quality of the fit (see Eq. (4)).
where
The experimental data are derived from measurements taken by the DKASC PV system in Alice Springs, Australia (coordinates: latitude −23°45′ S; longitude 133°52′ E) [30]. To assess the strength and capabilities of the predictive models proposed, three different systems (sites 17, 19, and 20), utilizing varying types of PV technologies with different energy generation capacity, were selected for comparison. Because these sites are close enough to minimize any effect of local weather variations at a specific site, this will allow for a more accurate comparison of each technology’s performance. The energy production of the sites is between 166.5 W/m2 (site 17) and 143.5 W/m2 (sites 19 and 20). The location of the three systems can be seen in Fig. 5, and their detailed technical characteristics are provided in Table 2.

Figure 5: The location of PV arrays in DKA solar center

The datasets mainly consist of the active power (kW) as illustrated in Fig. 6 and meteorological features (wind speed (m/s), ambient temperature (°C), global horizontal irradiance (W/m2), wind direction (degree), and others), which are freely available online. There has been a reading taken by a sensor every five minutes since 2010. For this study, we will consider data only from 1 January 2015 until 31 December 2017.
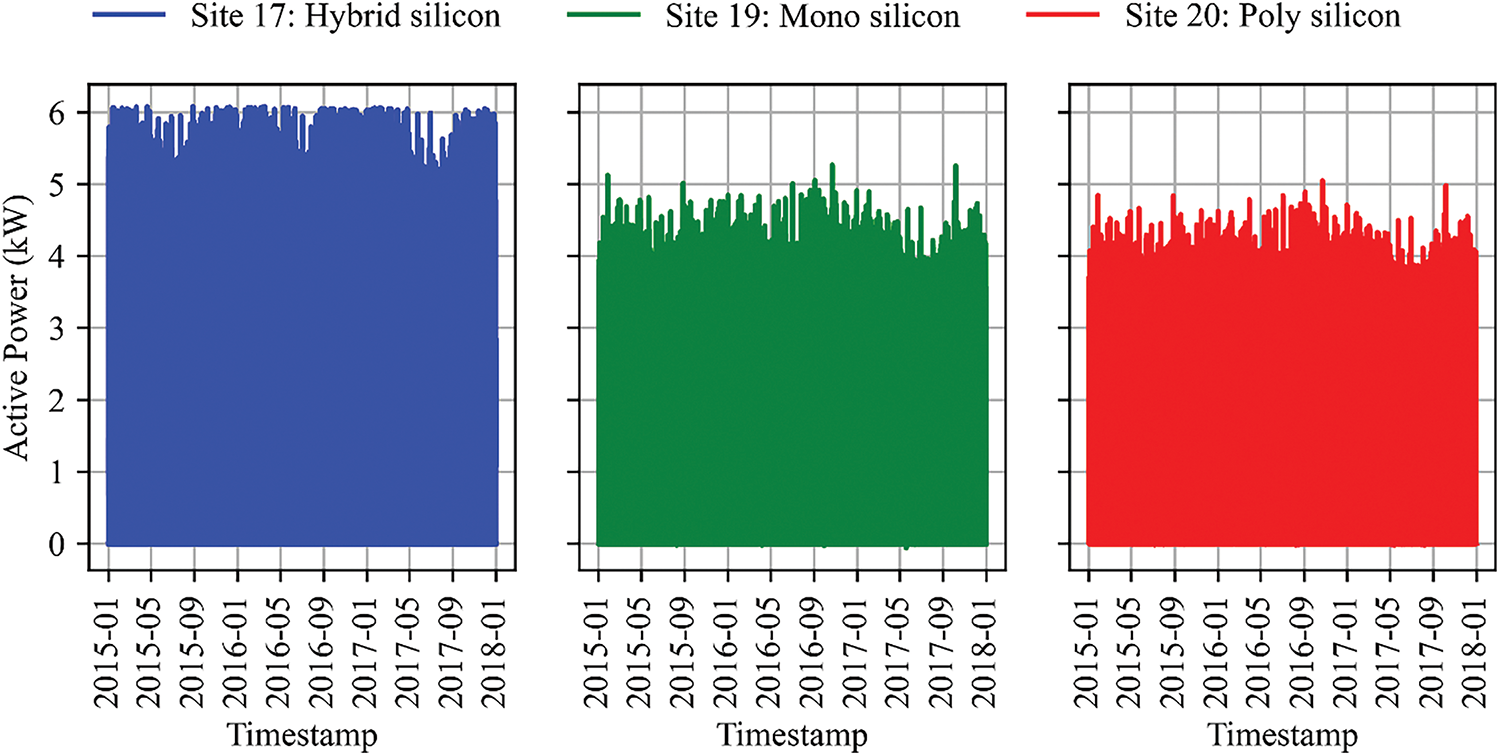
Figure 6: PV power distribution in different arrays
One of the key steps in deep learning is data preprocessing, which ensures that the data is properly prepared for use in predictive models. This process directly affects the quality and reliability of the results. The main steps involved in data preprocessing are missing values handling, outliers handling [31], feature selection, and data normalization.
Time series with missing observations can affect the model performance. We used mean imputation to account for missing values to maintain data continuity and integrity. It is an intuitive and versatile technique for continuously varying parameters.
Outliers were handled using the Interquartile Range (IQR) method to identify extreme or inconsistent values. Outliers beyond this range were substituted by the mean value to preserve data quality without introducing bias.
Correlation analysis was performed to identify the most informative variables to energy production (Active Power), intending to reduce model complexity and increase interpretability [32]. Only variables with absolute correlation greater than 0.4 were kept for modeling (see Table 3). This threshold was selected to tradeoff between model simplicity and accuracy, ultimately improving performance while targeting the meteorological parameters with the greatest impact on the production of PVs.

As a method of data normalization, we used the MinMaxScaler to make the data homogeneous for learning. This technique rescales the values of all features such that they lie within 0 and 1 as seen in Eq. (5). In addition, MinMaxScaler is an excellent option to approach deep learning models, as it preserves the original scale structure yet helps converge the model.
Data was split into three parts, 70% for training, 15% for validation and 15% for testing. Such a separation enables the model to learn from a big enough sample and yet have a fair and unbiased assessment of how well the model is performing, reducing the overfitting risk.
LSTM, Conv1D, GRU, LSTM with attention, and CNN-LSTM models were trained using training and validation data and evaluated on test data to predict the next step or multiple steps of the forecasting horizon. The study utilized data from three PV arrays representing different technologies, with each deep learning model trained and tested separately for each PV array. Additionally, the comparison of PV array technologies and predictive performance will be presented separately for each forecasting horizon.
4.1 One-Step Forecasting Horizon
Fig. 7 presents the MAE, MSE, RMSE, and R2 metrics for each deep learning model at a 5-min (one-step) forecasting horizon. Fig. 8 provides a detailed comparison between the actual power values and the predicted PV power for each deep learning model across the three solar panel technologies (Hybrid-Si, Mono-Si, and Poly-Si) for a 5-min ahead prediction (one step) over a single day. The plots illustrate the observed power outputs, while the corresponding R2 values indicate the accuracy of each model’s predictions based on the site and technology type.

Figure 7: Performance metrics of deep learning models for one-step (5-min) PV power forecasting

Figure 8: The observed and predicted values of the five models for one-step (5 min) PV power forecasting
Model performance remains generally consistent for the one-step forecasting horizon (5 min), as shown in Figs. 7 and 8, with only minor differences among the five models in terms of the R2 score. The LSTM and GRU models demonstrated the best performance on Site 17 (Hybrid-Si), achieving an R2 of 0.9827 and an identical MSE of 0.00180.
At Site 19 (Mono-Si), the LSTM-Attention model performs exceptionally well, achieving an MAE of 0.0121 and an R2 of 0.9812, indicating outstanding predictive accuracy. The GRU and LSTM models also perform well, with MAE values of 0.0128 and 0.0126, respectively, and corresponding R2 scores of 0.9810 and 0.9822, demonstrating their ability to capture long-term temporal dependencies. In contrast, the Conv1D model attains a slightly lower R2 of 0.9791 with an MAE of 0.0133. While this model is simpler and faster to train, it appears less effective in capturing the multiple temporal relationships necessary for accurate PV power forecasting. The hybrid CNN-LSTM model, with an MAE of 0.0129 and an R2 of 0.9802, shows an improvement over the Conv1D model, particularly in handling mixed feature scoring. However, it still falls short of the performance achieved by the LSTM-Attention model.
For Site 20 (Poly-Si), the GRU, LSTM, and LSTM-Attention models exhibit similar performance, with high R2 values of 0.9821 for both GRU and LSTM-Attention and 0.9822 for LSTM. The MAE remains low for these three models (0.0138, 0.0137, and 0.0138), indicating their robustness in environments with stable or favorable conditions for prediction. As in previous tests, the Conv1D model demonstrates slightly lower performance, with an R2 of 0.9805 and an MAE of 0.0140, reinforcing its weaker predictive capabilities compared to recurrent architectures or those incorporating attention mechanisms. In contrast, the hybrid CNN-LSTM model achieves slightly better results, with an MAE of 0.0137 and an R2 of 0.9812, though it still falls short of the performance achieved by the LSTM-Attention model.
Although the one-step horizon (5 min) yielded relatively similar results between models across all sites, site 20 (Poly-Si) stood out for the best overall performance, particularly with the LSTM and LSTM-Attention models.
To extend the analysis, we introduced the 12-step horizon (1 h) to better distinguish their performance. One-step predictions did not reveal significant differences between the models, prompting further analysis. In the next step, we examined whether extending the forecasting horizon to 12 steps (1 h) would highlight the impact of panel technology on model performance over a longer time frame.
4.2 12-Step Forecasting Horizon
Fig. 9 presents the performance metrics of deep learning models for the 1-h PV power forecasting horizon, while Fig. 10 illustrates the actual vs. predicted values for the five models in 1-h ahead (12-step) forecasting.

Figure 9: Performance metrics of deep learning models for 12-step (1 h) PV power forecasting

Figure 10: The observed and predicted values of the five models for 12-step (1 h) PV power forecasting
For Site 17, which features Hybrid-Si panels, the CNN-LSTM model achieved the highest overall performance, with an R2 of 0.9790 and an MAE of 0.0185, demonstrating its ability to capture production variations effectively. The broader light spectrum captured by Hybrid-Si panels contributes to forecast uncertainty, as reflected in the improved performance observed across all sites with Mono-Si and Poly-Si panels (MAE of 0.0157 and 0.0162, respectively). This suggests that the CNN-LSTM’s connective architecture is particularly advantageous for Hybrid-Si panels, enabling it to better adapt to minor production fluctuations. The LSTM model ranked second, with slightly lower performance (R2 = 0.9776, MAE = 0.0185). The performance gap between LSTM and CNN-LSTM can be attributed to CNN-LSTM’s ability to capture subtle variations specific to Hybrid-Si panels, allowing it to predict even the slightest changes in production more effectively. The GRU and LSTM-Attention models demonstrated identical performance, both with an R2 of 0.9751. Meanwhile, the Conv1D model exhibited the lowest overall performance, with an R2 of 0.9618 and an MAE of 0.0238.
For Site 19, which is equipped with Mono-Si panels, the CNN-LSTM model once again delivers the best performance, achieving an R2 of 0.9768 and a lower MAE of 0.0157. This improved accuracy suggests that Mono-Si panels, known for their stable performance under consistent direct sunlight, create a more predictable production environment, enhancing the model’s forecasting ability. The CNN-LSTM model appears particularly well-suited to capturing the regular variation patterns of this technology, which explains its superior accuracy. Additionally, the GRU and LSTM-Attention models also demonstrate strong performance, with R2 scores of 0.9745 and 0.9737, respectively. These results indicate that, for a stable production technology like Mono-Si panels, multiple models can effectively capture production trends. However, the Conv1D model exhibits consistently lower performance across all sites (as shown in the metrics table). The CNN-LSTM remains marginally superior, reaffirming its adaptability to the steady production conditions characteristic of Mono-Si panels.
For Site 20, equipped with Poly-Si panels, the CNN-LSTM model outperforms all other tested models, achieving an R2 of 0.9793 and an MAE of 0.0162. This represents the best accuracy for the model across all three sites. Poly-Si panels are known for maintaining steady energy output even under inconsistent lighting conditions, which explains the generally better results. Such stable production characteristics provide an ideal environment for the CNN-LSTM architecture, allowing it to effectively capture spatial-temporal patterns and deliver high prediction accuracy. Other models, such as LSTM and GRU, also perform well, with R2 scores of 0.9764 and 0.9730, respectively, and comparable MAE values. However, their performance lags slightly behind the CNN-LSTM, further emphasizing the hybrid model’s strengths in diffused light tolerance and stable yield. In contrast, the Conv1D model achieved an R2 of 0.9623 and an MAE of 0.0213, significantly lower than the other models, highlighting its limitations in modeling complex dependencies in the data. Although the R2 and MAE of the LSTM-Attention model were competitive (R2 = 0.9736, MAE = 0.0186), the CNN-LSTM still produced the lowest error, proving it to be the most suitable model for 1-h ahead forecasts on Poly-Si panels.
The results highlight the CNN-LSTM model’s ability to leverage the stable production characteristics of Poly-Si panels, providing accurate PV power forecasts. To further validate the findings for the 12-step (1-h) horizon, we extended our analysis to the 24-step (2-h) horizon. By increasing the prediction horizon, we can more effectively evaluate how well the models scale across the three types of panel technologies (Hybrid-Si, Mono-Si, and Poly-Si) deployed at the different sites.
4.3 24-Step Forecasting Horizon
Fig. 11 presents the performance metrics of deep learning models for 2-h PV power forecasting, while Fig. 12 displays the actual vs. predicted values of the five models for PV power forecasting on a 2-h-ahead (24-step) basis.

Figure 11: Performance metrics of deep learning models for 24-step (2 h) PV power forecasting

Figure 12: The observed and predicted values of the five models for 24-step (2 h) PV power forecasting
For Site 17, equipped with Hybrid-Si panels, the CNN-LSTM model continues to outperform the other models, achieving the highest score with an R2 of 0.9769 and an MAE of 0.0226. The CNN-LSTM method excels in capturing the long-term variability unique to Hybrid-Si panels, which is reflected in these results. Despite the wider light spectrum captured by this technology, the CNN-LSTM performance remains consistently high, with only a slight improvement over other models. The GRU model follows closely, with an R2 of 0.9728 and an MAE of 0.0235, demonstrating good performance for the 2-h forecast. On the other hand, the Conv1D model shows the lowest R2 (0.9563) and the highest MAE (0.0303), highlighting its limitations in modeling the complex behavior of Hybrid-Si panels over multiple steps.
For Site 19, equipped with Mono-Si panels, the CNN-LSTM model delivers the best performance, achieving an R2 of 0.9756 and a slightly lower MAE of 0.0182, indicating its excellent ability to capture the typical variations of this technology over a 2-h period. The synergy between Mono-Si modules and the CNN-LSTM model enables highly accurate forecasts. The GRU and LSTM models also perform well, with R2 scores of 0.9718 and 0.9695, respectively. These results demonstrate that combining multiple models can enhance the identification of the long-term characteristics of Mono-Si panels, with the CNN-LSTM still maintaining a slight edge. In contrast, the Conv1D model shows the worst performance, with the lowest R2 of 0.9547.
Finally, for Site 20, equipped with Poly-Si panels, the CNN-LSTM model achieves an impressive R2 of 0.9748 and an MAE of 0.0201, demonstrating its strong adaptability to Poly-Si panels. The GRU and LSTM models produce R2 values of 0.9712 and 0.9707, respectively, indicating that their performance is slightly inferior to the CNN-LSTM model. In contrast, the Conv1D model consistently exhibits the lowest performance across all horizons and technologies, with an R2 of 0.9574.
The superior performance of CNN-LSTM with Poly-Si for both prediction horizons (12 and 24 steps) is explained by its ability to simultaneously capture spatial patterns (via CNN) and temporal dependencies (via LSTM), an ideal combination to anticipate complex variations in photovoltaics. However, this comes with major challenges such as high complexity, higher computing power requirements, longer training times, and higher operating costs, especially for real-time or embedded applications.
The present work analyzes the performance of different deep learning models in the context of PV energy production forecasting across three forecasting horizons: 5-min (one-step), 1-h (12-step), and 2-h (24-step). Data from three sites representing different panel technologies were assembled for this study. The results demonstrate that panel type significantly influences model performance, even when the same hyperparameter configurations are applied, and that this impact is also horizon-dependent.
The findings indicate that the selected PV panel technology directly affects the performance of deep learning models, depending on the forecasting horizon. Among all architectures tested is the CNN-LSTM model proved to be the most versatile and robust across all horizons and technologies, consistently outperforming other models. However, the performance of each model was also influenced by the conditions and stability of each panel type.
Notably, the CNN-LSTM model achieved the most accurate and reliable PV power predictions when paired with Poly-Si panels. This combination benefits from the inherent robustness of Poly-Si panels, which are particularly tolerant to diffuse light conditions. As a result, when longer prediction horizons are required, this approach can provide highly precise forecasts.
These findings underscore the critical importance of both panel technology and model selection in PV energy forecasting, particularly when aiming for longer forecasting horizons and improved precision.
For future perspectives, we aim to explore more cutting-edge models, such as transformers, and investigate the performance of additional types of PV panel technologies to further enhance the accuracy and adaptability of our forecasting models.
Acknowledgement: We sincerly thank the LAROSERI, LabSipe and LTI Laboratoiries for their support to carry out this word.
Funding Statement: The authors received no specific funding for this study.
Author Contributions: Conceptualization, Methodology, Data Curation, Software, Formal Analysis, Investigation, Writing—Original Draft, Visualization, Samira Marhraoui; Assistance in Data Analysis, Literature Review, Writing—Review & Editing, Basma Saad; Supervision, Project Administration, Validation, Writing—Review & Editing, Hassan Silkan; Co-Supervision, Validation, Methodological Guidance, Writing—Review & Editing, Said Laasri; Support in Data Collection and Preprocessing, Technical Review, Asmaa El Hannani. All authors reviewed the results and approved the final version of the manuscript.
Availability of Data and Materials: The authors confirm that the data supporting the findings of this study are available within the article.
Ethics Approval: Not applicable.
Conflicts of Interest: The authors declare no conflicts of interest to report regarding the present study.
References
1. Husein M, Gago EJ, Hasan B, Pegalajar MC. Towards energy efficiency: a comprehensive review of deep learning-based photovoltaic power forecasting strategies. Heliyon. 2024;10(13):e33419. doi:10.1016/j.heliyon.2024.e33419. [Google Scholar] [PubMed] [CrossRef]
2. Li Z, Xu R, Luo X, Cao X, Du S, Sun H. Short-term photovoltaic power prediction based on modal reconstruction and hybrid deep learning model. Energy Rep. 2022;8(01):9919–32. doi:10.1016/j.egyr.2022.07.176. [Google Scholar] [CrossRef]
3. Boulmrharj S, Bakhouya M, Khaidar M. Performance evaluation of grid-connected silicon-based PV systems integrated into institutional buildings: an experimental and simulation comparative study. Sustain Energy Technol Assess. 2022;53:102632. doi:10.1016/j.seta.2022.102632. [Google Scholar] [CrossRef]
4. Kotla DP, Anna VR, Praveenkumar S, Saleh SM, Shanmugan S. Optimizing solar still performance: a study of TiO2 nanofluid derived from Saccharum officinarum L. Sep Purif Technol. 2025;359(6):130584. doi:10.1016/j.seppur.2024.130584. [Google Scholar] [CrossRef]
5. PraveenKumar S, Kumar A. Thermodynamic, environmental and economic analysis of solar photovoltaic panels using aluminium reflectors and latent heat storage units: an experimental investigation using passive cooling approach. J Energy Storage. 2025;112(19):115487. doi:10.1016/j.est.2025.115487. [Google Scholar] [CrossRef]
6. Khortsriwong N, Boonraksa P, Boonraksa T, Fangsuwannarak T, Boonsrirat A, Pinthurat W, et al. Performance of deep learning techniques for forecasting PV power generation: a case study on a 1.5 MWp floating PV power plant. Energies. 2023;16(5):2119. doi:10.3390/en16052119. [Google Scholar] [CrossRef]
7. Aman R, Rizwan M, Kumar A. A novel hybrid intelligent approach for solar photovoltaic power prediction considering UV index and cloud cover. Electr Eng. 2025;107(1):1203–24. doi:10.1007/s00202-024-02577-4. [Google Scholar] [CrossRef]
8. Wu Z, Pan F, Li D, He H, Zhang T, Yang S. Prediction of photovoltaic power by the informer model based on convolutional neural network. Sustainability. 2022;14(20):13022. doi:10.3390/su142013022. [Google Scholar] [CrossRef]
9. Elsaraiti M, Merabet A. Solar power forecasting using deep learning techniques. IEEE Access. 2022;10(1):31692–8. doi:10.1109/ACCESS.2022.3160484. [Google Scholar] [CrossRef]
10. Li Y, Ye F, Liu Z, Wang Z, Mao Y. A short-term photovoltaic power generation forecast method based on LSTM. Math Probl Eng. 2021;2021(1):6613123. doi:10.1155/2021/6613123. [Google Scholar] [CrossRef]
11. Dai Y, Wang Y, Leng M, Yang X, Zhou Q. LOWESS smoothing and Random Forest based GRU model: a short-term photovoltaic power generation forecasting method. Energy. 2022;256:124661. doi:10.1016/j.energy.2022.124661. [Google Scholar] [CrossRef]
12. Azizi N, Yaghoubirad M, Farajollahi M, Ahmadi A. Deep learning based long-term global solar irradiance and temperature forecasting using time series with multi-step multivariate output. Renew Energy. 2023;206(1):135–47. doi:10.1016/j.renene.2023.01.102. [Google Scholar] [CrossRef]
13. Abdel-Basset M, Hawash H, Chakrabortty RK, Ryan M. PV-Net: an innovative deep learning approach for efficient forecasting of short-term photovoltaic energy production. J Clean Prod. 2021;303:127037. doi:10.1016/j.jclepro.2021.127037. [Google Scholar] [CrossRef]
14. Bahanni C, Adar M, Boulmrharj S, Khaidar M, Mabrouki M. Analysis of weather impact on the yield of PV plants installed in two antagonists cities in Morocco. In: Proceedings of the Analysis of Weather Impact on the Yield of PV Plants Installed in Two Antagonists Cities in Morocco (REDEC); 2020 Jun 29–30; Marrakech, Morocco. p. 1–6. [Google Scholar]
15. Lotfi H, Adar M, Bennouna A, Izbaim D, Oum’bark F, Ouacha EH. Silicon photovoltaic systems performance assessment using the principal component analysis technique. Mater Today Proc. 2022;51(102):1966–74. doi:10.1016/j.matpr.2021.04.374. [Google Scholar] [CrossRef]
16. Kang H. Crystalline silicon vs. amorphous silicon: the significance of structural differences in photovoltaic applications. IOP Conf Ser Earth Environ Sci. 2021;726(1):012001. doi:10.1088/1755-1315/726/1/012001. [Google Scholar] [CrossRef]
17. Buratti Y, Javier GMN, Abdullah-Vetter Z, Dwivedi P, Hameiri Z. Machine learning for advanced characterisation of silicon photovoltaics: a comprehensive review of techniques and applications. Renew Sustain Energy Rev. 2024;202(5):114617. doi:10.1016/j.rser.2024.114617. [Google Scholar] [CrossRef]
18. Alshammari T. Using artificial neural networks with GridSearchCV for predicting indoor temperature in a smart home. Eng Technol Appl Sci Res. 2024;14(2):13437–43. doi:10.48084/etasr.7008. [Google Scholar] [CrossRef]
19. Zhuo L, Hejin X. Photovoltaic output prediction based on CNN-GRU-attention algorithm. In: Proceedings of the 2023 China Automation Congress (CAC); 2023 Nov 17–19; Chongqing, China. p. 4309–13. doi:10.1109/CAC59555.2023.10450909. [Google Scholar] [CrossRef]
20. Miraftabzadeh SM, Longo M. High-resolution PV power prediction model based on the deep learning and attention mechanism. Sustain Energy Grids Netw. 2023;34(1):101025. doi:10.1016/j.segan.2023.101025. [Google Scholar] [CrossRef]
21. Du J, Zheng J, Liang Y, Liao Q, Wang B, Sun X, et al. A theory-guided deep-learning method for predicting power generation of multi-region photovoltaic plants. Eng Appl Artif Intell. 2023;118:105647. doi:10.1016/j.engappai.2022.105647. [Google Scholar] [CrossRef]
22. Liu W, Mao Z. Short-term photovoltaic power forecasting with feature extraction and attention mechanisms. Renew Energy. 2024;226(22):120437. doi:10.1016/j.renene.2024.120437. [Google Scholar] [CrossRef]
23. Hu Z, Gao Y, Ji S, Mae M, Imaizumi T. Improved multistep ahead photovoltaic power prediction model based on LSTM and self-attention with weather forecast data. Appl Energy. 2024;359(2):122709. doi:10.1016/j.apenergy.2024.122709. [Google Scholar] [CrossRef]
24. Ait Mansour A, Tilioua A, Touzani M. Bi-LSTM, GRU and 1D-CNN models for short-term photovoltaic panel efficiency forecasting case amorphous silicon grid-connected PV system. Results Eng. 2024;21(7):101886. doi:10.1016/j.rineng.2024.101886. [Google Scholar] [CrossRef]
25. Dai Y, Yu W, Leng M. A hybrid ensemble optimized BiGRU method for short-term photovoltaic generation forecasting. Energy. 2024;299(7):131458. doi:10.1016/j.energy.2024.131458. [Google Scholar] [CrossRef]
26. Herrera Casanova R, Conde A. Enhancement of LSTM models based on data pre-processing and optimization of Bayesian hyperparameters for day-ahead photovoltaic generation prediction. Comput Electr Eng. 2024;116(7):109162. doi:10.1016/j.compeleceng.2024.109162. [Google Scholar] [CrossRef]
27. Su Z, Gu S, Wang J, Lund PD. Improving ultra-short-term photovoltaic power forecasting using advanced deep-learning approach. Measurement. 2025;239(1):115405. doi:10.1016/j.measurement.2024.115405. [Google Scholar] [CrossRef]
28. Obiora CN, Ali A. Hourly photovoltaic power forecasting using CNN-LSTM hybrid model. In: Proceedings of the 2021 62nd International Scientific Conference on Information Technology and Management Science of Riga Technical University (ITMS); 2021 Oct 14–15; Riga, Latvia. p. 1–6. doi:10.1109/ITMS52826.2021.9615335. [Google Scholar] [CrossRef]
29. Yang T, Li B, Xun Q. LSTM-attention-embedding model-based day-ahead prediction of photovoltaic power output using bayesian optimization. IEEE Access. 2019;7:171471–84. doi:10.1109/ACCESS.2019.2954290. [Google Scholar] [CrossRef]
30. D.K.A.Solar Centre. Notes on the data [Internet]. Kilgariff, Australia: DKA Solar Centre. [cited 2025 Feb 17]. Available from: https://dkasolarcentre.com.au/download/notes-on-the-data. [Google Scholar]
31. Syahab AS, Achamd MH. Solar radiation prediction using long short-term memory with handling of missing values and outliers. J INFOTEL. 2024;16(4):758–77. doi:10.20895/infotel.v16i4.1225. [Google Scholar] [CrossRef]
32. Park S, Kim D, Moon J, Hwang E. Zero-shot photovoltaic power forecasting scheme based on a deep learning model and correlation coefficient. Int J Energy Res. 2023;2023(1):9936542. doi:10.1155/2023/9936542. [Google Scholar] [CrossRef]
Cite This Article
 Copyright © 2025 The Author(s). Published by Tech Science Press.
This work is licensed under a Creative Commons Attribution 4.0 International License , which permits unrestricted use, distribution, and reproduction in any medium, provided the original work is properly cited.
 Downloads
 Citation Tools