
 Submit a Paper
 Propose a Special lssue
 Open Access
ARTICLE

Optimization of Fracture Propagation in Coal Seams Using Discrete Lattice Method: Case Study of the L Block, China
1 CNOOC Research Institute Company Limited, CNOOC Ltd., Beijing, 100028, China
2 School of Petroleum Engineering, Yangtze University, Wuhan, 430100, China
3 Hubei Key Laboratory of Oil and Gas Drilling and Production Engineering, Yangtze University, Wuhan, 430100, China
* Corresponding Author: Biao Yin. Email:
Energy Engineering 2025, 122(7), 2911-2930. https://doi.org/10.32604/ee.2025.065384
Received 11 March 2025; Accepted 29 April 2025; Issue published 27 June 2025
 View Full Text
 Download PDF
Abstract
Hydraulic fracturing, an effective method for enhancing coal seam productivity, largely determines coalbed methane (CBM) production, which is significantly influenced by geological and engineering factors. This study focuses on the L block to investigate the mechanisms influencing efficient fracture propagation and enhanced stimulated reservoir volume (SRV) in fracturing. To explore the mechanisms influencing effective fracture propagation and enhanced SRV, the L block was selected as the research object, with a comprehensive consideration of geological background, reservoir properties, and dynamic production data. By combining the discrete lattice method with numerical analysis and true triaxial experimental simulation, the fracture morphology of a single cluster and the propagation patterns of multiple clusters of complex fractures were obtained. Additionally, the optimization of temporary plugging timing and the fracture map under multiple factors were innovatively proposed. Results indicate that greater flow rate and viscosity can effectively overcome the stress shadow effect of the outermost fractures (1st and 6th clusters), increasing the fracture pressure of the single cluster and the equilibrium degree of multiple fracture propagation, thus forming a more complex fracture network. Moreover, when viscosity exceeds 45 mPa·s, pressure concentrates at fracture tips, promoting discontinuous propagation and reducing flow resistance. Conversely, increased gangue thickness and spacing between horizontal wells increase the vertical propagation pressure, suppressing fracture growth and reducing central flow velocity. This study provides a multi-cluster fracture propagation map for optimizing volumetric fracturing in coal seams and suggests that the optimal temporary plugging time significantly enhances the SRV.Keywords
Although China has significant coalbed methane (CBM) resource potential, the actual production volume falls short of expectations. Proven reserves total approximately 36.0 × 10¹² m³—nearly 25% of the global total—but the commercial recovery rate remains low (approximately 15%) due to technical and economic constraints. In 2024, production reached 13.8 × 10⁹ m³ following breakthroughs in deep CBM exploration, about 70% of the reserves are hosted in low-permeability formations. This is primarily due to the complex geological conditions of coal reservoirs in China, characterized by low permeability, uneven geostress gradients, and widespread under-compaction [1]. These factors make it challenging to develop adaptive extraction strategies for varying geological conditions. Hydraulic fracturing remains the most widely used CBM enhancement technique. However, field operations reveal that the fracturing performance often fails to meet expectations, resulting in low single-well production and unstable output. In addition, the development of CBM increasingly relies on horizontal well branching and staged fracturing technologies, which introduce new challenges, particularly fracture-to-fracture interactions. Multi-cluster fractures occur in scenarios such as multiple perforation clusters within a fracturing stage or natural media splitting a single fracture into multiple branches. This necessitates reservoir modification to improve gas production [2]. Optimizing fracturing designs is essential to address these challenges, and such optimization must be grounded in accurate predictions of production performance based on geological conditions and engineering parameters.
Understanding the 3D propagation behavior of hydraulic fractures in complex deep coal reservoirs is essential for optimizing fracturing operations. Extensive research has been conducted using theoretical, experimental, and numerical methods to study fracture propagation. Hubbert et al. [3] analyzed the initiation mechanism of hydraulic fractures from boreholes and developed an elastic hydraulic fracturing model widely applied to predict vertical and horizontal well fracture initiation. Abass et al. [4] investigated non-planar fracture propagation near wellbores through hydraulic fracturing experiments, finding that misalignment between the wellbore axis and the principal stress direction results in complex non-planar fractures. As an effective method for observing rock fracture propagation, true triaxial experiments reveal the impact of geostress, lithologic strength differences, and interlayer strength on hydraulic fracture propagation in multilayer coal-bearing formations, achieving reliable results. The numerical analysis of hydraulic fracturing has evolved from 2D to 3D models, with various simulation methods proposed, including the finite element method (FEM), discrete element method (DEM), boundary element method (BEM), displacement discontinuity method (DDM), and extended finite element method (XFEM) [5,6]. The FEM commonly uses fracture mechanics criteria, where fractures are typically constrained to predefined paths and limited to simple geometries [7,8]. Yin et al. extended the FEM with a globally embedded cohesive element model to study the effects of SC-CO2 phase transitions on fracture propagation under various geological and engineering conditions. DEM, widely used for simulating granular rock mechanics, offers faster computation than FEM perform while maintaining accuracy. However, traditional DEM requires predefined fracture paths, limiting its ability to simulate fractures propagating freely in arbitrary directions [9–12]. The numerical simulation software XSite, based on the synthetic rock mass (SRM) method and lattice method, allows direct insertion of joint planes and definition of weak plane strength without the need for predefined fracture propagation paths, enabling intuitive simulation of 3D crack initiation and propagation [13].
Quantitative characterization of multi-cluster artificial fracture interference mechanisms after fracturing remains challenging, and research on fluid flow behavior and pressure fluctuations in coal seam hydraulic fractures is limited. Based on true triaxial experiments and discrete lattice numerical simulations, this study provides a comprehensive understanding of fracture propagation under single- and multi-cluster conditions in coal seams, effectively simulating fracture initiation and propagation and quantifying complex fracture patterns influenced by geological and engineering factors. Additionally, the innovative consideration of post-fracturing temporary plugging timing offers scientific guidance for optimizing coalbed methane production, aiming to increase fracturing production.
The discrete lattice is a type of discrete element method based on a simplified bonded particle model using synthetic rock mass technology and lattice theory [14]. This method effectively simulates the initiation and propagation of hydraulically induced fractures under coupled fluid-solid interactions. The fundamental principles of the discrete lattice method include the solid mechanics component, fluid flow dynamics, the fluid-solid coupling process based on incompressible fluid mechanics, and the optimization of explicit integration strategies for fracture propagation governed by fracture toughness [15–17]. In the discrete lattice method, rock is represented by a series of nodes connected by springs. The micro-stiffness and strength of the springs determine the macroscopic stiffness and strength of the rock. Fig. 1 illustrates the basic principle of the discrete lattice method, where the black circles represent lattice nodes, and the lattice is connected by springs. Additionally, the tensile-shear failure of the springs represents the failure of the rock mass.
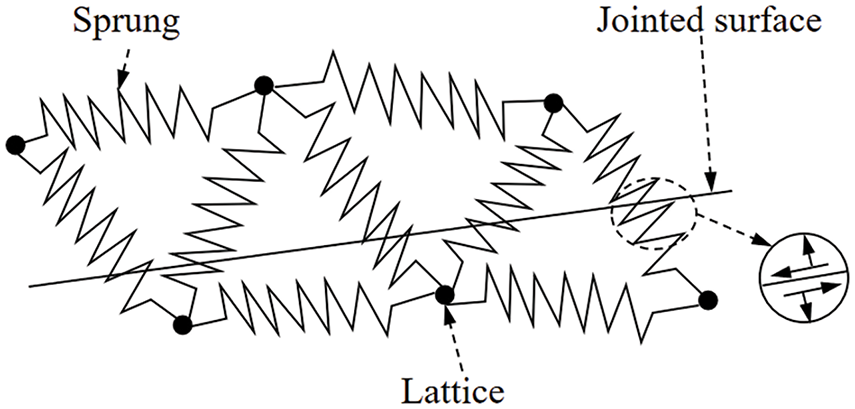
Figure 1: Schematic diagram of the lattice array with smooth junctions
Fluid flows through the springs, and the predefined inter-layer interfaces are represented via a smooth joint model, allowing precise simulation of behaviors such as slip, opening, and closure. Accordingly, the more lattice nodes in the model, the finer the simulation results [13].
The discrete lattice method is an explicit numerical calculation approach that treats an object as a block made up of several nodes connected by springs. Each node has six degrees of freedom, including three translational and three rotational degrees of freedom. The translational degrees of freedom are determined by the momentum balance equation and Newton’s second law, as shown in Eq. (1). This method can simulate nonlinear behaviors such as joint fracture, slip, and opening [18].
where
The angular velocity components of node i (where i = 1, 2, 3) at time t are calculated as:
where
In the equation,
where
2.2 3D Discrete Lattice Fluid Flow Models
The discrete lattice method can handle the movement of fluid, fracture propagation, and deformation of the rock matrix simultaneously. In the fluid-solid coupling process, fluid flows through pre-existing fractures and infiltrates the rock matrix. This process involves the dynamic of fluid and thermodynamic properties, as well as the geometry of the fractures. Subsequently, the infiltrating fluid further influences the mechanical properties of the rock, such as its elastic modulus, Poisson’s ratio, and hardness. This influence can lead to changes in the shape of the rock matrix, such as variations in rock volume. These changes in the rock matrix shape, in turn, affect the properties of the fractures, including fracture width and fluid pressure, and subsequently impact the filtration properties of fracture.
In the discrete lattice method, fluid flow is described by a pipe model, assuming that the pipe has the same width and length. The flow rate calculation formula is as follows [19]:
In the equation,
The explicit numerical method is used to solve the flow evolution model that changes with time. In the time step (
where
3 Model Establishment and Verification
Verifying the accuracy and reliability of numerical simulation methods is crucial in rock mechanics simulations. Accurate simulation results are vital for understanding rock behavior under different physical conditions and directly influence the interpretation and prediction of outcomes. Verification ensures that the model follows proper physical principles and accurately reflects rock behavior, while also allowing for the evaluation and improvement of simulation methods through comparison with experimental data. This process enhances prediction accuracy, identifies potential issues such as parameter selection, and ensures the reliability of the simulation.
As shown in Fig. 2a, the lithological profiles of the two representative wells indicate that the vertical well penetrates multiple lithologies, reflecting complex geological conditions. The model data is derived from 8 wells in the L block, drilled through 26 layers of mudstone (89.81 m), 60 layers of coal (100.6 m), 14 layers of dry strata (28.2 m), and 5 layers of gas strata (9.69 m). Five of the wells have coal layer ratios exceeding 20%, with an average coal layer ratio of 49.97% in the Ty formation of this region as shown in Fig. 2b. Based on geological stratification data from key well areas, the distribution and thickness of each layer were used to establish a horizontal well fracturing model for studying multi-fracture propagation in coal seams.
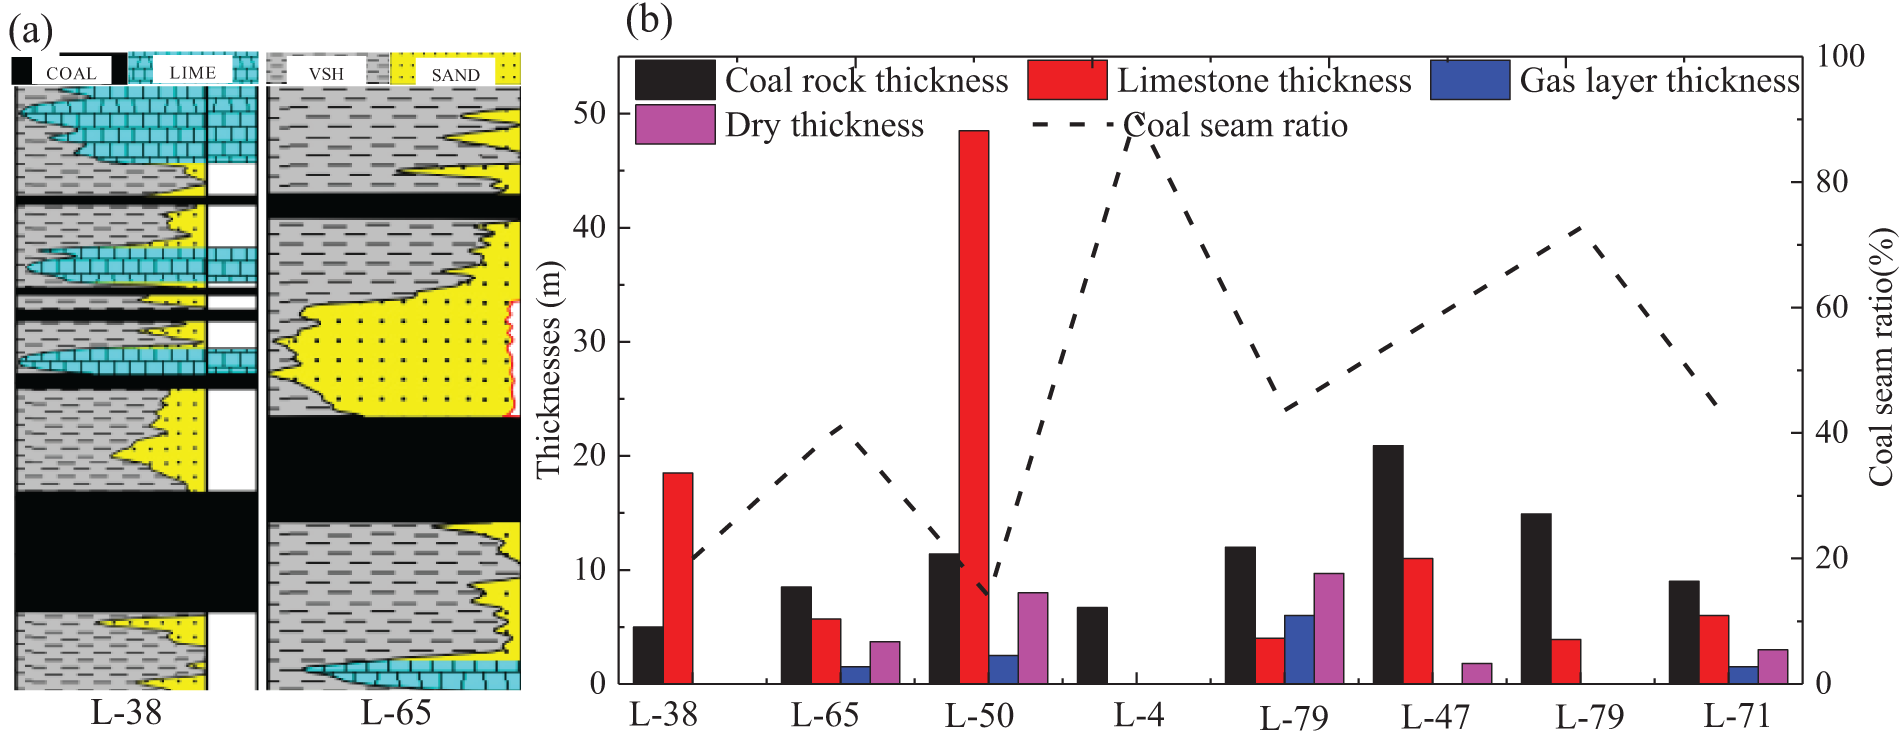
Figure 2: Data statistics for each layer of a typical well in block L. (a) Lithologic profiles of two characteristic wells; (b) Lithology distributions of different wells
The injection rate significantly affects the fracture morphology and stimulated reservoir volume (SRV). Considering the strong multi-cluster liquid diversion effects, numerical simulation optimization of the injection rate parameters is necessary to ensure the effectiveness of the stimulation. The pressure curves under two different injection rates are shown in Fig. 3. On-site fracturing operations should adjust the injection rate based on the formation conditions, avoiding excessive operational risks. Within a controllable pressure range, efforts should be made to maximize the injection rate to achieve the desired stimulation effect.
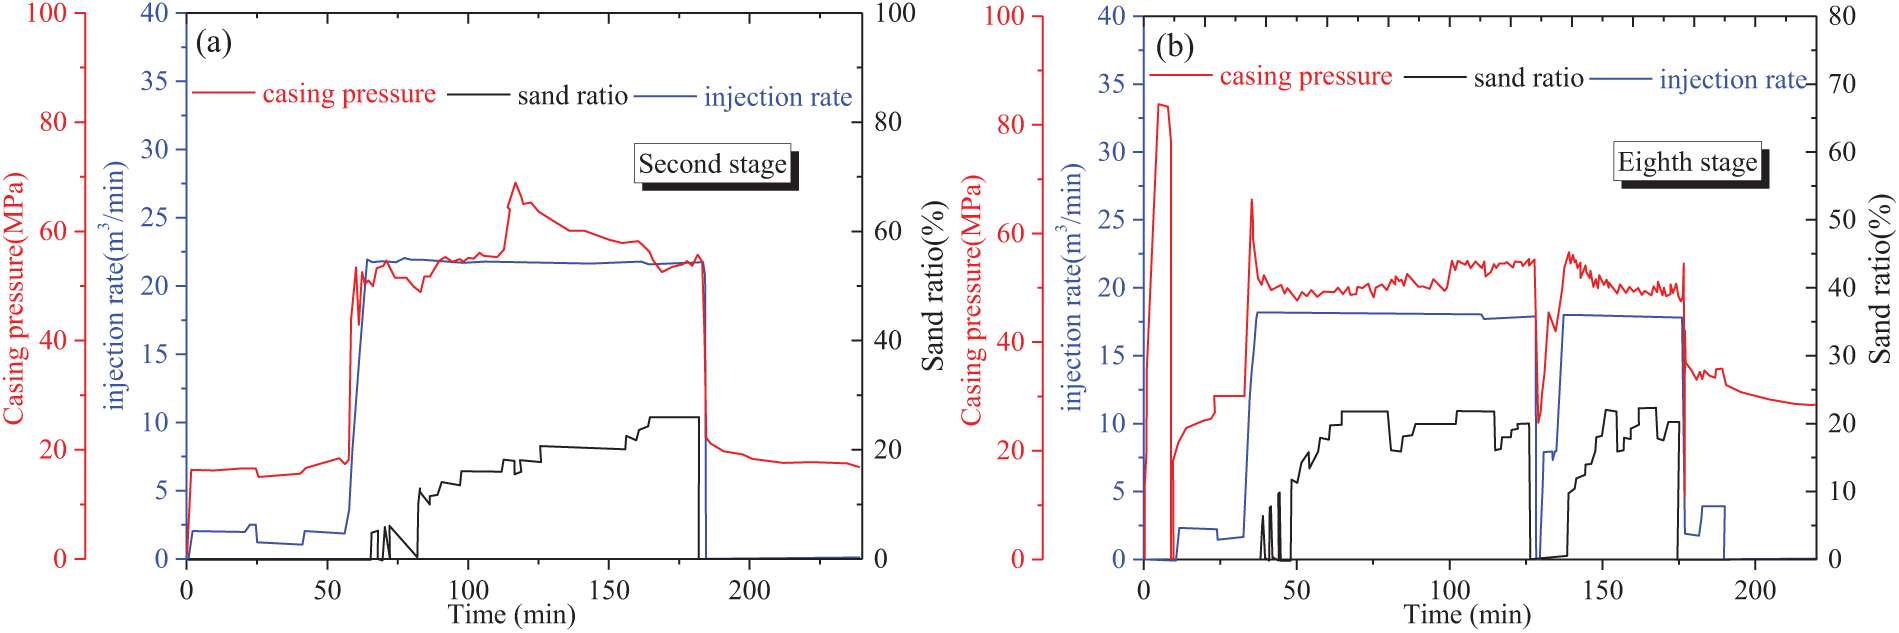
Figure 3: Construction curves of two wells under different flow rates. (a) Stage two construction curve for well L38; (b) Stage eight construction curve for well L65
A 3D discrete lattice method was used to numerically simulate the hydraulic fracture propagation behavior during horizontal well fracturing of deep coal seams. This study addresses the vertical propagation of hydraulic fractures in a typical deep coal seam stratigraphy consisting of 7 layers (Fig. 4), including coal, cap rock, and floor layers, with varying injection rates considered. To ensure that the numerical simulation results accurately reflect real-world conditions, the model was established based on typical layer combinations from the deep coalbed methane production region of the L block, integrating well log interpretation and geological data. This led to the development of a 3D numerical model (1200 m ×600 m × 21.4 m) for horizontal well fracturing and fracture propagation.
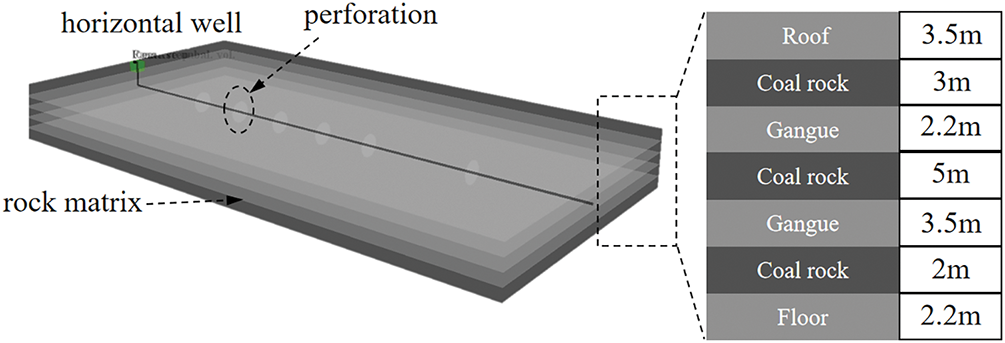
Figure 4: Numerical model of horizontal well fracturing based on the discrete lattice method
3.2 Validation of Computational Models
A schematic of Penny-type fracture propagation is shown in Fig. 5. Savitski derived theoretical functions relating the size parameters of Penny-type fracture propagation, injection pressure, elastic modulus, Poisson’s ratio, and other factors [20]. In this study, a viscous-dominated Penny-type fracture propagation model with fluid pressure was used to validate the discrete lattice numerical method against the analytical solution.
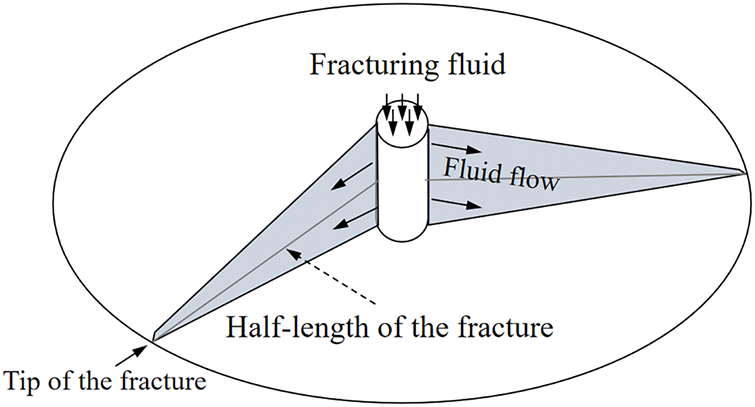
Figure 5: Schematic diagram of Penny-type hydraulic fractures
By combining the parameters in Table 1, the analytical solution of the model was calculated, and the corresponding simulation results at different times were obtained using the discrete element model for comparison. Simulation of fracture width distribution along the tangential direction under identical boundary conditions with five different lattice sizes (110, 80, 50, 30, and 10 cm) indicates that the maximum fracture width occurs at the injection point as illustrated in Fig. 6a. Lattice sizes smaller than 50 cm ensure sufficient computational accuracy; however, excessively fine lattices significantly reduce computational efficiency. A size of 50 cm is thus selected as the optimal balance between accuracy and efficiency of calculation. As shown in Fig. 6b, after 1.2 s, the hydraulic fracture expanded in a Penny shape with a radius of approximately 2.34 m, and the fracture width at the injection point was 1.61 mm. A comparison of the variation in fracture width over time revealed that the simulation results were generally smaller than the analytical results, but the error was less than 5%, indicating that the discrete lattice method has a certain degree of accuracy in modeling fracture propagation.
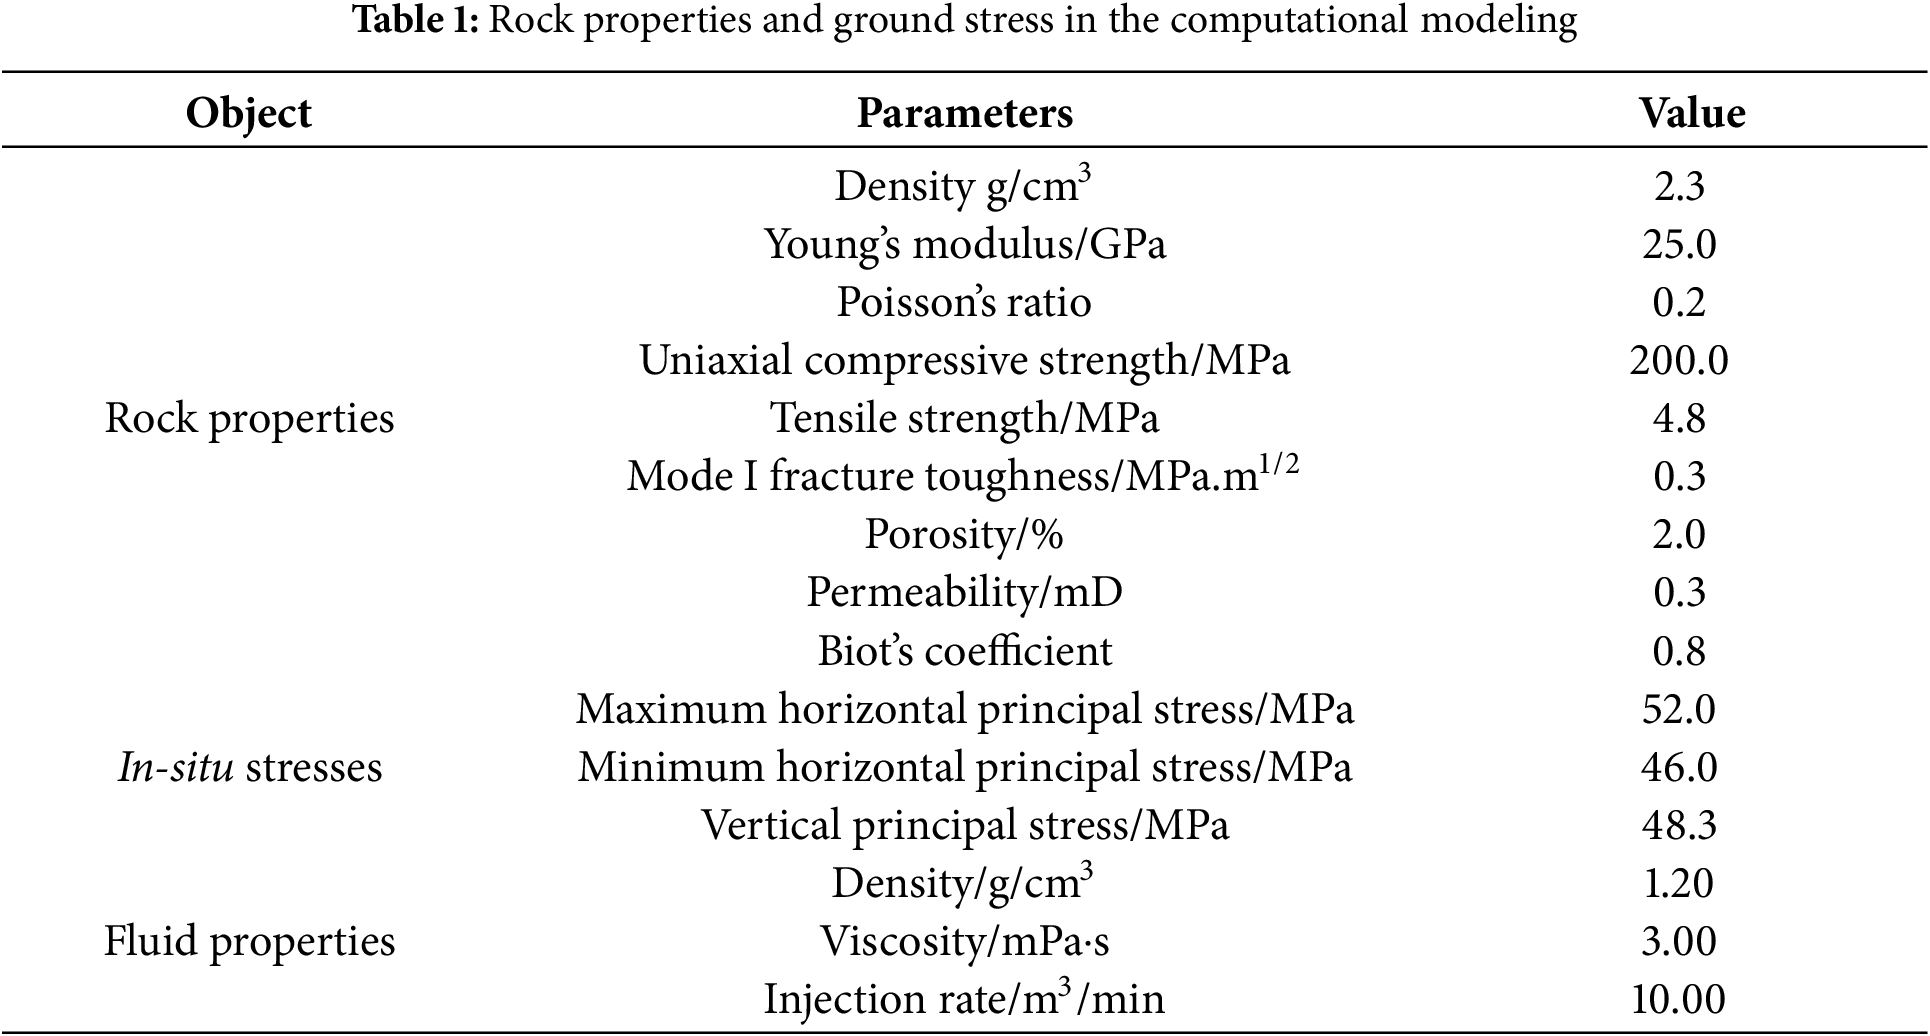
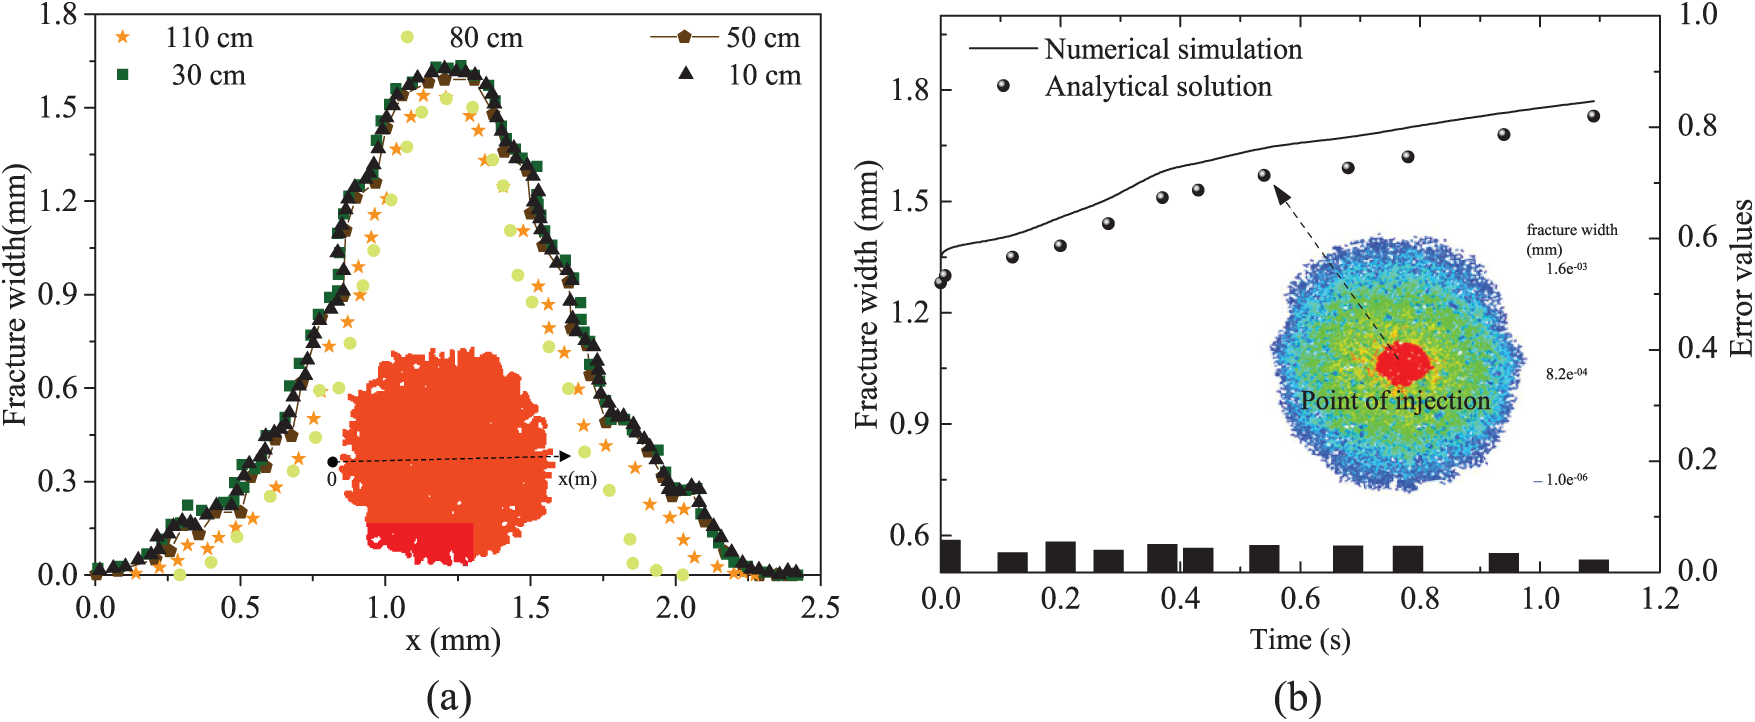
Figure 6: Validation of model accuracy. (a) Independent verification of lattice size; (b) Comparison of the analytical solution with the numerical solution
4 Coal Seam Fracture Propagation Pattern after Fracturing under Multi-Factors
4.1 Preliminary True Triaxial Experiment on Single-Cluster Fracture Propagation
True triaxial experiment can accurately reflect the horizontal stress and crack propagation status in real field conditions. By converting the input parameters of the true triaxial experiment using similarity criteria, the experimental parameters before and after conversion are shown in Table 2 [21]. To quantify the multi-cluster fracture propagation in coal seams, outcrop rock samples from the L block were processed to dimensions of 300 mm × 300 mm, as shown in Fig. 7. A true triaxial experiment was conducted to preliminarily characterize single-cluster fracture propagation and pressure fluctuations in coal seams, laying the groundwork for further simulations.
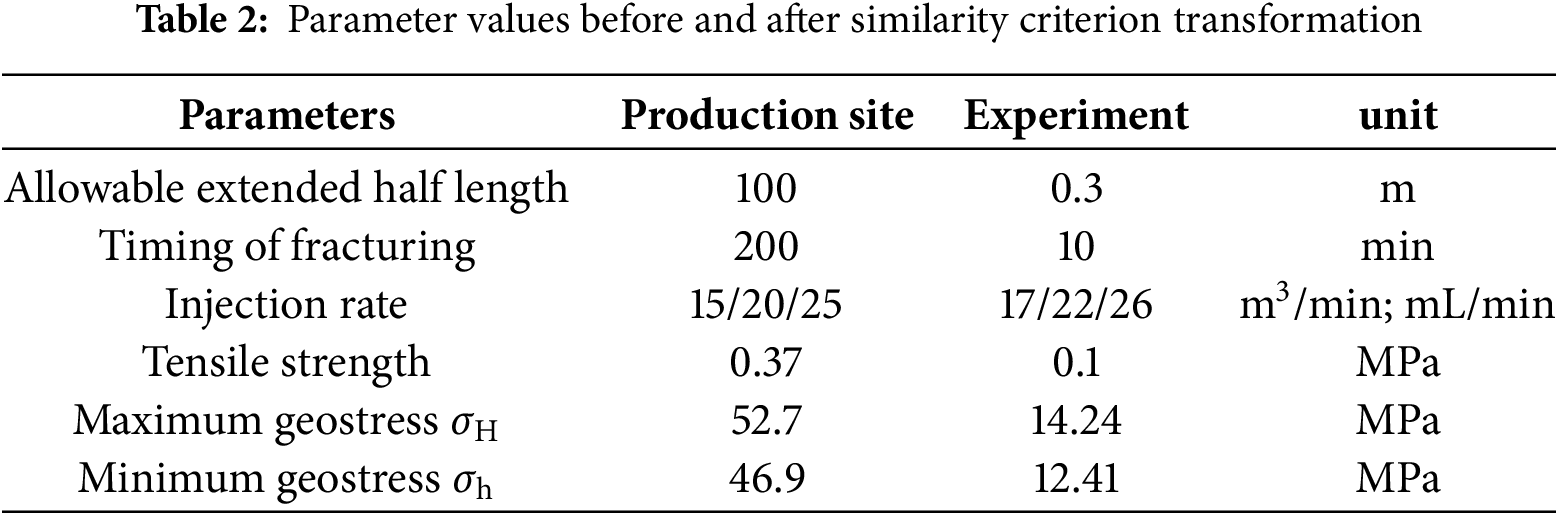
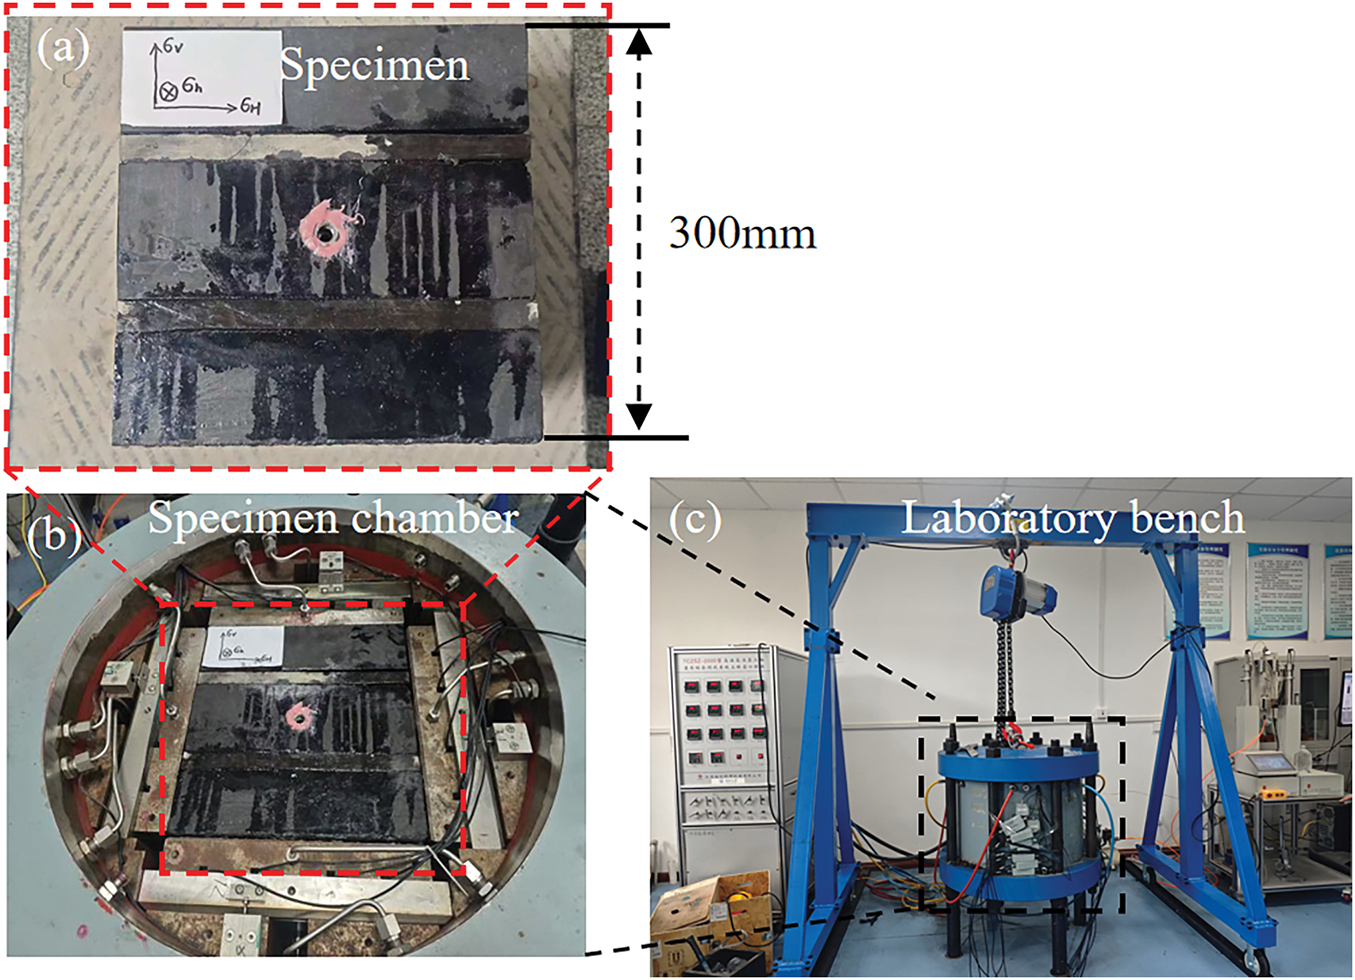
Figure 7: True triaxial experiment process of coal sample fracture propagation. (a) Rock specimen; (b) Specimen pressure chamber; (c) Laboratory bench
Due to the similar effects of viscosity and flow rate during the fracture initiation process, experiments were conducted under three different flow rate-viscosity conditions, as shown in Fig. 8. In the low flow rate experiment (sample 3#), the sample fractured at 12.60 MPa due to the low injection rate, resulting in a rapid pressure drop and relatively small fluctuations in the curve, indicating fewer fracture events and the formation of low-angle planar fractures. In contrast, as shown by sample 2#, branching fracture occurred under higher viscosity and flow rate. Particularly, the experiment (sample 1#) showed that the increased viscosity reduced fluid loss within the fracture. After reaching a fracture pressure of 18.24 MPa, multiple branch fractures appeared during fracture propagation, leading to larger pressure fluctuations. After fracturing, the rock exhibited multiple branch fractures, with the overall complexity of the fractures significantly increased.
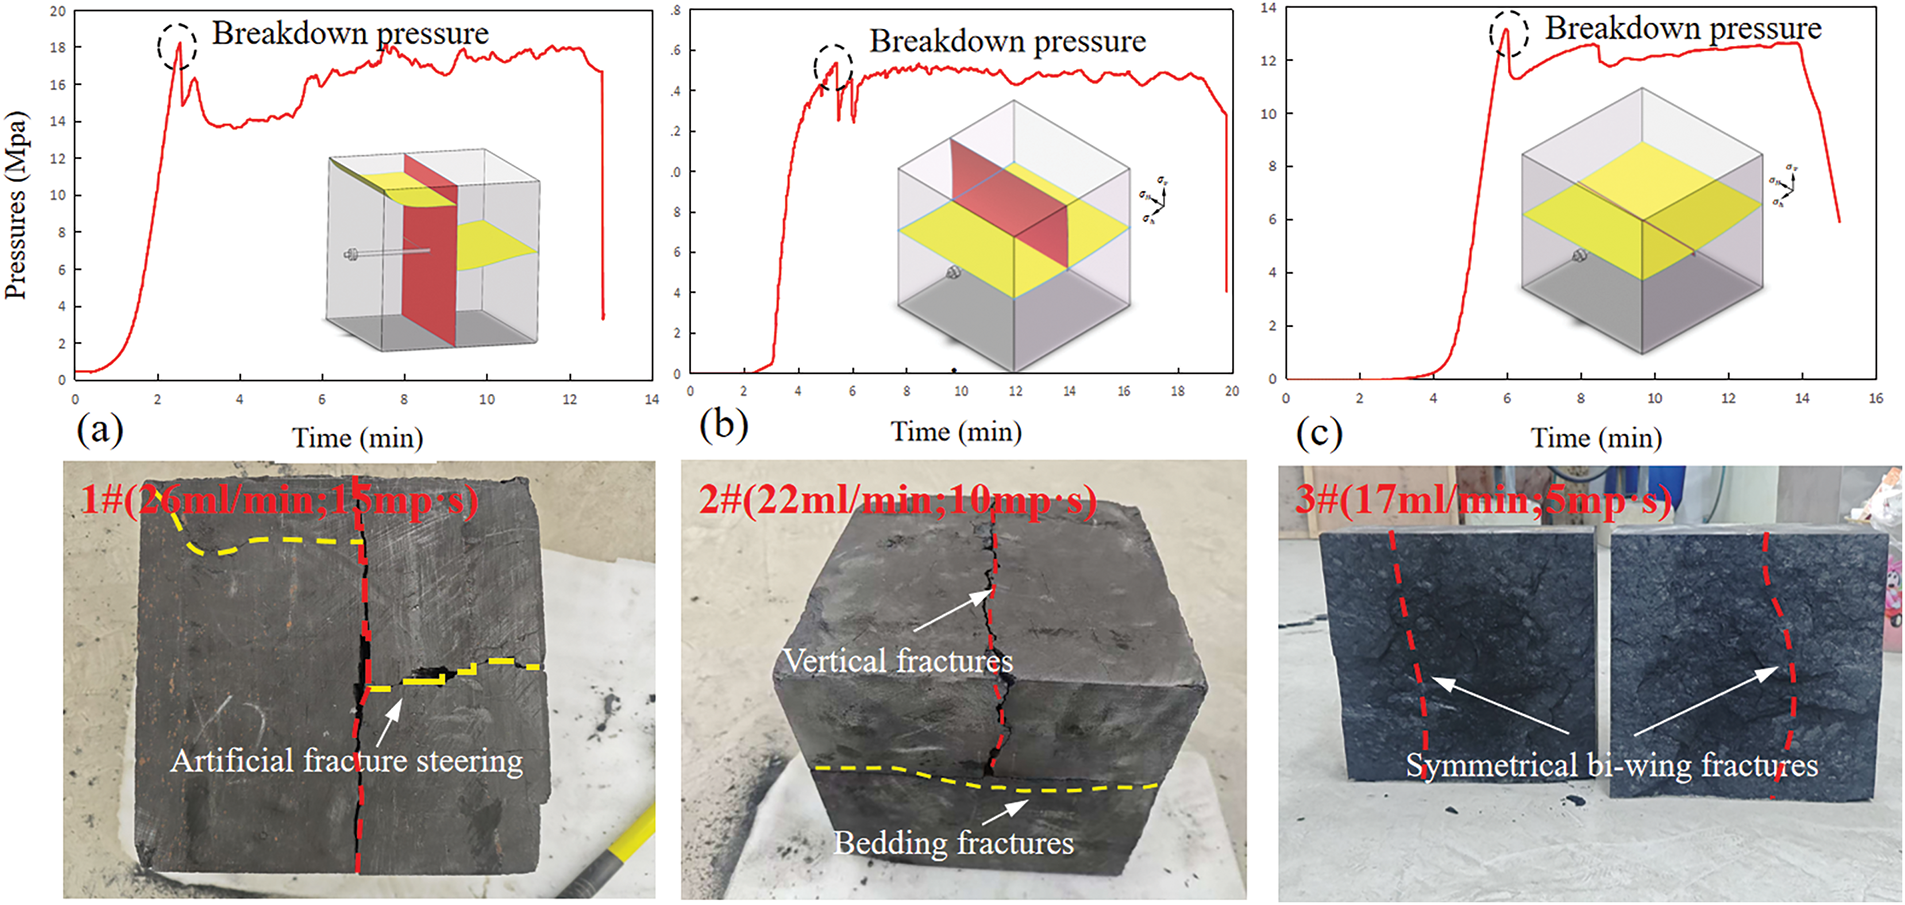
Figure 8: Fracture behavior and pressure response under different viscosities and flow rates. (a) Post-fracturing characteristics of 1#; (b) Characteristics of 2#; (c) Characteristics of 3#
By combining the cohesive strength measured between interfaces, typical deep coal samples containing seven layers, including coal seams, gangue, and top and bottom plates, were artificially bonded. Three gangue layer thicknesses were studied under identical construction conditions, as shown in Fig. 9. The results revealed that with a 2 cm of gangue, vertical fractures form within the coal seam, intersecting the interface and passing through the gangue. For gangue thicknesses ≥4 cm, fractures turned toward the bedding plane after encountering the gangue, limiting the fracture height.
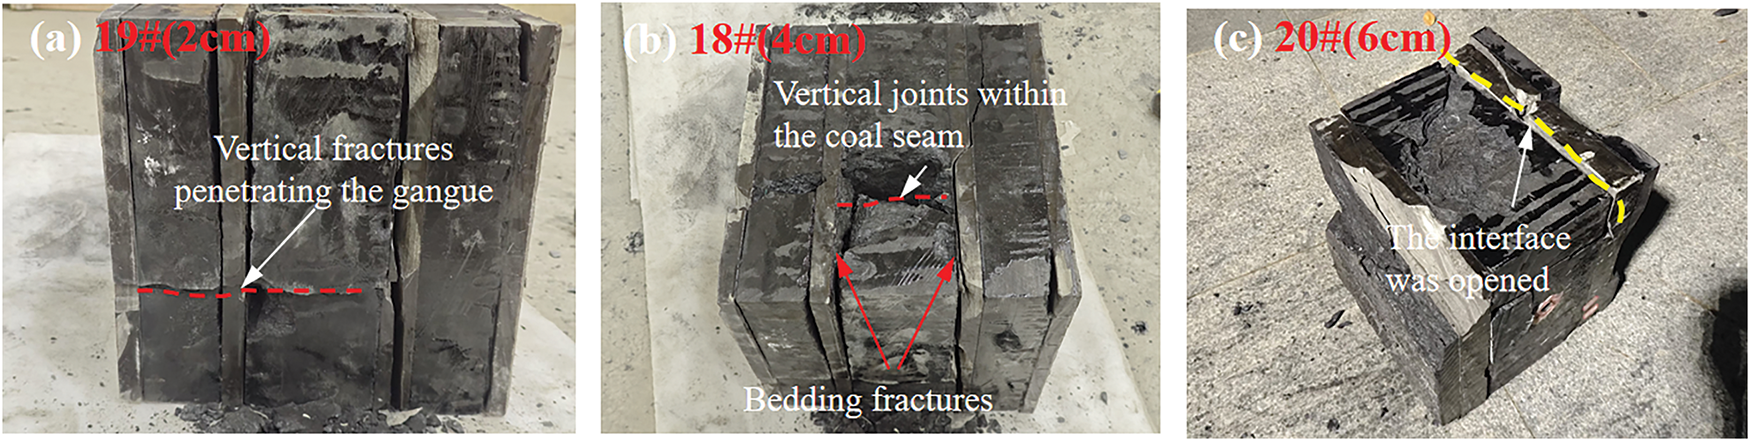
Figure 9: Fracture propagation in coal samples under different gangue layer thicknesses. (a) Fracturing result of 19#; (b) Fracturing result of 18#; (c) Fracturing result of 20#
4.2 Impact of Injection Rate on Multi-Cluster Fracture Morphology after Fracturing
The 3D discrete lattice method was used to simulate hydraulic fracture propagation in deep coal seams. The model incorporates seven strata, including coal, limestone, and top/bottom plates, to study vertical fracture growth. Geological data and well log interpretations from the L block coal seam gas area were used to construct a three-dimensional fracture propagation model, ensuring accurate simulation results.
Well L-38, located in the southern part of the second development area, features a horizontal wellbore aimed southwest of the wellhead. The fracturing segment is selected based on low GR values and high gas measurements to reduce operational complexity, with an optimized design for both uniform and non-uniform fracturing. Different fracture models were built by assigning lithological properties to each layer. Pressure comparisons for two wells with varying injection rates reveal significant impacts on the fracture morphology and SRV. A multi-cluster liquid distribution effect necessitates optimizing injection rates through numerical simulation to ensure effective stimulation.
Simulation results under five different injection rates, shown in Fig. 10a, reveal that at a low rate (16 m³/min), the third fracture cluster struggles to propagate due to interference from the fourth cluster, causing deflection. Communication between the two main fractures may lead to interference, potentially affecting production in the field. Due to the stress shadow effect and insufficient fracture pressure, the interface of the fifth and sixth clusters was activated, limiting the height of fractures. Fluid pressure contours show greater injection and pressure in the main fractures, with the highest pressure occurring between fractures, whereas the pressure across interfaces and layers is lower.
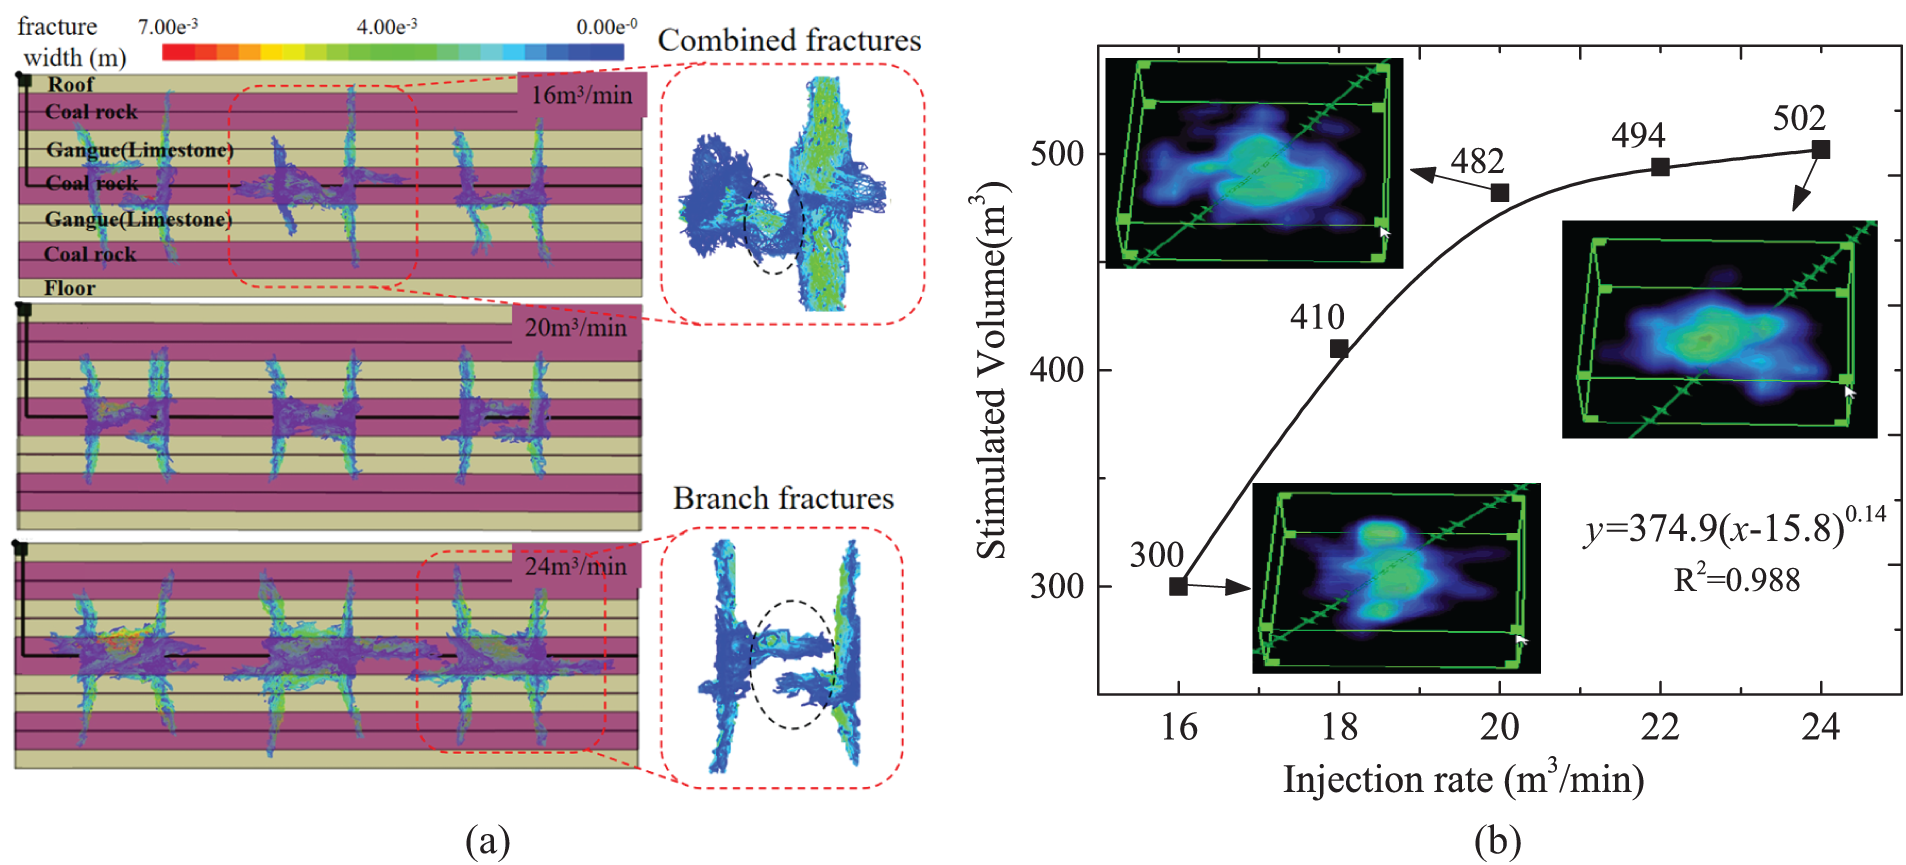
Figure 10: Fracturing results at different injected rates. (a) Multi-cluster fracture propagation at three different rates; (b) Changes in stimulated volume
At an injection rate of 20 m³/min, the fracture height increases, and the main fracture of third cluster extends more extensively, demonstrating that higher injection rates effectively mitigate the stress shadow effects on outer fractures (clusters 1 and 6). Fractures penetrate the coal seams into the gangue of limestone; however, due to the high stress and elasticity of the limestone, significant fluid energy loss hinders further penetration into deeper coalbed methane reservoirs. As injection rate increases, the number of active clusters also increases, leading to more uniform fracture propagation. At an injection rate of 24 m³/min, large fractures form and propagate across bedding planes. The propagation process is influenced by stress interactions from other fractures, with higher injection rates promoting fracture connectivity and forming a complex fishbone-shaped fracture network, significantly enhancing fluid permeability within the formation. Additionally, high flow rates may induce a transition from laminar to turbulent flow within the fracture, increasing shear stress on the fracture walls and facilitating fracture propagation by overcoming resistance caused by rock heterogeneity. However, excessively high injection rates can intensify fluid leakage and trigger fracture branching, thereby reducing the controllability of fracture geometry. Effective SRV calculated at five injection rates shows a power-law increase with injection rate, as shown in Fig. 10b. A marked increase in SRV is observed at 22 m³/min, reaching approximately 1.64 times that at 16 m³/min. Beyond this rate, further increases in injection rate yield diminishing production returns.
4.3 Different Viscosities and Horizontal Stress Differences on Multi-Cluster Fracture Propagation
Fluids with different viscosities exhibit distinct advantages and disadvantages in fracture creation and enhancing the SRV. In field fracturing, the complexity of the fracture network is typically used to assess fluid viscosity. Numerical simulations of horizontal well fracturing were conducted with varying viscosities of fracturing fluids (5/25/45 mPa·s) to evaluate the fracture creation capabilities of each viscosity system. As shown in Fig. 11, owing to the stress shadow effects and insufficient fluid pressure, the cracking extent of the two middle clusters (clusters 4 and 5) is relatively low.
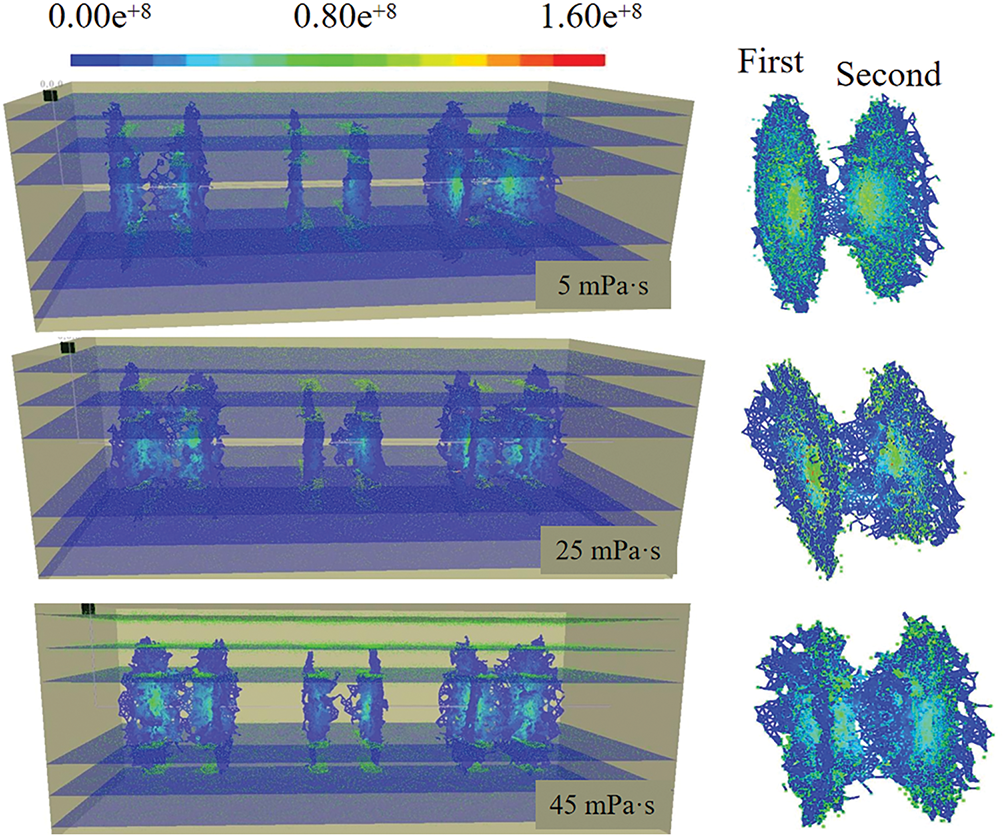
Figure 11: Contours of multi-cluster fracture widths at three different viscosities
Under varying viscosity conditions of fracturing fluids, fracture propagation notably differs. At a viscosity of 5 mPa·s, fluid pressure is distributed across both the main fractures and bedding planes, with elevated pressure in the main fractures facilitating fracture communication. At 25 mPa·s, activation of the 4th and 5th fracture clusters is limited, but the fractures begin to connect, with the 1st and 2nd clusters linking to the 5th and 6th clusters, resulting in more complex fracture patterns that penetrate lower coal seams. Fluid pressure contours reveal high-pressure zones concentrated at initiation points, and fractures laterally extend through bedding planes, further linking adjacent fractures.
At 45 mPa·s, the 3rd and 4th clusters show increased height extension, with enhanced fracture communication. The propagation of fractures becomes more uniform, extending vertically into the upper bedding planes with discontinuous propagation, indicating limited interlayer penetration. As viscosity increases, fracture propagation becomes more balanced, enhancing flow paths and creating a more effective fracture network. High-viscosity fluids facilitate the formation of a complex fishbone-like network, reducing flow resistance and significantly promoting fracture growth with the highest fluid pressure at the fracture tips.
The state of the horizontal stress field and the mechanical properties of rocks determine the direction, morphology, and SRV of post-fracturing fractures, which significantly affects the increase in productivity from fracturing [22,23]. Typically, high horizontal stress difference anisotropy counteracts the stress shadow effect on fracture deflection, forcing fractures to propagate in the direction of maximum stress, resulting in limited fracture divergence. In contrast, low horizontal stress difference anisotropy favors the formation of a complex hydraulic fracture network, and the mutual exclusion between fractures leads to significant differences in fracture geometry. The stress difference distribution of the target well is complex, with a stress difference ranging from 1–6 MPa. The horizontal stress difference in different blocks is oriented N15°-45°W, and the local reservoir modification range is limited (Fig. 12a). Therefore, fracturing parameters must be optimized based on the varying stress distribution. Through simulation calculations under the combined influence of viscosity and horizontal stress difference, typical fracture propagation patterns under different conditions are mapped as Fig. 12b, providing effective support for optimizing multi-cluster fracturing parameters in deep coal seams at the field site.
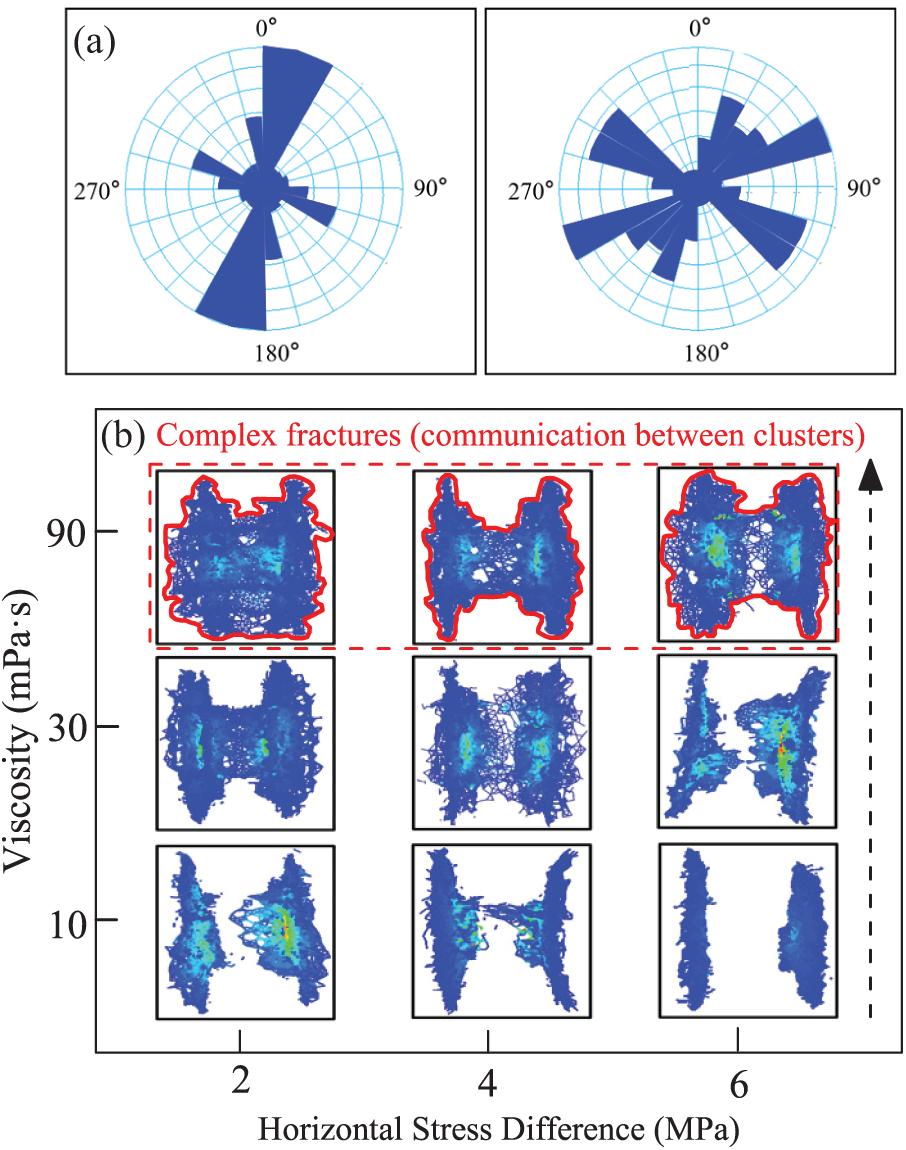
Figure 12: Combined effect of two factors. (a) Distribution of horizontal stress difference; (b) Map of the post-fracturing fractures in different stresses and viscosities
The results indicate that there is a critical viscosity difference (30 mPa·s). When the viscosity exceeds this value, the impact of the horizontal stress difference becomes negligible. However, when the viscosity is lower than this value, the combined effect of both factors is significant. At lower viscosities, such as 5 mPa·s, a larger proportion of the fluid infiltrates the formation, resulting in a lower pressure buildup within the fracture, which is insufficient to form dominant hydraulic fractures perpendicular to the minimum horizontal stress direction. As the viscosity increases to 30 mPa·s, the number of activated natural fractures and bedding fractures increases, and the fracture network becomes more complex. High-viscosity fluids typically exhibit laminar flow within fractures, which helps maintain a stable pressure field and promotes the formation of uniform fracture morphology. The reduction in fluid loss rate effectively concentrates more fracturing energy at the fracture tip, thereby facilitating continued fracture propagation. However, due to the higher viscosity, fracture height control becomes more difficult, and fractures are more likely to penetrate into aquifers or the cap rock, reducing the influence of horizontal stress. Therefore, for coal seam gas fracturing in the target well, a viscosity of approximately 30 mPa·s is recommended.
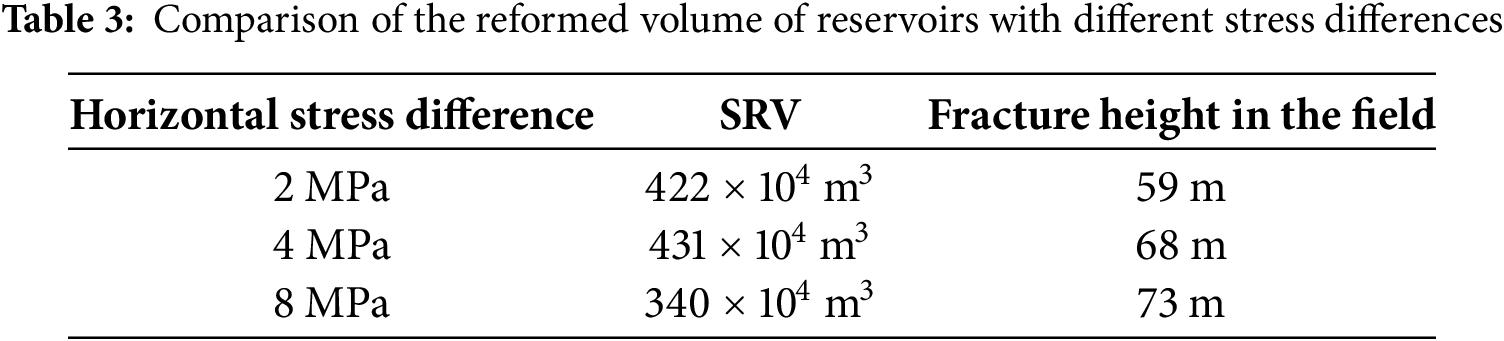
During prolonged fracturing at 4 MPa, microseismic monitoring indicated an SRV of 4.31 × 10⁶ m³ (Table 3). Under the same injection viscosity, wells with a stress differences (8 MPa) exhibited predominantly unidirectional fracture propagation, resulting in increased fracture height but a reduction in SRV by approximately 20%. In contrast, low stress tends to induce the formation of multi-directional, dispersed fractures, leading to less effective fracture connectivity and stimulation. Furthermore, increasing the viscosity to 30 mPa·s activates more natural and bedding fractures, which complicates fracture height control during operation.
4.4 Effects of Different Gangue Thicknesses on Multicluster Fracture Propagation
In coal seam geology, varying thicknesses of gangue and mudstone layers significantly affect multi-cluster fracturing, restricting efficient coalbed methane extraction. By analyzing geological stratification data from the target well area, the thickness of the gangue and the initial coal seam thickness for fracture initiation were identified as key variables. Numerical simulation results for gangue thicknesses of 2, 4, and 6 m are shown in Fig. 13.
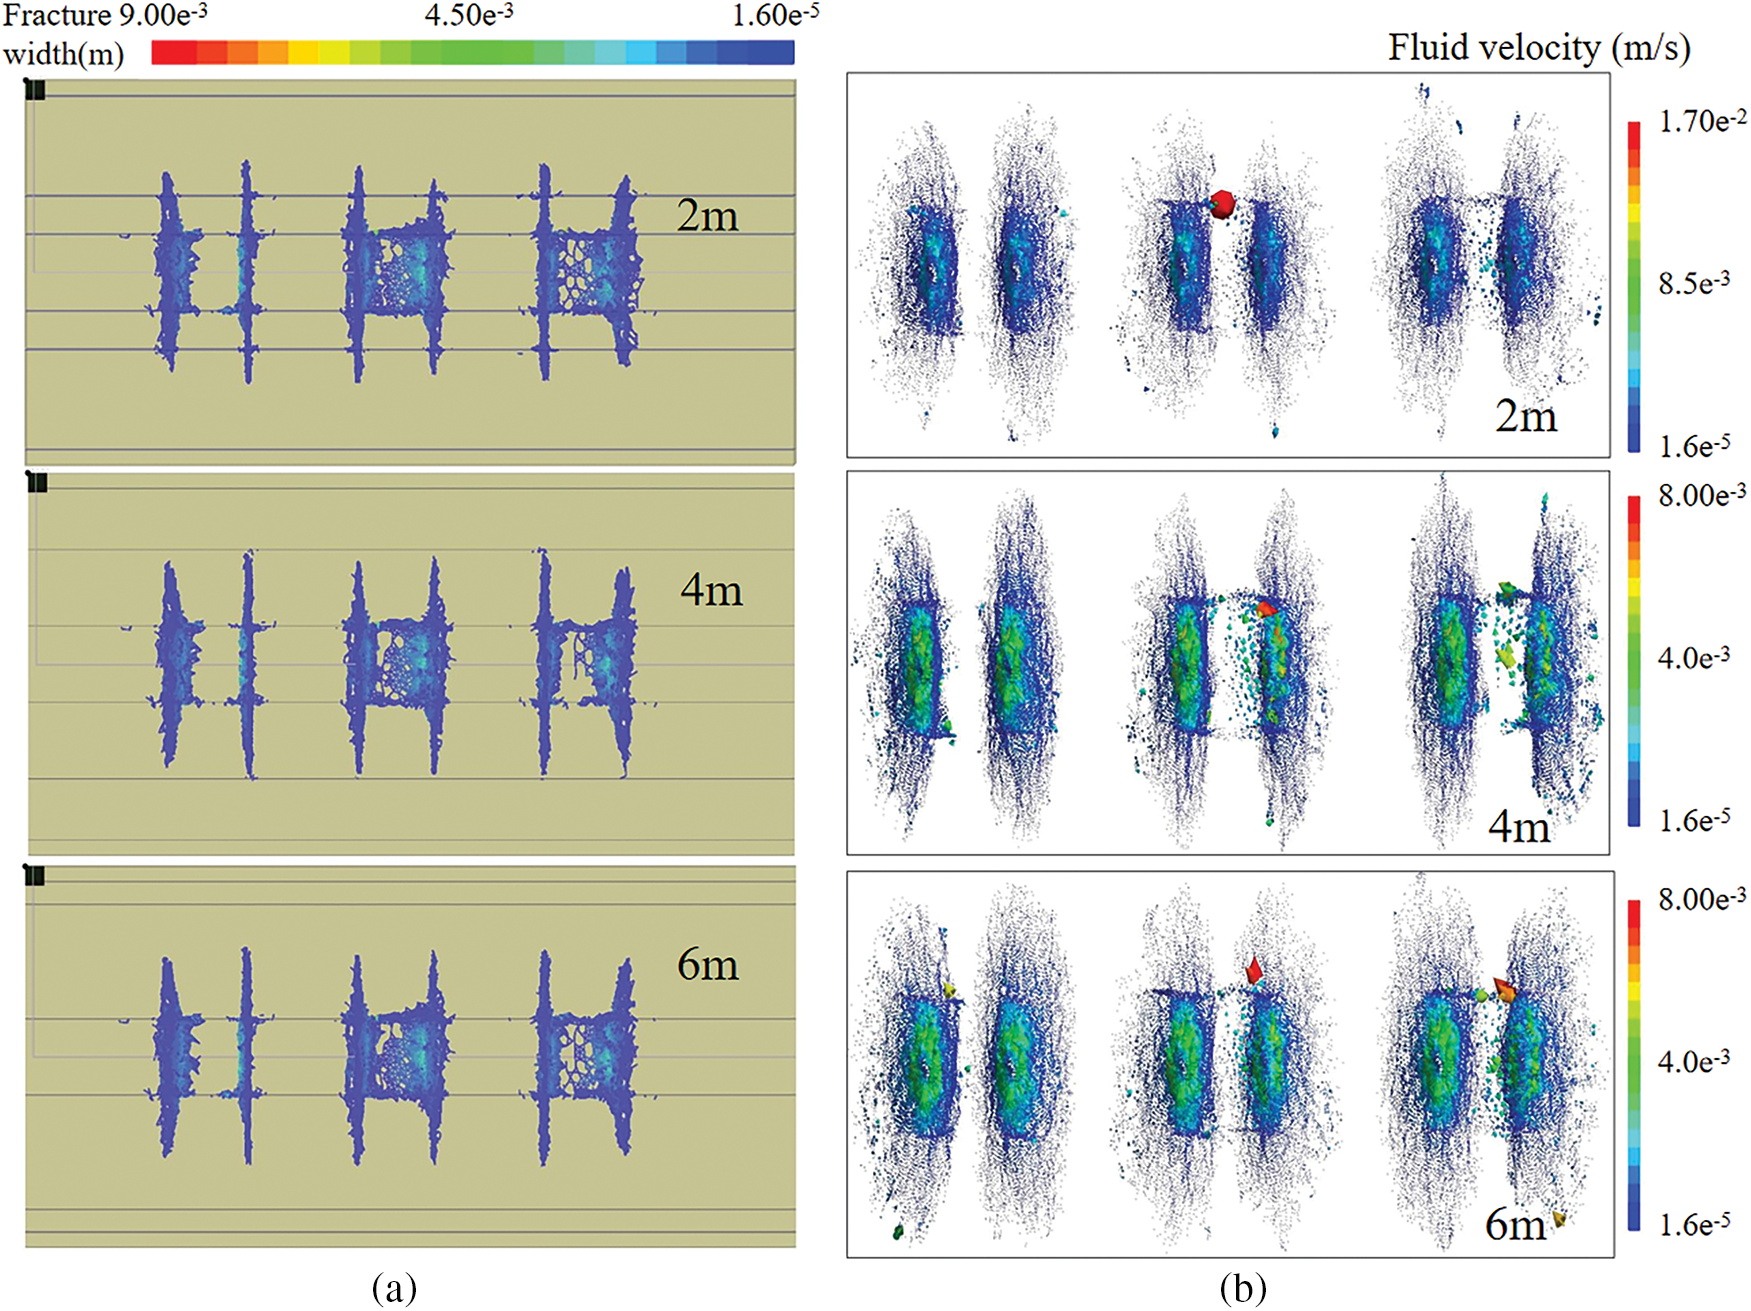
Figure 13: Contours for different gangue thicknesses. (a) Fracture width distributions; (b) Fluid velocity distributions inside the fractures
According to Fig. 14, when the gangue layer thickness is 2 m, the fluid pressure is evenly distributed, with high-pressure zones concentrated in the main fracture, promoting deeper fracture propagation and enhancing productivity. The fracture network has good connectivity, and the fluid velocity distribution is uniform. When the gangue layer thickness increases to 4 m, fracture propagation is somewhat inhibited, particularly in the vertical direction. Fractures tend to extend along the interface of the gangue layer, leading to reduced complexity. Furthermore, when the gangue layer thickness reaches 6 m, vertical propagation is significantly restricted, and the fracture network becomes simpler.
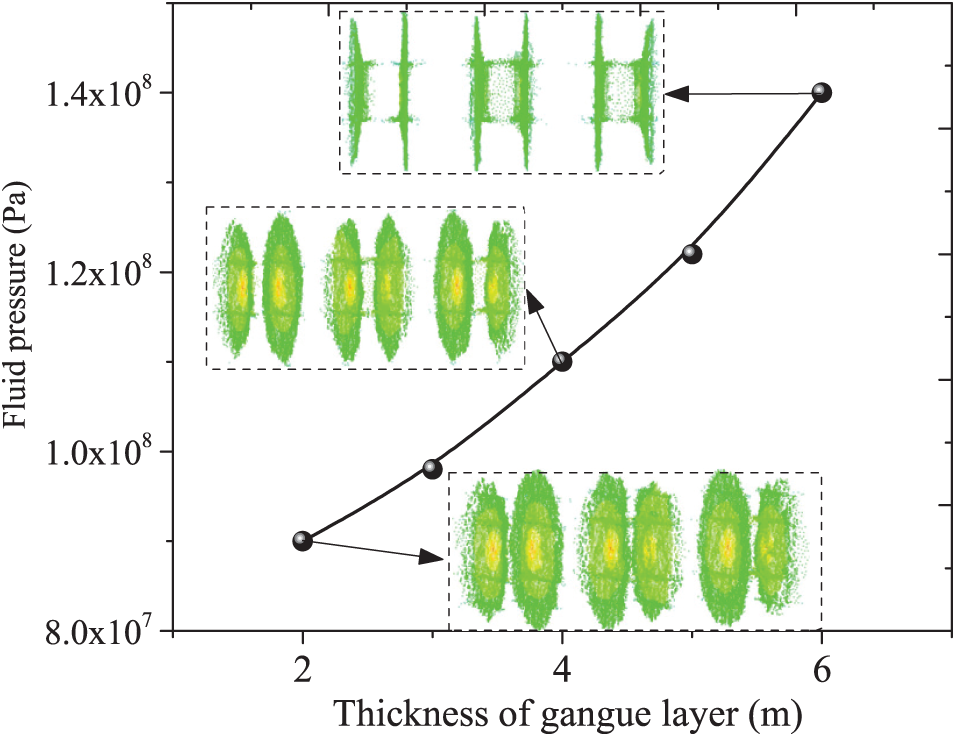
Figure 14: Fluid pressure in the fracture at three different thicknesses of the gangue layer
As the gangue thickness increases, vertical fracture propagation weakens, fluid flow becomes less uniform, and paths are concentrated. In thin gangue layers, fractures extend further with higher fluid velocity, improving reservoir recovery. In thick gangue layers, fracture propagation is limited, with fluid velocity concentrated in the main fracture, reducing overall reservoir stimulation.
4.5 Effect of the Gangue-to-Wellbore Distance on Multi-Cluster Fracture Propagation
The distance between the gangue layer and the wellbore is another important factor influencing hydraulic fracture propagation [24,25]. Fig. 15a shows the fracture propagation pattern when the gangue layer is 3 m away from the horizontal well. The fracture width contour map indicates significant extension both vertically and horizontally.
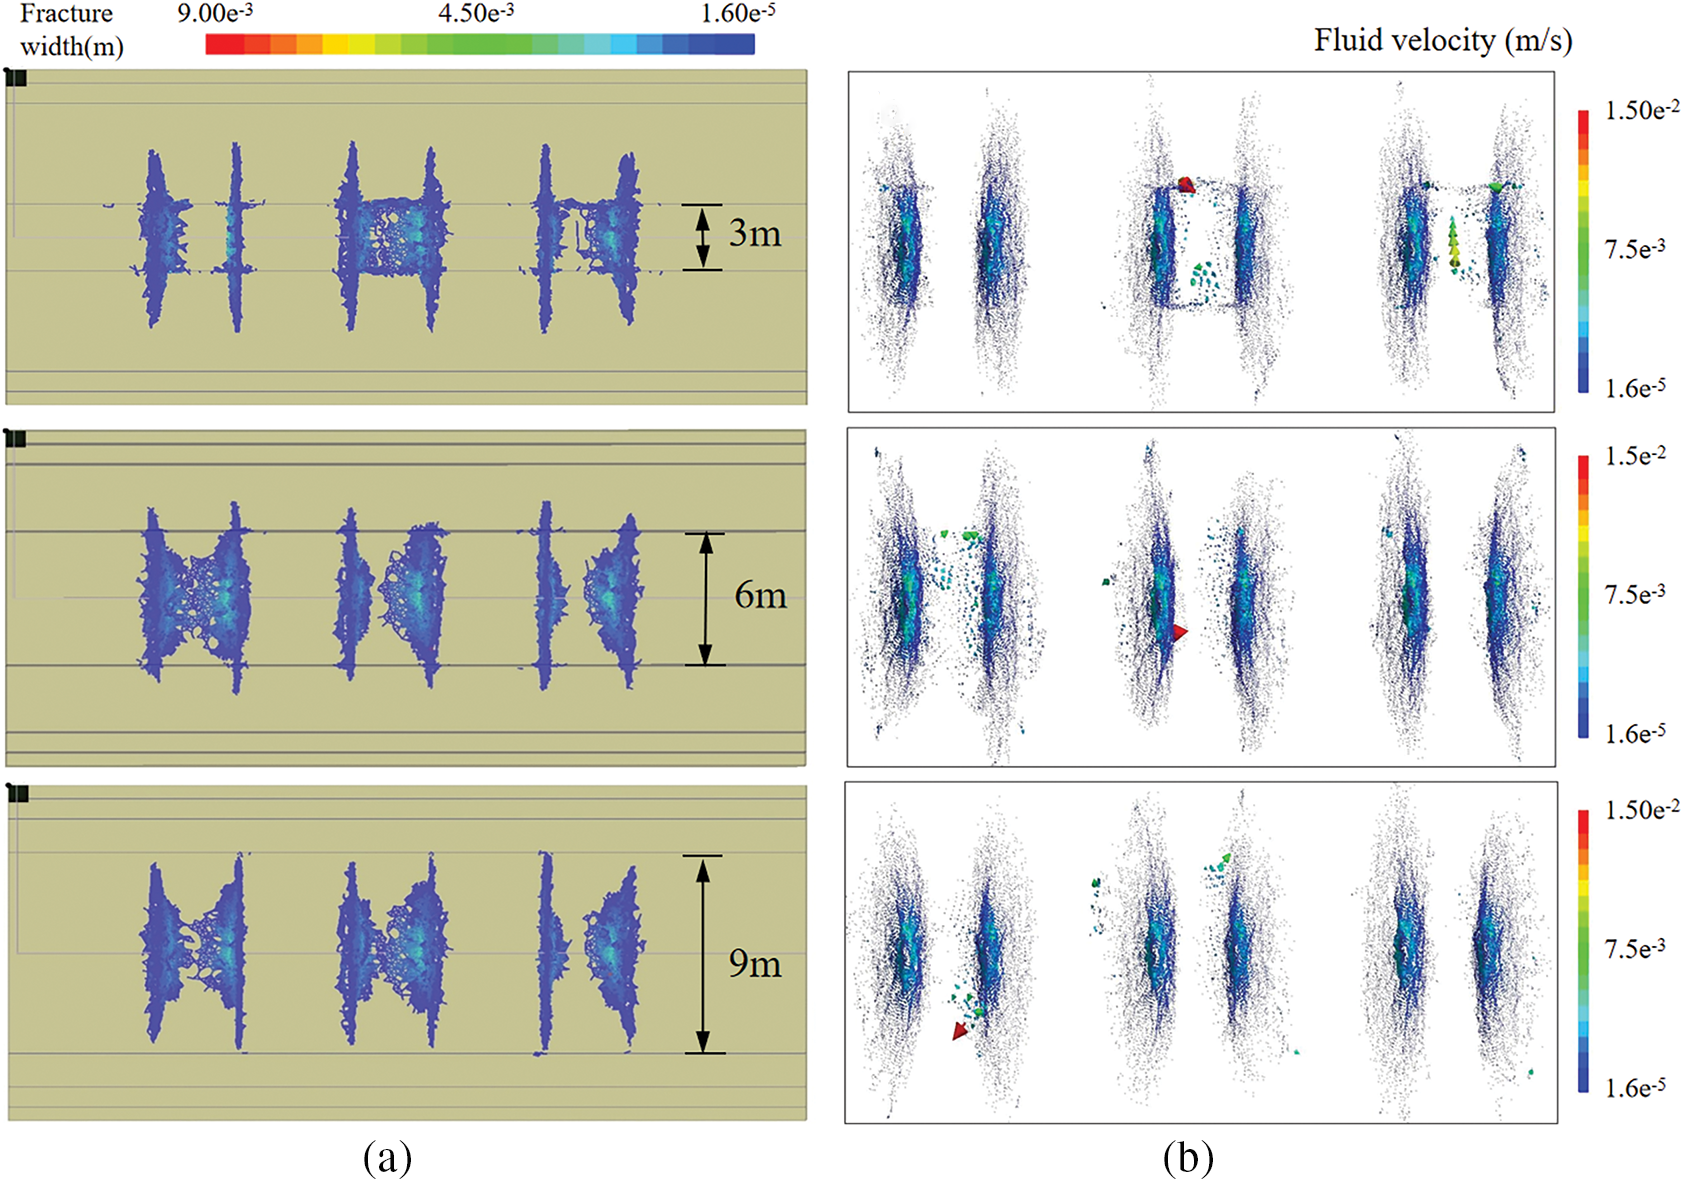
Figure 15: Contours for different distances from the gangue layer. (a) Fracture width distributions; (b) Fluid velocity distribution inside the fractures
When the gangue layer is 3 m away from the horizontal well, the fluid pressure within the fracture is concentrated, particularly at the center, where maximum values are reached, indicating that fluid maintains a high driving force over a short distance, effectively promoting fracture extension toward the gangue layer. The flow velocity distribution is relatively uniform, with a peak velocity at the fracture center, signifying efficient energy transfer and favorable fracturing results. However, as the distance to the gangue layer increases, fracture propagation becomes constrained, particularly in the vertical direction. Energy consumption near the gangue layer inhibits further propagation, reducing fracture width and complexity. As a result, the fluid pressure distribution becomes more dispersed, the high-pressure zone shrinks, and the fluid driving force weakens, as shown in Fig. 15b. Flow velocity also becomes uneven, with a decline in velocity at the fracture center, reflecting reduced fluid transfer efficiency. At a distance of 9 m from the gangue layer, fracture propagation is significantly suppressed, and fluid energy is nearly exhausted. The fracture struggles to penetrate the gangue layer as the pressure decreases and the flow velocity decreases, especially at the fracture tip, thus diminishing both fracture propagation and permeability.
5 Fracturing Parameter Optimization
5.1 Optimization of Temporary Plugging Timing
Temporary plugging is commonly used in deep coal seam horizontal fracturing to guide fracture propagation and enhance stimulation performance. However, research on its optimal implementation timing remains limited, with field practices largely relying on empirical judgment due to the lack of systematic theoretical guidance. Specifically, Fig. 16 shows a rapid pressure increase during the sand addition phase in key wells, indicating difficulty in extending the main fractures. Following temporary plugging, a significant pressure rise is observed, confirming the effectiveness of temporary plugging in the treated sections or clusters.
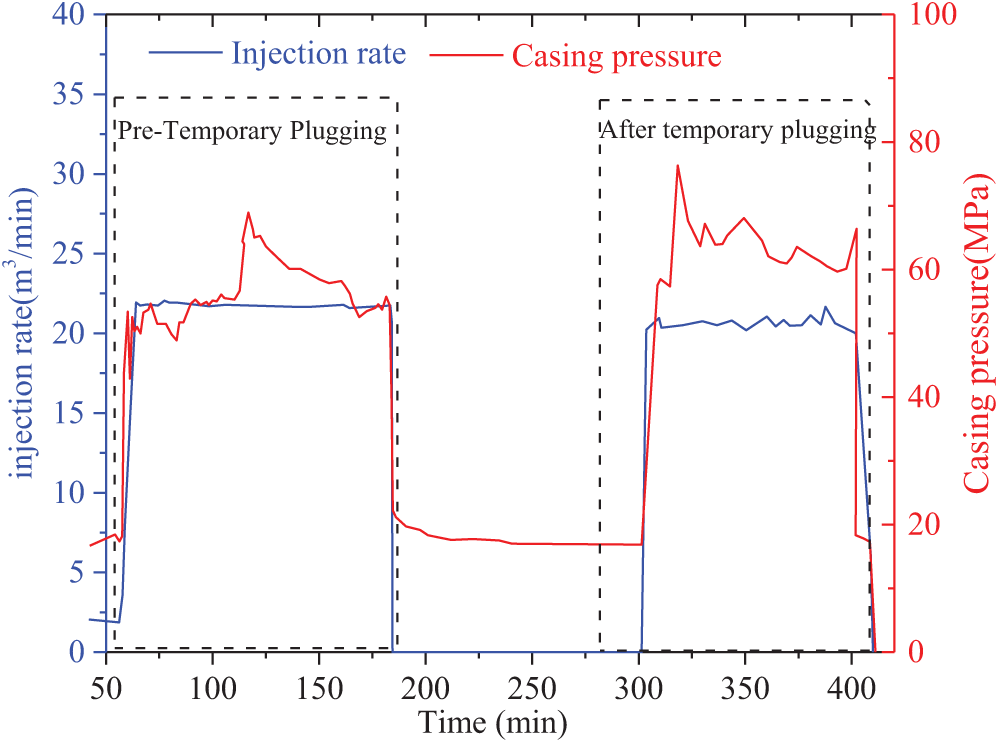
Figure 16: Curves of the pressure of temporary plugging fractures in well
Taking a flow rate of 20 m³/min as an example, temporary plugging is carried out at 120 min after fracturing, with other boundary conditions considered. A seven-layer geological model is established, with the middle layer being the coal seam, surrounded sequentially by gangue, coal seam, carbonaceous mudstone, and coal seam layers. Based on the field fracturing temporary plugging time, three temporary plugging timings are selected for analysis: 60, 90, and 150 min after fracturing. To increase coalbed methane development and production efficiency, the timing of temporary plugging agent addition is considered as a variable for numerical simulation research on temporary plugging and diversion in deep coal seam horizontal wells.
As shown in Fig. 17, after 60 min of fracturing, the plugging agent limited excessive fracture growth, with the main fracture height reaching 10.7 m and an effective SRV of only 433 m³. Fluid accumulation near the wellbore disrupted proppant placement, reducing fracture conductivity. At 90 min post-fracturing, the primary fracture extended toward the interface, and the SRV increased to 497 m³. Temporary plugging elevated the pressure at the fracture tip, promoting interlayer penetration and enabling multilayer stimulation. This process helped balance fracture height and length, reduce fluid loss, and enhance vertical propagation. By 150 min, the main fracture was sealed, redirecting fluid along weak planes into gangue, which increased network complexity and yielded an SRV of 462 m³. Fracture height reached 12.9 m, but prolonged injection led to more uneven growth between the fifth and sixth clusters. Accordingly, a 90-min fracturing duration is recommended to optimize reservoir stimulation, as both shorter and longer injection times can hinder fracture propagation and reduce effectiveness.

Figure 17: Two views of temporary plugged fracture propagation patterns after three different fracturing times
5.2 Fracture Propagation Law under Engineering-Geological Parameters
Based on the simulation results, the impacts of the fracturing fluid viscosity and injection rate on fracture propagation in deep coalbed horizontal wells are analyzed. Fig. 18 illustrates the fracture patterns with respect to the stress difference and injection rate. High injection rates and viscosity fracturing fluids enhance the connectivity between clusters, increasing the complexity of post-fracturing fractures. On the other hand, a moderate injection rate is crucial for forming the optimal fracture morphology.
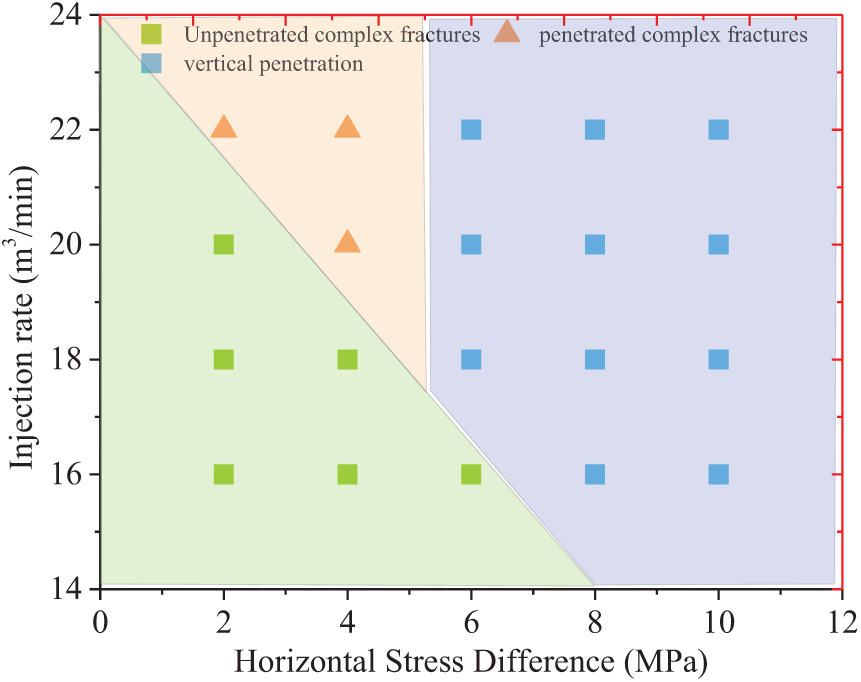
Figure 18: Map of the combined effects of the fracturing fluid flow rate and horizontal stress difference on fracture propagation
The impacts of the fracturing fluid injection rate and horizontal stress difference on fracture propagation in deep coalbed horizontal wells were analyzed. When the stress difference is 2 MPa, the control of stress on fractures is weak, causing fractures to easily turn along natural weak planes, leading to the formation of secondary fractures. However, an ideal fracture network requires not only easy deflection of hydraulic fractures but also vertical propagation to connect more layers and weak planes. Without this, high-density small fractures will form only near the initiation point. As the stress difference increases, fracture width gradually decreases. When the stress difference exceeds 6 MPa, hydraulic fractures are more likely to initiate and extend along the vertical minimum horizontal principal stress direction at the wellbore, with a reduced chance of deflection, leading to simpler fracture shapes. Moreover, under the same stress difference, increasing the viscosity of the fracturing fluid facilitates the formation of a more complex fracture network during propagation.
An analysis of the effects of the interaction between the thickness and distance of the gangue on fracture propagation in deep coalbed horizontal wells, as shown in Fig. 19, reveals that when the gangue is thin and the distance is less than 4 m, fractures are more likely to penetrate the gangue and continue to extend. This suggests that thinner gangue impose weaker restrictions on fracture propagation. As both the thickness and distance of the gangue increase, fracture propagation is significantly suppressed, the fracture height decreases, and fractures fail to penetrate the gangue. A thinner gangue layer poses less restriction on fracture propagation, causing fractures to extend primarily along the main stress direction, easily penetrating the thin gangue and forming vertical main fractures. In contrast, thicker gangue and greater distances hinder fluid pressure transmission, substantially reducing the fracture propagation capacity and limiting the development of the fracture network.
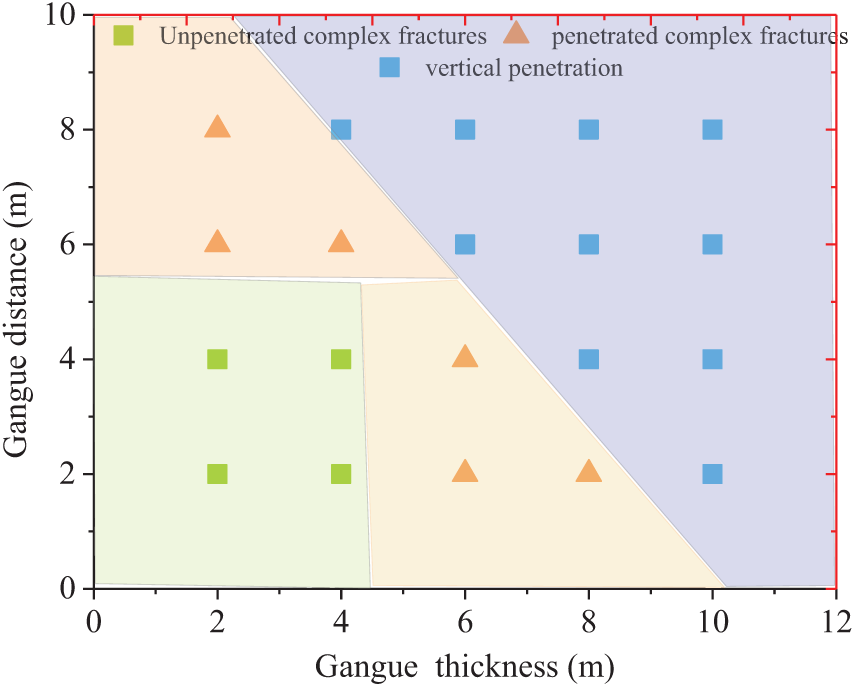
Figure 19: Map of the combined effects of the thickness and distance of the gangue layer on fracture propagation
The geological structure and mechanical properties of the deep coal seams in the L block are complex, with significant differences in the coal and rock properties, geological characteristics, and horizontal stress distributions across different layers. Based on engineering-geological classification methods, coal seams are divided into different reservoir types according to their geomechanical properties. A fracture propagation model is established using the discrete lattice method under multiple influencing factors, and a targeted reservoir transformation plan is proposed, focusing on non-uniform perforation, temporary plugging, and stress interference for balanced multi-fracture propagation control.
1. Under the same conditions in L block, SRV increased with injection rate following a power-law trend. Increasing the rate from 16 to 22 m³/min raised the breakdown pressure by 1.2 times, increasing the fracture complexity and expanding SRV by 1.64 times.
2. Similar to high flow rates, high-viscosity fluids increase fracture network complexity by increasing fluid pressure at the fracture tip, resulting in a bifurcated fracture network. However, when there is a stress difference, excessive flow rates can lead to an imbalance in the activation of fracture clusters at the interface. Therefore, selecting an optimal injection rate is crucial for activating and connecting more reservoirs.
3. As the thickness of the gangue and the distance from the horizontal well increase, the vertical propagation capability of fractures gradually weakens. The fluid velocity distribution becomes more uneven, and the flow path tends to become more concentrated.
4. Early temporary plugging (30 min) limited fracture propagation, while plugging at 90 min promoted interlayer penetration, forming a complex multi-wing fracture network and increasing the SRV by 15%. However, overly delayed plugging led to uneven growth of the main fractures and a subsequent decrease in SRV.
Acknowledgement: We would like to thank all the authors for their guidance and help on this article.
Funding Statement: This study was funded by the project of the State Key Laboratory of Petroleum Resources and Engineering (No. PRE/open-2307), the CNOOC Research Institute (No. 2020PFS-03).
Author Contributions: Study conception and design: Biao Yin, Xuesong Xing, Li Wang; data collection: Jingyu Zi; analysis and interpretation of results: Guangai Wu, Chengyong Peng; draft manuscript preparation: Yanan Hou. All authors reviewed the results and approved the final version of the manuscript.
Availability of Data and Materials: Data will be made available on request.
Ethics Approval: Not applicable.
Conflicts of Interest: The authors declare no conflicts of interest to report regarding the present study.
References
1. Wang G, Xu Y, Ren H. Intelligent and ecological coal mining as well as clean utilization technology in China: review and prospects. Int J Min Sci Technol. 2019;29(2):161–9. doi:10.1016/j.ijmst.2018.06.005. [Google Scholar] [CrossRef]
2. Lin L, Lu H, Huang L, Luo P. A molecular dynamics study of methane/water diffusion and water-blocking effects in coalbed methane. Fuel. 2025;386(2):134234. doi:10.1016/j.fuel.2024.134234. [Google Scholar] [CrossRef]
3. Hubbert MK, Willis DG. Mechanics of hydraulic fracturing. Trans AIME. 1957;210(1):153–68. doi:10.2118/686-g. [Google Scholar] [CrossRef]
4. Abass HH, van Domelen ML, El Rabaa WM. Experimental observations of hydraulic fracture propagation through coal blocks. In: SPE Eastern Regional Meeting; 1990 Oct 31–Nov 2; Columbus, OH, USA: SPE; 1990. SPE-21289-MS. doi:10.2118/21289-ms. [Google Scholar] [CrossRef]
5. Jafari A, Broumand P, Vahab M, Khalili N. An eXtended finite element method implementation in COMSOL multiphysics: solid mechanics. Finite Elem Anal Des. 2022;202(5):103707. doi:10.1016/j.finel.2021.103707. [Google Scholar] [CrossRef]
6. Hou B, Cui Z, Ding JH, Zhang FS, Zhuang L, Elsworth D. Perforation optimization of layer-penetration fracturing for commingling gas production in coal measure strata. Petrol Sci. 2022;19(4):1718–34. doi:10.1016/j.petsci.2022.03.014. [Google Scholar] [CrossRef]
7. Zhang YK, Chen SB, Li XY, Wang HJ. Hydraulic fracturing simulation technology of shale gas reservoir and application of extended finite element method. Nat Gas Geosci. 2021;32(1):109–18. (In Chinese). doi:10.2118/205631-ms. [Google Scholar] [CrossRef]
8. Wu C, Zhang X, Wang M, Zhou L, Jiang W. Physical simulation study on the hydraulic fracture propagation of coalbed methane well. J Appl Geophys. 2018;150(4):244–53. doi:10.1016/j.jappgeo.2018.01.030. [Google Scholar] [CrossRef]
9. Yin B, Lou Y, Liu S. Mechanism of fracture propagation for SC-CO2 fracturing and phase-change process. J CO2 Util. 2024;80(3):102691. doi:10.1016/j.jcou.2024.102691. [Google Scholar] [CrossRef]
10. Peng C, Wu J, Jiang M, Lou Y, Yin B. Study of the transport behavior of multispherical proppant in intersecting fracture based on discrete element method. Energy Eng. 2025;122(1):185–201. doi:10.32604/ee.2024.056062. [Google Scholar] [CrossRef]
11. Tomporowski D, Nitka M, Tejchman J. Application of the 3D DEM in the modelling of fractures in pre-flawed marble specimens during uniaxial compression. Eng Fract Mech. 2023;277(7):108978. doi:10.1016/j.engfracmech.2022.108978. [Google Scholar] [CrossRef]
12. Gong D, Chen J, Cheng C, Kou Y. Factors influencing fracture propagation in collaborative fracturing of multiple horizontal wells. Energy Eng. 2024;121(2):425–37. doi:10.32604/ee.2023.030196. [Google Scholar] [CrossRef]
13. Damjanac B, Detournay C, Cundall PA. Application of particle and lattice codes to simulation of hydraulic fracturing. Comput Part Mech. 2016;3(2):249–61. doi:10.1007/s40571-015-0085-0. [Google Scholar] [CrossRef]
14. Cong Z, Li Y, Tang J, Martyushev DA, Hubuqin, Yang F. Numerical simulation of hydraulic fracture height layer-through propagation based on three-dimensional lattice method. Eng Fract Mech. 2022;264:108331. doi:10.1016/j.engfracmech.2022.108331. [Google Scholar] [CrossRef]
15. Liu X, Qu Z, Guo T, Sun Y, Wang Z, Bakhshi E. Numerical simulation of non-planar fracture propagation in multi-cluster fracturing with natural fractures based on Lattice methods. Eng Fract Mech. 2019;220(3):106625. doi:10.1016/j.engfracmech.2019.106625. [Google Scholar] [CrossRef]
16. Dezhi Q, Rabiei M, Rasouli V, Damjanac B. A lattice-based predictive model for interaction mode of hydraulic fracture with natural fractures. Rock Mech Rock Eng. 2023;56(1):463–85. doi:10.1007/s00603-022-02967-9. [Google Scholar] [CrossRef]
17. Chen B, Li S, Tang D. Numerical simulation study on hydraulic fracture propagation of multi-cluster fracturing of horizontal well in deep fractured coal seams. Eng Fract Mech. 2025;318:110983. doi:10.1016/j.engfracmech.2025.110983. [Google Scholar] [CrossRef]
18. Bakhshi E, Rasouli V, Ghorbani A, Fatehi Marji M, Damjanac B, Wan X. Lattice numerical simulations of lab-scale hydraulic fracture and natural interface interaction. Rock Mech Rock Eng. 2019;52(5):1315–37. doi:10.1007/s00603-018-1671-2. [Google Scholar] [CrossRef]
19. Wang D, Wang Z. 3D lattice Boltzmann method-discrete-element method with immersed moving boundary scheme numerical modeling of microparticles migration carried by a fluid in fracture. SPE J. 2022;27(5):2841–62. doi:10.2118/209822-pa. [Google Scholar] [CrossRef]
20. Savitski AA, Detournay E. Propagation of a penny-shaped fluid-driven fracture in an impermeable rock: asymptotic solutions. Int J Solids Struct. 2002;39(26):6311–37. doi:10.1016/S0020-7683(02)00492-4. [Google Scholar] [CrossRef]
21. Ren L, Su Y, Zhan S, Meng F. Progress of the research on productivity prediction methods for stimulated reservoir volume (SRV)-fractured horizontal wells in unconventional hydrocarbon reservoirs. Arab J Geosci. 2019;12(6):184. doi:10.1007/s12517-019-4376-2. [Google Scholar] [CrossRef]
22. Tang W, Zhou F, Sheng JJ, Wang X, Jiang T. Further investigation of CO2 energization fracturing in shale reservoir- from microscopic mechanism to field application. Fuel. 2025;385(1):134156. doi:10.1016/j.fuel.2024.134156. [Google Scholar] [CrossRef]
23. Jiang T, Shen Z, Wang L, Qi Z, Xiao B, Qin Q, et al. Optimization method of fracturing fluid volume intensity for SRV fracturing technique in shale oil reservoir based on forced imbibition: a case study of well X-1 in Biyang Sag of Nanxiang Basin. China Petrol Explor Dev. 2024;51(3):674–83. doi:10.1016/S1876-3804(24)60496-9. [Google Scholar] [CrossRef]
24. Luo X, Lu X, Koon GKW, Castro Neto AH, Özyilmaz B, Xiong Q, et al. Large frequency change with thickness in interlayer breathing mode—significant interlayer interactions in few layer black phosphorus. Nano Lett. 2015;15(6):3931–8. doi:10.1021/acs.nanolett.5b00775. [Google Scholar] [CrossRef]
25. Ogbezode JE, Ajide OO, Ofi O, Oluwole OO. Influence of reduction parameters on, weight loss, crack propagation, iron whisker growth, and morphological characteristics of directly reduced iron produced by non-contact direct reduction process. J Alloys Metall Syst. 2024;6(4):100071. doi:10.1016/j.jalmes.2024.100071. [Google Scholar] [CrossRef]
Cite This Article
 Copyright © 2025 The Author(s). Published by Tech Science Press.
This work is licensed under a Creative Commons Attribution 4.0 International License , which permits unrestricted use, distribution, and reproduction in any medium, provided the original work is properly cited.
 Downloads
 Citation Tools