
 Submit a Paper
 Propose a Special lssue
 Open Access
ARTICLE

Low-Carbon Game Synergistic Strategy for Multi-Park Hydrogen-Doped Integrated Energy System Accessing to Active Distribution Network Based on Dynamic Carbon Baseline Price
1 School of Automation and Electrical Engineering, Inner Mongolia University of Science and Technology, Baotou, 014010, China
2 State Grid Pingliang Electric Power Supply Company, Pingliang, 074000, China
* Corresponding Author: Xin Zhang. Email:
Energy Engineering 2025, 122(9), 3647-3679. https://doi.org/10.32604/ee.2025.067035
Received 23 April 2025; Accepted 27 June 2025; Issue published 26 August 2025
 View Full Text
 Download PDF
Abstract
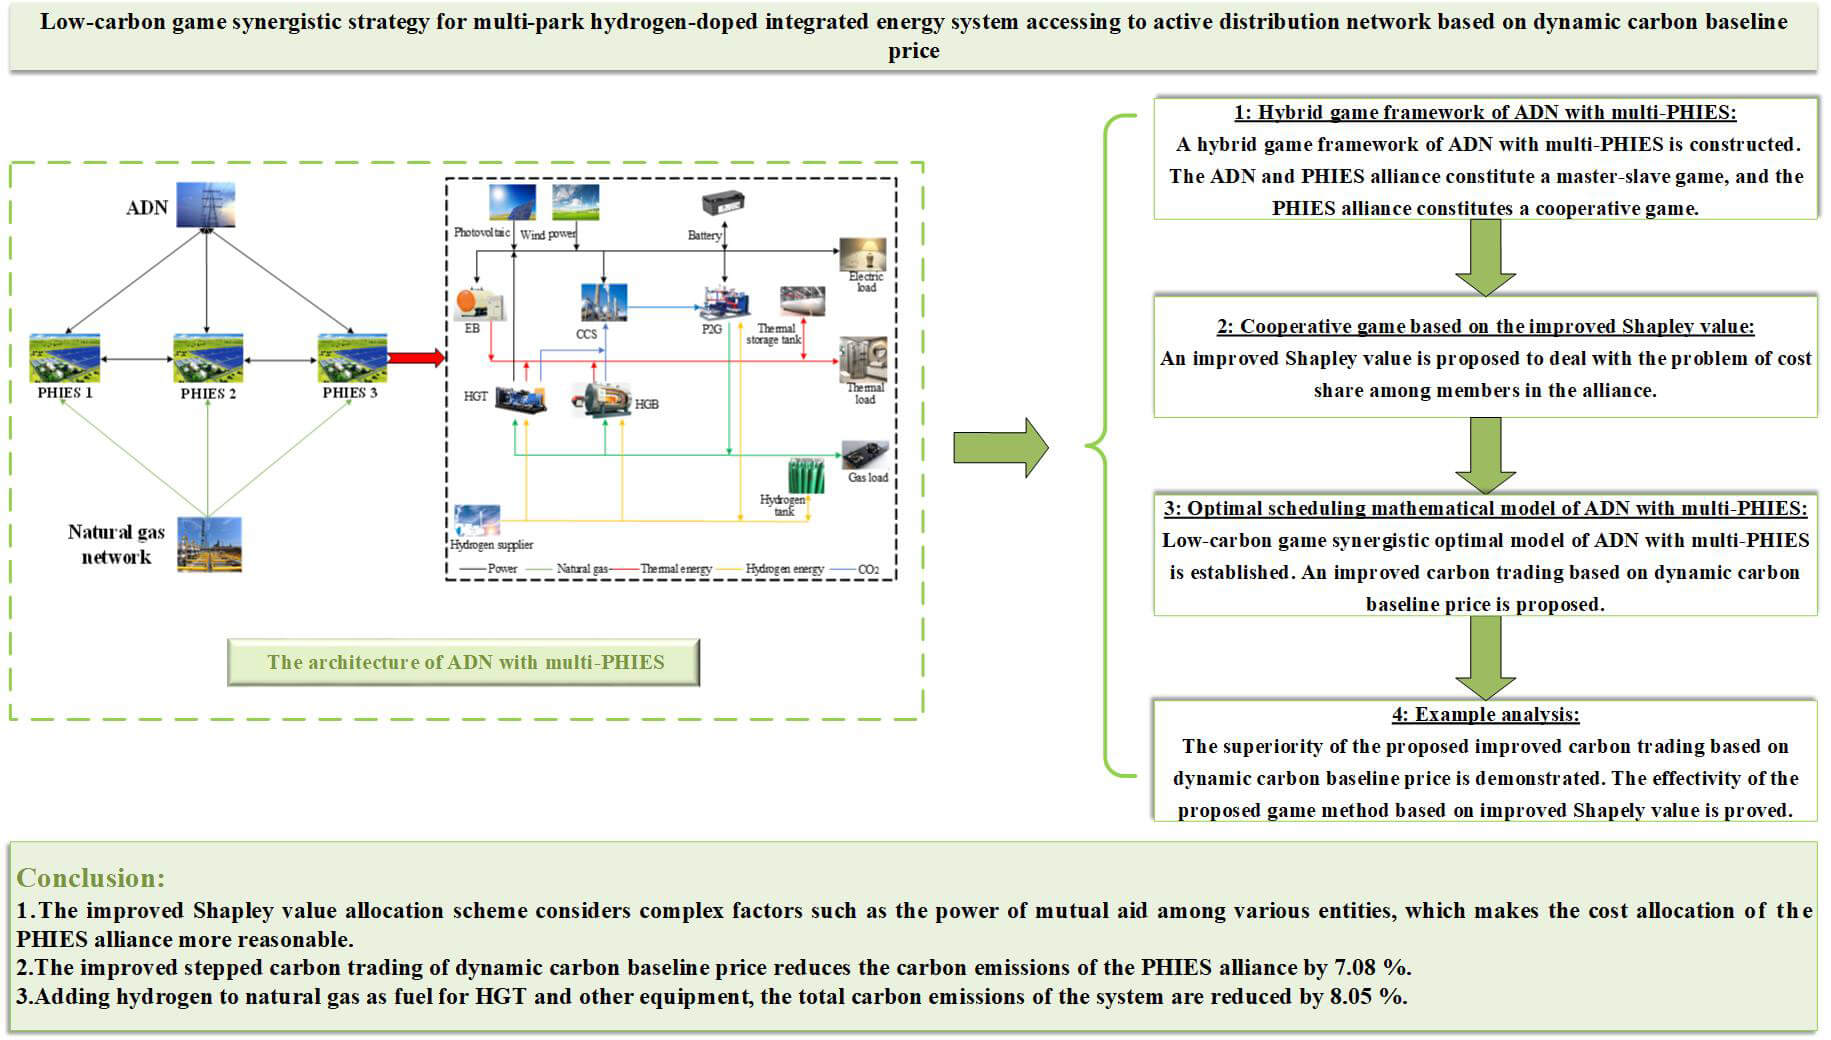
A park hydrogen-doped integrated energy system (PHIES) can maximize energy utilization as a system with multiple supplies. To realize win-win cooperation between the PHIES and active distribution network (ADN), the cooperative operation problem of multi-PHIES connected to the same ADN is studied. A low-carbon hybrid game coordination strategy for multi-PHIES accessing ADN based on dynamic carbon base price is proposed in the paper. Firstly, multi-PHIES are constructed to form a PHIES alliance, including a hydrogen-doped gas turbine (HGT), hydrogen-doped gas boiler (HGB), power to gas and carbon capture system (P2G-CCS), and other equipment. Secondly, a hybrid game system model of the ADN and PHIES alliance is constructed, in which the ADN and PHIES alliance constitute a master-slave game, and the members of the PHIES alliance constitute a cooperative game. An improved Shapley value is proposed to deal with the problem of cost share among members in the alliance. Thirdly, an improved stepped carbon trading based on dynamic carbon baseline price is proposed. The carbon emissions at each moment and the total carbon emissions in a cycle are set as the dynamic adjustment factors of the carbon baseline price. The pricing mechanism of carbon baseline price increases with carbon emissions is constructed so that carbon emissions decrease. Finally, the quadratic interpolation optimization (QIO) algorithm is combined with Gurobi to solve the model. The results of the example analysis show that the cost of ADN is reduced by 4.47%, the cost of PHIES 1 is reduced by 3.67%, the cost of PHIES 2 is reduced by 0.97%, and the cost of PHIES 3 is reduced by 4.91% respectively. The total carbon emissions of the PHIES alliance are reduced by 7.08%. The low-carbon and economical operation of the multi-PHIES accessing ADN is achieved.Graphic Abstract
Keywords
With the energy problem becoming more and more serious, it is essential to promote the construction of a clean and economical energy supply [1]. However, incorporating a large amount of renewable energy into the active distribution network (ADN) faces a series of challenges [2,3]. To cope with the challenges, an integrated energy system (IES) has emerged. As a technology that can promote collaborative work between multiple energy forms, IES can enhance the utilization rate of energy [4,5]. With the continuous development and wide application of IES, the interaction between IES and ADN has become an inevitable trend of industry development. Therefore, it is extremely important to study how to ensure the coordinated low-carbon operation between ADN and IES.
Hydrogen energy has a good prospect in the development of electric energy. In reference [6], a low-carbon optimization strategy for multi-energy coupled IES with hydrogen energy storage and two-stage P2G and combined heat and power (CHP) is proposed. In reference [7], an IES scheduling strategy considering multi-hydrogen supply and integrated demand response is proposed. The validity of the model is verified by an example. In reference [8], a low-carbon economic dispatch model of IES based on CCS-P2G-CHP is proposed. Hydrogen energy is better utilized by refining the traditional P2G technology. The above references mainly focus on the traditional method of using hydrogen, but the method has the disadvantages of high cost and difficult maintenance. In reference [9], the experiments show that mixing less than 20% hydrogen in natural gas can not only meet the safe and reliable energy supply of gas turbines but also reduce carbon emissions. In reference [10], the combustion characteristics of gas turbines with different hydrogen-doped ratios are analyzed by numerical simulation. The above references are aimed at the combustion characteristics of gas turbines and energy efficiency analysis. There is a lack of consideration from the perspective of multi-energy systems. In this paper, some hydrogen mixed with natural gas as fuel is supplied to gas turbines and other equipment, which can not only alleviate the shortcomings of high cost in the traditional way but also reduce carbon emissions.
In the alliance of multi-IES or microgrids, each member represents a different subject and needs to consider its own interests. At present, many scholars have adopted the method of game theory when dealing with the energy trading problem between multi-agents [11–13]. The commonly used game models are cooperative games and non-cooperative games. In reference [14], Aiming at the problem of power sharing and cooperation among multi-microgrids, a blockchain-based Stackelberg game theory is proposed. In reference [15], the Nash negotiation is proposed to analyze wind-solar-hydrogen multi-agent transactions, and the alternating direction multiplier method is adopted to deal with the power volume of business between the subjects. In reference [16], a hybrid game model including multi-microgrid and energy storage operators is constructed. A scheduling strategy that can achieve a win-win between the microgrid and the energy storage operators is formulated. In reference [17], the master-slave game is adopted to construct a game model including microgrid operators and load users, which realizes a win-win between microgrid operators and load users. In reference [18], the Stackelberg game is adopted to solve the conflicts of interest between different parks in participating in energy sharing. In reference [19], a cooperative game is used to establish a collaborative bargaining mechanism among parks. In reference [20], a two-stage model under the background of energy mutual aid is constructed, which provides a new idea for achieving low-carbon goals. The above references mainly focus on the independent optimization problem in microgrids or IES while ignoring the interaction and coordinated optimization of ADN and IES.
In the aspect of coordination between IES and ADN. In reference [21], a coordinated planning model for ADN and multi-IES is proposed, in which ADN operators are in a dominant position, and multi-IES operators are followers. In reference [22], a coordinated scheduling model of IES and ADN is constructed according to the power interaction of tie lines. The particle swarm optimization is adopted to compute the model. The above references ignore the characteristics of interconnection between members in the IES alliance and how to make the allocation more in line with the actual situation after the P2P cooperation mode within the alliance. In reference [23], the scheduling model of virtual power plant with regional IES is established. The cooperation strategy is used Shapley value method. In reference [24], a multi-subject cooperative game benefit distribution model was constructed based on the Shapley value method in the model of the distribution network with rural multi-microgrid. In reference [25], an energy management strategy for residential microgrid systems using Shapley value is proposed. The model predictive control and reinforcement learing are used to optimal problem of the system. In reference [26], based on the game theory, a coalition formation model of multi-microgrid is constructed. The cooperation game is used in the multi-microgrid. The optimal operation of the system is achieved. In the above references, the Shapley value is adopted to deal with the interests of multiple subjects. However, there are still some shortcomings in practical application because it does not fully take into account the specific impact of complex factors such as power mutual assistance between subjects on cost allocation, which leads to a slight lack of reflection of the actual situation. In the future, more in-depth analysis and research on such complex factors are needed to improve the consistency of distribution results with the actual situation.
In order to improve the utilization of clean energy and reduce the carbon emissions of the system. In reference [27], a multi-level game model of multiple virtual power plants with carbon trading is constructed. The rate of the new energy consumption is improved. The carbon emissions are reduced. In reference [28], the optimization model of the virtual power plant based on carbon trading and green certificate is proposed, which effectively reduces carbon emissions. In reference [29], considering the demand response of gas, hydrogen, heating, and power load and the step carbon trading model, an optimization model is constructed. The example analysis shows that the model can reduce costs, reduce carbon emissions, and achieve a win-win situation between the economy and the environment. In reference [30], a multi-stage planning method of park IES is focused. The low-carbon and economy-reliability of the system is achieved. In reference [31], an economical model of IES considering life cycle assessment and carbon capture is established. In reference [32], an optimal operation of park IES is proposed. A flexible response model is constructed based on stepped carbon trading. The carbon emissions factors is analyzed for the effect of the pricing mechanism model. The above references mainly focus on traditional carbon trading, which lacks real-time and dynamic responses to the actual carbon emissions of the enterprises.
The above research has made certain contributions to hydrogen energy utilization, inter-microgrid or inter-IES, IES, and ADN collaborative optimization, but there are still the following problems to be solved: (1) some references have adopted the traditional hydrogen energy utilization method, which has the disadvantages of high cost and difficult maintenance. (2) Some references mainly focus on the independent optimization problem between microgrid or IES alliance and do not consider the interaction and coordination optimization of ADN and IES. It is impossible to realize the economic operation of large-scale IES accessing ADN. (3) Although some references consider the synergy between ADN and IES, they ignore the characteristics of interconnection among members within the IES alliance and how to achieve reasonable benefit distribution after P2P cooperation within the alliance. (4) Some references consider the reasonable benefit distribution of IES and the coordinated operation of ADN and IES. The Shapley value is adopted to deal with the benefit problem of multi-IES. However, there are still some shortcomings in practical application because it does not fully take into account the specific impact of complex factors such as power mutual assistance between subjects on cost allocation, which leads to a slight lack of reflection of the actual situation. In the future, more in-depth analysis and research on such complex factors are needed to improve the consistency of distribution results with the true situation. (5) The above references have insufficient consideration of carbon emissions in the collaborative optimization of IES and ADN. The low-carbon operation of the system cannot be better realized.
In summary, a low-carbon game synergistic strategy for a multi-park hydrogen-doped integrated energy system (multi-PHIES) accessing ADN based on dynamic carbon baseline price is proposed, which provides a way to solve the cooperative operation of multi-PHIES accessing ADN. The contributions of this paper are as follows:
(1) The PHIES architecture is constructed, and P2G-CCS, hydrogen-doped gas turbine (HGT), hydrogen-doped gas boiler (HGB), and other equipment are added to the traditional IES to further make better use of energy and effectively decrease the carbon emissions. Meanwhile, the effects of different hydrogen-doped ratios on the carbon emissions and total cost of the system are studied, which provides guidance for the reasonable doped hydrogen of the system.
(2) A cooperative game method based on improved Shapely value is proposed, which realizes the reasonable allocation of the internal cost of the PHIES alliance and makes the allocation result more reasonable. The hybrid game mechanism between the ADN and PHIES alliance is designed. The PHIES alliance is a cooperative game mechanism. The ADN and PHIES alliance is a master-slave game mechanism. The upper ADN acts as a dominant player in the system and formulates the electricity price according to its own optimization goal. The lower PHIES alliance acts as a follower and adjusts the output of the internal units according to its own optimization goal and its internal energy characteristics.
(3) An improved carbon trading based on dynamic carbon baseline price is proposed. The carbon emissions in each period of the system operation and the total carbon emissions in a cycle are set as the dynamic adjustment factors of the carbon baseline price. The pricing mechanism of the carbon baseline price increasing with the carbon emissions is constructed to ensure the fairness and efficiency of the carbon market and reduce the carbon emissions.
(4) A solution method combining quadratic interpolation optimization (QIO) and Gurobi is designed to solve the low-carbon game synergistic operation model of ADN with multi-PHIES. The optimal solution is obtained quickly and reasonably to realize the economic and low-carbon operation of the system.
The workflow of the paper is shown in Fig. 1. The architecture of ADN with multi-PHIES is established in Section 1. In Section 2, the hybrid game framework of ADN with multi-PHIES is constructed, and a cooperative game method based on improved Shapely value is proposed. In Section 3, the optimal scheduling mathematical model of ADN with multi-PHIES is established, and an improved carbon trading based on dynamic carbon baseline price is proposed. Section 4 presents an example analysis. In Section 5, the conclusion is drawn, and future research is proposed.
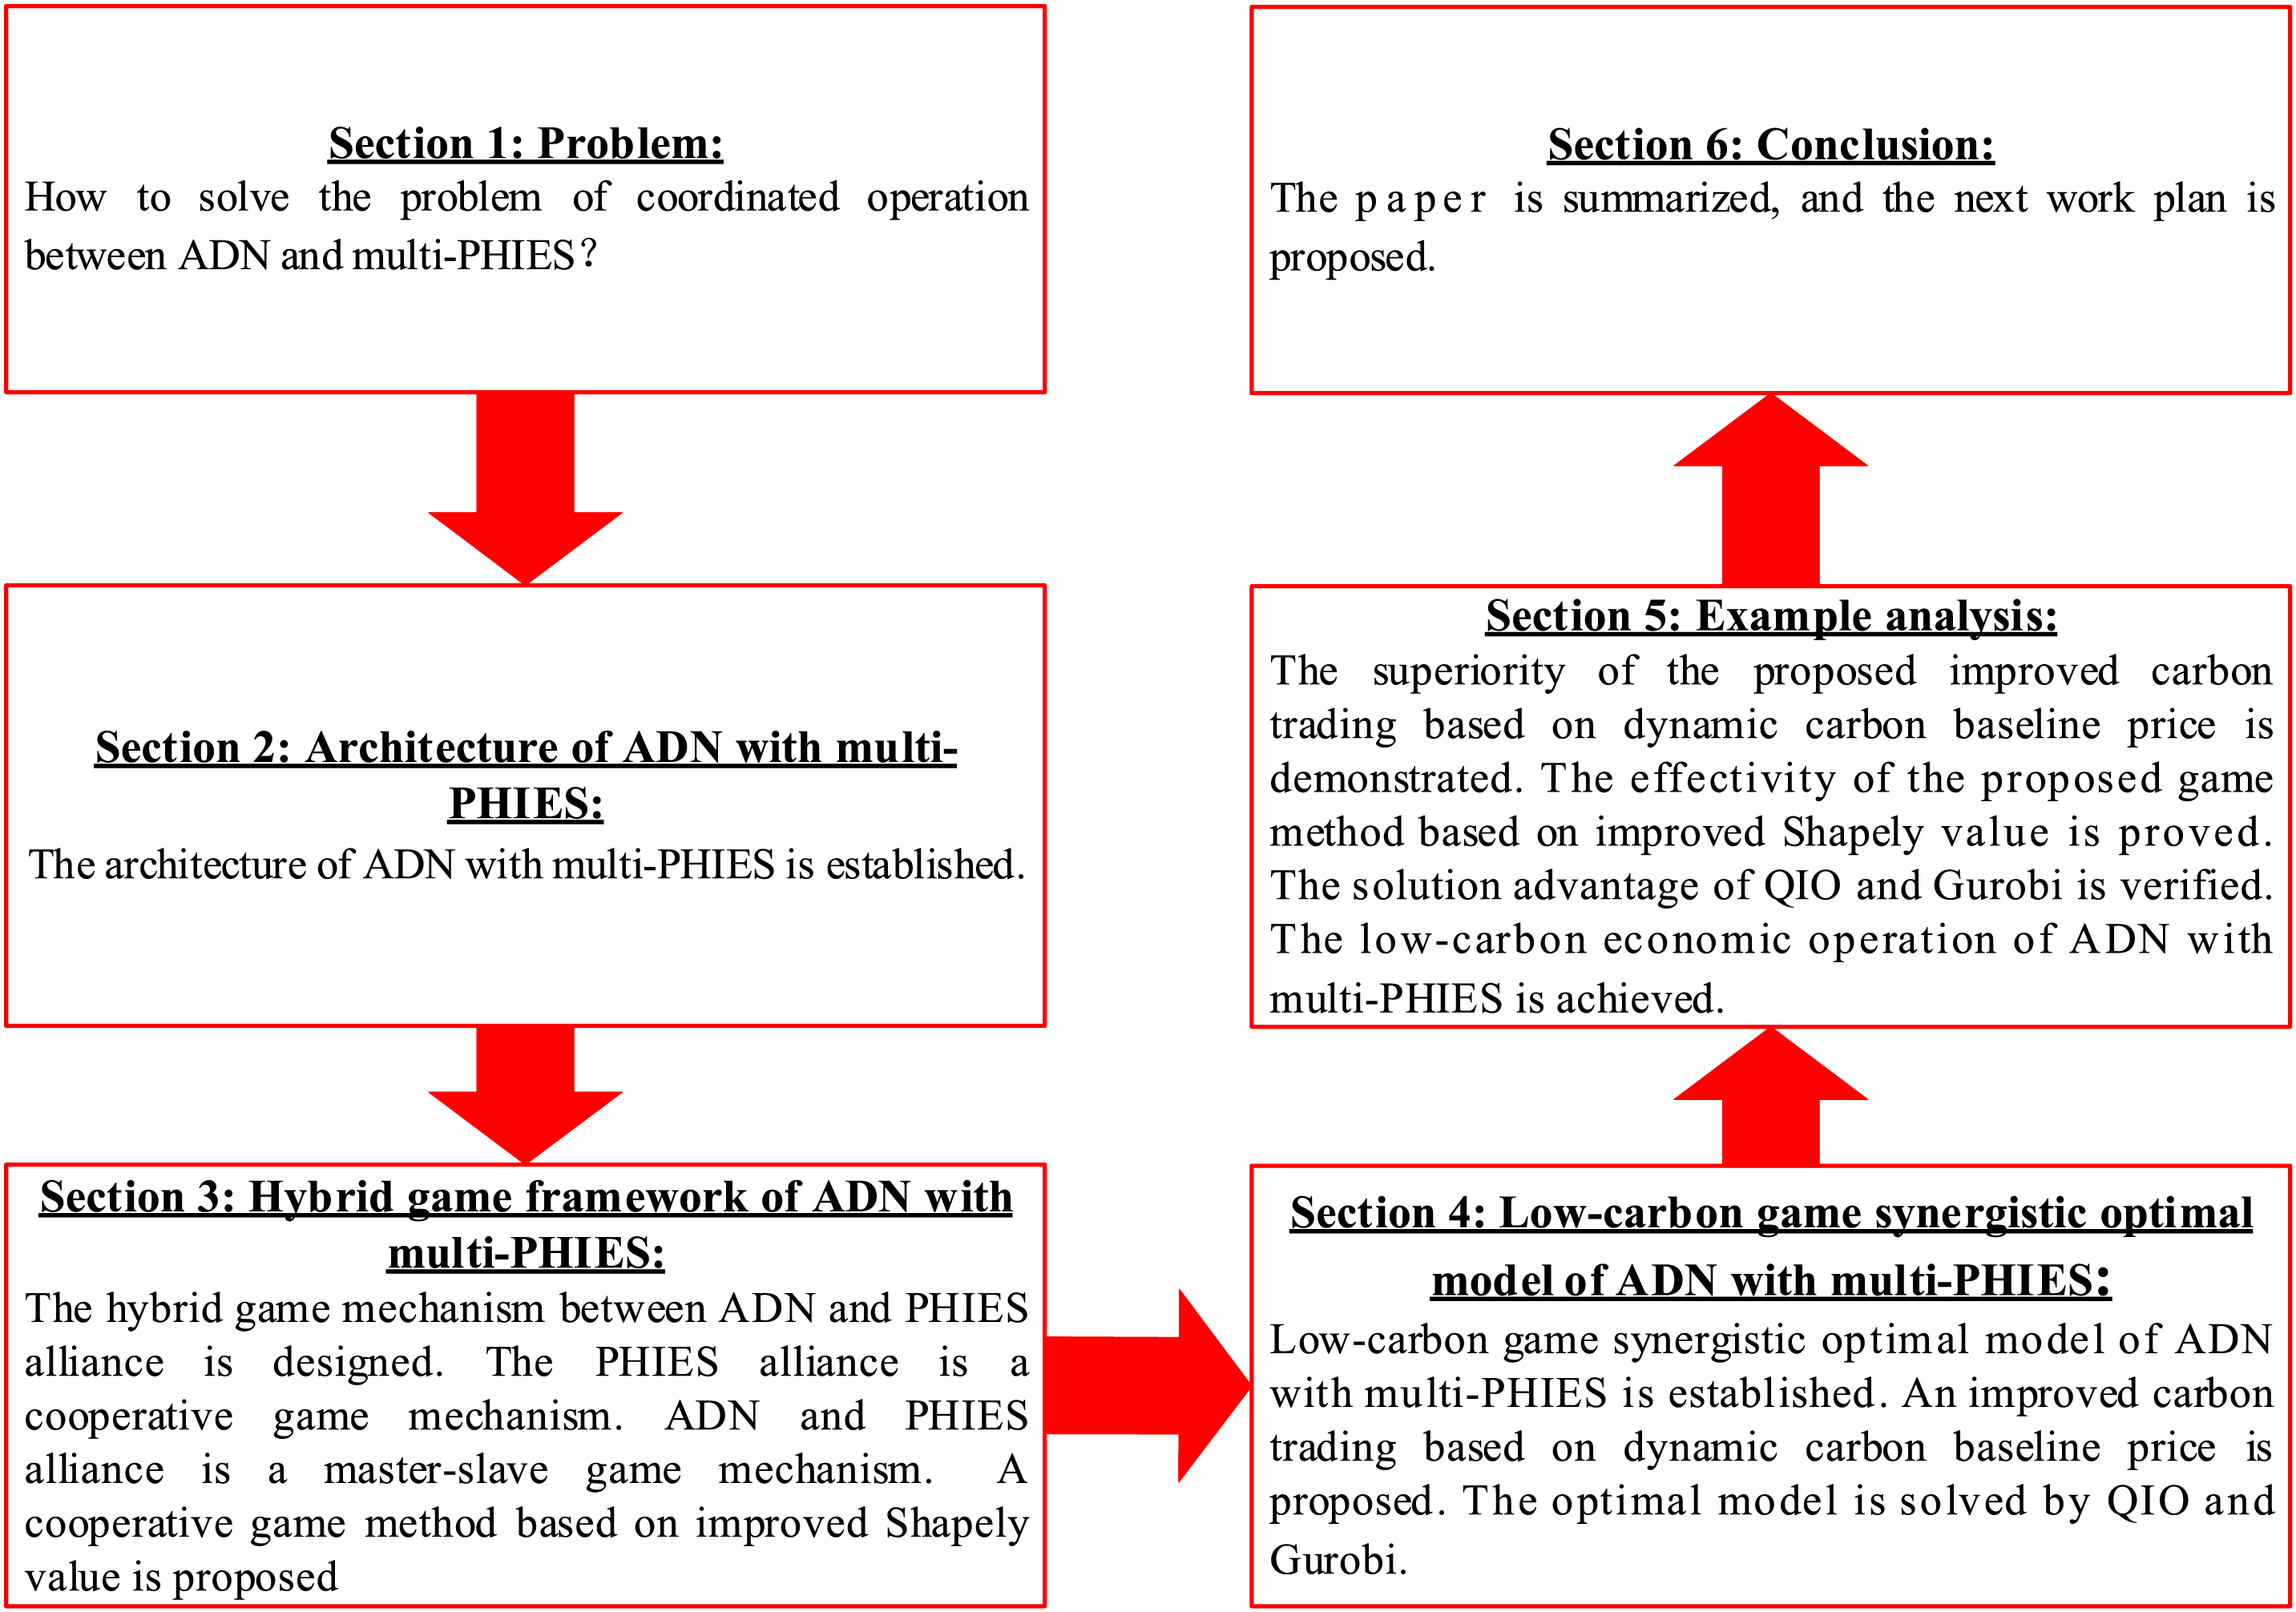
Figure 1: Workflow of the paper
2 The Architecture of ADN with Multi-PHIES
The architecture of ADN with multi-PHIES is constructed in Fig. 2. The above system contains ADN, natural gas network, multi-PHIES, etc. PHIES achieves efficient coordination of ADN and natural gas networks through a series of energy conversion equipment. Among them, HGT as the core equipment not only generates electric energy but also produces thermal energy synchronously, which effectively improves energy utilization efficiency. P2G-CCS technology is a bridge connecting electricity, natural gas, and carbon dioxide produced by HGT, which promotes flexible conversion and complementarity between multi-energy. In addition, PHIES also integrates equipment such as electric boiler (EB), HGB, etc., which can efficiently convert electric energy or natural gas energy into thermal energy to cope with fluctuations in thermal demand. The thermal energy supply is effectively supplemented. PHIES use various energy storage technologies are used in PHIES, including power storage and heat storage. When there is a surplus or shortage of energy, energy storage equipment can respond quickly; the excess energy is stored, or the energy is released when needed, which ensures the dynamic balance of the whole system’s energy. Finally, each PHIES can also perform electric energy interactions with other PHIES to meet the needs of daily operations.
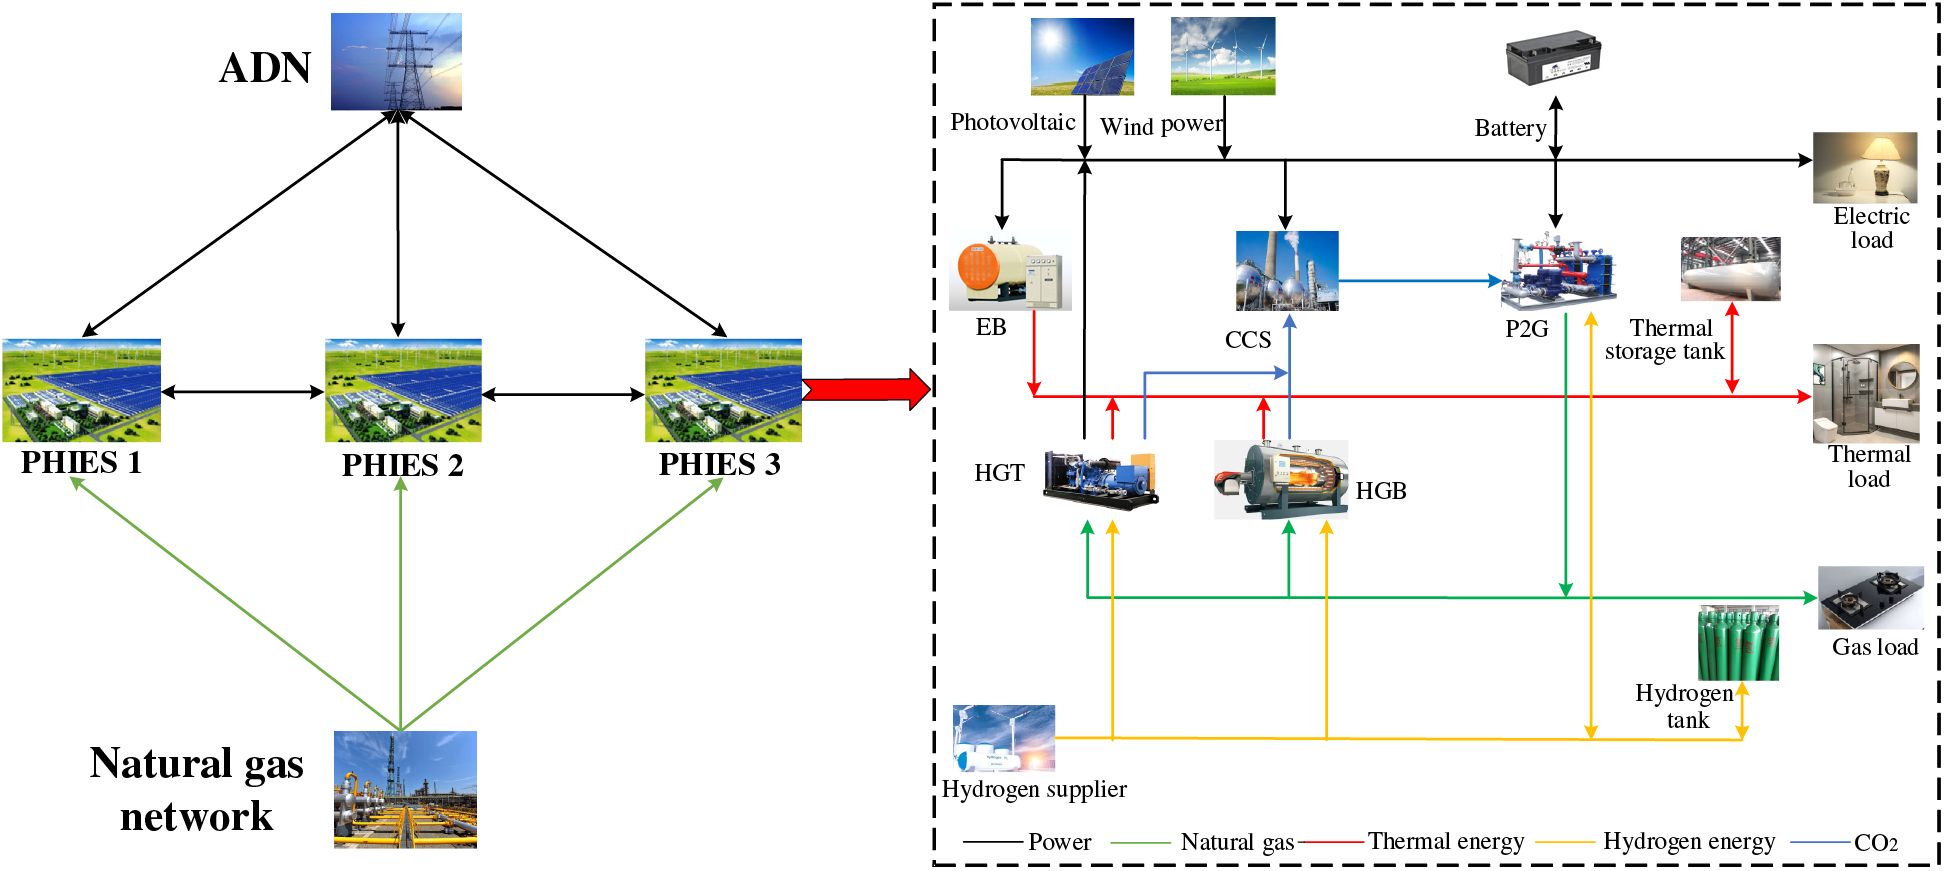
Figure 2: The architecture of ADN with multi-PHIES
3 Hybrid Game Framework of ADN with Multi-PHIES
ADN and PHIES alliance represent different interest subjects respectively, both possessing the characteristics of pursuing their own maximum interests. Using game theory, a hybrid game framework of AND with multi-PHIES is constructed, as shown in Fig. 3. Because ADN has the pricing right in the system, the PHIES alliance adjusts the internal unit output through the electricity price set by ADN. Thus, the ADN and PHIES alliance constitute a master-slave game. Because each member of the PHIES alliance aims to minimize the system operation cost, the PHIES alliance constitutes a cooperative game. ADN continuously optimizes the price of electricity through the power purchase and sale information transmitted by the PHIES alliance and its own optimization goal.
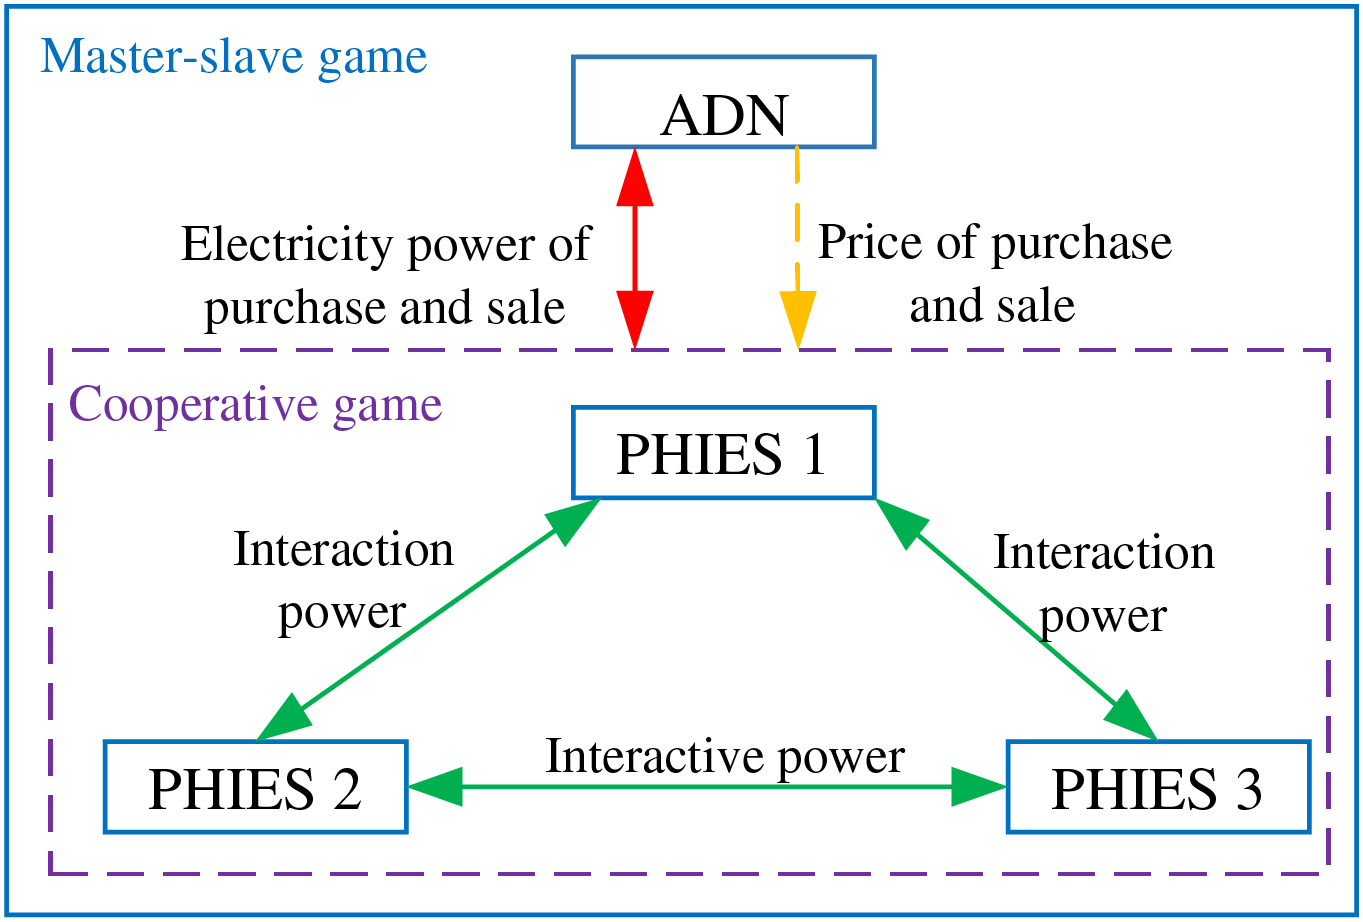
Figure 3: The framework diagram of the hybrid game
The master-slave game is composed of the ADN and PHIES alliance. The connection between the two is that ADN releases the electricity prices to the PHIES alliance, and the PHIES alliance transmits the electricity information of the purchase and sale to ADN. The model is as follows:
where M represents the set of participants in the game composed of ADN and PHIES alliance;
In order to achieve equilibrium in the master-slave game, the Formula (2) must be satisfied, so it is considered to be an equilibrium solution.
3.2 Cooperative Game Based on the Improved Shapley Value
When some members of the PHIES alliance have an electric energy surplus, the electric energy exceeding the demand can be given to other members of the current power shortage through the contact line within the alliance. On the contrary, if a member of the alliance has an insufficient power supply, it can obtain power from other members with surplus power. If the demand of the member is still unable to be met, it is obtained from the ADN according to the purchase price.
In the cooperative game model, the Shapley value is a widely used cost allocation method. The traditional Shapley value allocation method only controls the participants on the macro level but ignores the specific contribution degree made by each member within the alliance. Thus, it cannot reflect the actual situation of cost allocation well. Based on the above reasons, the traditional Shapley value is improved from the following three aspects in the paper.
(1) The waveform similarity between the new energy output curve and the PHIES alliance load curve
In a single PHIES, when the load demand curve is similar to the new energy curve, the new energy output can better meet electric demand. Thus, the electric demand for external transactions will be small, which is more beneficial to reducing the operating cost of the PHIES alliance.
Firstly, the equivalent output of new energy in each PHIES is calculated by the method of equal power-following load [33,34]. The formulas are as follows:
where
Then, the cosine similarity algorithm is adopted to measure the similarity between the equivalent output curve of the new energy of each PHIES and the total load curve of the alliance. If the waveform similarity between the two is higher, the contribution of the PHIES to reducing the total cost of the alliance is greater, and the corresponding allocation coefficient is smaller.
where
(2) The power of mutual aid between each PHIES
The surplus and deficit power of each PHIES in the alliance at each period also affects the operating cost of the alliance. When the surplus power of a PHIES is used to replenish other members of the alliance who are short of electricity, the more surplus power of this PHIES is beneficial to decrease the cost of the alliance. By calculating the proportion of mutual power of each PHIES, the alliance cost is reallocated. The more power is given to other PHIES, the smaller the reallocated cost is. The allocation coefficient is as follows:
where
(3) Volatility of the new energy output
The volatility of new energy output in each PHIES also affects the operating cost of the entire alliance. As a whole multi-energy coordinated operation, PHIES needs to balance the supply-demand relationship of multi-energy to ensure the system’s stable operation. When the output curve of the new energy fluctuates greatly, the alliance needs to adjust the output of other equipment more frequently to make up for the lack of power, which will increase the complexity and cost of the scheduling operation of the system.
where
Then, the traditional Shapley value allocation strategy is improved by the following formula:
where M represents the quantity of PHIES, which is 3;
4 Optimal Scheduling Mathematical Model of ADN with Multi-PHIES
ADN is in a dominant position. The purchasing and selling of the electricity price is set for each period for PHIES. The objective function is the minimum operating cost of the ADN. The objective function is as follows:
where
(1) Power balance constraint
where
(2) Power flow constraint
where
(3) Node voltage constraint
where
(4) Electricity price and interaction power constraint
where
Because ADN has a dominant position in the game, it has independent pricing power. To avoid promoting its own interests, it always sets the selling electricity price as the highest. Adding the average value constraint of its selling electricity price is essential.
where
4.2 Slave PHIES Alliance Model
4.2.1 Mathematical Models of Equipment in the PHIES
(1) HGT
By consulting the relevant reference [9], when natural gas is mixed with a certain proportion (10%~20%) of hydrogen, the stable combustion of gas turbine burners is ensured, and the carbon emissions are decreased. The model [36] is as follows:
where
(2) HGB
The model [36] is shown as follows:
where
(3) EB
The model [37] is shown as follows:
where
(4) P2G-CCS
In the paper, the main equipment in the P2G process includes the electrolytic cell (EL) and the methane reactor (MR). The electricity is converted to hydrogen through water electrolysis in the EL equipment [38]. A part of the hydrogen is directly sent to the HGT. A part of the hydrogen is converted to natural gas by MR equipment. The remaining part is input into the hydrogen storage device to be saved. CCS can reduce carbon emissions by converting CO2 generated by the operation of HGT and HGB into natural gas.
The electricity is converted to hydrogen by EL equipment, and the model is as follows:
where
The gas power converted by MR is shown as follows:
where
The power consumption of the operation of the CCS is positively correlated with the quality of CO2 treated by CCS, as follows:
where
(5) Energy storage system
The electricity-thermal energy storage equipment are contained in each PHIES. The thermal energy storage equipment model is the same as that of the battery [38]. Thus, only the model of the battery is described, as follows:
where
4.2.2 Objective Function of Slave PHIES Alliance
Taking the minimum operating cost of the PHIES alliance as the object, the objective function of the PHIES alliance is constructed. The operating cost of the system includes power purchasing cost, gas purchasing cost, carbon trading cost, and carbon sequestration cost, as follows:
where
4.2.3 Slave PHIES Alliance Constraints
(1) Power balance constraint
Each PHIES is coupled with electricity-thermal-gas-hydrogen. In order to assure the stable operation of the system, it is necessary to ensure the supply-demand balance of the energy. The power balance constraints are as follows:
where
(2) Output and climbing constraints of the HGT
where
(3) Output and climbing constraints of the HGB
where
(4) Output and climbing constraint of the EB
where
(5) Output and climbing constraint of the EL
where
(6) Output and climbing constraint of the MR
where
(7) Output constraint of the CCS
where
(8) Energy storage constraints
The constraints of the energy storage equipment are the same as those of the battery. Thus, only the constraints of batteries are described as follows:
where
4.3 Improved Carbon Trading Model with a Dynamic Carbon Baseline Price
4.3.1 Model of the Carbon Emission Quotas
For the initial quota of each PHIES carbon emission, the free allocation commonly used in the existing reference is adopted. The objects with carbon emission rights include HGT, HGB, and electricity purchasing power from ADN.
where
4.3.2 Real Carbon Emission Model
The model of PHIES is shown below:
where
The traditional carbon baseline price is set based on fixed standards or formulas, which lacks real-time and dynamic response to the actual carbon emissions of the enterprises. The traditional carbon baseline price cannot accurately reflect the actual situation of the system emission reduction. The role of carbon baseline price in promoting system emission reduction is weakened. In the paper, the carbon emissions in each period and the overall carbon emissions in a cycle are taken as the dynamic factors of the carbon baseline price so as to ensure that the system should consider both the short-term carbon emission income and the long-term carbon emission income.
The calculation model of the stepped carbon trading cost with dynamic carbon baseline price is as follows:
where
In the paper, QIO [40] nested Gurobi solver is adopted to deal with the hybrid game model. The ADN at the upper level is solved by QIO, and the PHIES alliance at the lower level is solved by Gurobi. The flow chart is shown in Fig. 4.
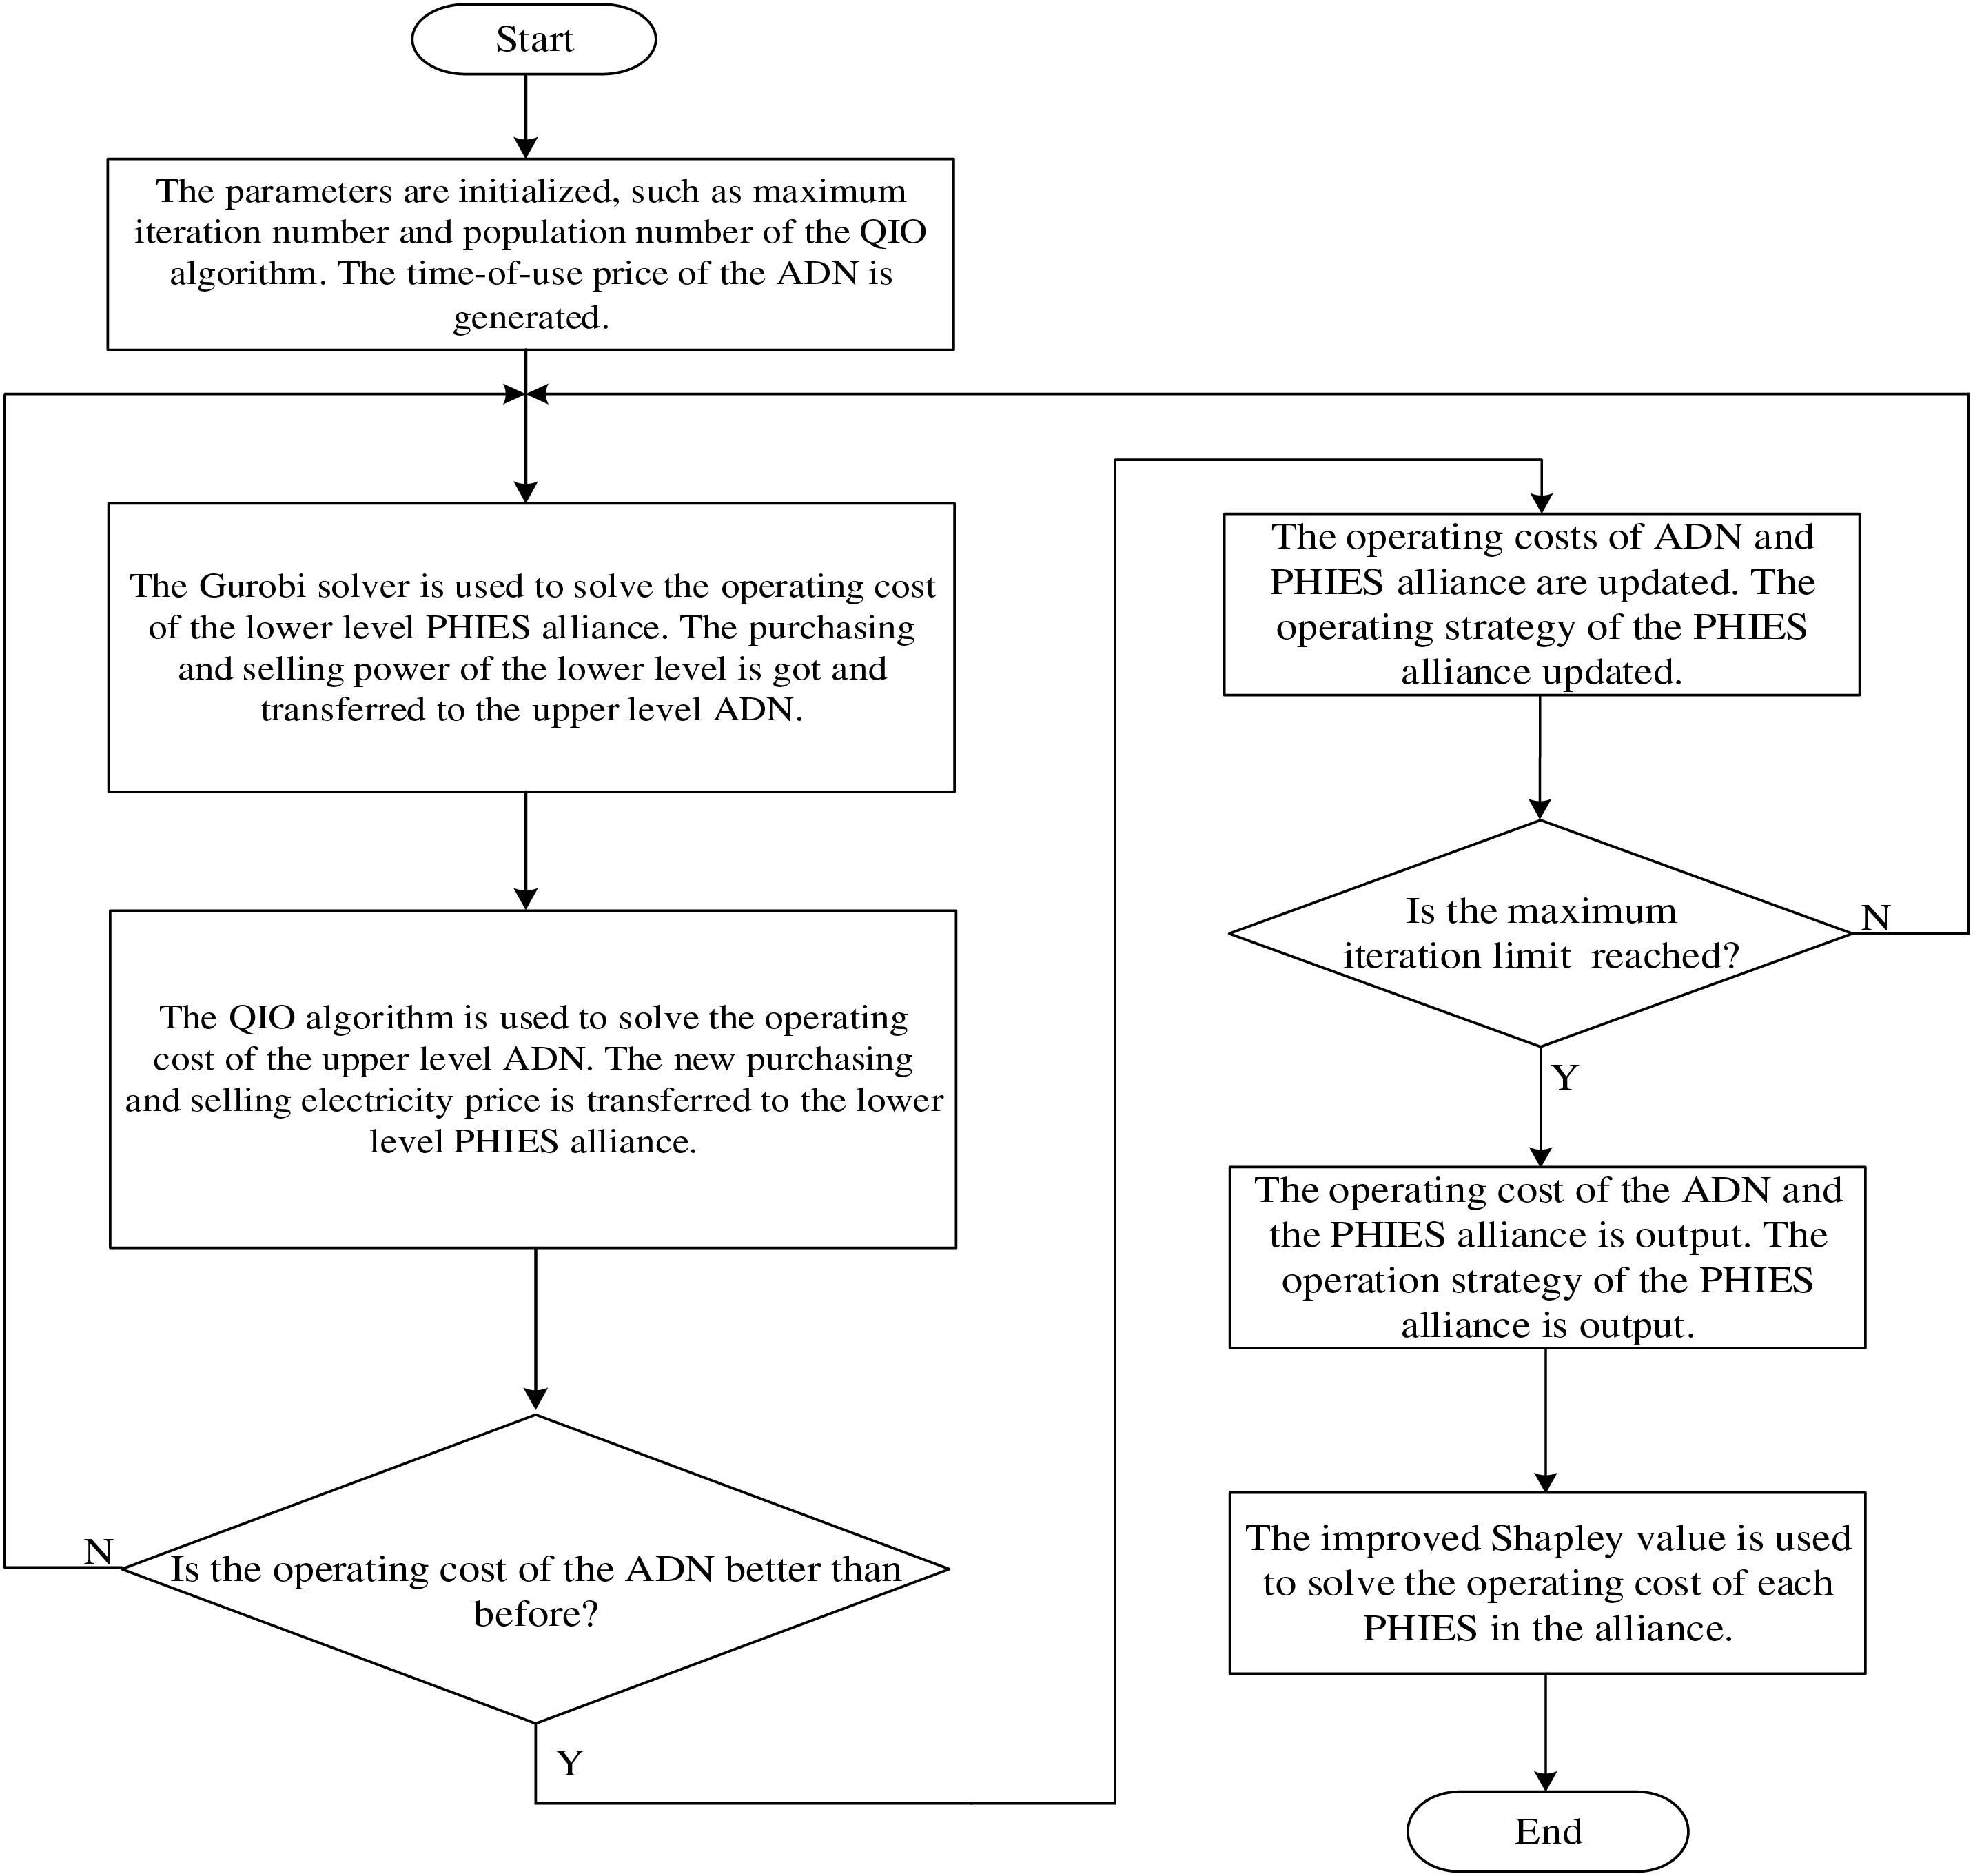
Figure 4: The solution flow chart of the hybrid game model
The specific solution process is shown below:
Step 1: The parameters are initialized, such as the maximum iteration number and population number of the QIO algorithm. The time-of-use price of the ADN is generated.
Step 2: The Gurobi solver is used to solve the operating cost of the lower level PHIES alliance. The purchasing and selling power of the lower level is got and transferred to the upper level ADN.
Step 3: The QIO algorithm is used to solve the operating cost of the upper level ADN. The new purchasing and selling electricity price is transferred to the lower level PHIES alliance.
Step 4: The operating cost of ADN is judged. If it is better than the previous operating cost, the operating cost of ADN and PHIES alliance are updated. The operating strategy of the PHIES alliance are updated. Otherwise, it returns to step 2.
Step 5: Determining whether the maximum iteration upper limit is reached. If the maximum iteration upper limit is reached, the operating cost of the ADN and PHIES alliance is output, and the operating strategy of the PHIES alliance is output. Otherwise, it returns to step 2.
Step 6: The improved Shapley value is used to solve the operating cost of each PHIES in the alliance.
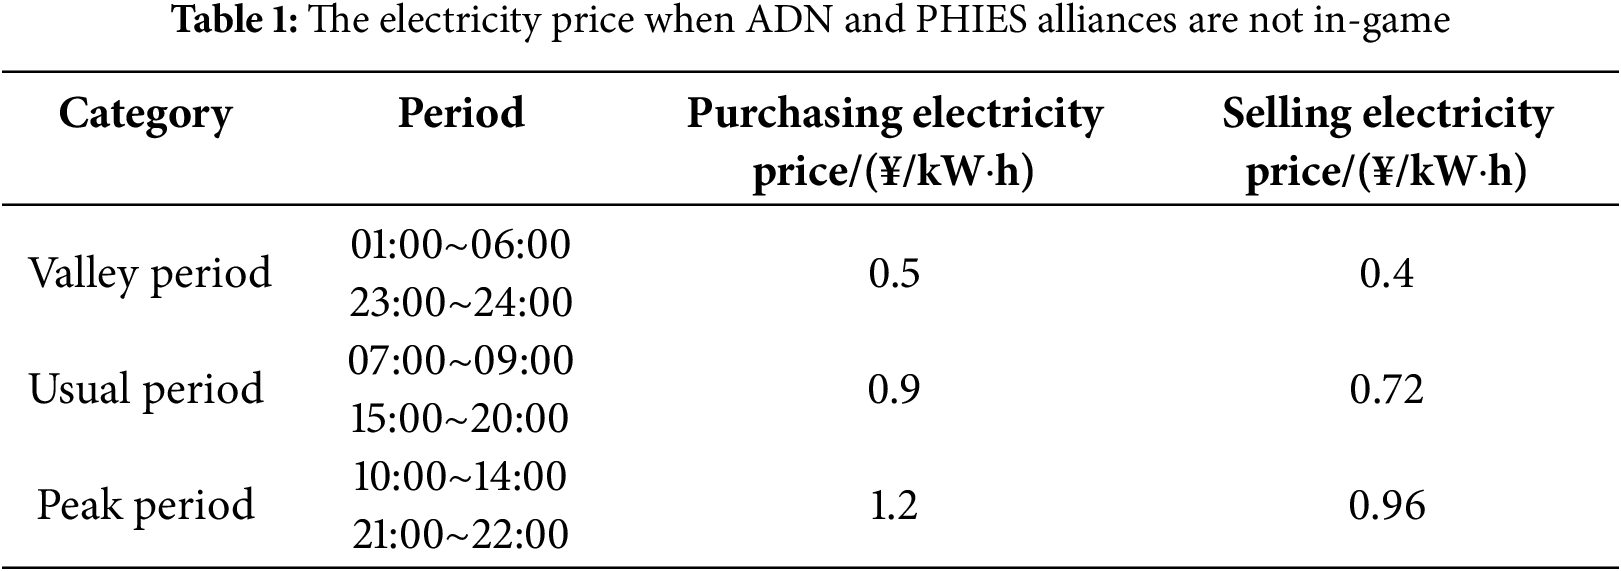
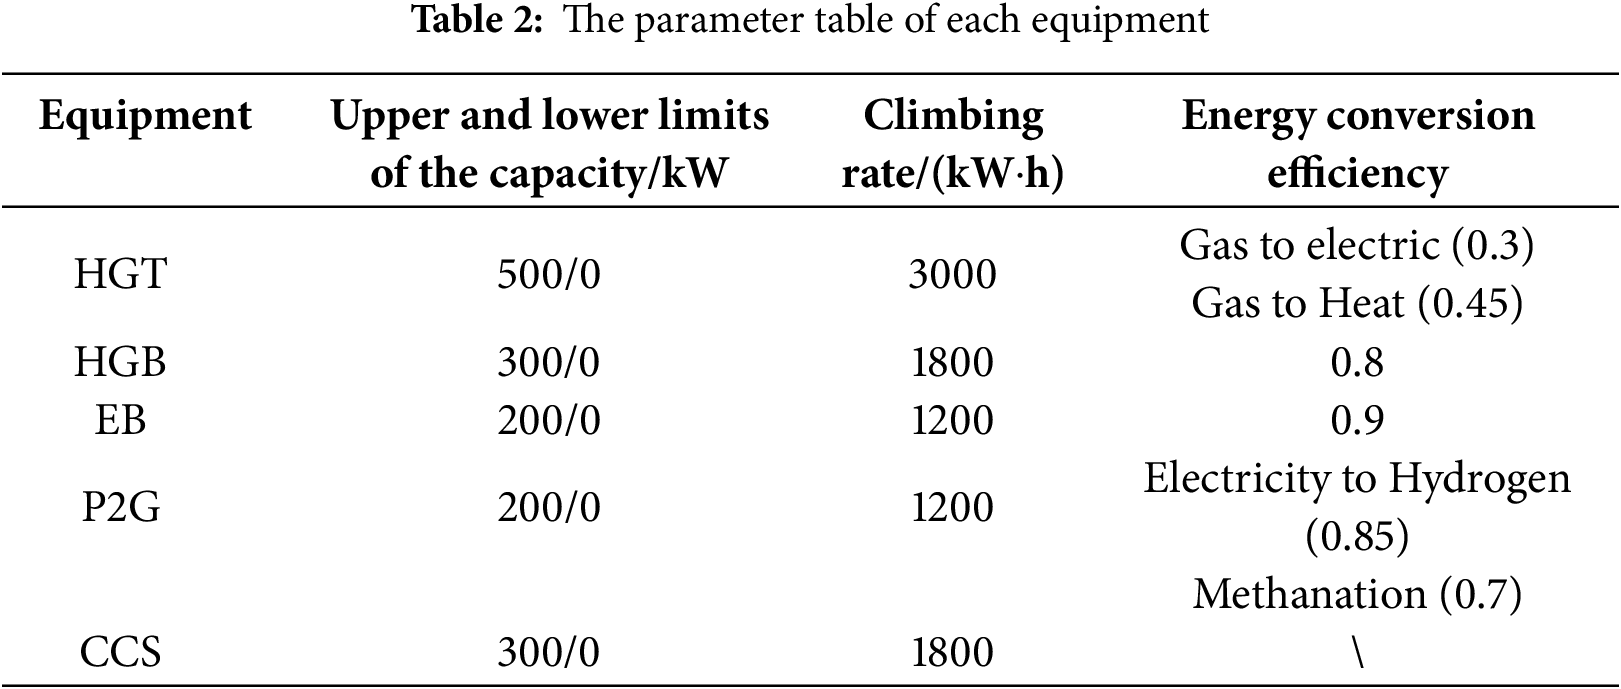
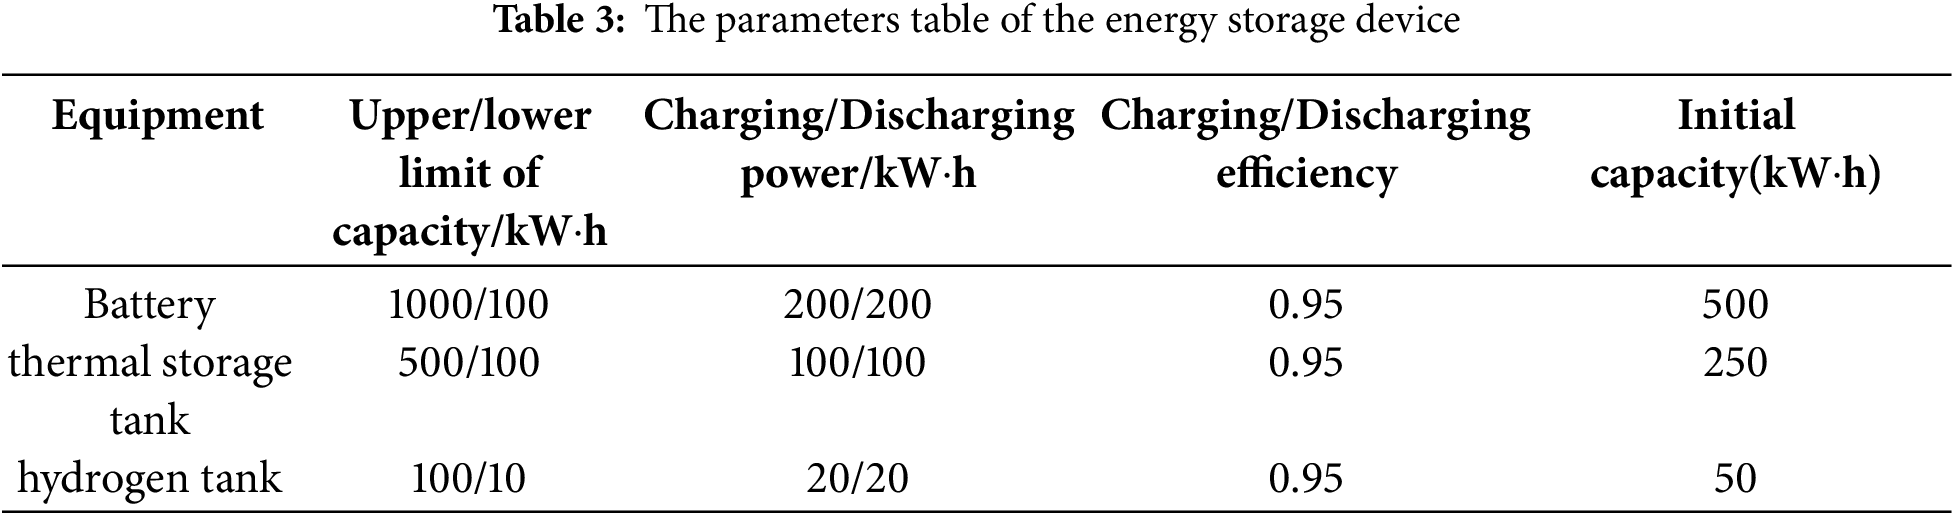
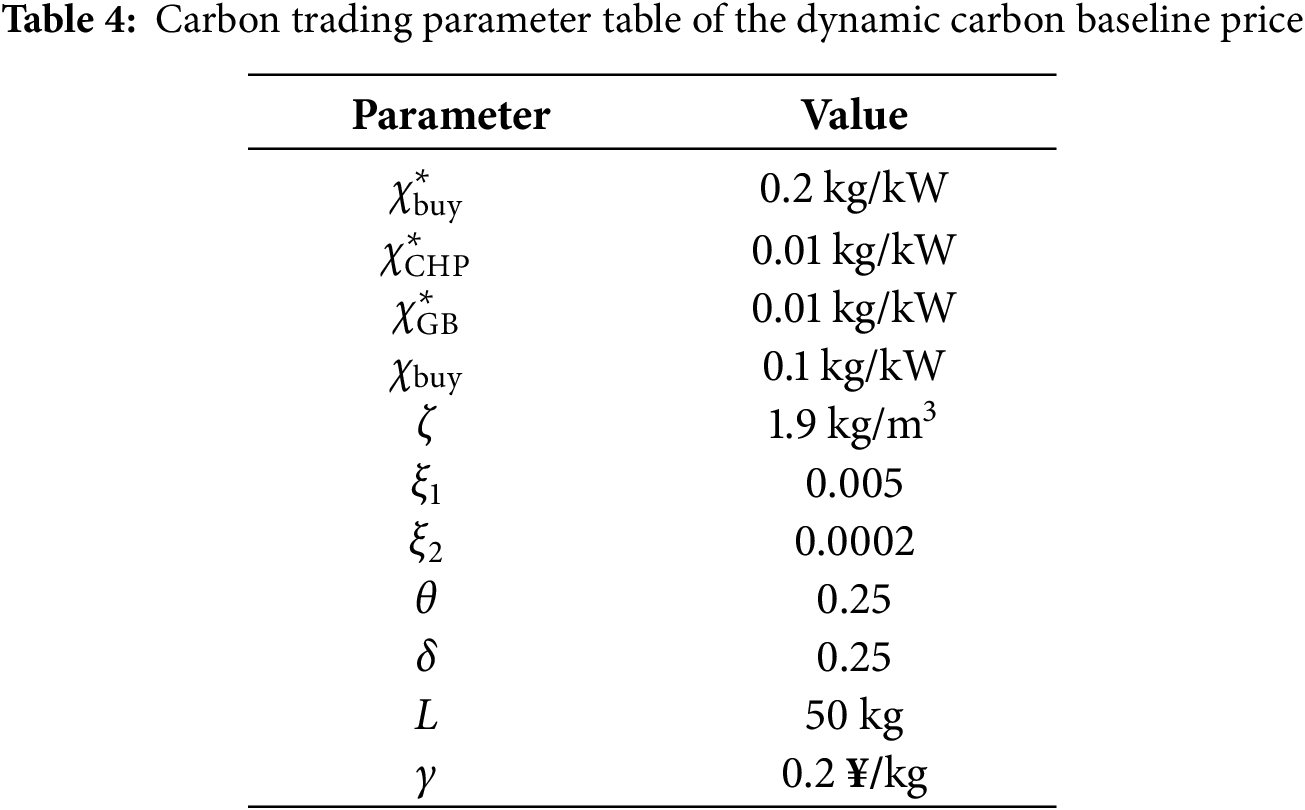
The example is designed on the basis of the IEEE33 node, as shown in Fig. 5. Firstly, the power flow of the IEEE33 node is calculated by using MATLAB software. The line network losses between nodes 2 and 3, 3 and 4, and 6 and 7 are large. The voltage drops of nodes 16, 17, 18, 32 and 33 is larger. In this paper, Nodes 3, 16, 32 are selected to access three PHIES, and CCS-P2G devices are considered in all three PHIES. The node 1 is the common connection point between ADN and the upper power grid. Nodes 4 and 17 are connected to photovoltaic and wind turbines, respectively. The wind power, photovoltaic, and load curves for the ADN are demonstrated in Fig. 6. When ADN does not play a game with PHIES, the electricity price [38,41] is demonstrated in Table 1. The parameters of the conversion device [36,37] are demonstrated in Table 2. The parameters of the energy storage device [42,43] are demonstrated in Table 3. The carbon trading parameters based on the dynamic carbon baseline price [36] are demonstrated in Table 4.
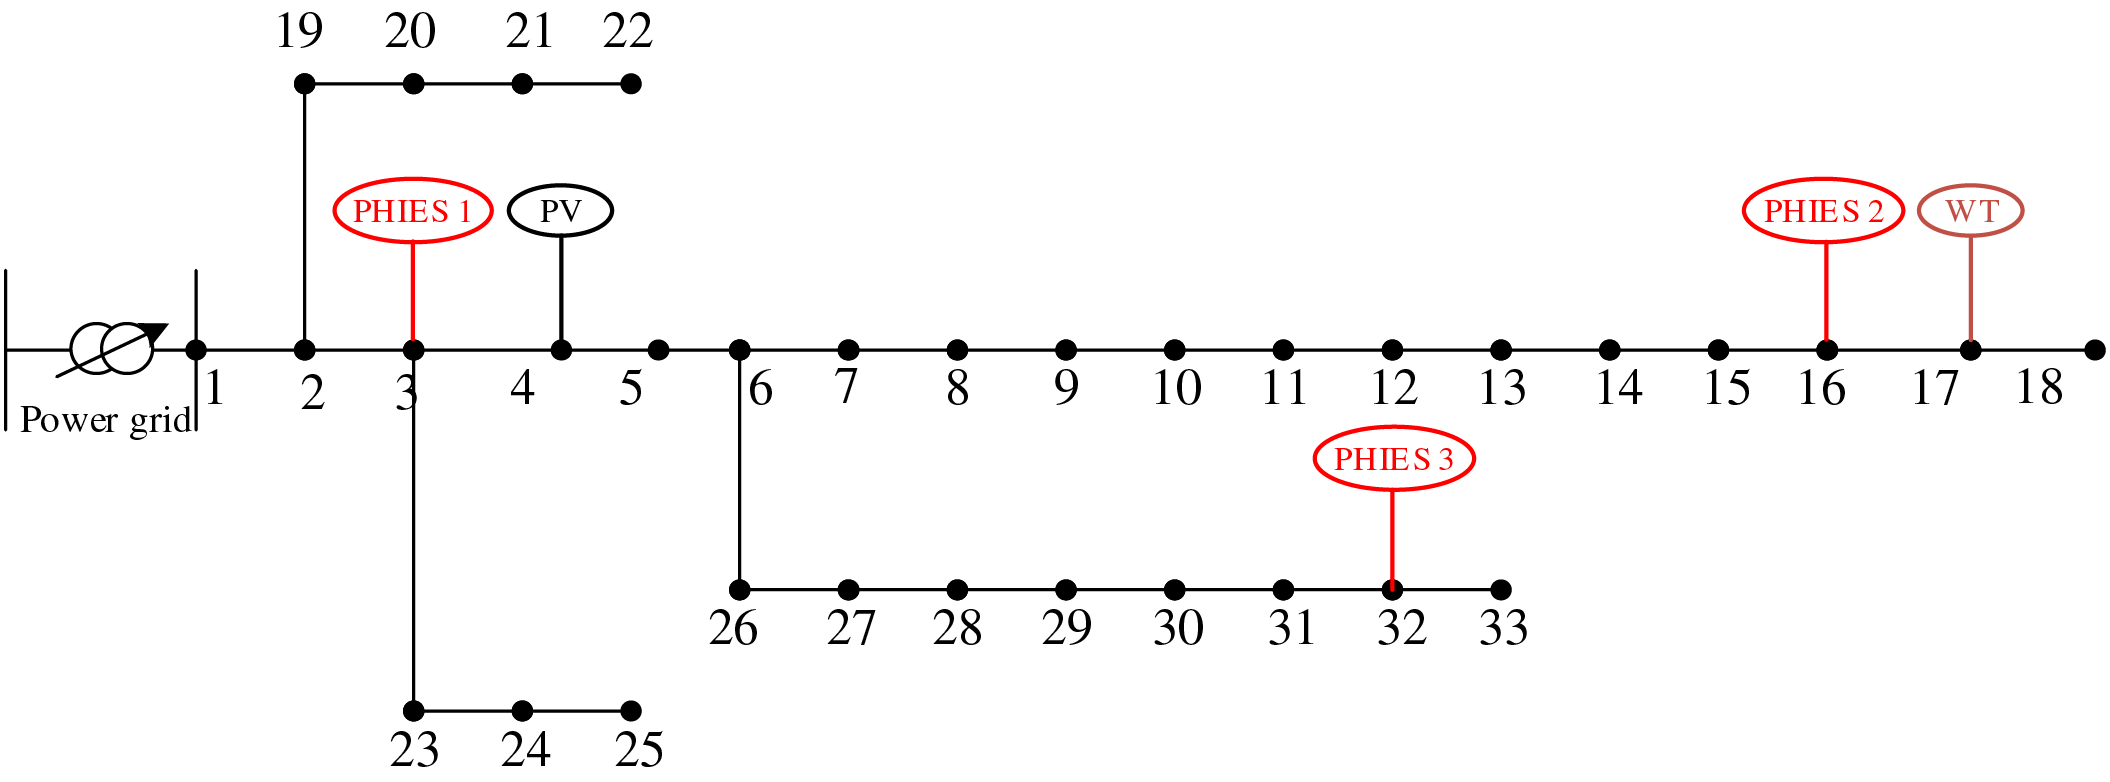
Figure 5: The network architecture diagram of the ADN
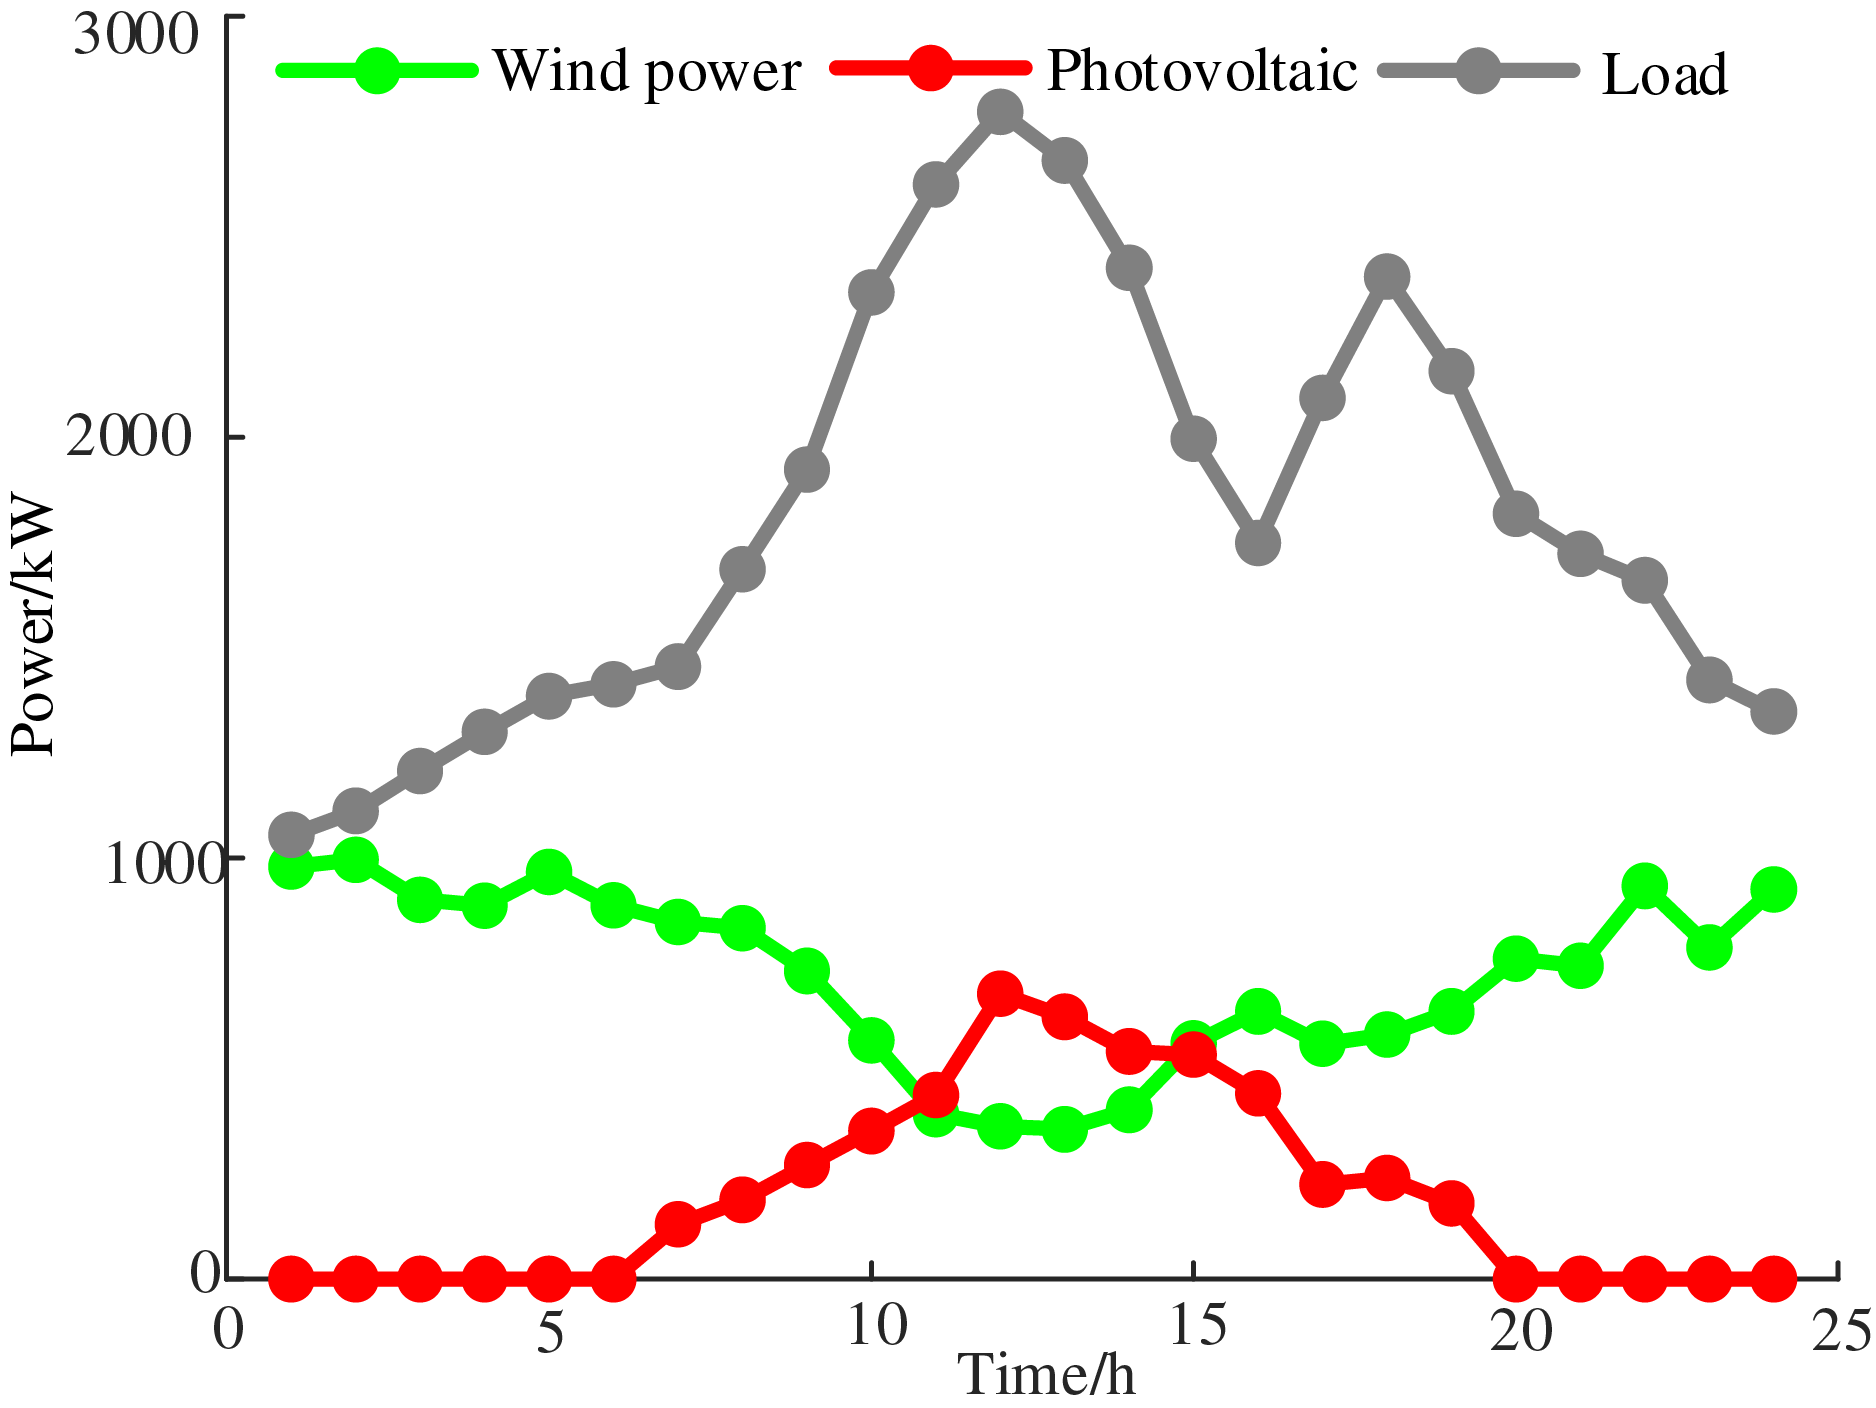
Figure 6: New energy output and load curves of the ADN
5.2 Effect Analysis of the Different Hydrogen-Doped Ratios for the Operation of the System
In order to understand the effect of different hydrogen-doped ratios on the results of the system operation, a single PHIES is taken as an example in the paper. The analysis results of different hydrogen-doped for HGT and HGB are shown in Figs. 7 and 8. From Fig. 7, in the case of the fixed hydrogen-doped ratio of HGB, the total cost of the system decreases as the hydrogen-doped ratio of the HGT increases. As the hydrogen-doped ratio of HGB and HGT increases, the total cost of the system is gradually decreasing. When the hydrogen-doped ratio of the HGT is 20%, and the hydrogen-doped ratio of the HGB is 18%, the total system cost reaches the lowest value of 1.2241 × 10⁴¥. From Fig. 8, in the case of the fixed hydrogen-doped ratio of the HGB, the carbon emissions decrease with the increase of the hydrogen-doped ratio of HGT. As the hydrogen-doped ratio of HGB and HGT increases, the system’s carbon emission gradually decreases. When the hydrogen-doped ratio of the HGT is 20%, and the hydrogen-doped ratio of the HGB is 18%, the carbon emissions reach the lowest value, which is 933.98 kg. As can be seen from Figs. 7 and 8, the total cost of the system and carbon emissions are decreasing as the hydrogen-doped ratios of HGT and HGB increases. Different hydrogen-doped ratios affect the system’s carbon emissions and total cost in varying degrees. Meanwhile, according to reference [9], when natural gas is mixed with a certaion proportion (10%–20%) of hydrogen, the stable combustion of gas turbine burners is ensured, and the carbon emissions are decreased. Thus, the hydrogen doping ratio of 20% for HGT and 18% for HGB are used in the subsequent simulation analysis.
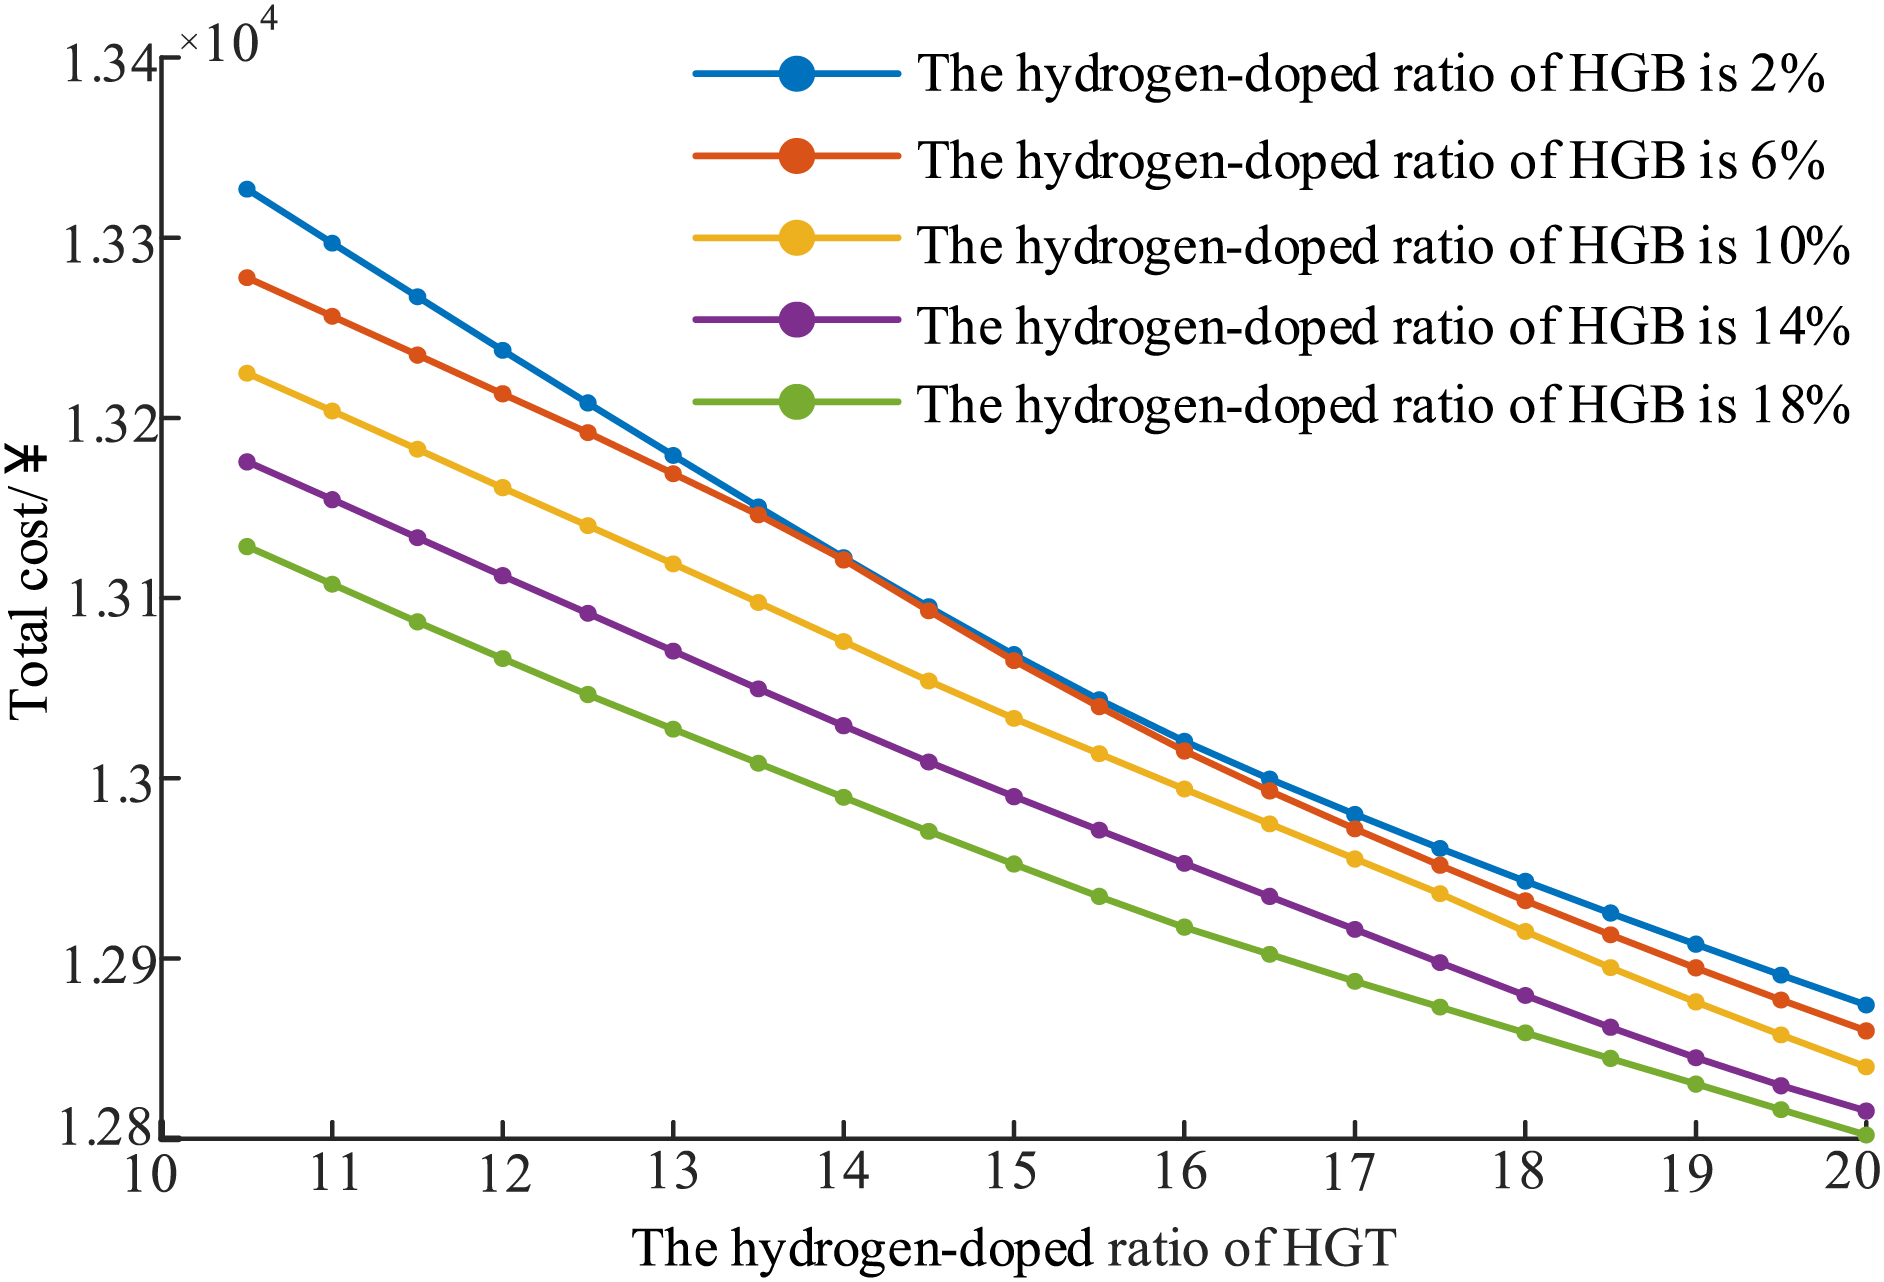
Figure 7: Total cost under different hydrogen-doped ratio
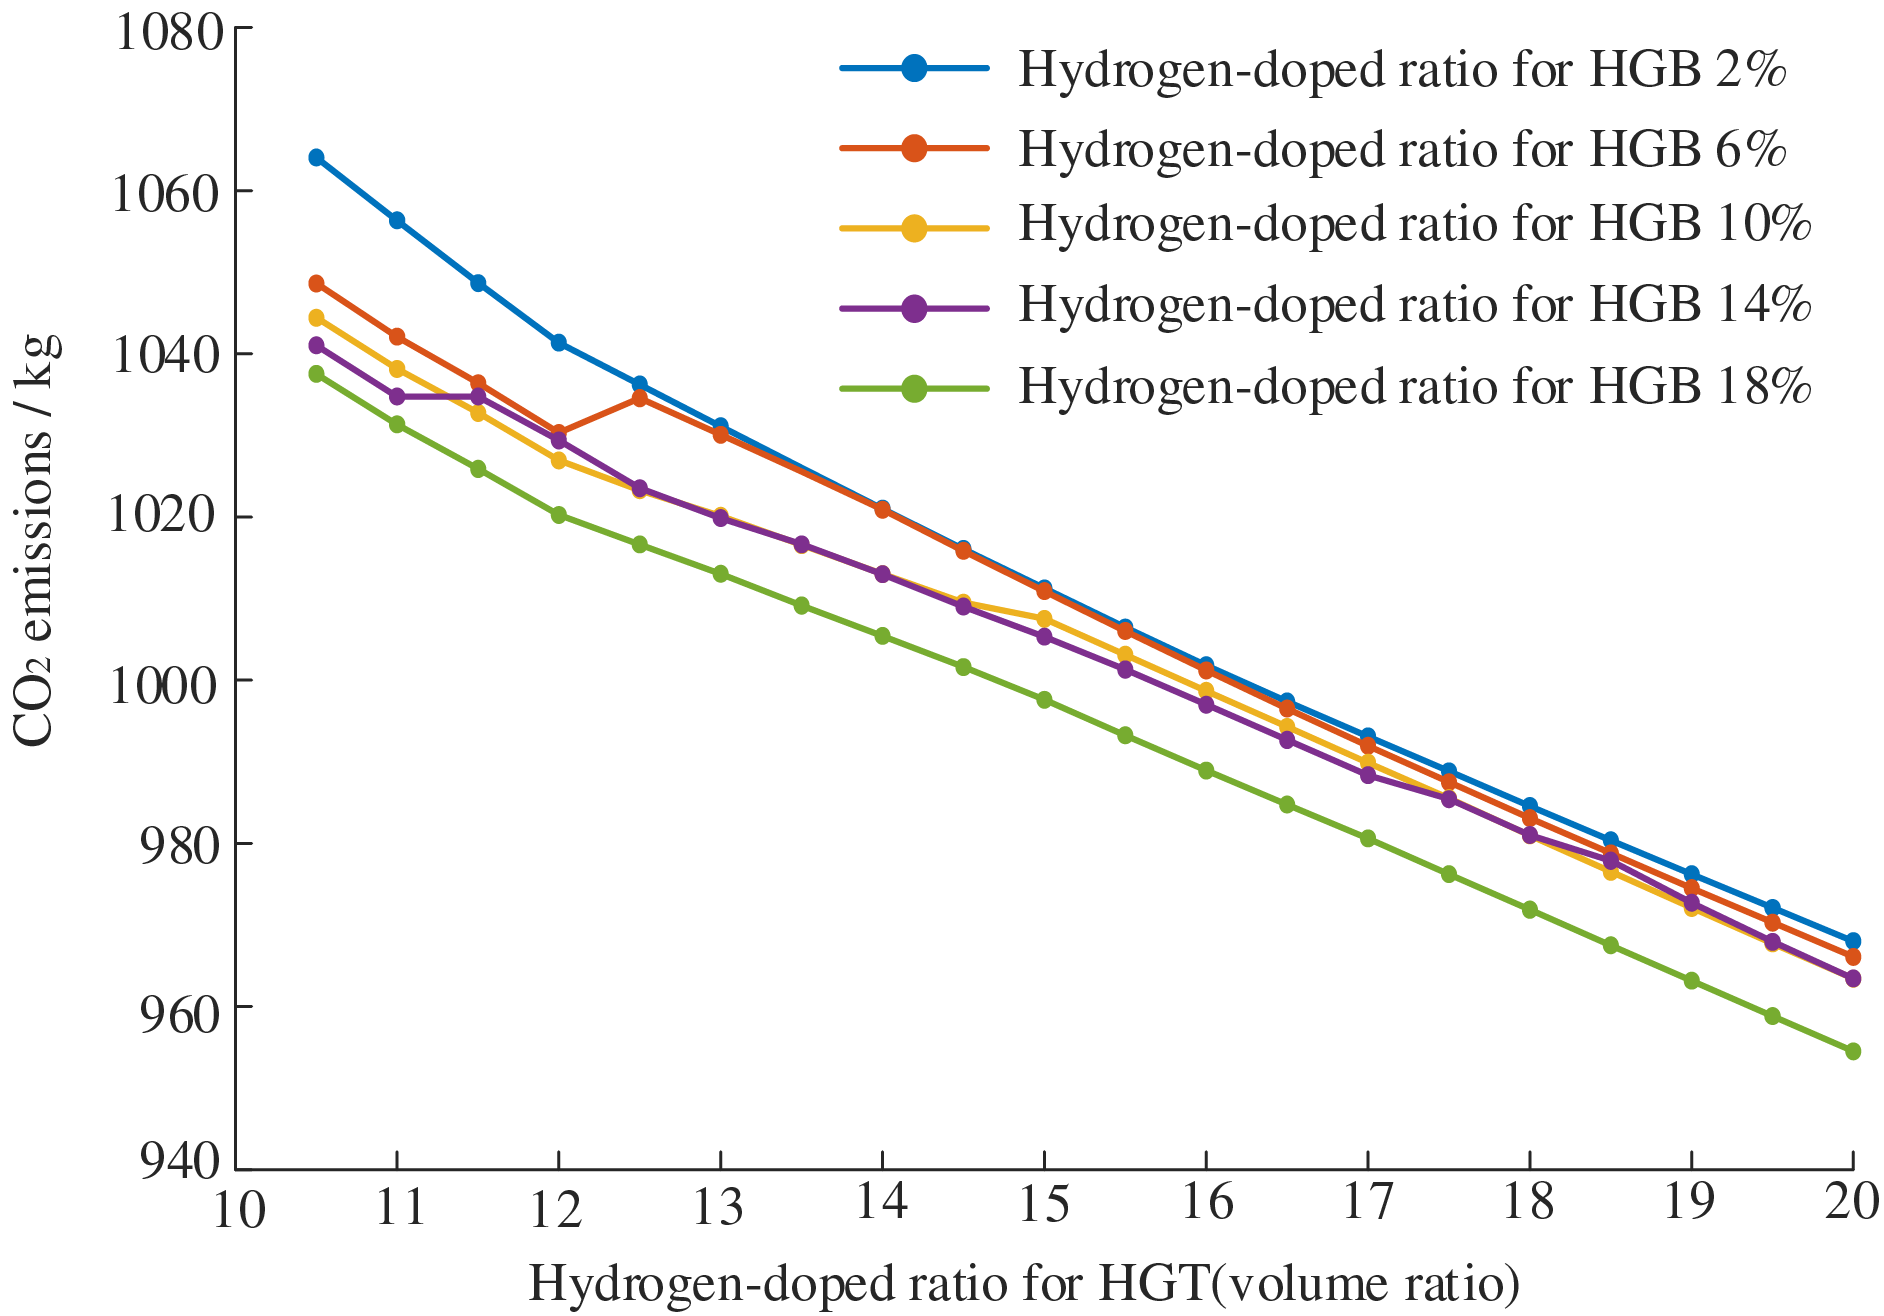
Figure 8: Carbon emission under different hydrogen-doped ratio
5.3 The Benefit Optimization Analysis of the ADN with Multi-PHIES
In order to prove the model rationality of the ADN with multi-PHIES based on the two-layer hybrid game, three scenarios are established for comparison.
Scenario 1: The purchasing and selling electricity price is used in Table 3 for the ADN. The game relationship is not considered.
Scenario 2: The master-slave game relationship between the ADN and PHIES is considered. The cooperative game relationship between multi-PHIES is not considered.
Scenario 3: The hybrid game relationship between the ADN and PHIES alliance is considered.
In this paper, the particle swarm optimization algorithm (PSO), grey wolf optimizer algorithm (GWO), differential evolution algorithm (DE), and QIO algorithm combined with Gurobi are used to solve the scheduling model of the ADN with mult-PHIES based on the two-layer hybrid game. The comparison analysis of the optimization results of each algorithm and the solution time is demonstrated in Table 5.
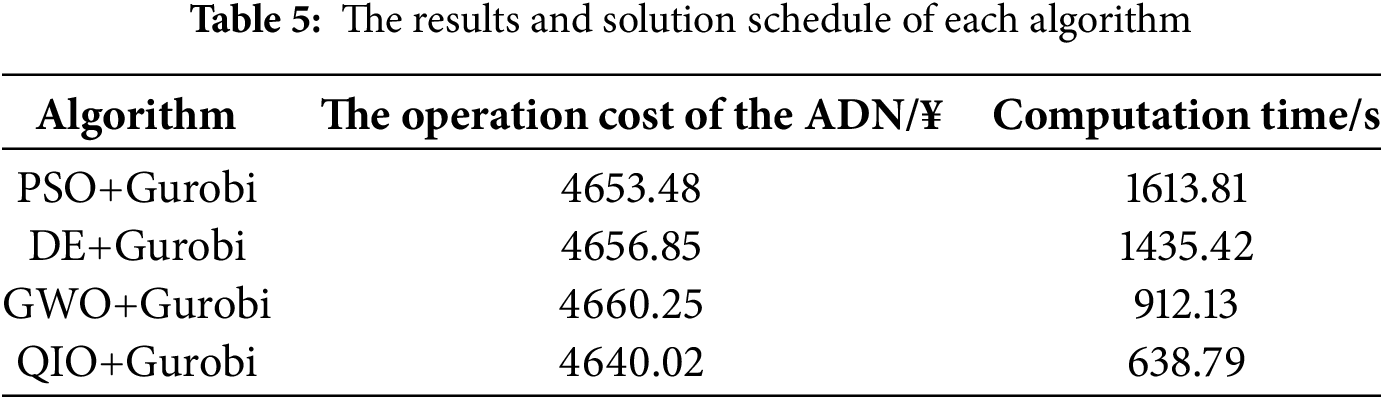
By analyzing the data in Table 5, the operation cost of ADN obtained by QIO+Gurobi is decreased by 0.29%, 0.36%, and 0.43%, respectively compared with PSO+Gurobi, DE+Gurobi and GWO+Gurobi algorithms. At the same time, compared with the above three algorithms, the solution time of the QIO+Gurobi algorithm is shortened by 60.42%, 55.50%, and 29.97%, respectively. It has been proved that the QIO+Gurobi algorithm can effectively and quickly obtain the optimal solution of the optimal scheduling mathematical model for the ADN with multi-PHIES. The analysis results of subsequent examples are obtained by the QIO+Gurobi algorithm. The solution iterative curve by the QIO+Gurobi algorithm is shown in Fig. 9.
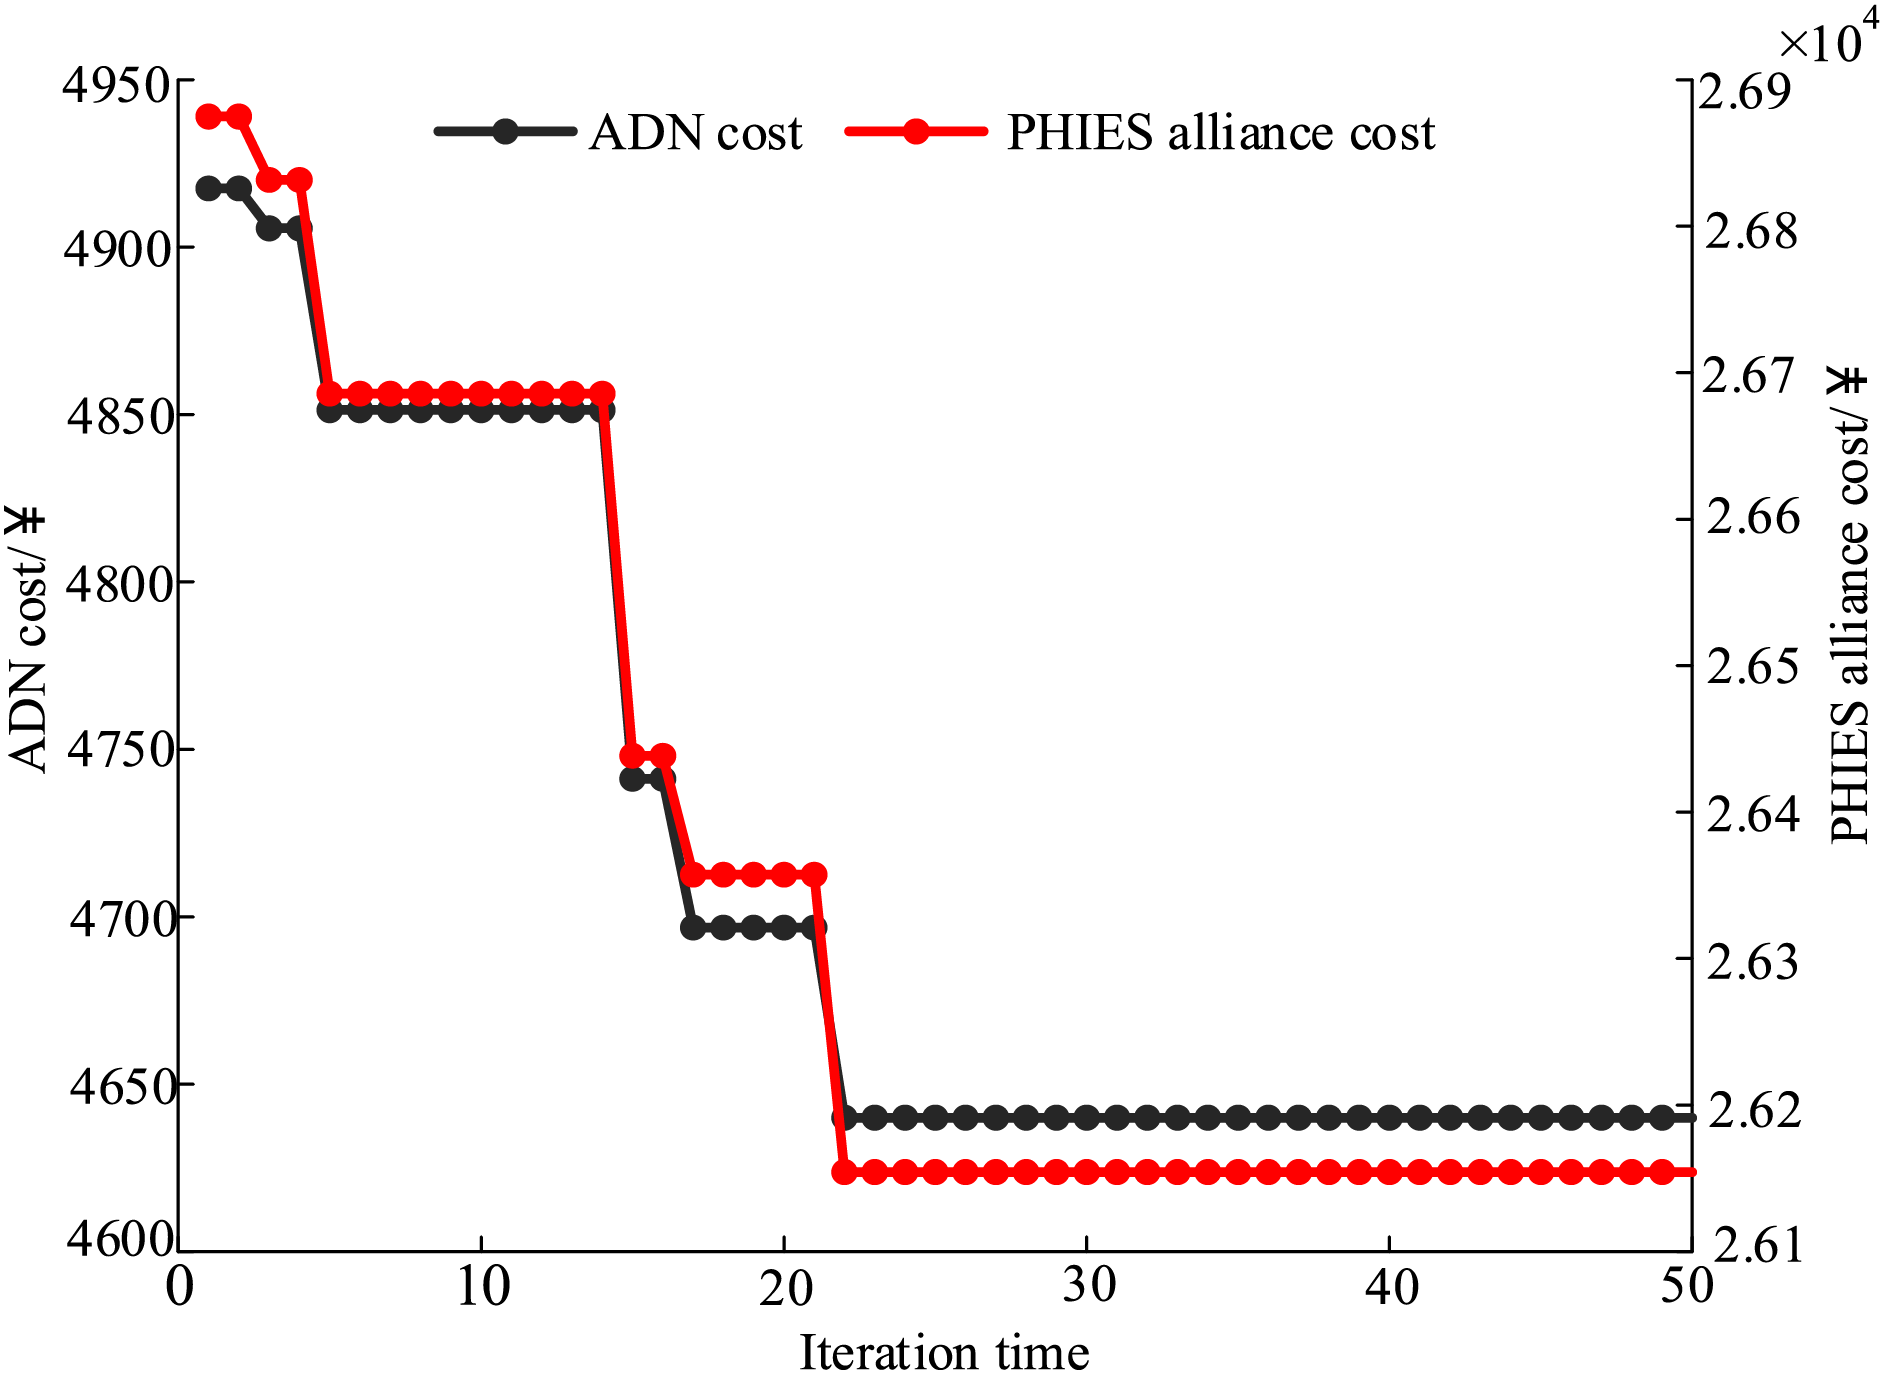
Figure 9: Solution iteration curves by the QIO+Gurobi algorithm
From Fig. 9, in the whole iteration process, the ADN and PHIES alliance are actively striving to maximize their own interests, and the operating costs of the ADN and PHIES alliance both show a downward trend. This phenomenon indicates that ADN is continuously optimizing the electricity price according to the purchasing and selling of electricity power fed back by the PHIES Alliance. The optimized electricity price facilitates the power interaction between the PHIES Alliance and the AND and reduces the operating cost of the PHIES Alliance and the ADN. The whole system finally reaches a balance in the twenty-second iteration.
The cost of ADN and PHIES in three scenarios are demonstrated in Table 6.
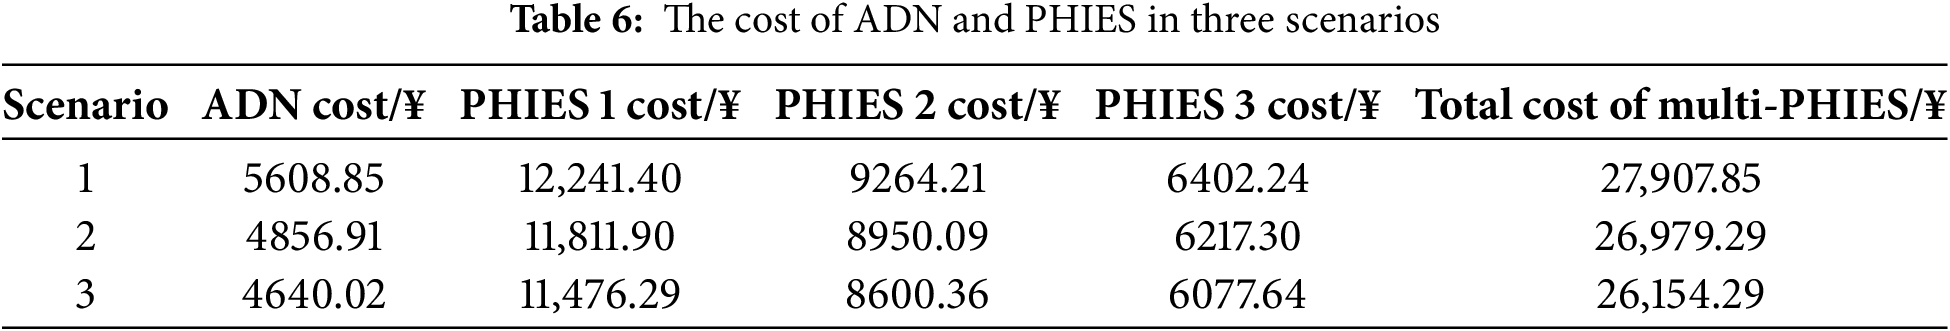
By analyzing the data of scenario 1 in Table 6, because there is neither a master-slave game nor a cooperative game between ADN and PHIES, the energy supply of each PHIES can only rely on its own equipment output and purchase power from the ADN. Due to the relatively high price of the ADN in scenario 1, each PHIES mostly relies on its own equipment. Therefore, in scenario 1, the ADN obtains fewer benefits from each PHIES, and the cost of the ADN is increased. At the same time, the operation cost of each PHIES is relatively high, which is not beneficial to the coordinated operation of PHIES and ADN. Comparing scenario 2 with scenario 3, since the power interaction sharing mechanism within the PHIES alliance is increased in scenario 3, in order to enhance the interaction between ADN and PHIES, the strategy of appropriately reducing the power purchase price used by ADN has increased the income of ADN from electricity sales. Therefore, the ADN cost in scenario 3 is decreased by 4.47% compared with scenario 2. Since the electricity purchasing price of each PHIES from ADN is relatively lower, the total cost of mulit-PHIES is also decreased by 3.06%. The above analysis shows that the cooperative implementation of power sharing within the PHIES alliance can effectively decrease the operation cost of the alliance, which is more conducive to the coordinated operation of PHIES and ADN.
5.4 The Result Analysis of the System Optimization
The results of the purchasing and selling electricity price of the PHIES set by ADN in scenarios 2 and 3 are demonstrated in Fig. 10. From Fig. 10, the purchasing electricity price set by ADN in scenario 2 is always higher than that in scenario 3, due to the factors of energy cooperation and sharing within the PHIES alliance is considered in scenario 3. In scenario 3, PHIES alliance members can achieve self-load balance through broader energy trading cooperation, so their dependence on ADN is relatively weakened. Therefore, in order to enhance the interaction between ADN and PHIES and improve the economic benefits of the ADN. ADN will adopt a strategy of reducing the purchasing electricity price to encourage PHIES to interact more with it.
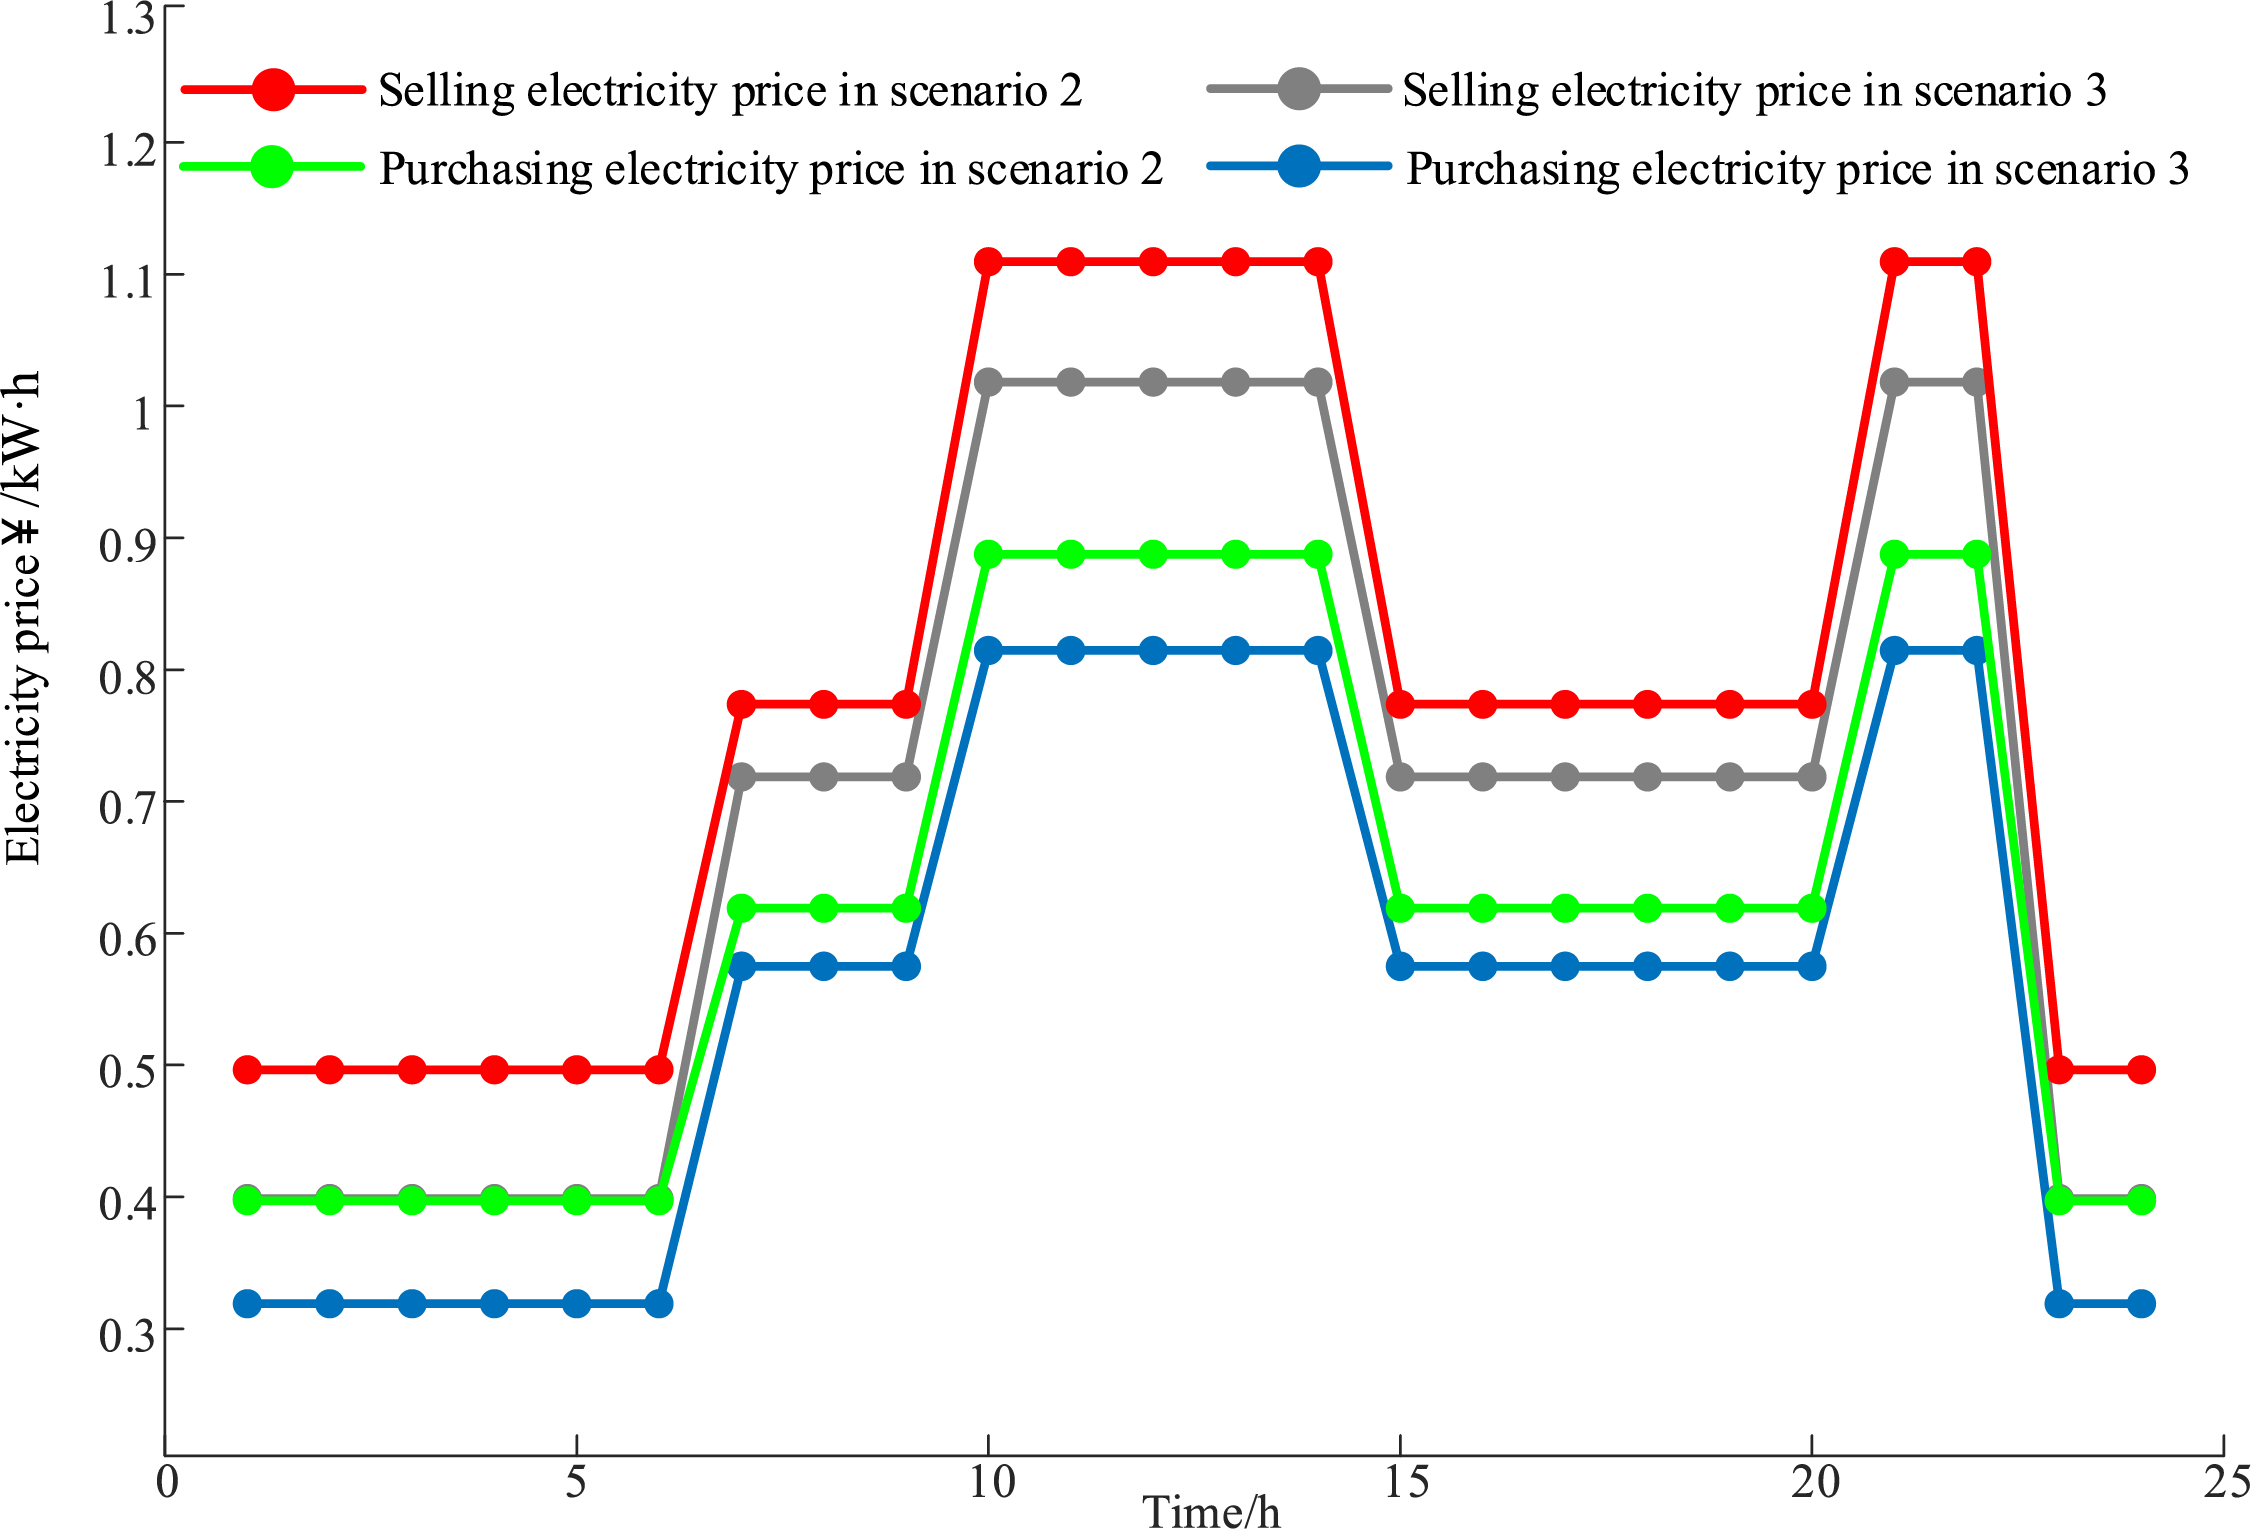
Figure 10: The electricity price curve formulated by ADN in different scenarios
The electric balance diagram and thermal balance diagram of each PHIES are shown in Figs. 11–16. Because the electric power and thermal balance diagrams for PHIES 2 and PHIES 3 are shown similar to that of PHIES 1, the only electric and thermal power balance of PHIES 1 in scenario 3 are analyzed. The electric and thermal power balance of PHIES1 are demonstrated in Figs. 11 and 12.
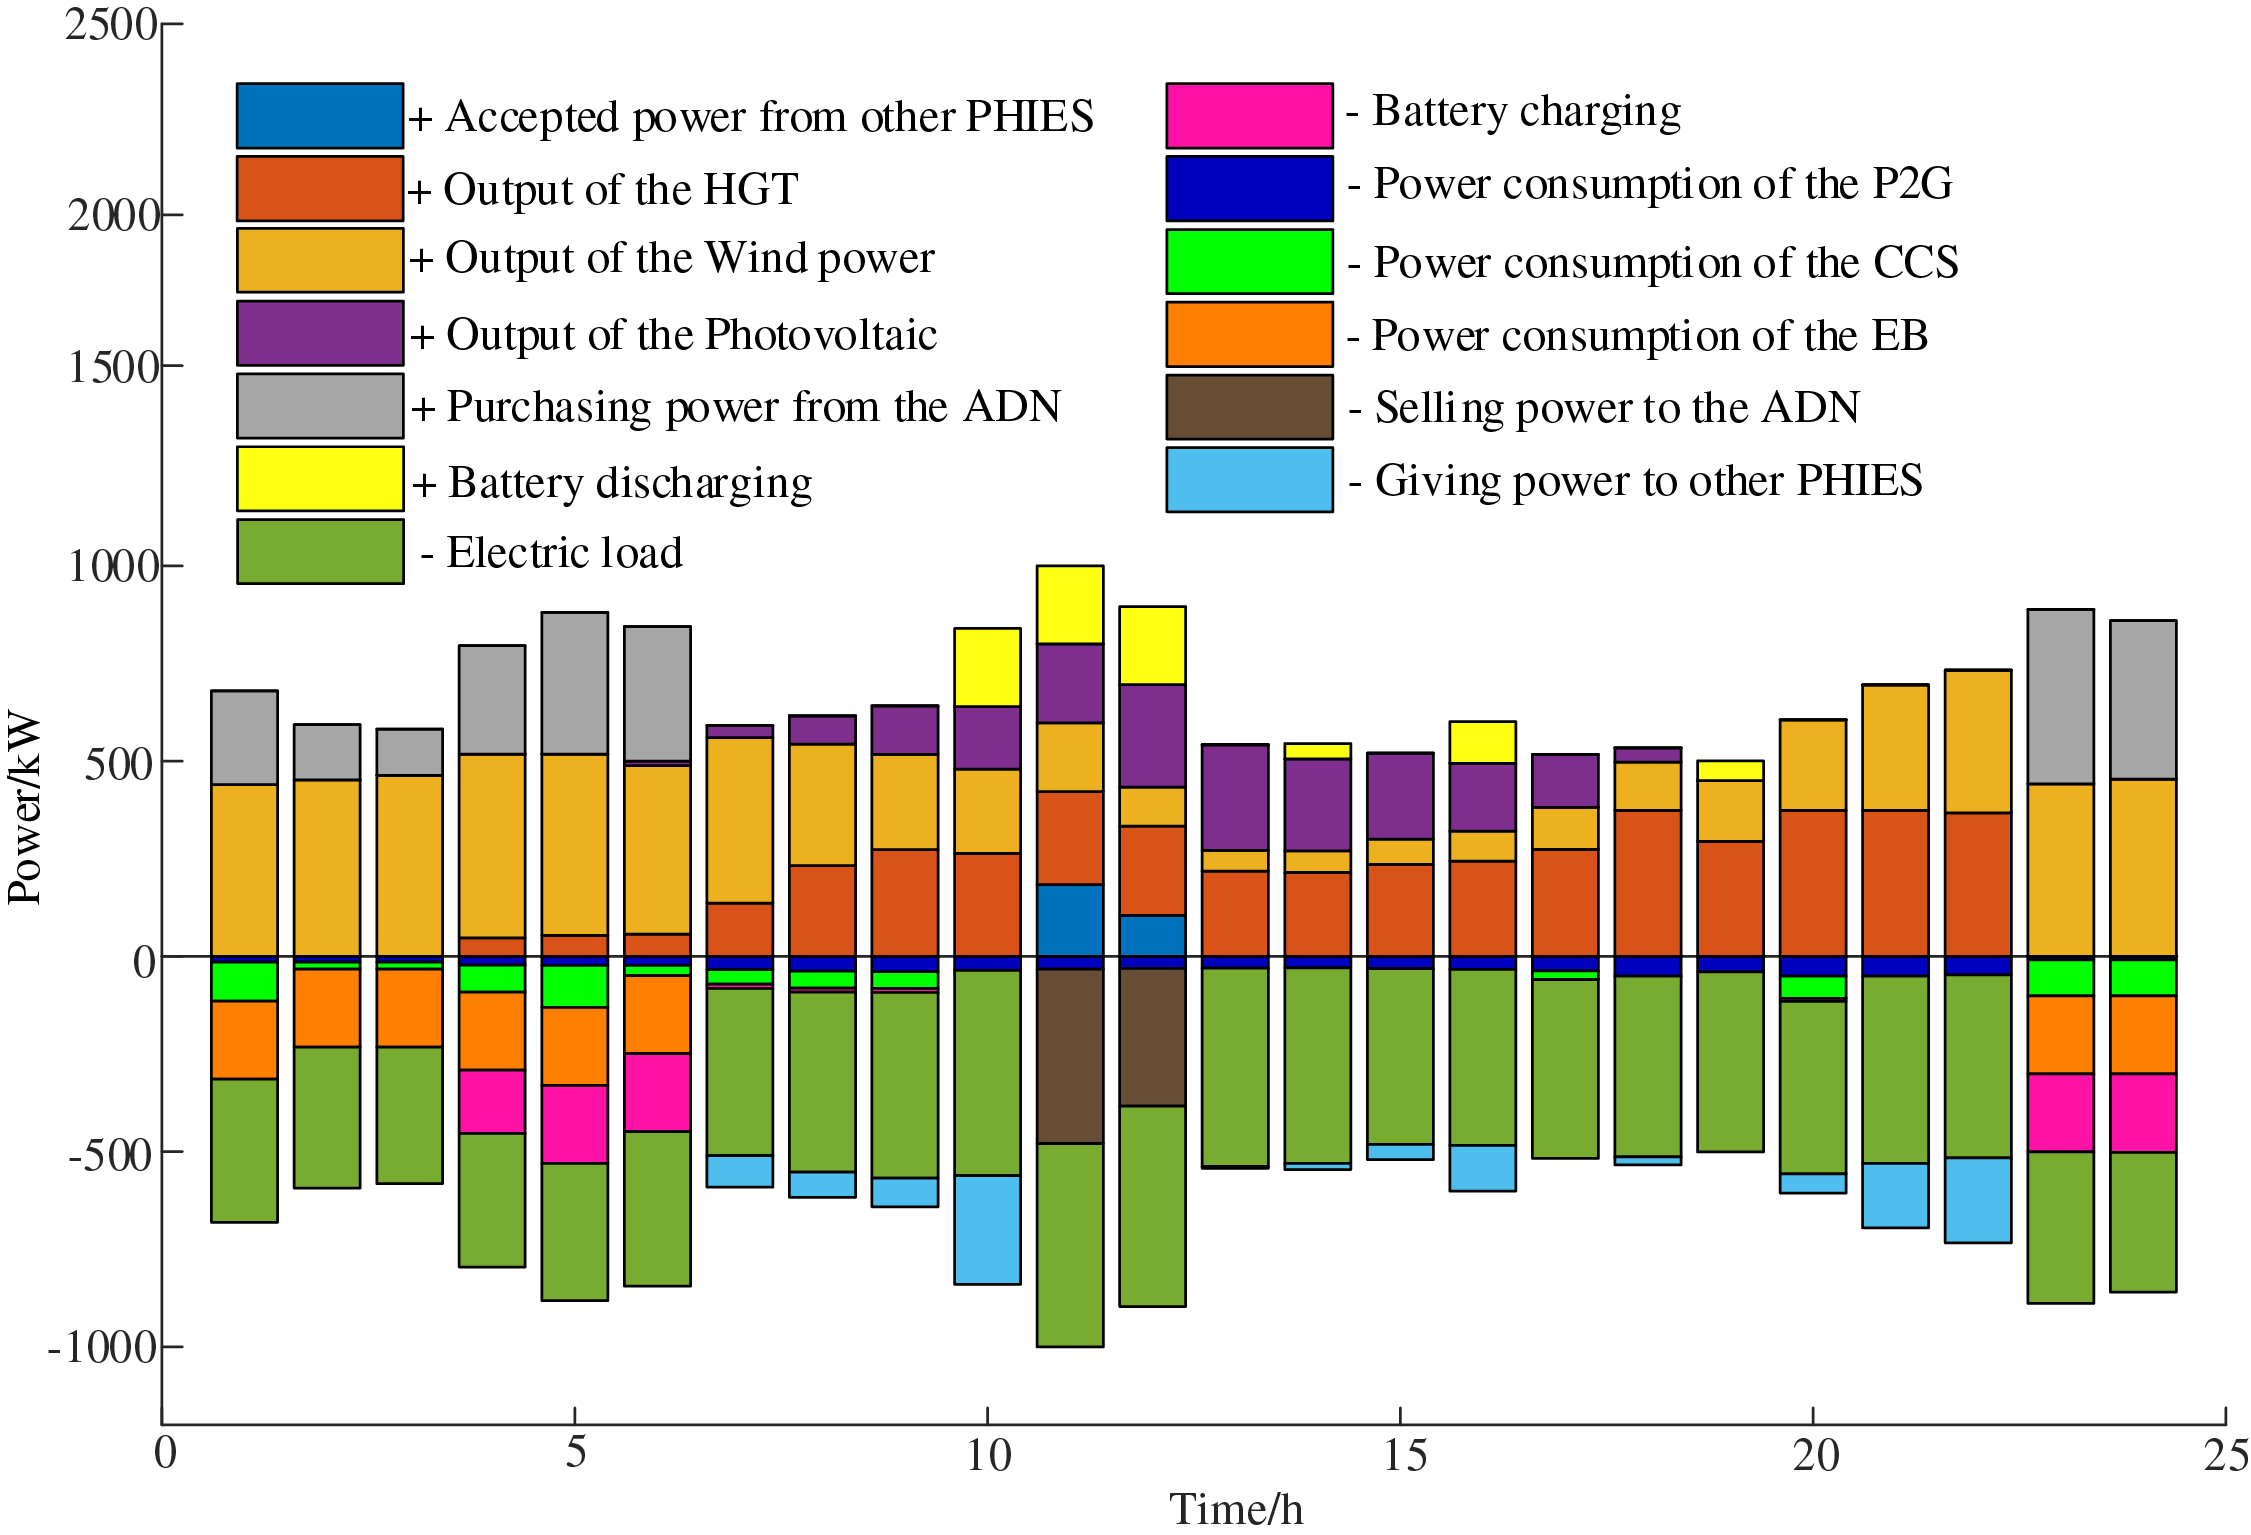
Figure 11: The electric power balance diagram of PHIES 1
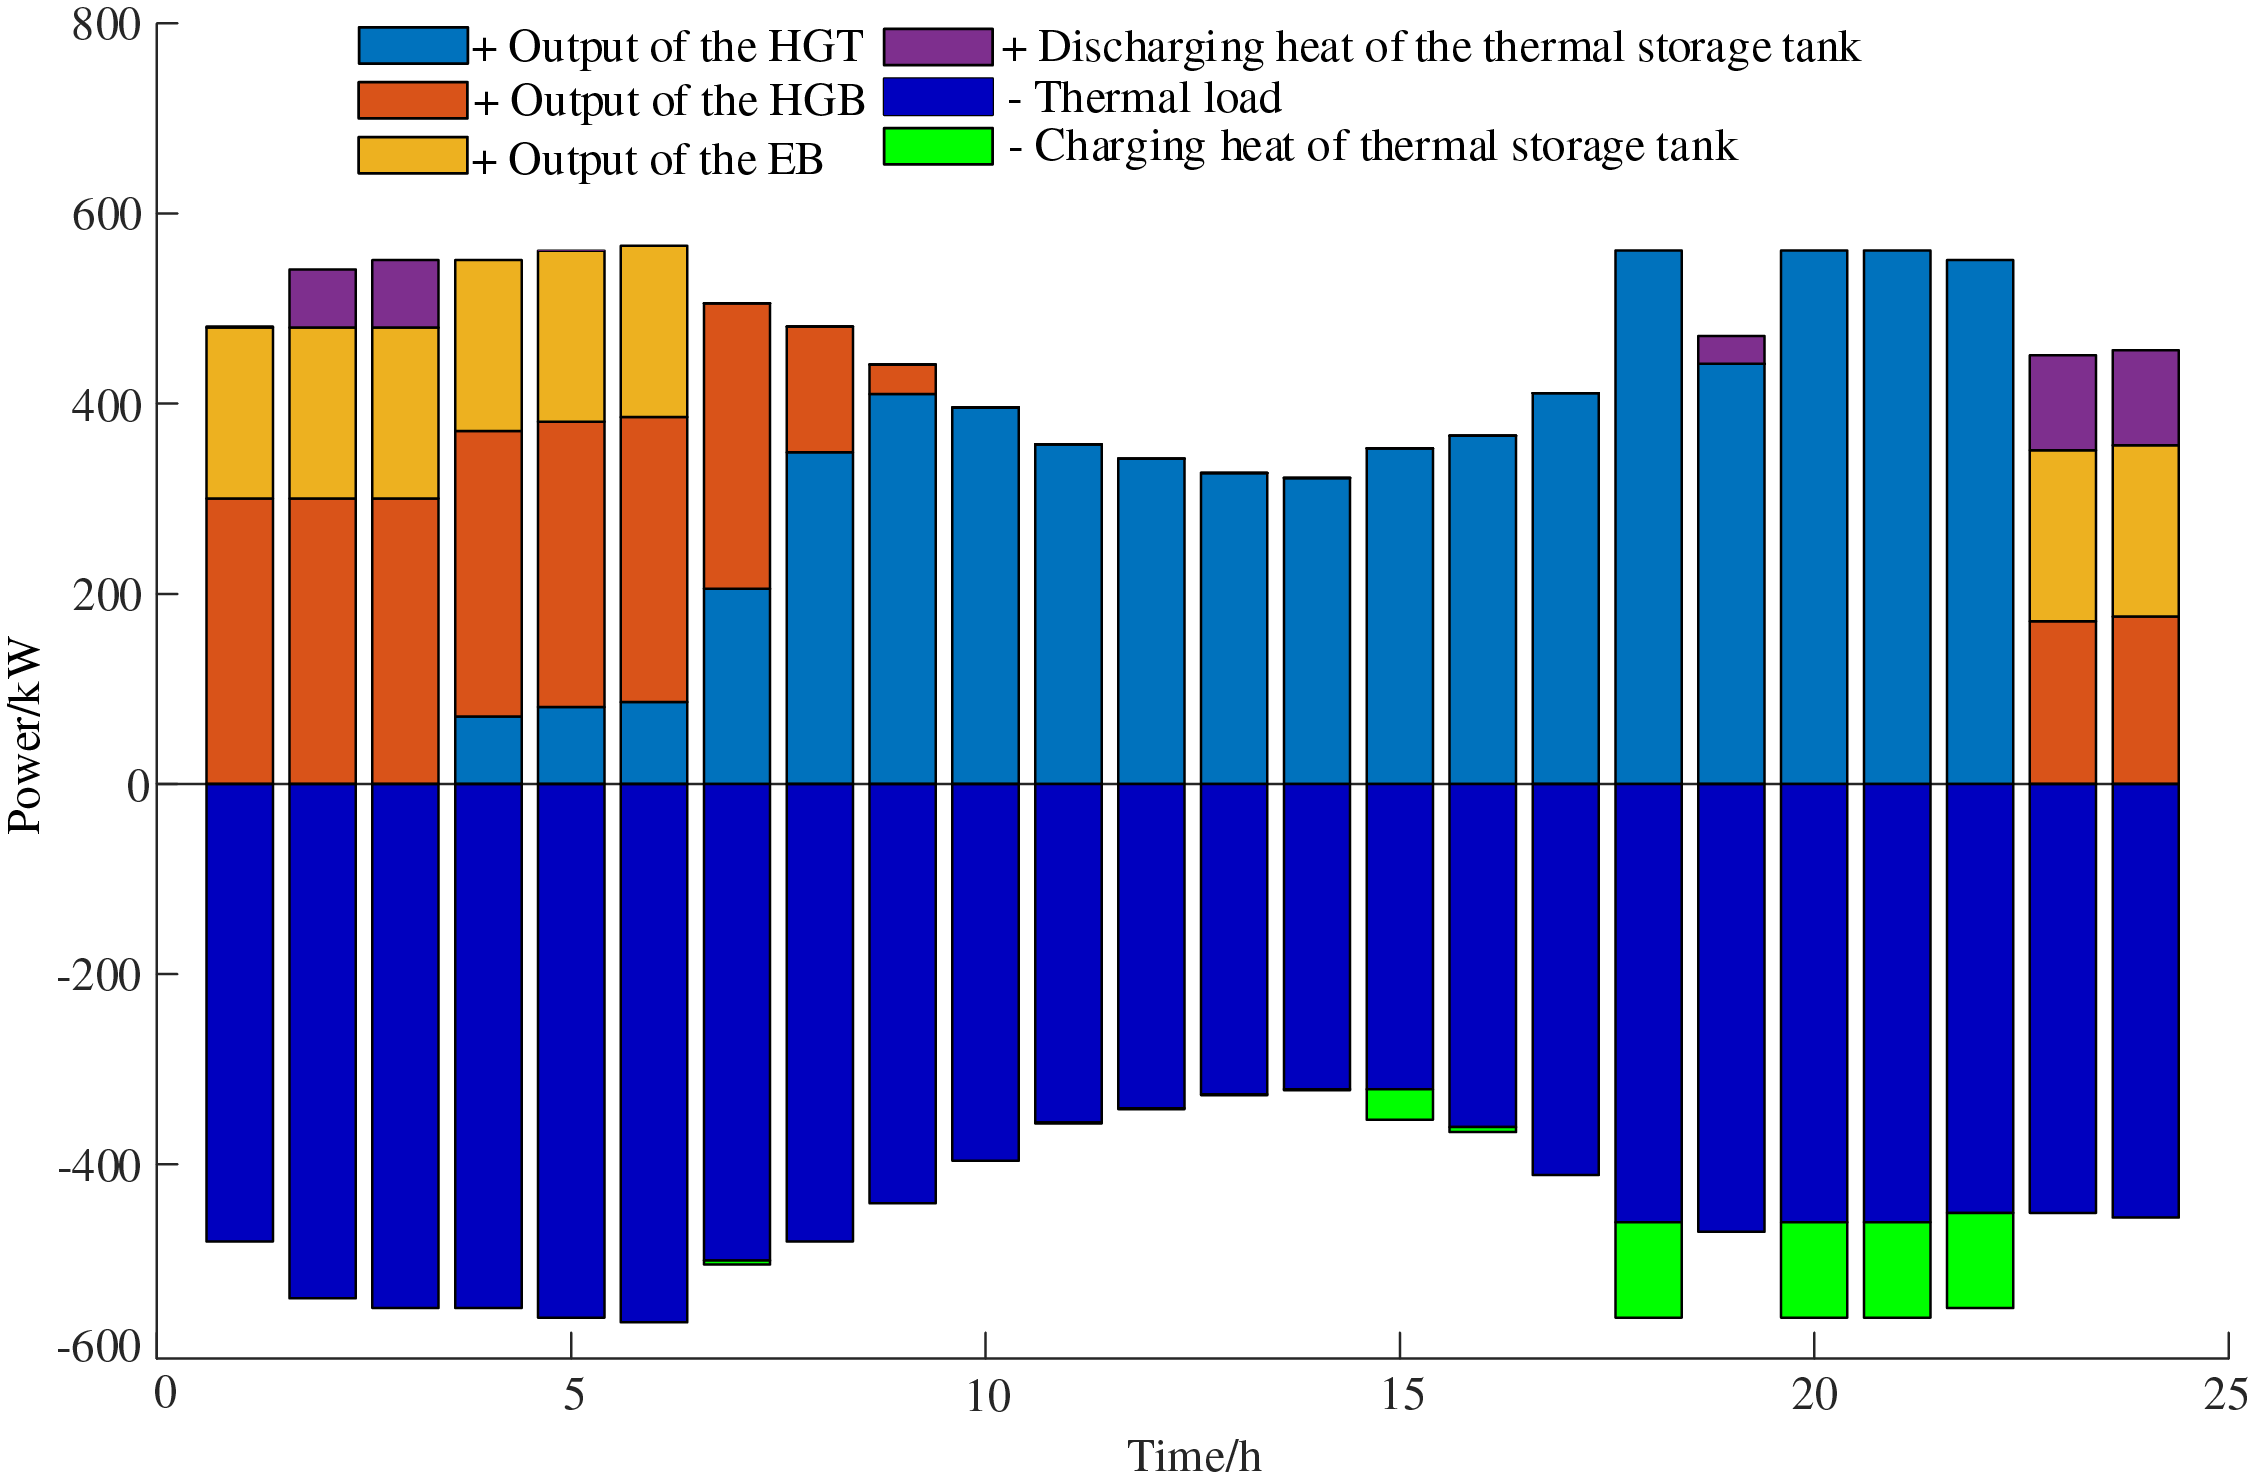
Figure 12: The thermal power balance diagram of PHIES 1
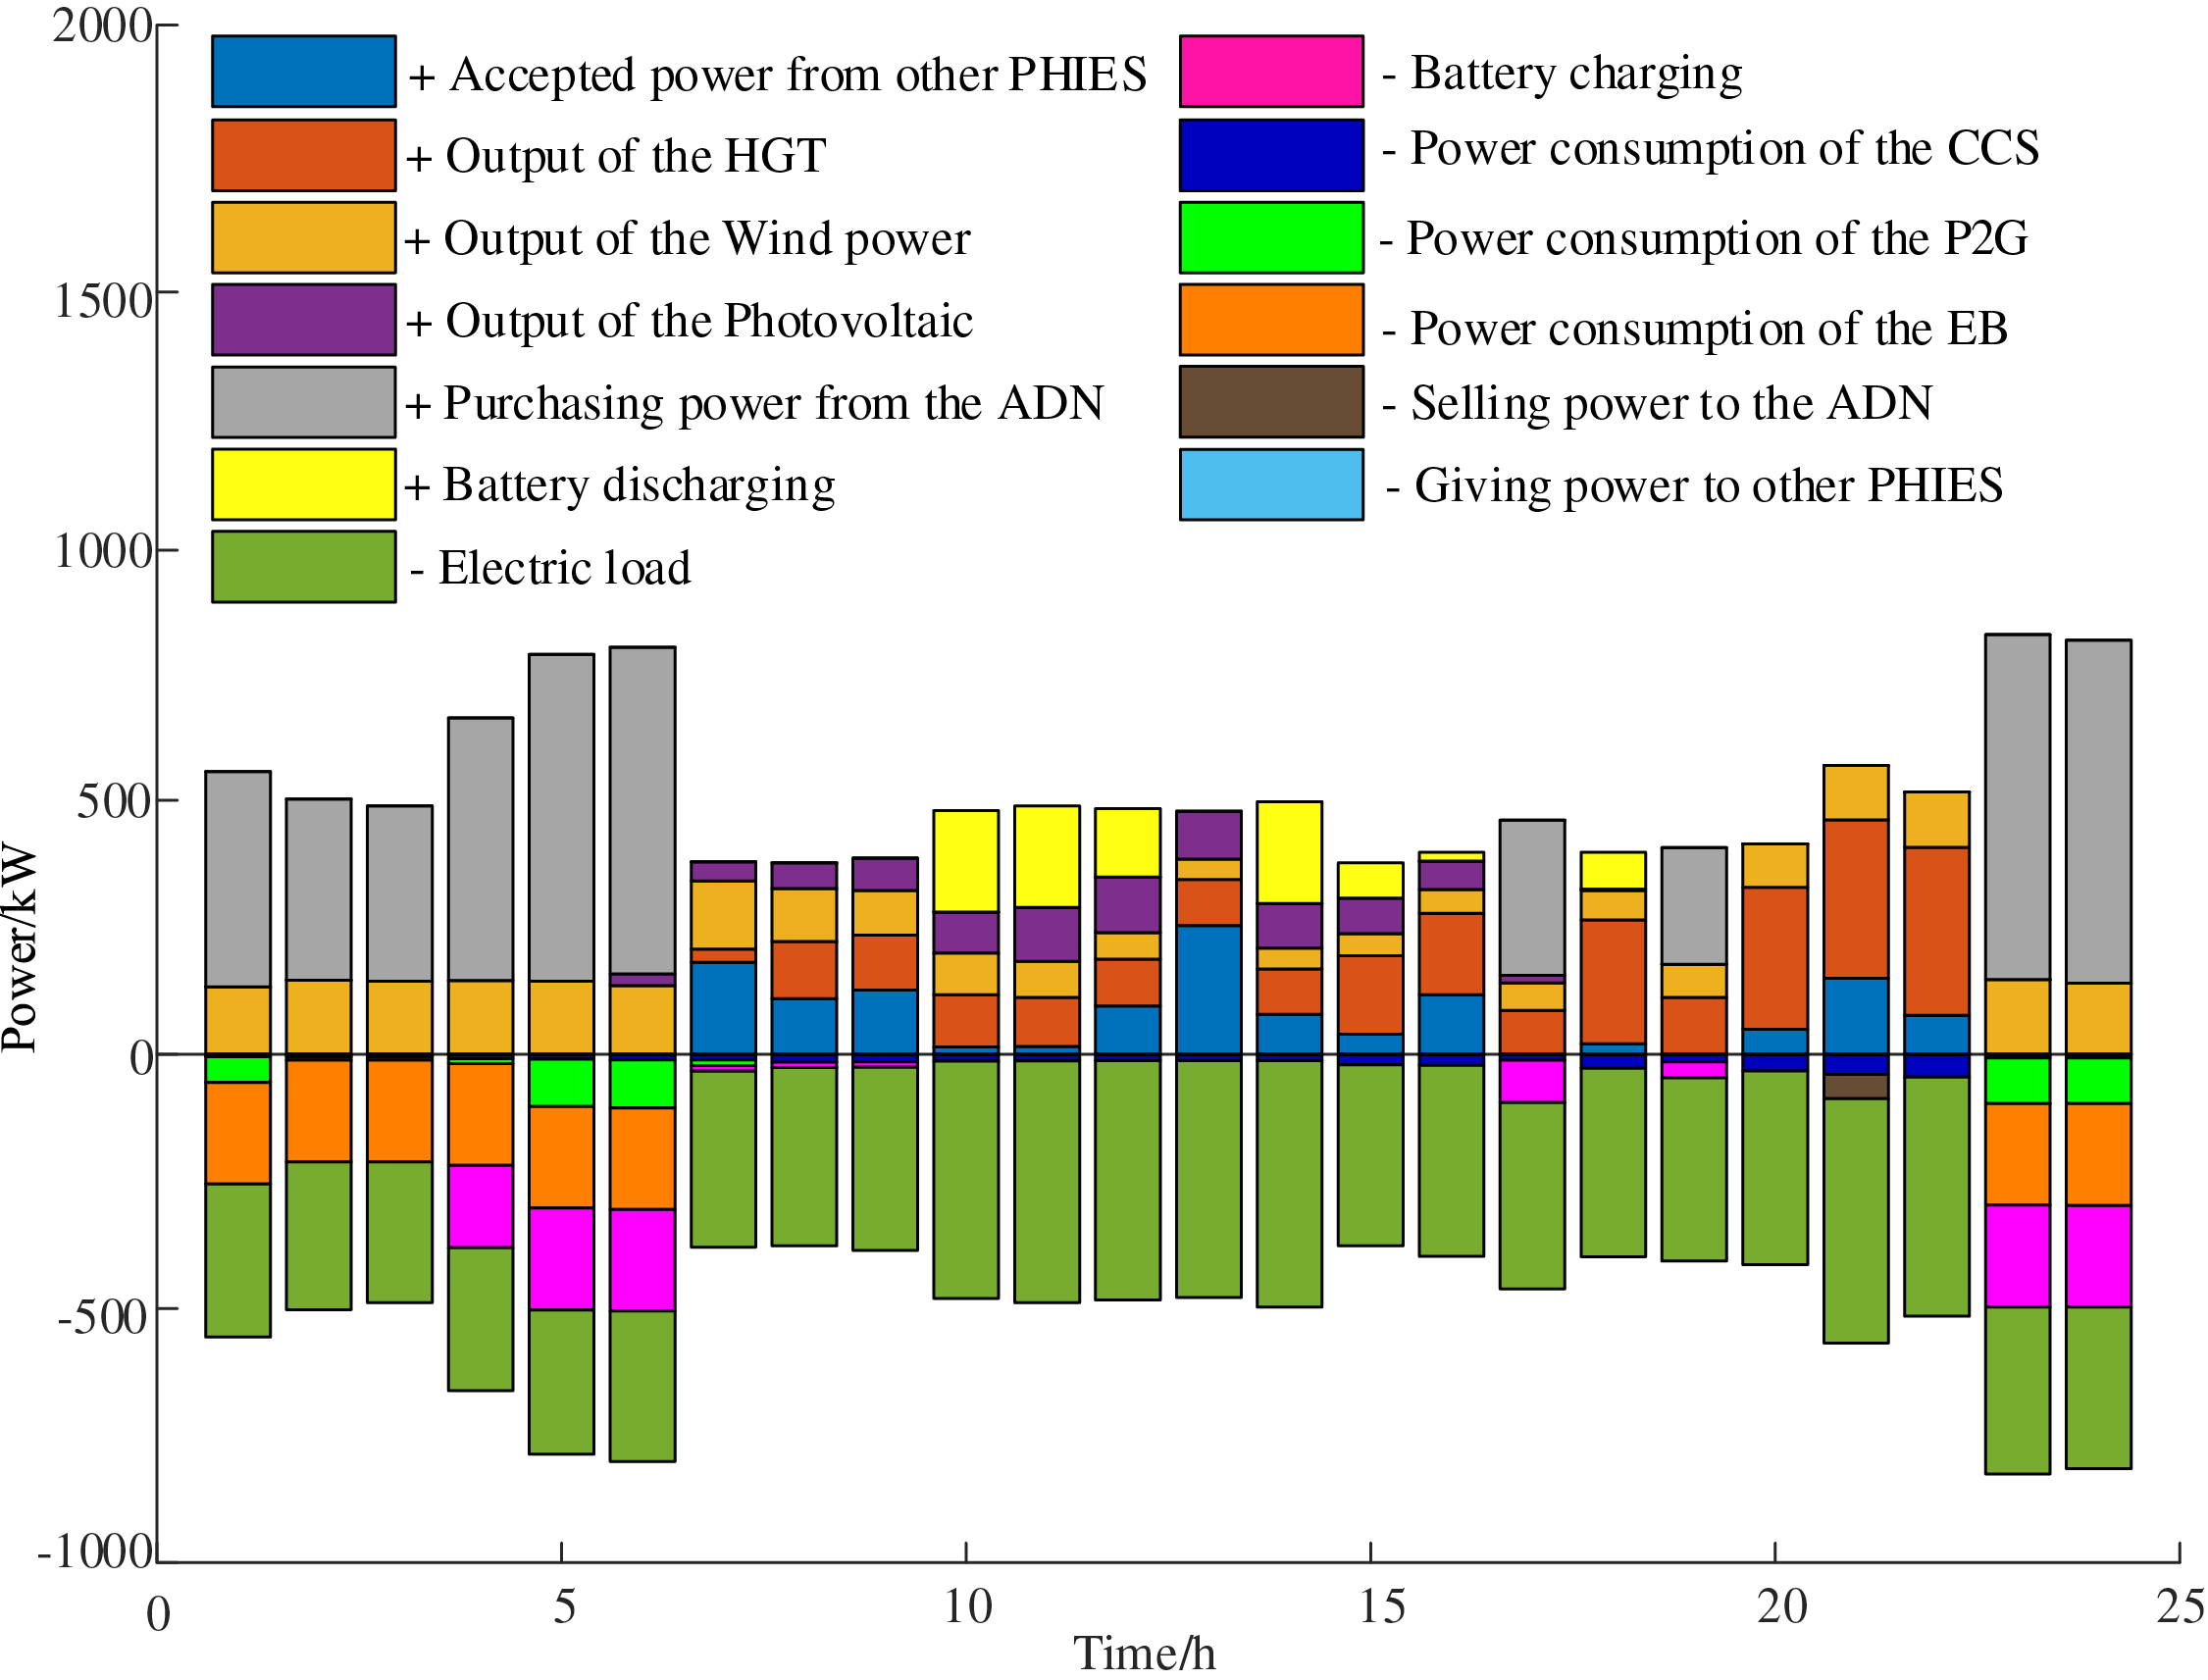
Figure 13: The electric power balance diagram of PHIES 2
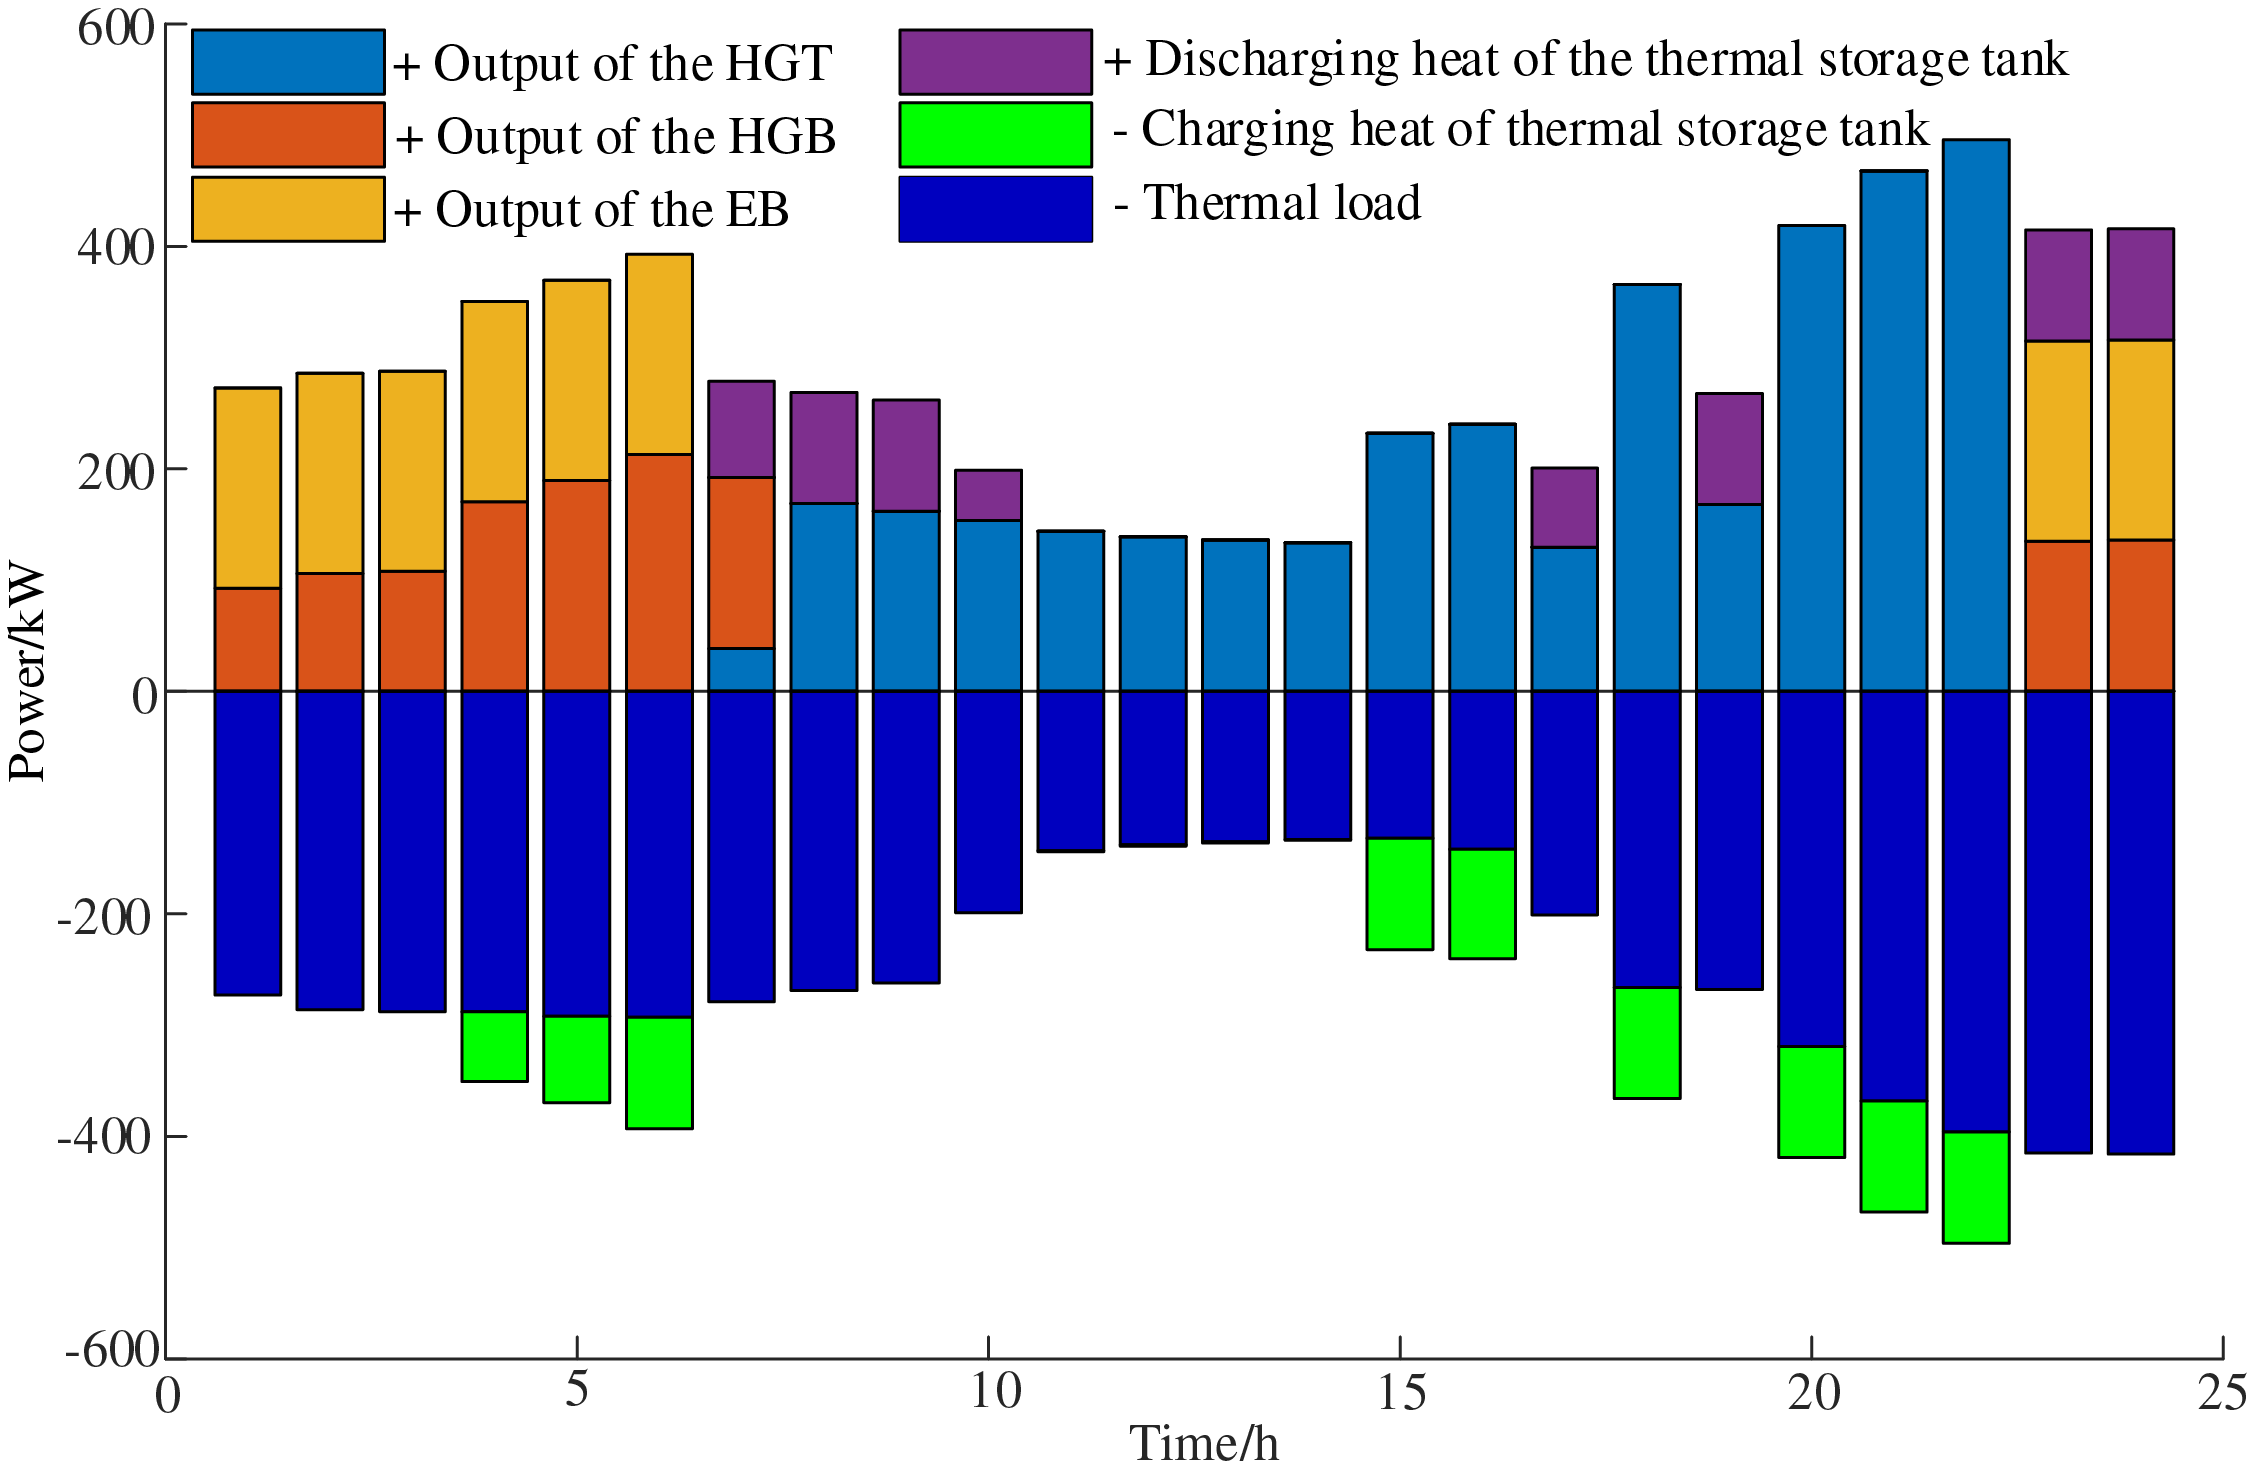
Figure 14: The thermal power balance diagram of PHIES 2
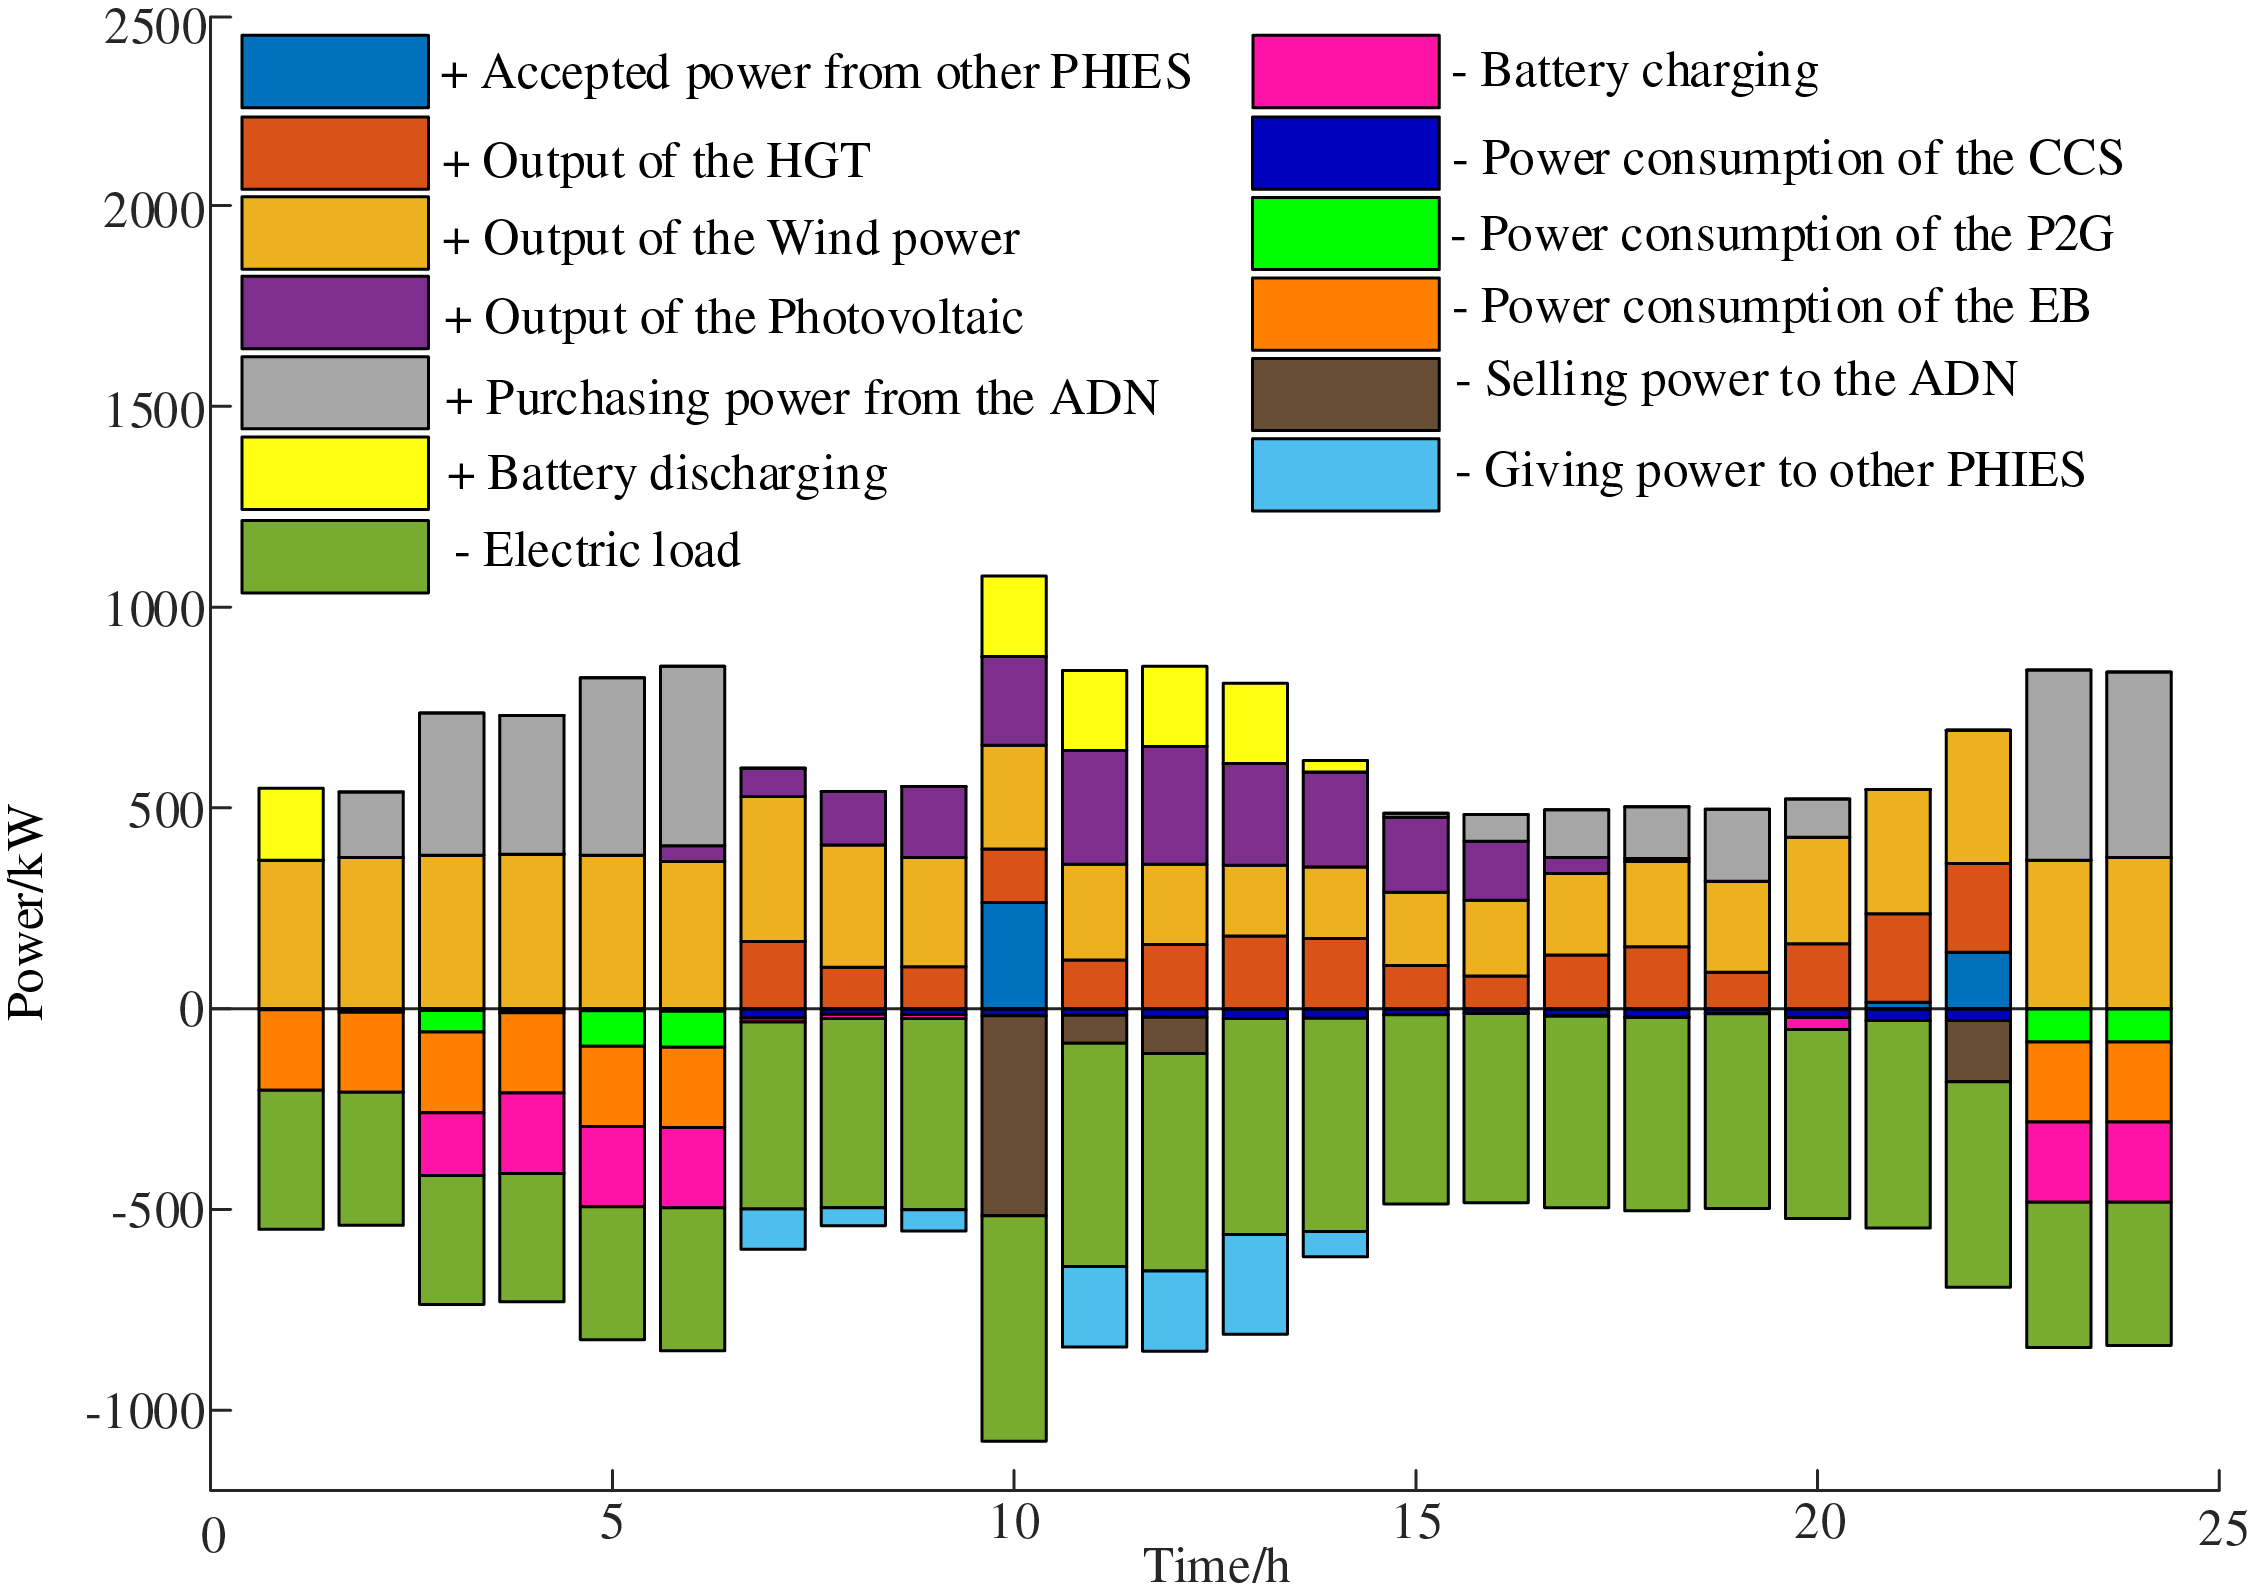
Figure 15: The electric power balance diagram of PHIES 3
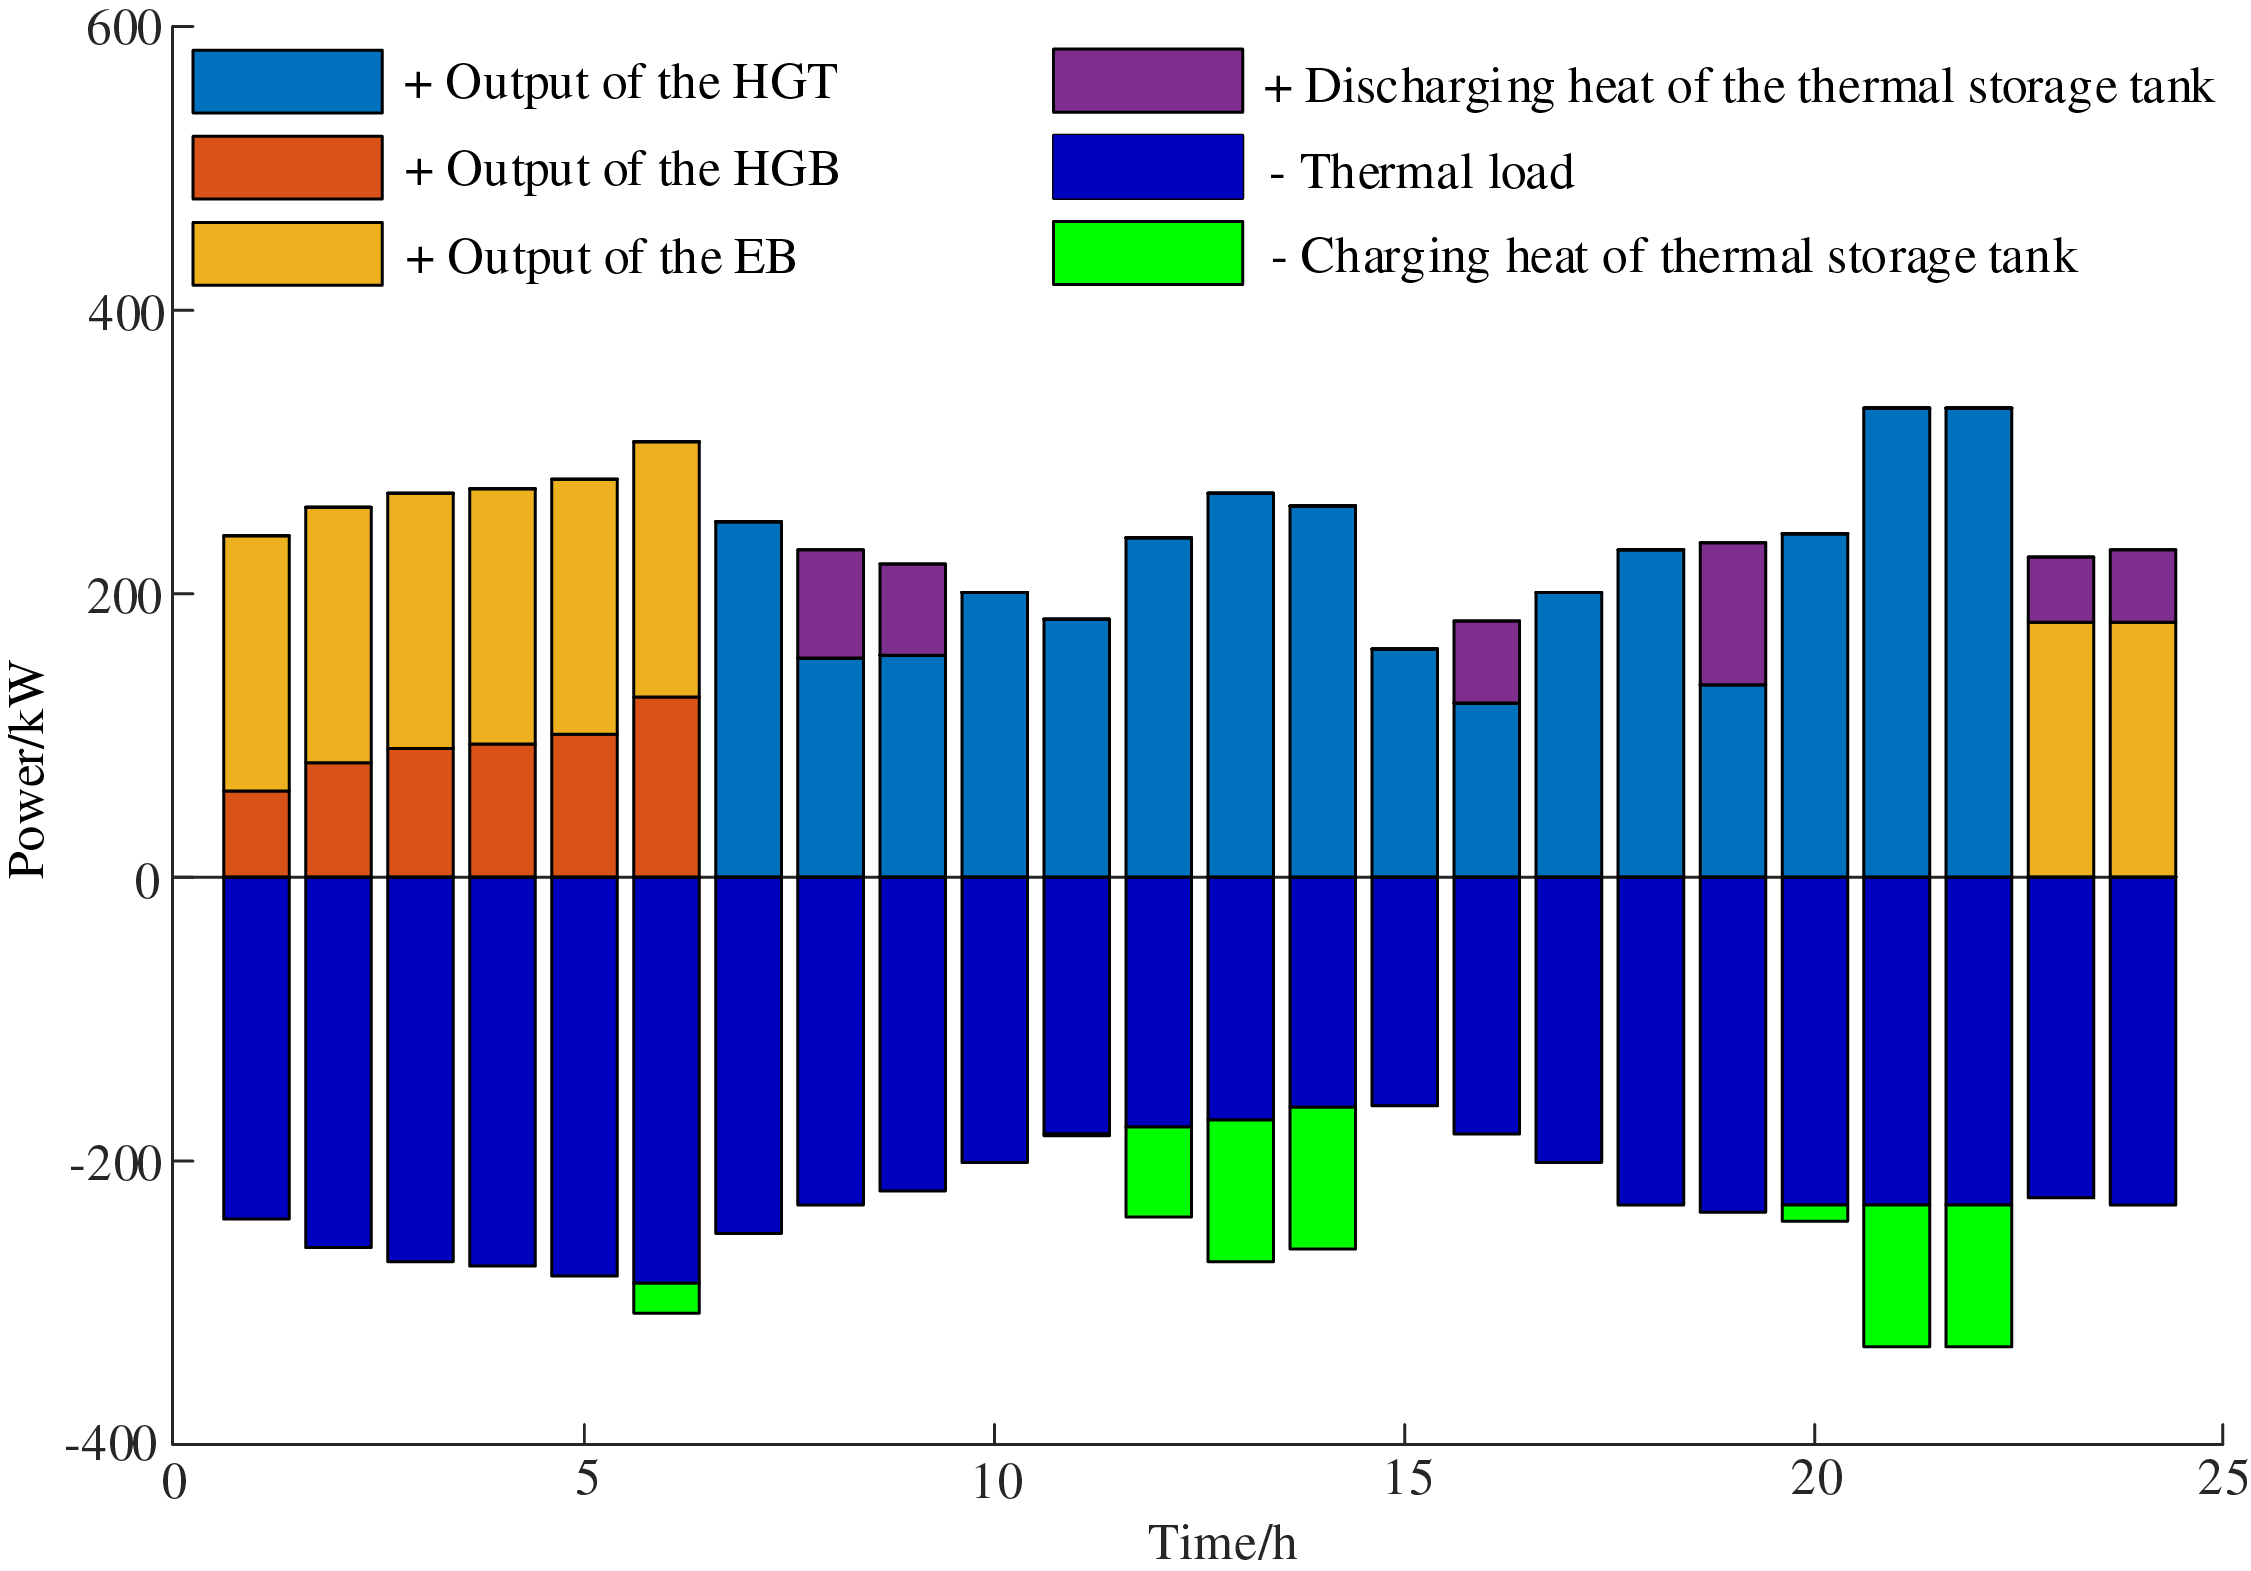
Figure 16: The thermal power balance diagram of PHIES 3
Through Fig. 11, at 01:00–06:00 and 23: 00–24:00, when the electricity price is at a low ebb. PHIES prioritizes accommodating its own wind power and purchasing electricity from ADN to meet its load. The superfluous electricity is stored by charging the battery and converted into other forms of energy through P2G devices to improve energy efficiency. During the period of 07:00–22:00, due to the relatively high electricity price set by ADN, PHIES reduced the power purchasing demand for ADN during this period. PHIES adopts a strategy of preferentially obtaining electric energy from the battery and increasing the output of its own HGT. The above strategy ensures that the load demand of the PHIES is met, and the cost of the PHIES is reduced. From Fig. 12, due to the low electricity price, the EB is heated at 01: 00–06: 00 and 23: 00–24:00. Other equipment such as HGT and HGB are output in other periods. The simulation further shows that the proposed optimal model based on the hybrid game can guide PHIES in taking part in peak-chopping and valley-filling. The proposed model can effectively achieve the coordinated operation between the ADN and PHIES alliance.
5.5 Carbon Emissions Analysis of the System
In order to further illustrate the impact of cooperation between multi-PHIES on carbon emissions, the carbon emissions of each PHIES are shown in Table 7.
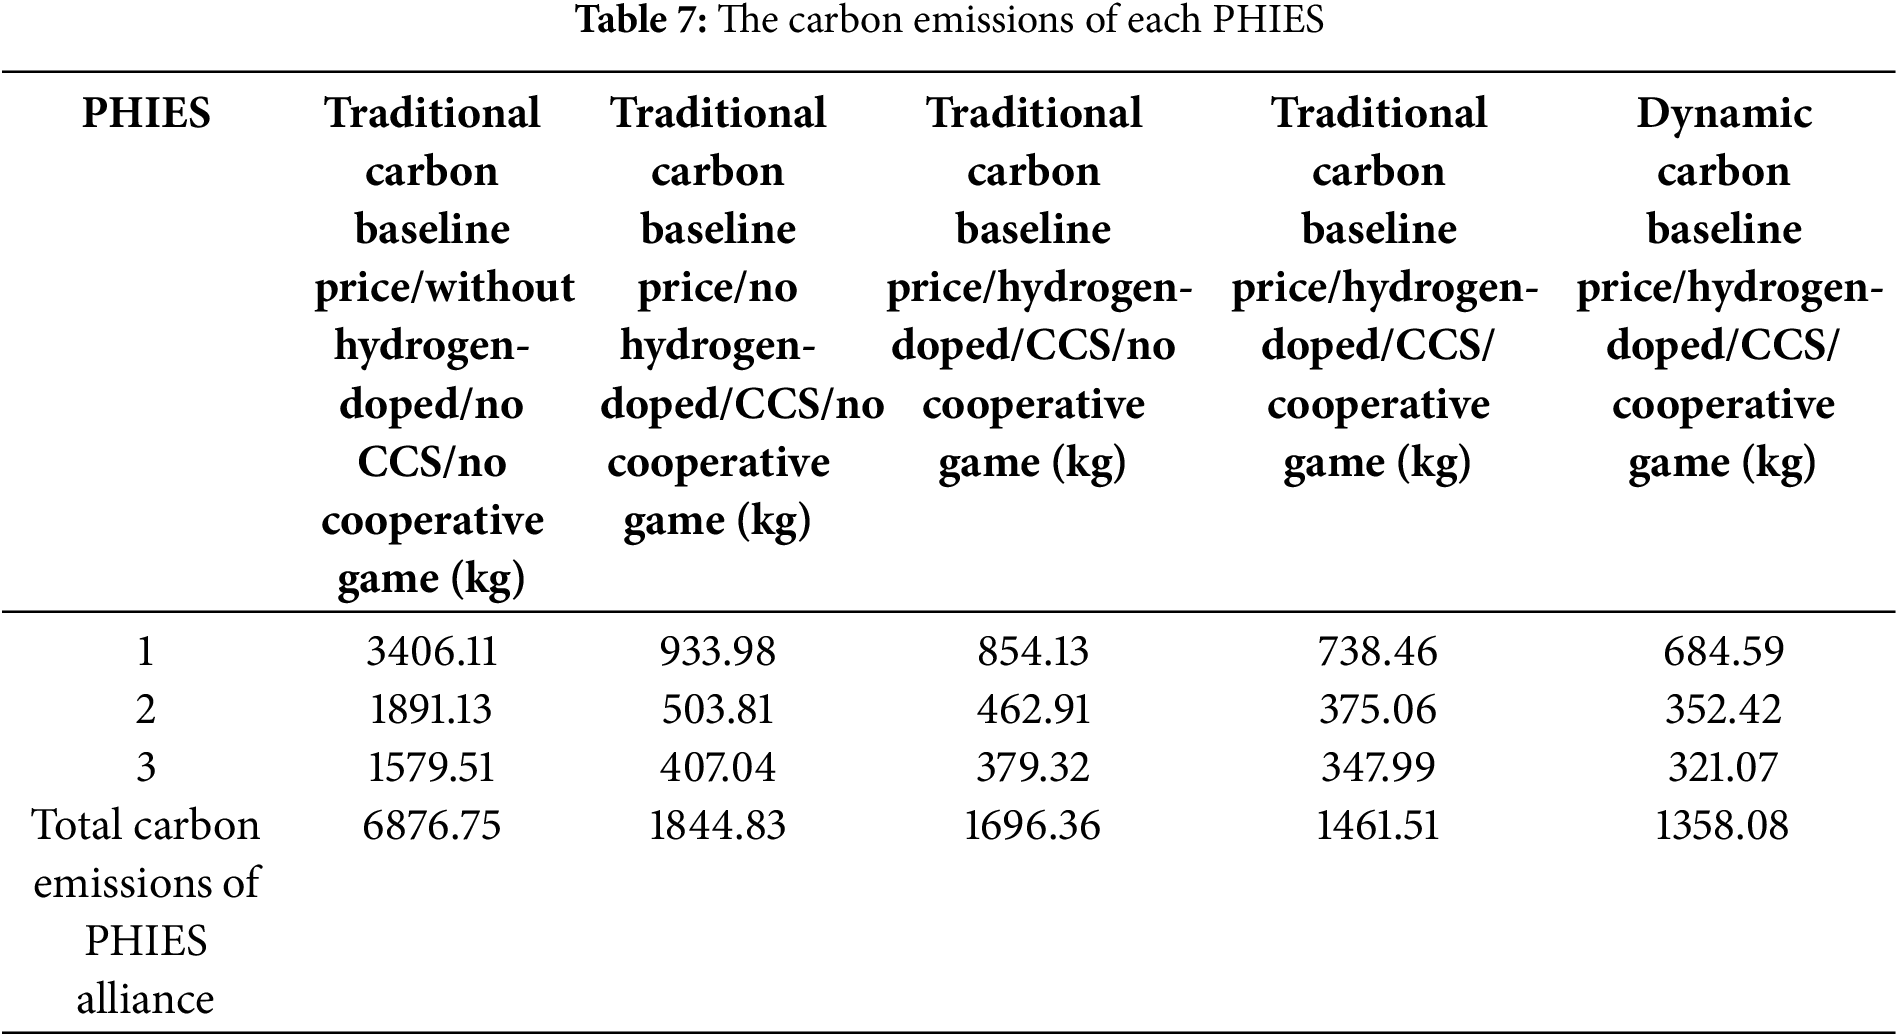
According to Table 7, when the PHIES alliance has no cooperative game, the total carbon emissions of the PHIES alliance is 1844.83 kg in the PHIES alliance with the CCS device. Compared with PHIES without CCS, the carbon emissions decreased by 73.17%. The above data demonstrates that adding CCS to each PHIES can effectively reduce the carbon emission. Comparing the data of column 3 and column 4 in Table 7, the total carbon emissions of PHIES alliance is reduced by 8.05% by using hydrogen-doped natural gas compared with not using hydrogen-doped natural gas. The above data shows that the addition of hydrogen to natural gas as a fuel for HGT and HGB can also reduce the carbon emissions of PHIES. Comparing the data of columns 4 and 5 in Table 7, the total carbon emissions of the PHIES alliance with the cooperative game are 13.84% lower than those without a cooperative game. After cooperation, PHIES can exchange power through P2P to achieve resource sharing. With a new source of energy, the output of the HGT is reduced, thereby carbon emission is reduced. It is also verified that the cooperation between PHIES can not only decrease its own cost but also reduce carbon emissions. Comparing the data of column 5 and column 6 in Table 7, the improved carbon trading model based on dynamic carbon baseline price is used to reduce the total carbon emissions of the PHIES alliance by 7.08%. In the improved carbon trading model based on dynamic carbon baseline price, the carbon emissions in each period and the overall carbon emissions in a cycle are taken as the dynamic factors of the carbon baseline price so as to ensure that the system should consider both the short-term carbon emission income and the long-term carbon emission income. Thus, the carbon baseline price is directly proportional to carbon emissions in the improved carbon trading model based on dynamic carbon baseline price. This means that the carbon emissions are greater, the carbon baseline price is higher. In order to decrease cost, the system will appropriately decrease carbon emissions to achieve the purpose of reducing operation cost.
5.6 Shapley Value Allocation Results of PHIES Alliance Cost Allocation
In the cooperative game model, the Shapley value method is often adopted to allocate cost. The Shapley value method can reflect the fairness of the member cost allocation in the alliance. In order to make the apportionment results more realistic, the improved Shapley value for cost allocation is used in the paper.
The cost allocation coefficient is calculated by the waveform similarity between the new energy output curve and the PHIES alliance load curve, the power mutual aid between multi-PHIES, and the fluctuation of the new energy output. The results are demonstrated in Table 8.
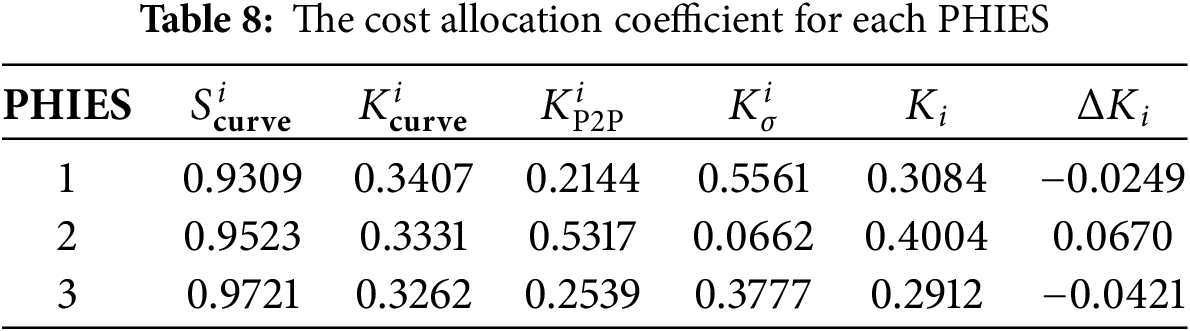
From the parameters
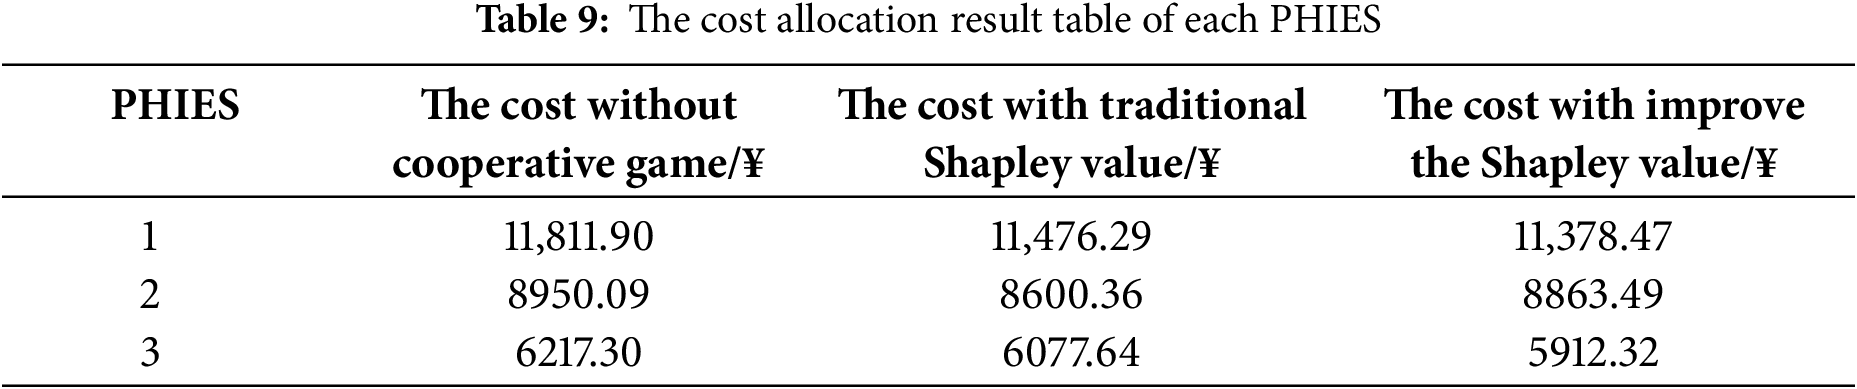
According to Table 9, the final allocation costs of PHIES 1, PHIES 2, and PHIES 3 are 11,378.47¥, 8863.49¥, and 5912.32¥, respectively, by using the improved Shapley value method. Compared with the traditional Shapley value allocation scheme and non-cooperative game allocation scheme, the costs of PHIES 1 and PHIES 3 by using the improved Shapley value method are reduced by 0.85%, 3.67%, and 2.72%, 4.91%, respectively. Compared with the traditional Shapley value, the final allocation cost of PHIES 2 based on the improved Shapley value allocation scheme PHIES 2 is increased by 3.06%. However, in comparison to the non-cooperative game allocation scheme, the final allocation cost of PHIES 2 based on the improved Shapley value allocation scheme is reduced by 0.97%. Combined with the data analysis in Table 8, PHIES 1 and PHIES 3 have a relatively significant contribution to the alliance. Therefore, when the cost is redistributed, the operation costs of PHIES 1 and PHIES 3 are further reduced. On the contrary, the cost of PHIES 2 is increased. In summary, the cost allocation scheme based on the improved Shapley value considers the waveform similarity between the new energy output curve and the PHIES alliance load curve, the power mutual aid between multi-PHIES, and the fluctuation of the new energy output. Each PHIES is ensured to reduce operation cost through cooperation, and the cost allocation result is made fairer. At the same time, each PHIES can be encouraged to actively join the alliance.
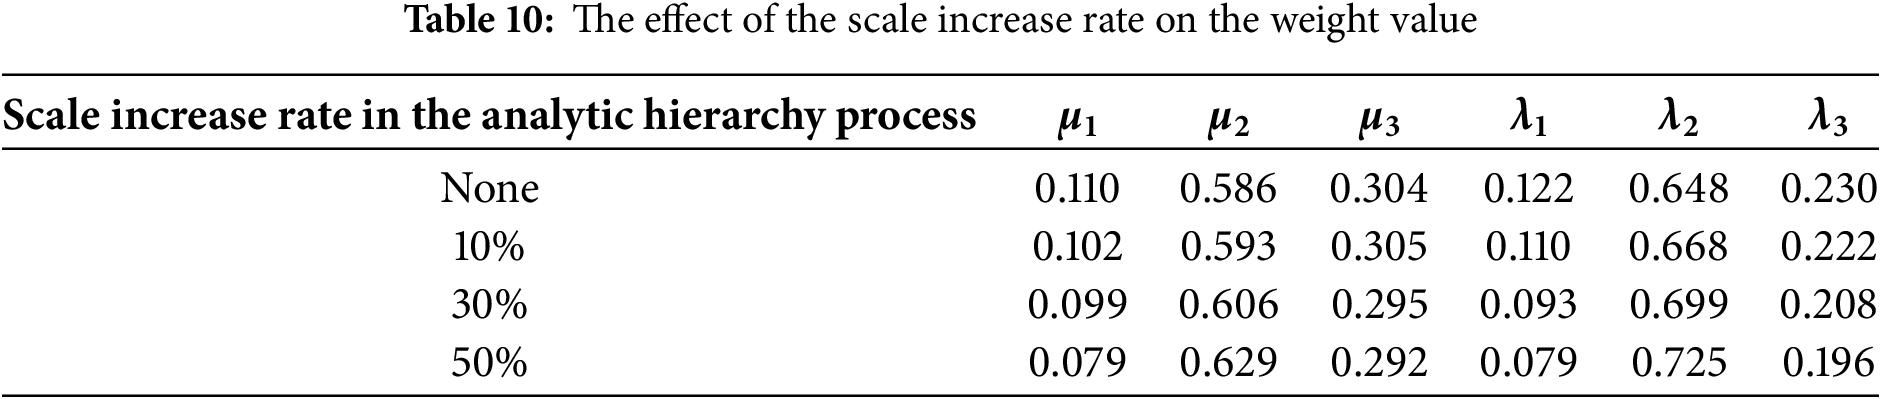
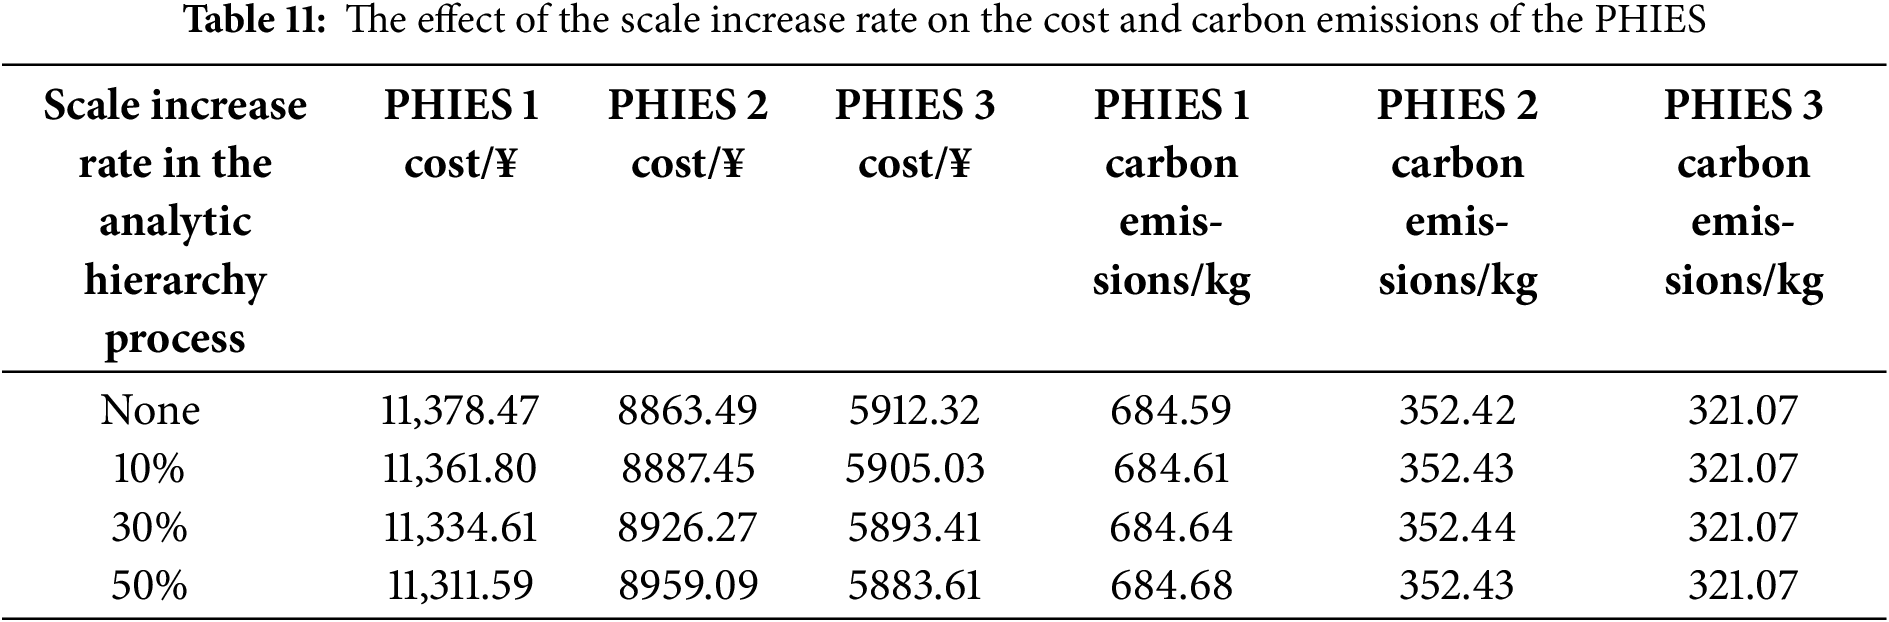
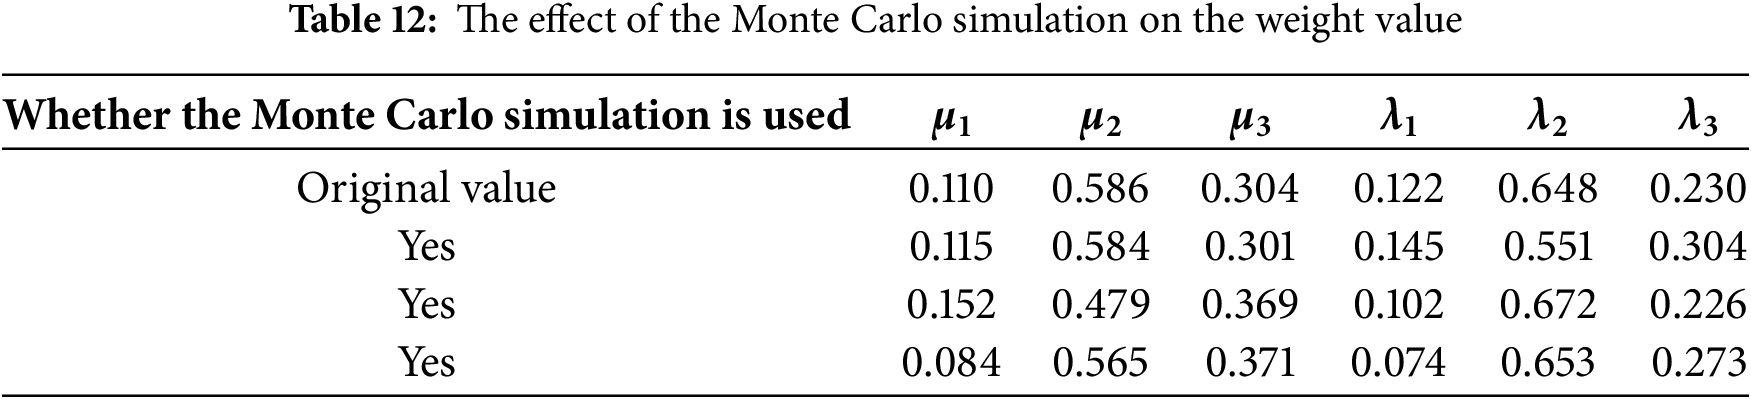
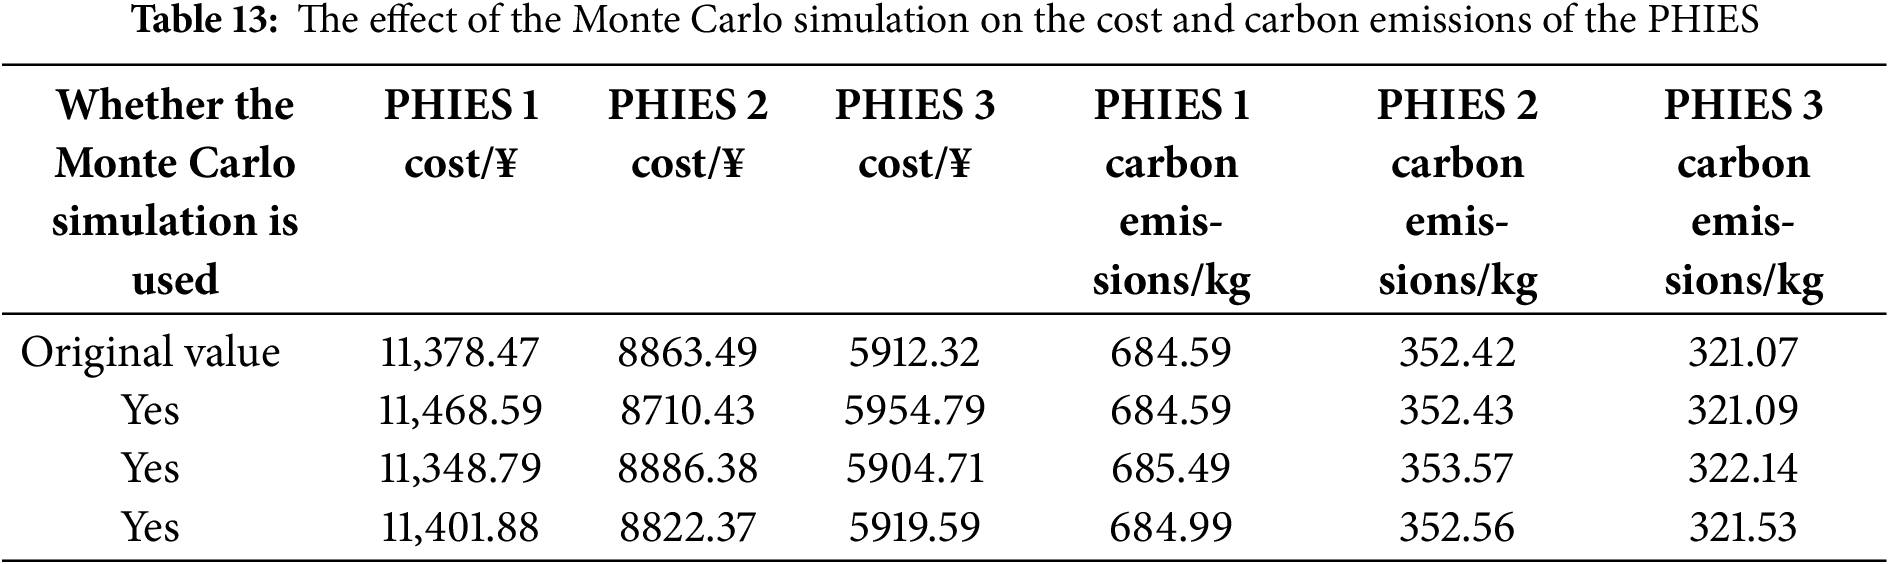
5.7 The Sensitivity Analysis for the Weight Values of the Carbon Trading Model and Cooperative Game Model
In order to further analyze the sensitivity of the weight values of the carbon trading model and cooperative game model, the sensitivity analysis for the above weight values are drawn in Tables 10–13 as follows. In Tables 10–11, the scale increase rate in the analytic hierarchy process is used for the sensitivity analysis of the weight values. In Tables 12 and 13, the Monte Carlo simulation is used for the sensitivity analysis of the weight values.
The coordinated operation of multi-PHIES connected to the ADN is studied in the paper. A low-carbon hybrid game synergistic operation strategy based on dynamic carbon baseline price for multi-PHIES accessing ADN is proposed. QIO and Gurobi are combined to solve the hybrid game optimal model. The low-carbon economic operation of the ADN with multi-PHIES is realized. Through example analysis, the conclusions are as follows:
(1) The master-slave game model of the ADN and PHIES alliance is constructed. The electricity price is formulated according to the operation goal of the ADN and the purchasing and selling electricity plan of each PHIES. Each PHIES is encouraged to actively take part in peak-chopping and valley-filling, and the operation efficiency of each PHIES is improved. The coordinated operation of the ADN and PHIES is guaranteed.
(2) For different source-load contradictions among multi-PHIES, the cooperative game is carried out among multi-PHIES. The traditional Shapley value allocation scheme does not consider the factors such as the power of mutual aid among various entities, which is not conducive to the cost sharing among various entities. The improved Shapley value allocation scheme considers complex factors such as the power of mutual aid among various entities. When the total cost of the PHIES alliance is allocated, in comparison to the non-cooperative game, the cost of PHIES 1 is reduced by 3.67%, the cost of PHIES 2 is reduced by 0.97%, and the cost of PHIES 3 is reduced by 4.91% respectively. This allocation method not only ensures that each subject can obtain benefits in cooperation but also ensures that the cost allocation of each subject is more reasonable.
(3) By setting carbon emissions as a dynamic adjustment factor of carbon baseline price, a pricing mechanism of carbon baseline price increasing with carbon emissions is constructed. An improved stepped carbon trading based on dynamic carbon baseline price is proposed. The total carbon emissions of PHIES alliance are reduced by 7.08%. The above result indicates that setting a dynamic carbon baseline price can promote the system to reduce carbon emissions.
(4) Adding hydrogen to natural gas as fuel for HGT and other equipment, the total carbon emissions of the system are reduced by 8.05%. The above result shows that adding a small amount of hydrogen to natural gas can decrease carbon emissions.
The active power coordinated operation of the PHIES accessing to the ADN is mainly studied. The reactive power optimization of the ADN is considered insufficiently. The active-reactive power coordinated optimization operation of the PHIES accessing to the ADN is the next research direction.
Acknowledgement: The authors acknowledge the reviewers for providing valuable comments and helpful suggestions to improve the manuscript.
Funding Statement: This work was supported by the Central Government Guides the Local Science and Technology Development Fund Project (2023ZY0020), Key R&D and Achievement Transformation Project in Inner Mongolia Autonomous Region (2022YFHH0019), the Fundamental Research Funds for Inner Mongolia University of Science and Technology (2022053), Natural Science Foundation of Inner Mongolia Autonomous Region (2022LHQN05002), National Natural Science Foundation of China (52067018), Natural Science Foundation of Inner Mongolia Autonomous Region of China (2025MS05052), Control Science and Engineering Quality Improvement and Cultivation Discipline Project in Inner Mongolia University of Science and Technology.
Author Contributions: The authors confirm their contribution to the paper as follows: study conception and design: Xin Zhang; data collection: Jihong Zhang, Zilei Zhang; analysis and interpretation of results: Peihong Yang, Lina Chen, Xiaoming Zhang; draft manuscript preparation: Shixing Zhang. All authors reviewed the results and approved the final version of the manuscript.
Availability of Data and Materials: Data supporting this study are included within the article.
Ethics Approval: Not applicable.
Conflicts of Interest: The authors declare no conflicts of interest to report regarding the present study.
Nomenclature
| Indices | |
| t | Index of scheduling time |
| Parameters | |
| The purchasing electricity price of ADN from the upper-level power grid | |
| The purchasing power of ADN from the upper-level power grid | |
| Charging and discharging power of the battery | |
| The generation/thermal power of the HGT | |
| The thermal power of the HGB | |
| The thermal power of the EB | |
| The maximum transmission Power of ADN and PHIES | |
| The limit of the power generation of the HGT | |
| The consumed electric power of the EL | |
| The gas power converted by MR | |
| The hydrogen power input from EL to MR | |
| The quality of CO2 processing by CCS | |
| The carbon emission generated by the electricity purchasing power from ADN | |
| The hydrogen blending ratio of the HGT | |
| State of the battery | |
| The quantity of carbon dioxide consumed by CCS | |
| The dynamic carbon baseline price | |
| The carbon quota needed to purchase | |
| The carbon trading cost | |
| The consumed electric power of the EB | |
| The carbon emission quota | |
| The actual carbon emission | |
| The traditional carbon baseline price | |
| The minimum/maximum purchasing electricity price | |
| The generation/thermal efficiency of the HGT | |
| The control coefficients | |
| The calorific value of natural gas/hydrogen | |
| The charging and discharging efficiency of the battery | |
| The quality of CO2 produced by natural gas | |
| The maximum transmission power between the ADN and the upper-level power grid | |
| The thermal efficiency of the HGB | |
| The thermal conversion efficiency of EB | |
| The conversion rate of MR | |
| The electricity-hydrogen conversion efficiency of the EL | |
| The power consumed to process unit mass of CO2 | |
| The power consumed by CCS | |
| The hydrogen power output of the EL | |
| Abbreviation | |
| IES | Integrated energy system |
| PHIES | Park hydrogen-doped integrated energy system |
| AND | Active distribution network |
| HGT | Hydrogen-doped gas turbine |
| HGB | Hydrogen-doped gas boiler |
| P2G-CCS | Power to gas and carbon capture system |
| QIO | Quadratic interpolation optimization |
| EB | Electric boiler |
| EL | Electrolytic cell |
| MR | Methane reactor |
References
1. Huo ZH, Xu C. Distributed collaborative event-triggering mechanism based optimal power regulator design for multiarea integrated energy systems with communication constraints. Renew Sustain Energy Rev. 2025;217:115770–90. doi:10.1016/j.rser.2025.115770. [Google Scholar] [CrossRef]
2. Bendriss B, Sayah S, Hamouda A. A novel improved Frilled Lizard algorithm for solving the optimal planning problem of renewable energy sources within distribution grids under uncertainties. Energy Convers Manag. 2025;326(17):119465–84. doi:10.1016/j.enconman.2024.119465. [Google Scholar] [CrossRef]
3. Prasad M, Rather ZH, Razzaghi R, Doolla S. A new approach to determine feasible operating region of unbalanced distribution networks with distributed photovoltaics. IEEE T Power Deliver. 2025;40(3):1493–504. doi:10.1109/TPWRD.2025.3555210. [Google Scholar] [CrossRef]
4. Jia JD, Li HQ, Wu D, Guo JC, Jiang LL, Fan ZM. Multi-objective optimization study of regional integrated energy systems coupled with renewable energy, energy storage, and inter-station energy sharing. Renew Energy. 2024;225:120328–45. doi:10.1016/j.renene.2024.120328. [Google Scholar] [CrossRef]
5. Zhang BW, Talihati B, Fan HT, Sun YJ, Wang Y. A dynamic carbon flow traceability framework for integrated energy systems. J Clean Prod. 2025;518(4):145878–93. doi:10.1016/j.jclepro.2025.145878. [Google Scholar] [CrossRef]
6. Yang J, Zeng LJ, He KJ, Guo YG, Zhang ZH, Chen K. Optimization of the joint operation of an electricity-heat–hydrogen-gas multi-energy system containing hybrid energy storage and power-to-gas-combined heat and power. Energies. 2024;17(13):3144–62. doi:10.3390/en17133144. [Google Scholar] [CrossRef]
7. Su BH, Wang RQ, Wang M, Wang M, Zhao QC, Lv YS, et al. Low-carbon economic dispatch of integrated energy systems in industrial parks considering comprehensive demand response and multi-hydrogen supply. Appl Sci. 2024;14(6):2381–99. doi:10.3390/app14062381. [Google Scholar] [CrossRef]
8. Yang C, Dong XF, Wang G, Lv DR, Gu R, Lei YQ. Low-carbon economic dispatch of integrated energy system with CCS-P2G-CHP. Energy Rep. 2024;12:42–51. doi:10.1016/j.egyr.2024.05.055. [Google Scholar] [CrossRef]
9. Cui YX, Liu XP, Chen MM. Experimental study of natural gas mixed with hydrogen under full pressure of F-class heavy duty gas turbine burner. Gas Turbine Technol. 2021;34(2):38–42. (In Chinese). doi:10.16120/j.cnki.issn1009-2889.2021.02.006. [Google Scholar] [CrossRef]
10. Tamang S, Park H. Numerical investigation of combustion characteristics for hydrogen mixed fuel in a can type model of the gas turbine combustor. Int J Hydrogen Energy. 2023;48(30):11493–512. doi:10.1016/j.ijhydene.2022.05.273. [Google Scholar] [CrossRef]
11. Noorfatima N, Choi Y, Jung J. Two-stage peer-to-peer energy trading with combined uniform and discriminatory pricing mechanism. Renew Energy. 2025;247(3):123014–26. doi:10.1016/j.renene.2025.123014. [Google Scholar] [CrossRef]
12. Khanlarzade N, Farughi H. Modeling the Stackelberg game with a boundedly rational follower in deterioration supply chain-based interaction with the leader’s hybrid pricing strategy. Expert Syst Appl. 2024;237(A):121302–18. doi:10.1016/j.eswa.2023.121302. [Google Scholar] [CrossRef]
13. Huang YJ, Wang YD, Liu N. A two-stage energy management for heat-electricity integrated energy system considering dynamic pricing of Stackelberg game and operation strategy optimization. Energy. 2022;244(A):122576–95. doi:10.1016/j.energy.2021.122576. [Google Scholar] [CrossRef]
14. Wang ZK, Wang CX, Wu WD, Sun C, Wu ZT. A blockchain-based game approach to multi-microgrid energy dispatch. Comput Model Eng Sci. 2024;138(1):845–63. doi:10.32604/cmes.2023.029442. [Google Scholar] [CrossRef]
15. Ma TF, Pei W, Deng W, Xiao H, Tang CH, Yang YH. A Nash bargaining-based cooperative planning and operation method for wind-hydrogen-heat multi-agent energy system. Energy. 2021;131(4):122435–59. doi:10.1016/j.energy.2021.122435. [Google Scholar] [CrossRef]
16. Chen Y, He S, Wang WQ, Yuan Z, Cheng J, Cheng ZJ, et al. Optimization strategy for shared energy storage operators-multiple microgrids with hybrid game-theoretic energy trading. Processes. 2024;12(1):218–43. doi:10.3390/pr12010218. [Google Scholar] [CrossRef]
17. Li ZK, Yao YC, Zhao N, Shan J, Fu Y. Study on integrated energy microgrid energy purchase strategy with demand-side response in market environment. Energy. 2024;302(6):131724–40. doi:10.1016/j.energy.2024.131724. [Google Scholar] [CrossRef]
18. Xue SZ, Wang YC, Liu Y, Wang ZS, Wang YD, Yang DS. Bi-level optimization and Stackelberg game in multi-integrated energy systems. J Energy Storage. 2025;11:115356–75. doi:10.1016/j.est.2025.115356. [Google Scholar] [CrossRef]
19. Ma L, Xie LR, Ye JH, Bian YF. Two-stage dispatching strategy for park-level integrated energy systems based on a master-slave-cooperative hybrid game model. Renew Energy. 2024;232(4):120971–87. doi:10.1016/j.renene.2024.120971. [Google Scholar] [CrossRef]
20. Lyu X, Liu TQ, Liu X, He C, Nan L, Zeng H. Low-carbon robust economic dispatch of park-level integrated energy system considering price-based demand response and vehicle-to-grid. Energy. 2022;263(3):125739–54. doi:10.1016/j.energy.2022.125739. [Google Scholar] [CrossRef]
21. Wei F, Jing ZX, Wu PZ, Wu QH. A Stackelberg game approach for multiple energies trading in integrated energy systems. Appl Energ. 2017;200(1):315–29. doi:10.1016/j.apenergy.2017.05.001. [Google Scholar] [CrossRef]
22. Ma GZ, Pang N, Wang YJ, Hu SY, Xu XB, Zhang ZY, et al. Two-stage optimal scheduling strategy of microgrid distribution network considering multi-source agricultural load aggregation. Energies. 2024;17(21):5429–44. doi:10.3390/en17215429. [Google Scholar] [CrossRef]
23. Liu XO. Bi-layer game method for scheduling of virtual power plant with multiple regional integrated energy systems. Int J Electr Power Energy Syst. 2023;149(8):109063–77. doi:10.1016/j.ijepes.2023.109063. [Google Scholar] [CrossRef]
24. Cai WQ, Kordabad AB, Gros S. Energy management in residential microgrid using model predictive control-based reinforcement learning and Shapley value. Eng Appl Artif Intell. 2023;119(11):105793–805. doi:10.1016/j.engappai.2022.105793. [Google Scholar] [CrossRef]
25. Jia YC, Wen P, Yan YS, Huo LM. Joint operation and transaction mode of rural muti microgrid and distribution network. IEEE Acess. 2021;9:14409–21. doi:10.1109/ACCESS.2021.3050793. [Google Scholar] [CrossRef]
26. Karimi H, Jadid S. A strategy-based coalition formation model for hybrid wind/PV/FC/MT/DG/battery multi-microgrid systems considering demand response programs. Int J Electr Power Energy Syst. 2022;136(4):107642–53. doi:10.1016/j.ijepes.2021.107642. [Google Scholar] [CrossRef]
27. Pan J, Liu XO, Huang JJ. Multi-level games optimal scheduling strategy of multiple virtual power plants considering carbon emission flow and carbon trade. Electr Power Syst Res. 2023;223(17):109669–85. doi:10.1016/j.epsr.2023.109669. [Google Scholar] [CrossRef]
28. Yan QY, Ai XB, Li JM. Low-carbon economic dispatch based on a CCPP-P2G virtual power plant considering carbon trading and green certificates. Sustainability. 2021;13(22):12423–41. doi:10.3390/su132212423. [Google Scholar] [CrossRef]
29. Wang Z, Mu XC, Ma YH, Liao PZ, Ji YL, Han FH. Advanced energy management and optimal scheduling for integrated offshore gas-hydrogen-electricity-heat systems. Energy. 2025;319:135091–105. doi:10.1016/j.energy.2025.13591. [Google Scholar] [CrossRef]
30. Jiang XP, Bao ZJ, Chen JW, Yu M. Multi-objective and multi-stage low-carbon planning of park integrated energy system considering random outages from superior power grid. IET Gener Transm Distrib. 2024;18(22):3592–607. doi:10.1049/gtd2.13303. [Google Scholar] [CrossRef]
31. Li MW, Qin JR, Han ZY, Niu QF. Low-carbon economic optimization method for integrated energy systems based on life cycle assessment and carbon capture utilization technoligies. Energy Sci Eng. 2023;11(11):4238–55. doi:10.1002/ese3.1578. [Google Scholar] [CrossRef]
32. Chen XL, Cao XM, Huang QF, Huang H. Optimized operation of park integrated energy system with source-load flexible response based on comprehensive evluation index. Energy Eng. 2024;121(11):3437–60. doi:10.32604/ee.2024.053464. [Google Scholar] [CrossRef]
33. Zhao SQ, Song JL, Wang AE, Liao YM, Li ZW. Design of electricity spot market trading mechanism considering high proportion of new energy consumption and peak load adjustment compensation of thermal power units. Acta Energiae Solaris Sin. 2024;45(8):164–73. (In Chinese). doi:10.19912/j.0254-0096.tynxb.2023-0585. [Google Scholar] [CrossRef]
34. Tian X, Chen LJ, Li XZ, Yuan WK. Optimal scheduling for energy storage sharing among communities with photovoltaic resource based on Stackelberg game and improved Shapley value. Power Syst Technol. 2023;47(6):2252–61. (In Chinese). doi:10.13335/j.1000-3673.pst.2022.1814. [Google Scholar] [CrossRef]
35. Rozga P, Kraslawski A, Klarecki A, Romanowski A, Krysiak W. A new approach for decision support of the selection of construction technology of high-voltage substations based on AHP method. IEEE Access. 2021;9:73413–23. doi:10.1109/ACCESS.2021.3080090. [Google Scholar] [CrossRef]
36. Chen DY, Liu F, Liu S. Optimization of virtual power plant scheduling coupling with P2G-CCS and doped with gas hydrogen based on stepped carbon trading. Power Syst Technol. 2022;46(6):2042–54. (In Chinese). doi:10.13335/j.1000-3673.pst.2021.2177. [Google Scholar] [CrossRef]
37. Taghavi A, Niknam T, Gitizadeh M, Rodriguez J, Sheikh M. A resilience-oriented approach to integrated energy management systems: addressing energy conversion unit unavailability and cost efficiency. Energy Convers Manag. 2025;325(2):119291–308. doi:10.1016/j.enconman.2024.119291. [Google Scholar] [CrossRef]
38. Sun WJ, Wu JH, Zhang Q. Coordinated optimization of a distribution network and multi-integrated energy microgrid based on a double-layer game. Power Syst Prot Control. 2024;52(2):26–38. (In Chinese). doi:10.19783/j.cnki.pspc.230860. [Google Scholar] [CrossRef]
39. Peng Y, Lou SH, Wu YW, Wang Y, Zhou KP. Low-carbon economic dispatch of power system with wind power considering solvent-storaged carbon capture power plant. Trans China Electr Soc. 2021;36(21):4508–16. (In Chinese). doi:10.3389/fenrg.2022.953883. [Google Scholar] [CrossRef]
40. Zhao WG, Wang LY, Zhang ZX, Mirjalili S, Khodadadi N, Ge Q. Quadratic Interpolation Optimization (QIOa new optimization algorithm based on generalized quadratic interpolation and its applications to real-world engineering problems. Comput Methods Appl Mech Eng. 2023;417(A):116446–507. doi:10.1016/j.cma.2023.116446. [Google Scholar] [CrossRef]
41. Yan N, Ma GC, Li XJ, Li Y, Ma SH. Low-carbon economic dispatch of park integrated energy system based on seasonal carbon trading mechanism. Proc CSEE. 2024;44(3):918–32. (In Chinese). doi:10.1109/ptc.2019.8810482. [Google Scholar] [CrossRef]
42. Zhou W, Sun YH, Xie DL, Wang JX, Cui GY, He Y. Low-carbon economic dispatch of park-level integrated energy system considering exergy efficiency and flexible double response of supply and demand. Control Theory Appl. 2024;41(9):1653–63. (In Chinese). doi:10.1109/icpsasia58343.2023.10294828. [Google Scholar] [CrossRef]
43. Li YF, Wang WQ, Kou Y, Zhu SL. Considering green certificate-carbon joint trading and demand response integrated energy system economic operation. Acta Energiae Solaris Sin. 2023;44(11):538–46. (In Chinese). doi:10.19912/j.0254-0096.tynxb.2022-1153. [Google Scholar] [CrossRef]
Cite This Article
 Copyright © 2025 The Author(s). Published by Tech Science Press.
This work is licensed under a Creative Commons Attribution 4.0 International License , which permits unrestricted use, distribution, and reproduction in any medium, provided the original work is properly cited.
 Downloads
 Citation Tools