
 Submit a Paper
 Propose a Special lssue
 Open Access
ARTICLE

Bi-Level Collaborative Optimization of Electricity-Carbon Integrated Demand Response for Energy-Intensive Industries under Source-Load Interaction
1 Dali Power Supply Bureau, Yunnan Power Grid Co., Ltd., Dali, 671000, China
2 Center of Power Grid Planning and Constructing, Yunnan Power Grid Co., Ltd., Kunming, 650011, China
3 School of Electric Power, South China University of Technology, Guangzhou, 510641, China
* Corresponding Author: Zhaobin Du. Email:
(This article belongs to the Special Issue: Integration of Renewable Energies with the Grid: An Integrated Study of Solar, Wind, Storage, Electric Vehicles, PV and Wind Materials and AI-Driven Technologies)
Energy Engineering 2025, 122(9), 3867-3890. https://doi.org/10.32604/ee.2025.068062
Received 20 May 2025; Accepted 15 July 2025; Issue published 26 August 2025
 View Full Text
 Download PDF
Abstract
Traditional demand response (DR) programs for energy-intensive industries (EIIs) primarily rely on electricity price signals and often overlook carbon emission factors, limiting their effectiveness in supporting low-carbon transitions. To address this challenge, this paper proposes an electricity–carbon integrated DR strategy based on a bi-level collaborative optimization framework that coordinates the interaction between the grid and EIIs. At the upper level, the grid operator minimizes generation and curtailment costs by optimizing unit commitment while determining real-time electricity prices and dynamic carbon emission factors. At the lower level, EIIs respond to these dual signals by minimizing their combined electricity and carbon trading costs, considering their participation in medium- and long-term electricity markets, day-ahead spot markets, and carbon emissions trading schemes. The model accounts for direct and indirect carbon emissions, distributed photovoltaic (PV) generation, and battery energy storage systems. This interaction is structured as a Stackelberg game, where the grid acts as the leader and EIIs as followers, enabling dynamic feedback between pricing signals and load response. Simulation studies on an improved IEEE 30-bus system, with a cement plant as a representative user form EIIs, show that the proposed strategy reduces user-side carbon emissions by 7.95% and grid-side generation cost by 4.66%, though the user’s energy cost increases by 7.80% due to carbon trading. The results confirm that the joint guidance of electricity and carbon prices effectively reshapes user load profiles, encourages peak shaving, and improves PV utilization. This coordinated approach not only achieves emission reduction and cost efficiency but also offers a theoretical and practical foundation for integrating carbon pricing into demand-side energy management in future low-carbon power systems.Keywords
With the relocation of energy-intensive industries (EIIs), such as those in the electrolytic aluminum, polycrystalline silicon, and cement sectors, and the increasing proportion of renewable energy power generation with strong uncertainty and poor dispatchability, the power system in western China is facing the challenge of insufficient flexible regulation ability. Hydrogen-based flexibility technologies, such as solid oxide fuel cells and liquid organic hydrogen carriers, offer promising pathways for decarbonizing energy-intensive industries by co-supplying electricity and industrial heat [1–3]. While recent studies highlight their emission reduction potential and energy autonomy, practical deployment remains limited due to system costs, design complexity, and integration challenges. Demand response (DR), serving as virtual energy storage, has thus become vital for enhancing grid flexibility and regulation capabilities. Specifically, guiding the active regulation of the loads of EIIs not only improves the flexibility of the system, effectively alleviates the pressure on the power grid, but also enhances the stability and economy of the system operation. Nevertheless, conventional DR schemes in China primarily depend on electricity price signals to guide the users’ electricity consumption behavior to achieve the goal of peak load shifting and balance the power supply and demand [4]. It lacks carbon-aware incentives and does not leverage the critical role of user-side electricity consumption behavior in system carbon reduction [5]. Hence, it is essential to study the electricity-carbon integrated DR strategy of EIIs, guide users to optimize their electricity consumption behavior, and realize the coordination of economic interests and low-carbon objectives.
Incorporating carbon price signals into DR to achieve electricity-carbon coordination represents both an objective and an approach for facilitating the low-carbon transition of power systems. The development of carbon markets and the formation of carbon signals constitute an essential component of this process.
1.2.1 Carbon Trading and Its Impact on Electricity Systems
Carbon trading mechanisms such as the European Union Emissions Trading System (EU ETS) [6] and the California Cap-and-Trade Program [7] are pivotal tools for steering energy systems toward dual-carbon goals. These mechanisms influence electricity systems both directly, by affecting power generation dispatch decisions, and indirectly, by altering price signals that guide energy consumption behaviors. In mature markets like the EU ETS, the increasing share of auction-based carbon allowance allocation has enhanced the responsiveness of high-emission sectors to carbon price fluctuations [8]. While China’s carbon market remains in an early developmental stage, it currently covers only the power generation sector. This limited coverage and the relative uniformity of market participants reduce the effectiveness of carbon pricing in encouraging emission reductions across other EIIs [9]. As carbon markets evolve, their interaction with electricity trading mechanisms becomes increasingly important for integrated electricity–carbon scheduling and user-side cost responses.
1.2.2 Demand Response under Electricity-Carbon Integrated Signals
Traditional demand response (DR) mechanisms have largely focused on electricity prices, incentivizing users to shift or reduce loads based on time-of-use or real-time tariff structures [10–13]. In recent years, scholars have increasingly attached importance to the key role of the load side in the low-carbon process of the power system and have attempted to incorporate the carbon emission signal into the DR framework. Reference [14] incorporates the CO2 intensity signal into demand response programs, providing electricity consumers with additional environmental incentives to shift or reduce loads during peak periods. Reference [15] proposes a carbon-reduction-oriented demand response approach based on the generalized nodal carbon flow theory, in which a matrix-based method is employed to solve the carbon flow and derive the corresponding guidance signals. Furthermore, the demand response driven by both electrical signals and carbon signals has been proposed and used to optimize the energy consumption mode of EIIs [16]. In this context of electricity-carbon integration, the carbon emission factor plays a significant role as a signal in carbon accounting. However, in China, its limited temporal and spatial resolution poses a challenge. Specifically, carbon emission factors are typically updated on an annual basis and calculated at the provincial level, which restricts the potential for carbon reduction in electricity-carbon coupled demand response programs [17].
1.2.3 Optimization Models for Electricity–Carbon Integrated Systems
To capture the complex interaction between electricity markets, carbon trading markets, and user-side behavior, diverse optimization frameworks have been proposed, such as two-stage multi-objective distributionally robust optimization [18], Single-layer multi-objective optimization [19], multi-objective bi-level optimization [20], and Stackelberg game models [21]. Among these, bi-level optimization and Stackelberg game models prove particularly adept at modeling hierarchical decision structures, such as grid operators acting as leaders and industrial users as followers. These models allow for coordinated decision-making while accounting for conflicting objectives, such as cost minimization and emission reduction. In the context of electricity-carbon integration, these methods provide a framework for computational calculations between economic benefits and benefits from carbon reduction, and between multiple interests.
1.3 Research Gaps and Contributions
At present, the calculation method of electric carbon emission factor used in China’s power industry has obvious limitations. it merely represents the annual average of regional carbon emissions, and the time resolution is insufficient, which fails to effectively support the low-carbon operation optimization requirements of the power system. In addition, this calculation method cannot enable users to intuitively perceive the impact of electricity consumption behavior on carbon emissions in different time periods, resulting in limited motivation to achieve carbon reduction goals through adjusting electricity consumption patterns.
Therefore, this paper proposes an electricity-carbon integrated DR strategy for EIIs. The main contributions of this paper are as follows:
(1) A dynamic carbon emission factor is introduced and set to be updated hourly to address the issue of coarse temporal resolution;
(2) A user-side response model in demand response based on dynamic carbon emission factor and dynamic electricity price is developed that incorporates electricity and carbon emission costs;
(3) A collaborative electricity–carbon integrated demand response strategy is proposed, formulated as a bi-level Stackelberg game optimization model. The strategy optimizes production and energy usage planning for EIIs, achieving coordinated improvements in both economic performance and carbon reduction.
Through the analysis of an improved IEEE 30-node system incorporating a representative cement production load and comparison with existing methods, the proposed approach demonstrates a favorable trade-off between economic efficiency and carbon emission reduction, and provides a novel pathway for source–load collaborative low-carbon optimization.
The remainder of this paper is structured as follows. The next section introduces the methodology for acquiring real-time electricity–carbon signals. This is followed by the development of a user-side integrated demand response model. Subsequently, a bi-level optimization framework is established for the low-carbon scheduling of energy-intensive users. A case study is then presented to validate the proposed strategy, and finally, conclusions and future research directions are discussed.
2 Electricity-Carbon Signal Calculation Methodology
2.1 Grid Dynamic Carbon Emission Factor
The carbon emissions corresponding to unit power consumption are typically characterized by the carbon emission factor. To accurately reflect the time-varying carbon intensity of electricity, this paper introduces a dynamic carbon emission factor. Unlike conventional average emission factor, which is based on annual statistics and provides coarse resolution, the dynamic factor captures real-time variations in the power generation mix. It enables the system to allocate carbon emission responsibility more precisely to electricity consumers and enhances the effectiveness of carbon-aware demand response. The formulation is based on the instantaneous output and carbon characteristics of various generation units-thermal units, renewable sources, grid-side storage, and external tie-lines-as detailed below:
where:
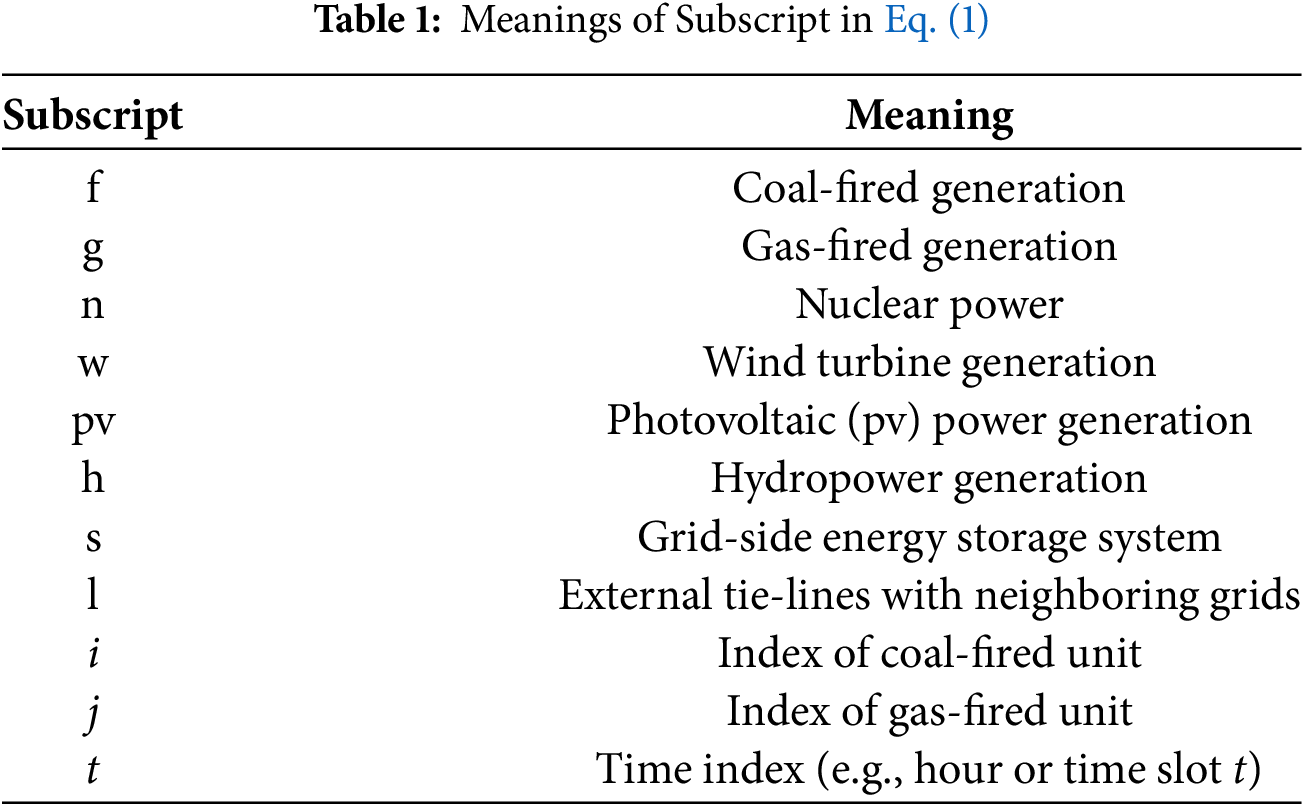
Unlike the conventional average carbon emission factor, which lacks temporal granularity, the proposed dynamic factor is derived from hourly real-time data on generation output and carbon intensity of various power sources. This time-sensitive signal can be transmitted to end-users to guide electricity consumption behavior and support collaborative emission reduction.
The development of a dispatch scheme for generating units needs to take into account both economic and policy considerations. System operation should prioritize the consumption of renewable energy generation and strictly control the wind and solar power curtailment rate. Therefore, the generation-side output plan should incorporate the cost of wind and solar power curtailment of the renewable energy grid connection. For conventional thermal units, the primary cost arises from fuel consumption. Based on this, the comprehensive cost model for the generation side is defined as follows:
where:
Additionally, the generation side must satisfy constraints such as power balance and unit operational limits. Further, system network topology constraints and tidal flow constraints are introduced and solved to obtain the optimized unit output scheme. Based on this, assuming negligible network losses and congestion, the system’s marginal electricity cost can be further derived, and the specific calculation process is as follows:
where:
Real-time electricity prices depend on hourly supply-demand conditions, especially the adequacy and cost of power generation, the adequacy and loss of transmission and distribution network, and the load [22]. This paper appropriately simplifies the more complex clearing mechanism of the electricity spot market by defining the system’s real-time dynamic tariff as the sum of the system marginal tariff cost and the grid operator’s transmission access charges for the current time period. The system real-time dynamic tariff
where:
To simplify the analytical derivation of electricity prices, this model assumes negligible network losses and congestion. Although this assumption improves tractability, it may slightly underestimate marginal electricity prices under real grid conditions. In practical implementations, such simplifications can be corrected using post-optimization power flow calculations.
3 Modeling of Integrated Electricity-Carbon DR on the User Side
Integrated DR is a demand-side management method where the grid provides users with dynamic tariffs and carbon emission factors for different periods. Users adjust their electricity consumption based on both electricity and carbon costs. Traditional DR mainly relies on peak-valley tariff differences, with little user awareness of carbon emissions. Under integrated DR, customers prioritize load shifting to periods with lower tariffs and carbon factors, balancing economic and carbon reduction goals. As shown in Fig. 1, user-side carbon cost regulation includes participation in the carbon quota market and China’s Certified Voluntary Emission Reductions, guiding customers to reduce emissions proactively.
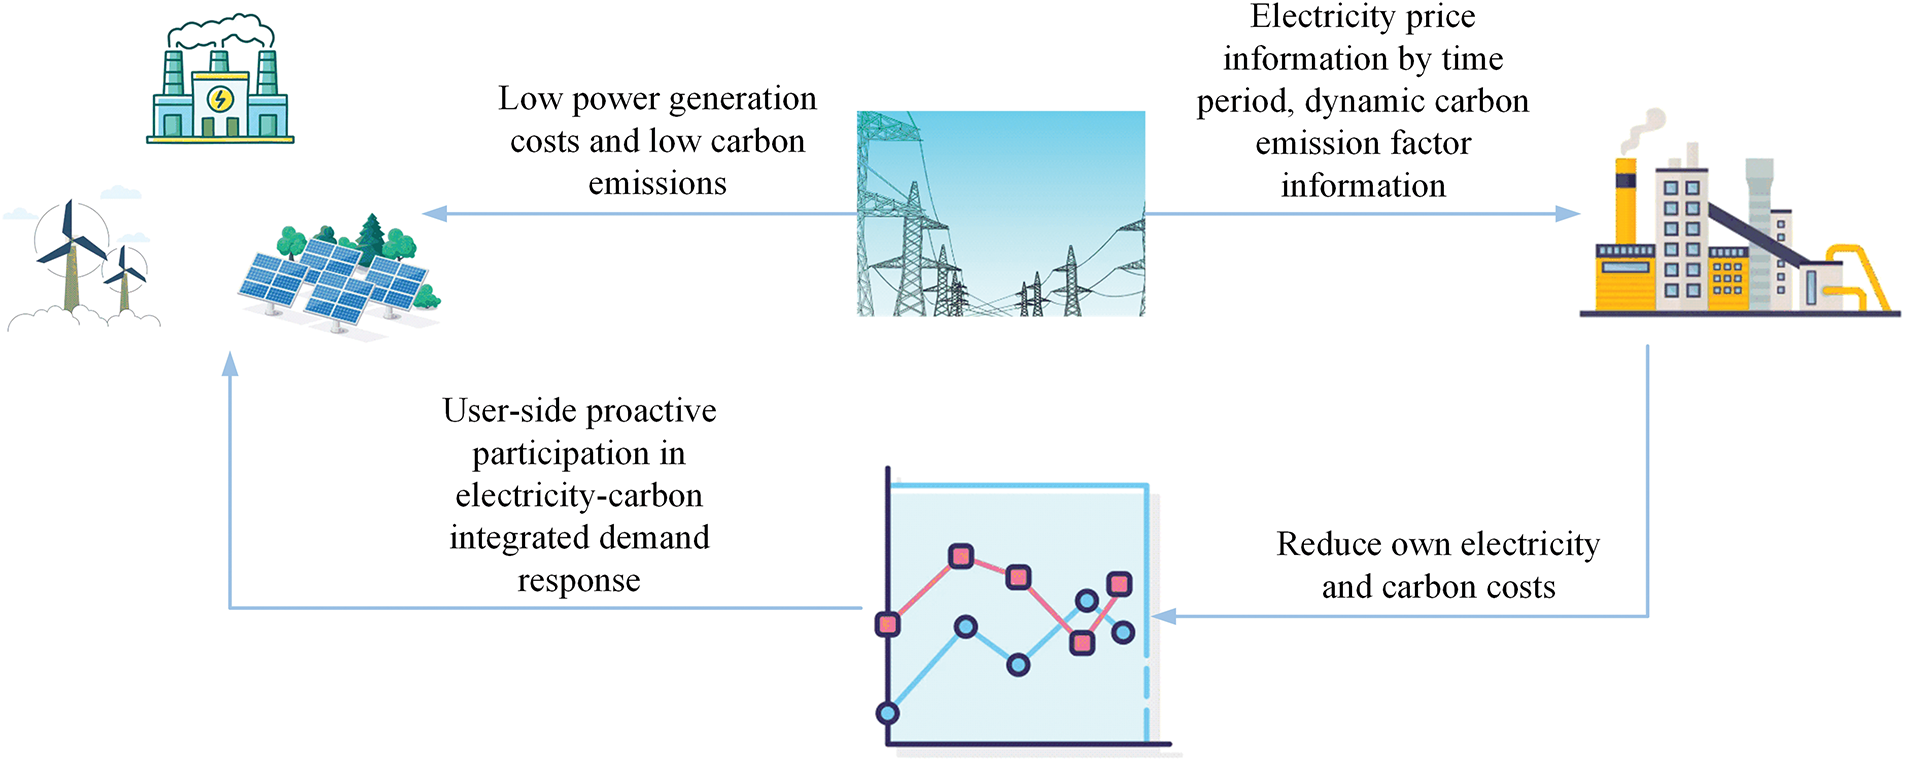
Figure 1: Schematic diagram of electricity-carbon integrated DR
In actual production, EIIs are more sensitive to the predictability of electricity costs. Meanwhile, the frequency of intraday real-time spot market tariff updates is too frequent for EIIs to have such a fast response. Additionally, the relevant policies show that EIIs are about to be included in the carbon emissions trading market. Based on the above characteristics, this paper makes the following assumptions about the participation of EIIs in the integrated electricity-carbon DR process as shown in Fig. 2:
1) EIIs participate in medium- and long-term electricity trading;
2) EIIs participate in the day-ahead electricity spot market but not in the intraday real-time spot market;
3) Carbon quotas are allocated evenly across each day, necessitating daily trading of carbon emission rights.
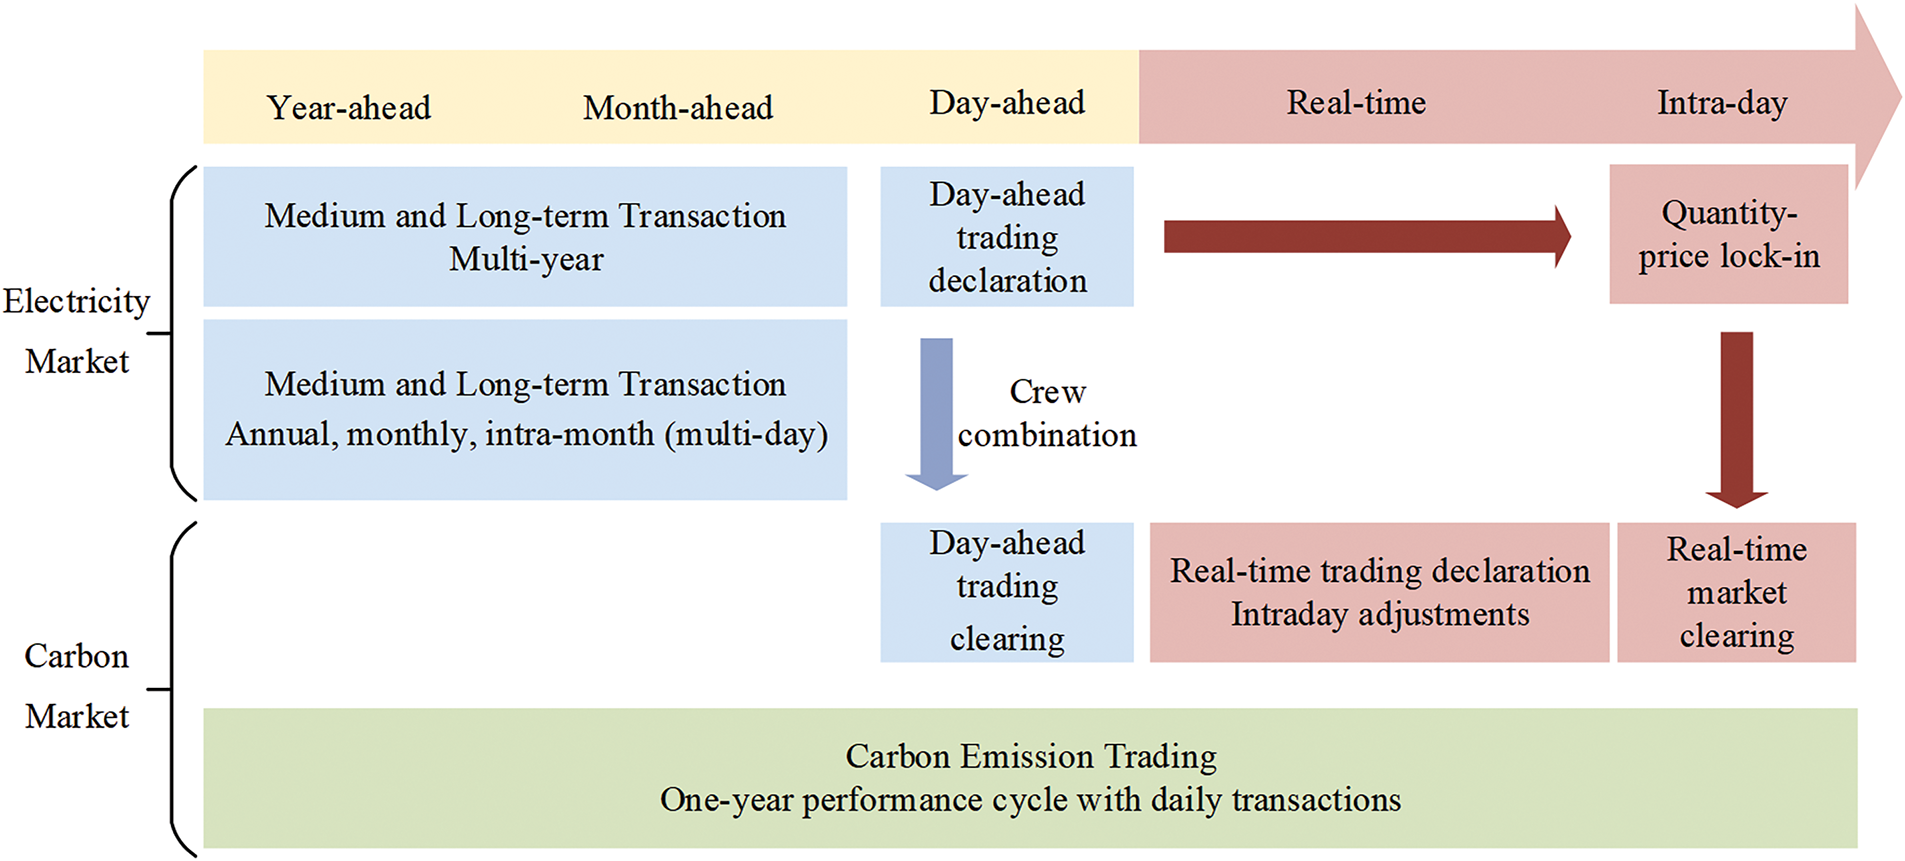
Figure 2: Participation of EIIs in the electricity-carbon market process
3.1 Modeling the Cost of Electricity to the User
Due to large electricity consumption and relatively fixed production processes, EIIs have stable electricity demands. Under the current integration of medium- and long-term electricity markets with spot markets, they prioritize the predictability of electricity costs. They tend to secure long-term contracts based on the stability of mid- and long-term market prices while utilizing the flexibility of the day-ahead spot market for optimization. Since the intraday real-time spot market requires rapid responses, which fundamentally conflicts with the continuous production processes of EIIs, they do not participate in the intraday spot market. Under this model, users can ensure reliable base load supply and optimize electricity plans in the day-ahead market stage. Therefore, their electricity costs mainly consist of settlements from medium- and long-term markets and day-ahead spot markets, as well as deviation penalties.
3.1.1 Medium- and Long-Term Market Energy Settlements
According to the “Guangdong Electricity Market Operation Rules” issued by the Chinese authorities, EIIs are eligible to participate in medium- and long-term electricity transactions directly or through electricity retailers. They sign contracts to determine the medium- and long-term transaction curves and key elements such as electricity quantities and time-of-use prices.
To mitigate electricity price volatility, EIIs are assumed to sign monthly contracts with electricity retailers, involving monthly settlements based on contracted and actual electricity consumption, as well as corresponding deviation penalties. The settlement formula for the medium- and long-term market is as follows:
where:
3.1.2 Settlement on the Spot Market a Few Days Ago
In the day-ahead electricity spot market, EIIs need to declare their electricity consumption curves for the next day, which are divided into 24 hourly periods. Based on this, the settlement cost formula for the day-ahead spot market is as follows:
where:
3.1.3 Deviation Assessment Costs
When there is a deviation between EIIs’ actual electricity consumption and the time-of-use electricity volume stipulated in the medium- and long-term contract, EIIs must bear the corresponding deviation assessment fee. The calculation formula is as follows:
where:
3.2 Modeling the Cost of User Carbon Emissions
Within the framework of carbon responsibility allocation, user-associated carbon emissions can be classified into two distinct categories: direct emissions, principally originating from stationary combustion processes in industrial kilns and chemical decomposition of raw materials, and indirect emissions, predominantly attributable to upstream embodied carbon intensities embedded within procured electricity supplies. As one of the first key industries (excluding power generation) included in China’s national carbon emissions trading market, the cement industry holds strong representativeness. This paper takes cement plants as the EIIs representative.
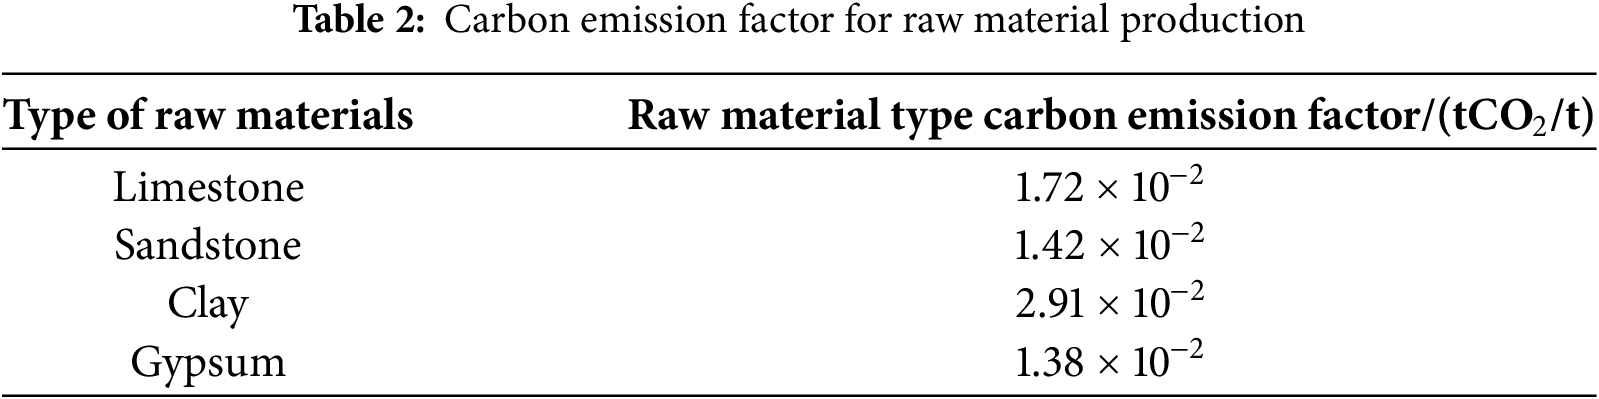
Comprehensive carbon emission factor accounting systems have been established for the mining activities of the primary mineral raw materials utilized in the cement industry [23]. The corresponding parameters are detailed in Table 2. In the raw material production stage, carbon emissions are calculated based on output quality, as follows:
where:
Cement raw materials are homogenized and pre-decomposed before entering the rotary kiln calcination stage. During calcination, direct carbon emissions mainly come from the combustion of fossil fuels such as coal. In practice, a flue gas continuous monitoring system is usually installed at the exhaust outlet of this stage to obtain real-time carbon emission data. And the electric power of the kiln is a key parameter that can be observed. Based on historical monitoring data, a neural network is employed to establish a data-driven correlation between real-time kiln power consumption and CO2 emissions profiles, coupling carbon emissions with equipment energy consumption. The fitted mathematical expression is as follows:
where:
3.2.2 Indirect Carbon Emissions
Indirect carbon emissions are mainly generated by users’ electricity consumption in the production process, which can be calculated based on the data of users’ electricity consumption in the time period and the dynamic carbon emission factor of the power grid in the corresponding time period. The calculation of indirect carbon emissions is as follows:
where:
In the calculation of users’ indirect carbon emissions, the grid carbon factor and user-side load are dynamically coupled. The grid carbon emission factor is affected by the power source mix, while user load fluctuations alter the unit commitment strategy of the regional grid, which subsequently affects the dynamic carbon emission factor applied in the cost calculation. This interaction makes traditional static grid carbon factors inaccurate for capturing electricity carbon footprints. Therefore, a dynamic framework that integrates supply-side carbon intensity updates and demand-side load control is needed. A two-way coupling model between grid carbon flow and user-side power flow can support integrated carbon and production scheduling decisions for EIIs.
3.2.3 Carbon Emissions Trading Mechanism
In this paper, the carbon emission trading mechanism is set as follows: the combination of government quota allocation and market trading is adopted, and the emission control enterprises can realize the performance of carbon quota according to the actual emissions. At the same time, the China Certified Emission Reduction (CCER) mechanism is introduced to allow enterprises to obtain carbon credits through renewable energy projects to offset emissions of no more than 5% [24,25]. The research assumes that EIIs can participate in carbon quota trading, and the CCER generated by their distributed renewable energy projects can be used for partial emission offset.
4 Integrated DR Model for Electric Carbon with Two-Tier Co-Optimization
Based on the source-load coordinated dispatch mechanism, this paper constructs a bi-level optimization dispatch model for EIIs considering the integrated electricity and carbon response on the demand side. Dynamic electricity prices, dynamic carbon emission factors, and DR quantities are adjusted through the game between supply and demand to promote source-load coordination. The upper-level grid aims to minimize the comprehensive power generation cost, optimizing unit commitment and calculating dynamic electricity prices and carbon emission factors. The lower-level EIIs, based on dynamic electricity prices and carbon emission factors, carry out integrated electricity and carbon DR, participate in medium- and long-term electricity markets, day-ahead spot markets, and carbon emission trading markets, with the goal of minimizing energy use costs and carbon trading costs. Therefore, this architecture inherently constitutes a Stackelberg leader-follower game model [21], where bidirectional feedback between the leader’s (grid operator) pricing/carbon pricing strategies and the followers’ (EIIs) integrated electricity-carbon demand response endogenously drives the synergistic optimization of economic and low-carbon performance in the source-load system.
4.1 Upper Level Grid Optimization Model
Assuming sufficient carbon quotas for all generating units in the grid, the carbon trading costs can be neglected. The upper-level grid’s optimization objective is to minimize the generation cost and curtailment costs of wind and solar power while meeting load demands and unit operation constraints. The optimization objective expression is as follows:
where:
Although the carbon trading cost of power generators is not explicitly included in the upper-level objective function, its influence is implicitly reflected through the dynamic carbon emission factors embedded in electricity prices. These factors capture the carbon intensity of marginal generation, thereby transmitting carbon cost signals to users via the price mechanism.
The constraints of the upper-level model mainly include power balance constraints, unit output and ramp-up constraints, unit start-up and shut-down time constraints, and power flow constraints.
1) Power balance constraints (using the DC power flow model, ignoring network losses)
2) Thermal unit output and ramp-up constraints
where:
3) Thermal unit start/stop time constraints
where:
4) Renewable energy generation capacity constraints
5) Power network constraints
where:
The results obtained from the optimized solution of the upper model can be utilized to further calculate the dynamic tariffs and dynamic carbon emission factors, as detailed in Section 2 of this paper.
4.2 Lower Level Demand Side Optimization Model
The lower-level objective function is to minimize the costs of energy use and carbon emissions of EIIs, as detailed below:
where: The calculation of
In the integrated electricity and carbon DR, users have upper limits on the amount of electricity purchased from the power market and the carbon emissions offset through CCER in the carbon trading market. Additionally, considering that users have configured a certain capacity of commercial and industrial energy storage, the operation must also satisfy the energy storage constraints.
1) Power purchase constraints
2) CCER creditable carbon emissions constraints power purchase constraints
3) Energy storage operational constraints
where:
4) End-user internal power balance
where:
The upper-level grid first sets the electricity prices and carbon emission factors for each period of the day. The lower user side then optimizes and adjusts its energy demand based on these price and carbon signals. Based on the adjusted energy demand, the upper-level grid re-formulates the unit output plan, determines the dynamic electricity prices, and calculates the dynamic carbon emission factors. This paper establishes a Stackelberg game model shown in Fig. 3, with the upper-level grid as the leader and the user side as the follower.
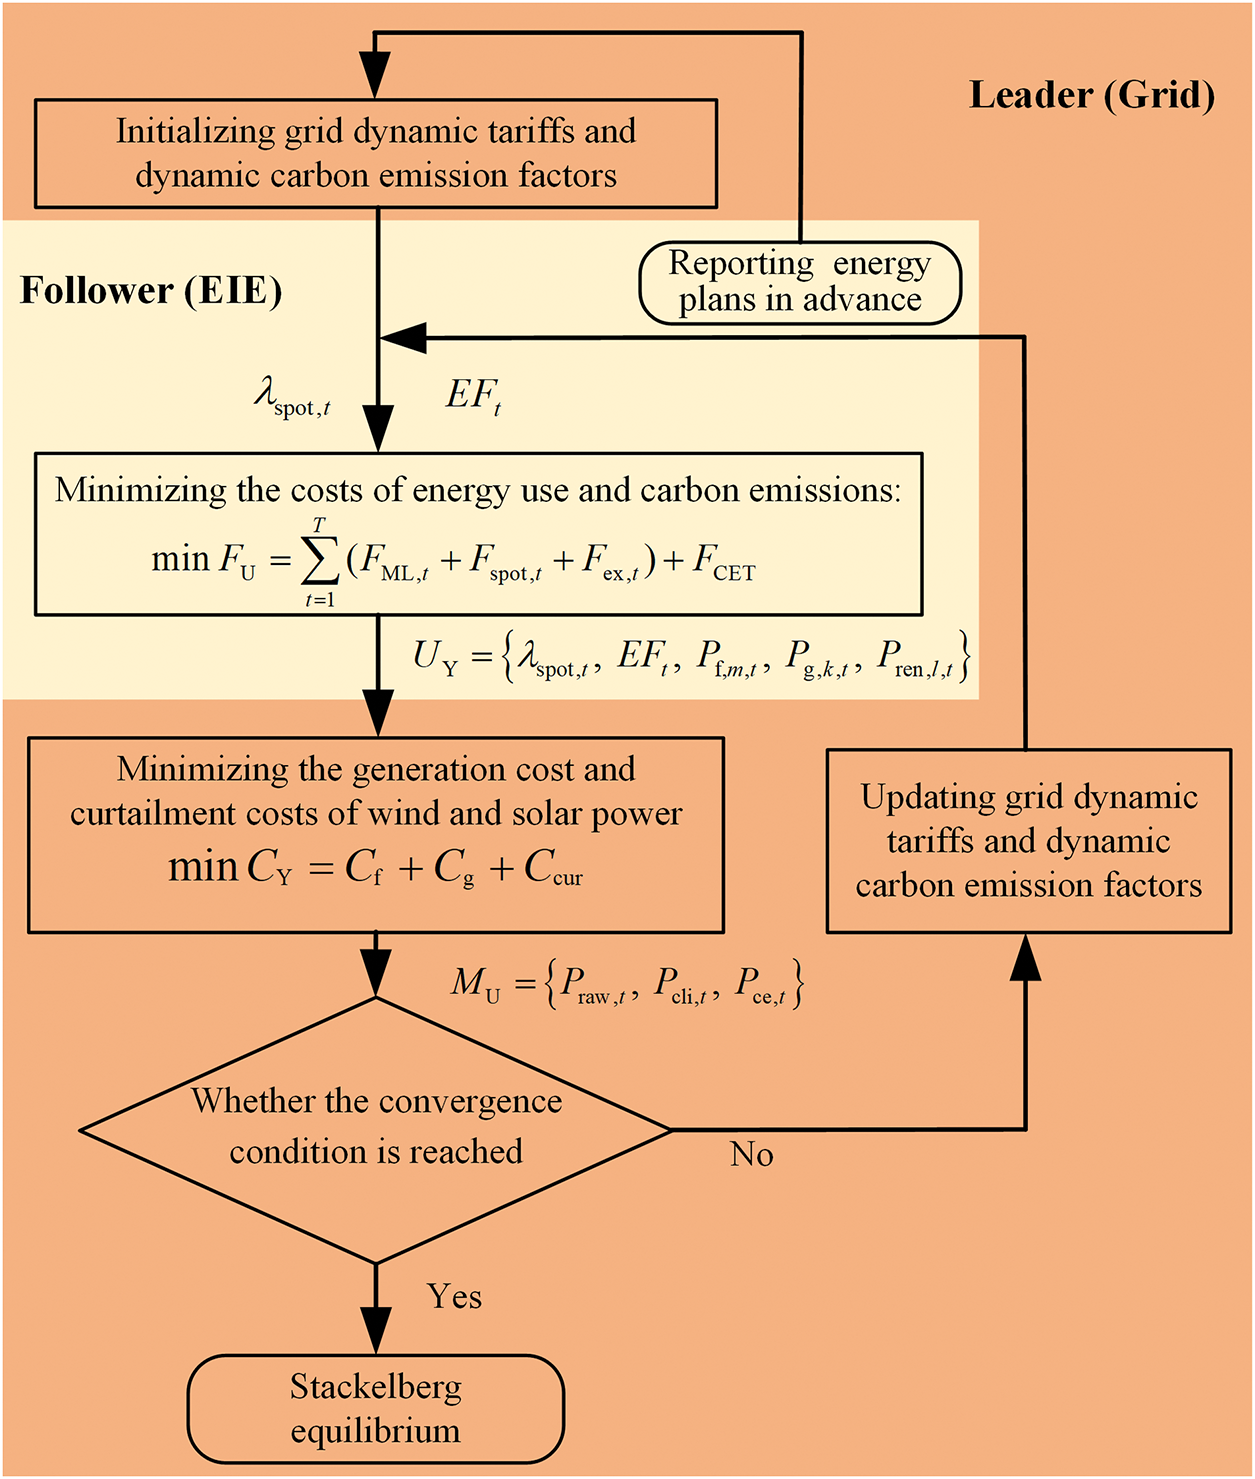
Figure 3: Decision-tree style diagram of the Stackelberg game-based bi-level optimization framework
The model includes three elements: players, strategies, and payoffs, which are specifically represented as follows.
For the first element, the players, the grid (supply side), and the user side are the two participants in the game, represented by the set
For the second element, strategies, the leader (the grid) decides the dynamic electricity prices, dynamic carbon emission factors, and unit outputs for 24 h. And the follower (the user side) decides the load at each time period. Decision variables can be represented as the set
For the third element, payoffs, the objective function of the grid side is shown in Eq. (17), and the objective function of the user side is shown in Eq. (29).
4.4 Solution Method and Procedure
The upper-level model determines dynamic electricity prices and calculates the dynamic carbon emission factors by formulating an optimal unit commitment plan, which is a large-scale nonlinear optimization problem. The lower-level optimal integrated electricity and carbon DR strategy is a mixed-integer linear optimization problem. Due to the complexity of the upper-level problem, it cannot be directly solved quickly using commercial solvers. This paper employs the Genetic Algorithm (GA), which has strong global optimization capabilities. The lower-level problem is solved using the Yalmip toolbox on the Matlab platform, combined with the efficient Gurobi solver. The solution framework is shown in Fig. 4.
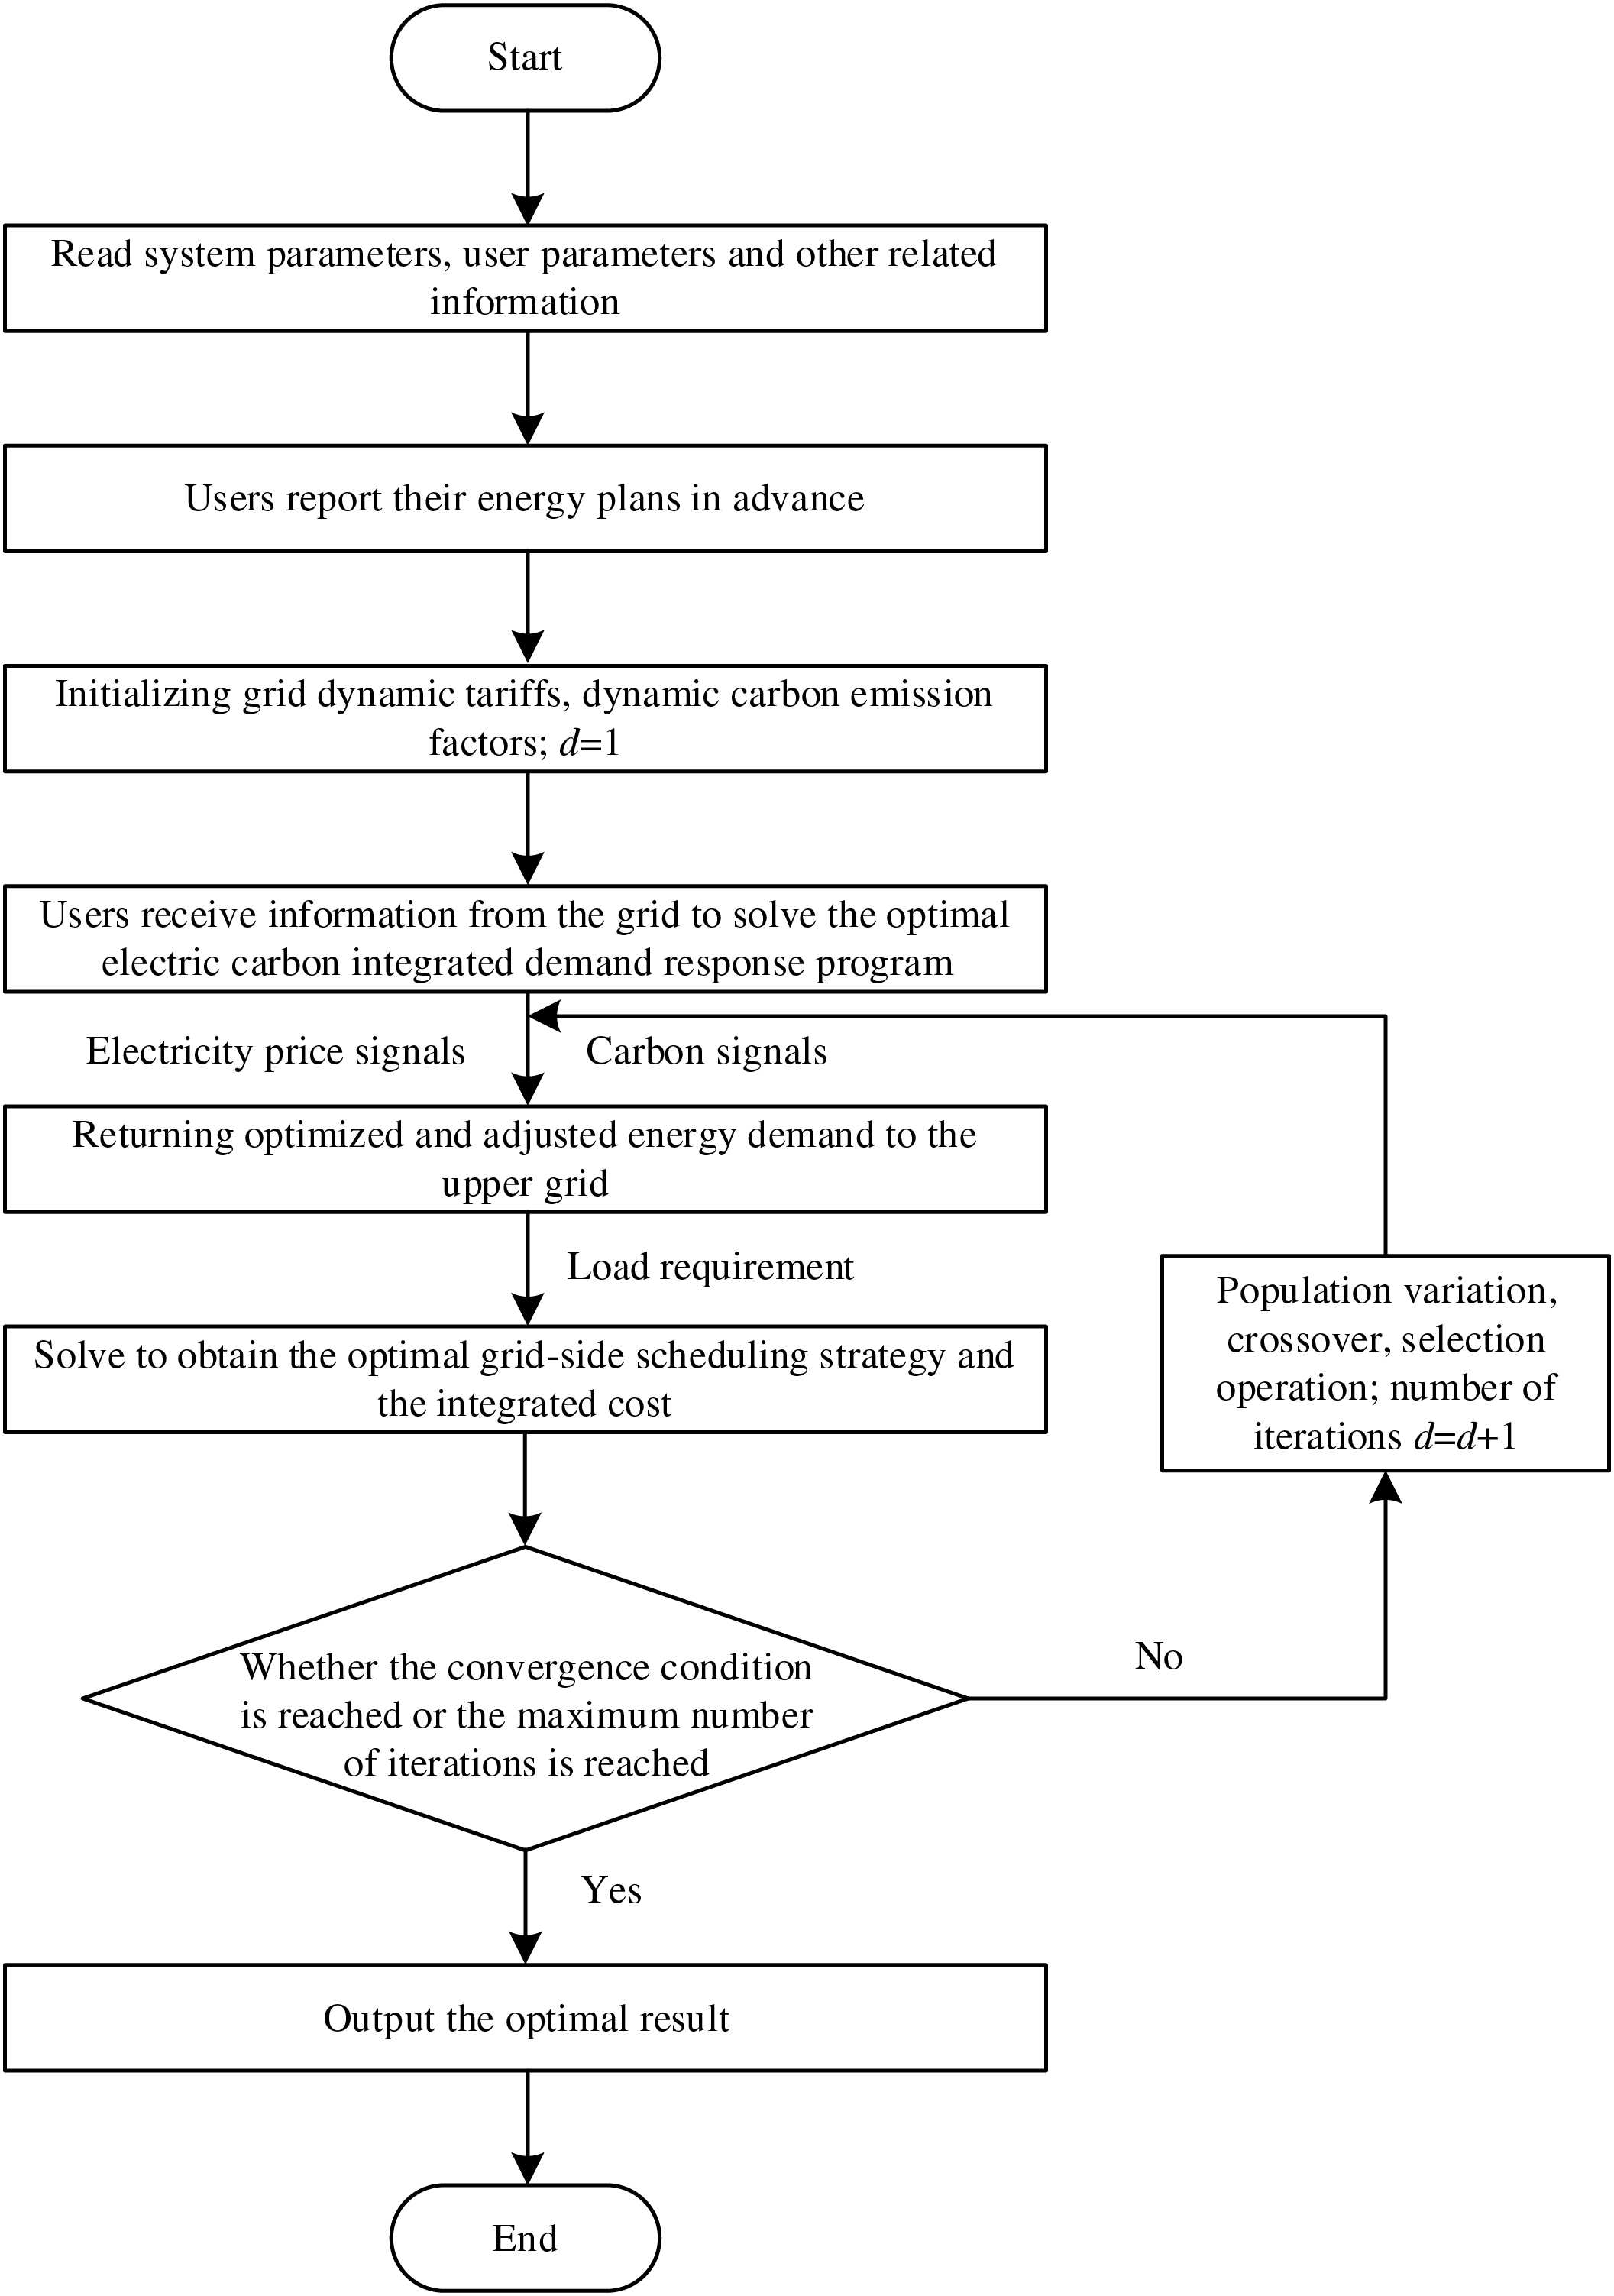
Figure 4: Model solving flowchart
The proposed model serves as a decision-support tool for enterprise energy management rather than a fully autonomous production control system. And the user is assumed to possess sufficient responsiveness to follow the electricity and carbon price signals issued by the grid.
To verify the effectiveness and reasonableness of the integrated DR strategy of electricity and carbon for EIIs based on bi-level collaborative optimization, this paper adopts the improved IEEE 30-node grid and a cement plant with an annual production capacity of 14 million tons as a representative user drawn from EIIs to conduct an example analysis. The system structure is shown in Fig. 5, where G1, G2, G3, and G4 are traditional coal-fired thermal power units (high-carbon units); G5 is a gas-fired generating unit (low-carbon unit); and G6 is a wind farm (zero-carbon unit). The operating parameters of each unit are shown in Table 3. In addition, the system includes other electricity-consuming entities, assuming that these entities do not participate in market-based trading and adopt a fixed tariff mechanism, and their electricity demand is not affected by dynamic tariffs and the carbon emission factor of the grid, which is regarded as the base load of the system, and the daily load curve is shown in Fig. 6a.
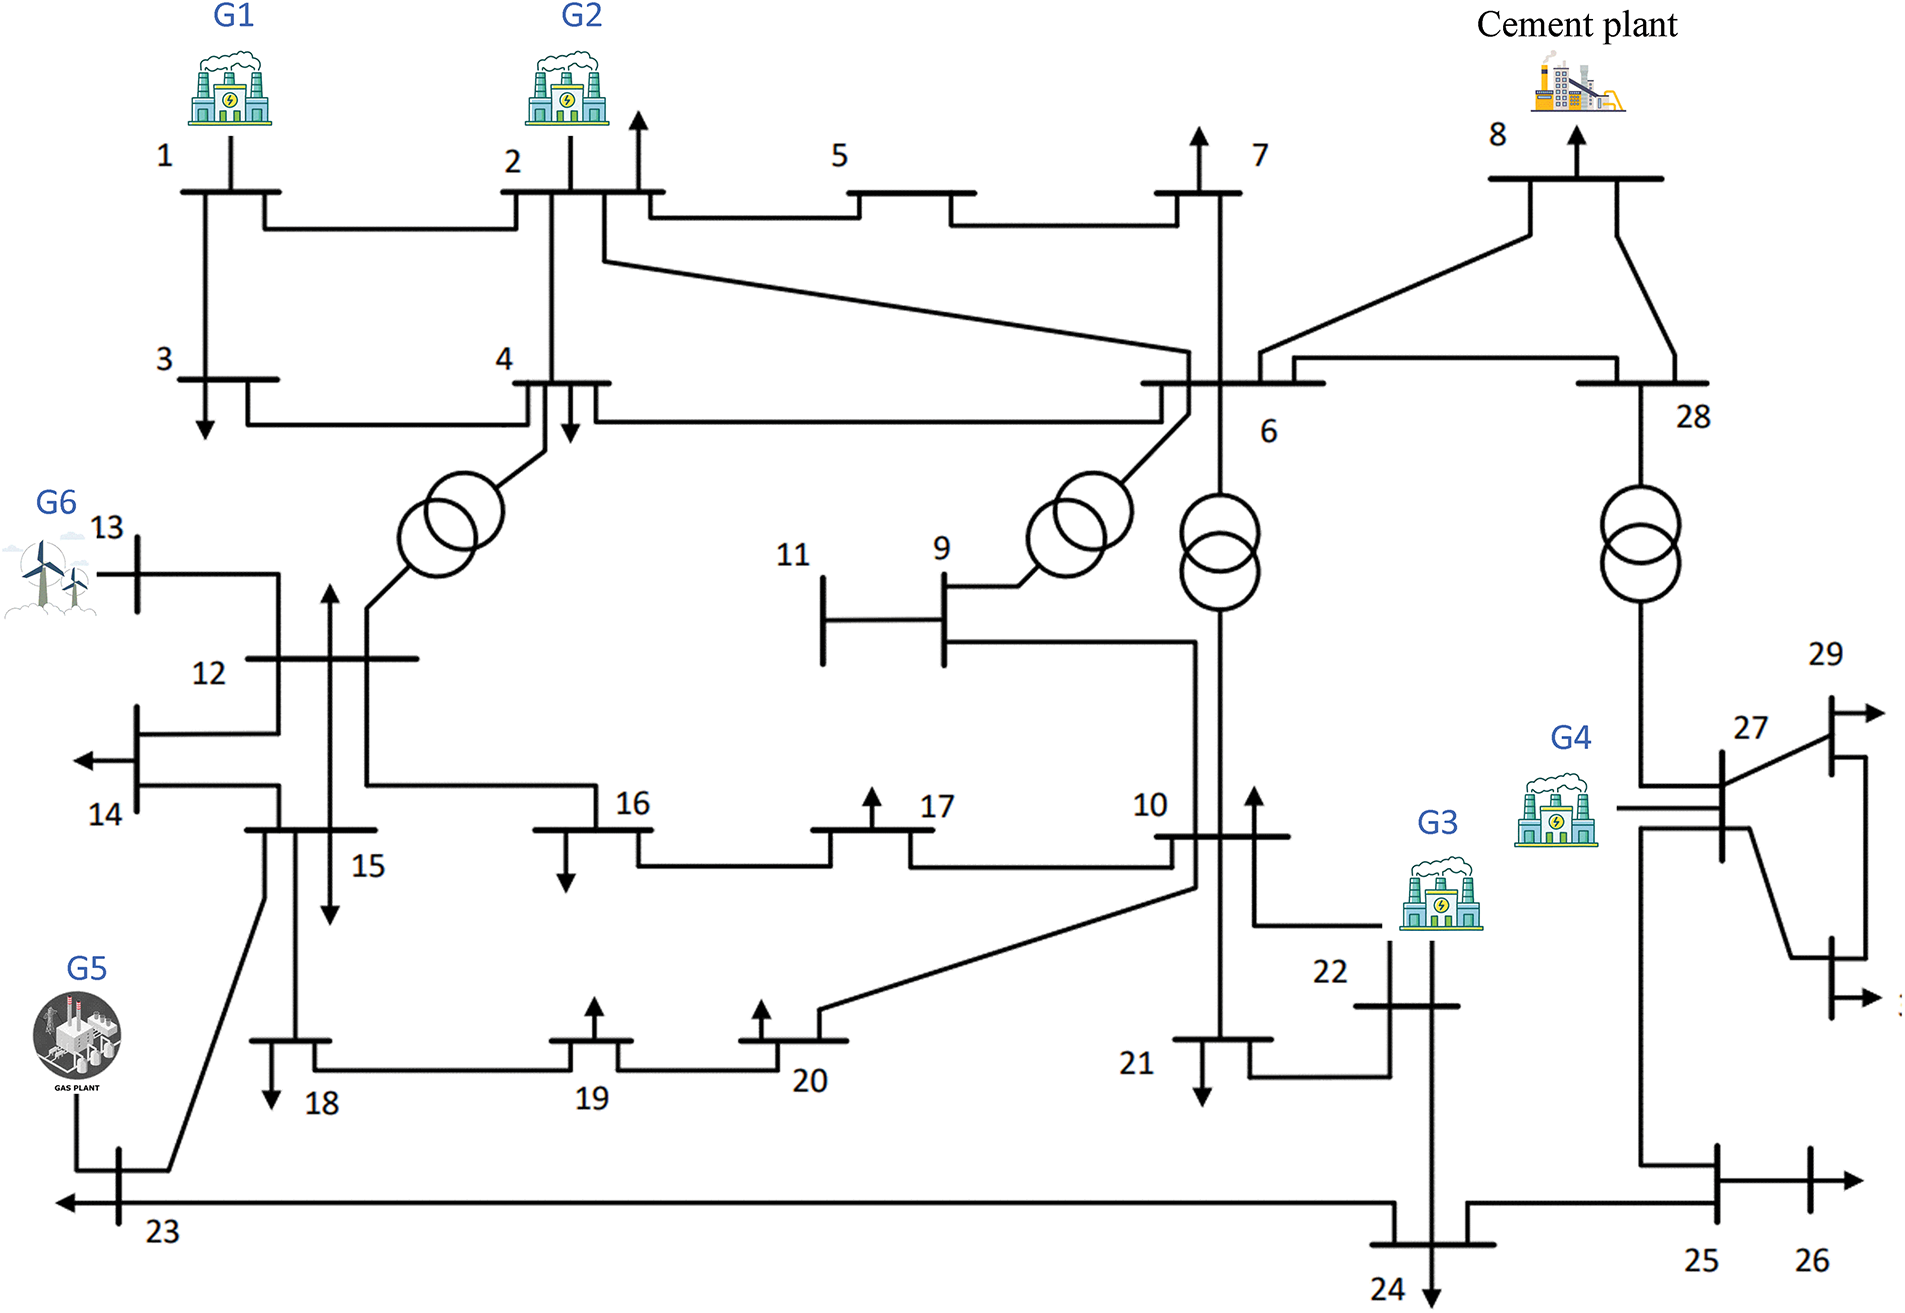
Figure 5: System structure diagram
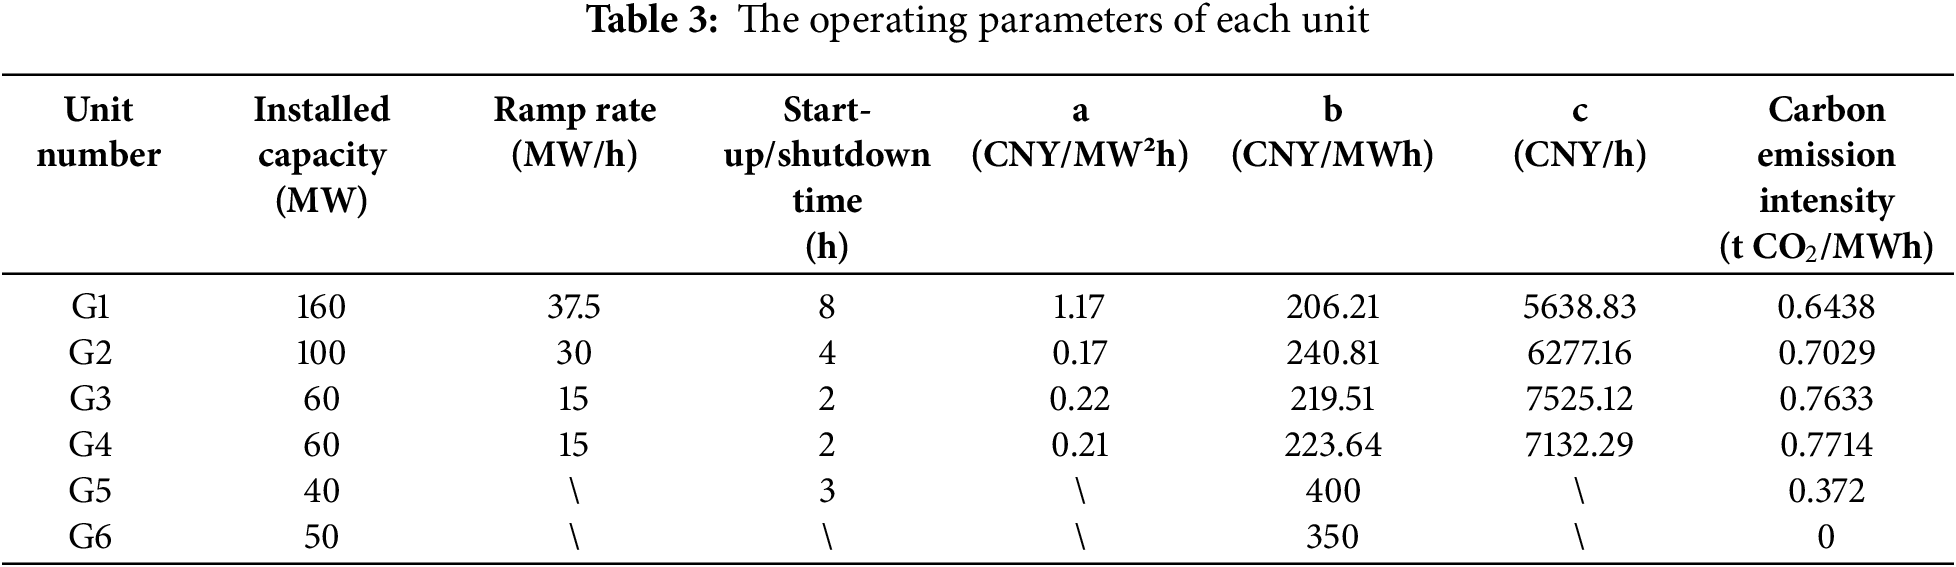
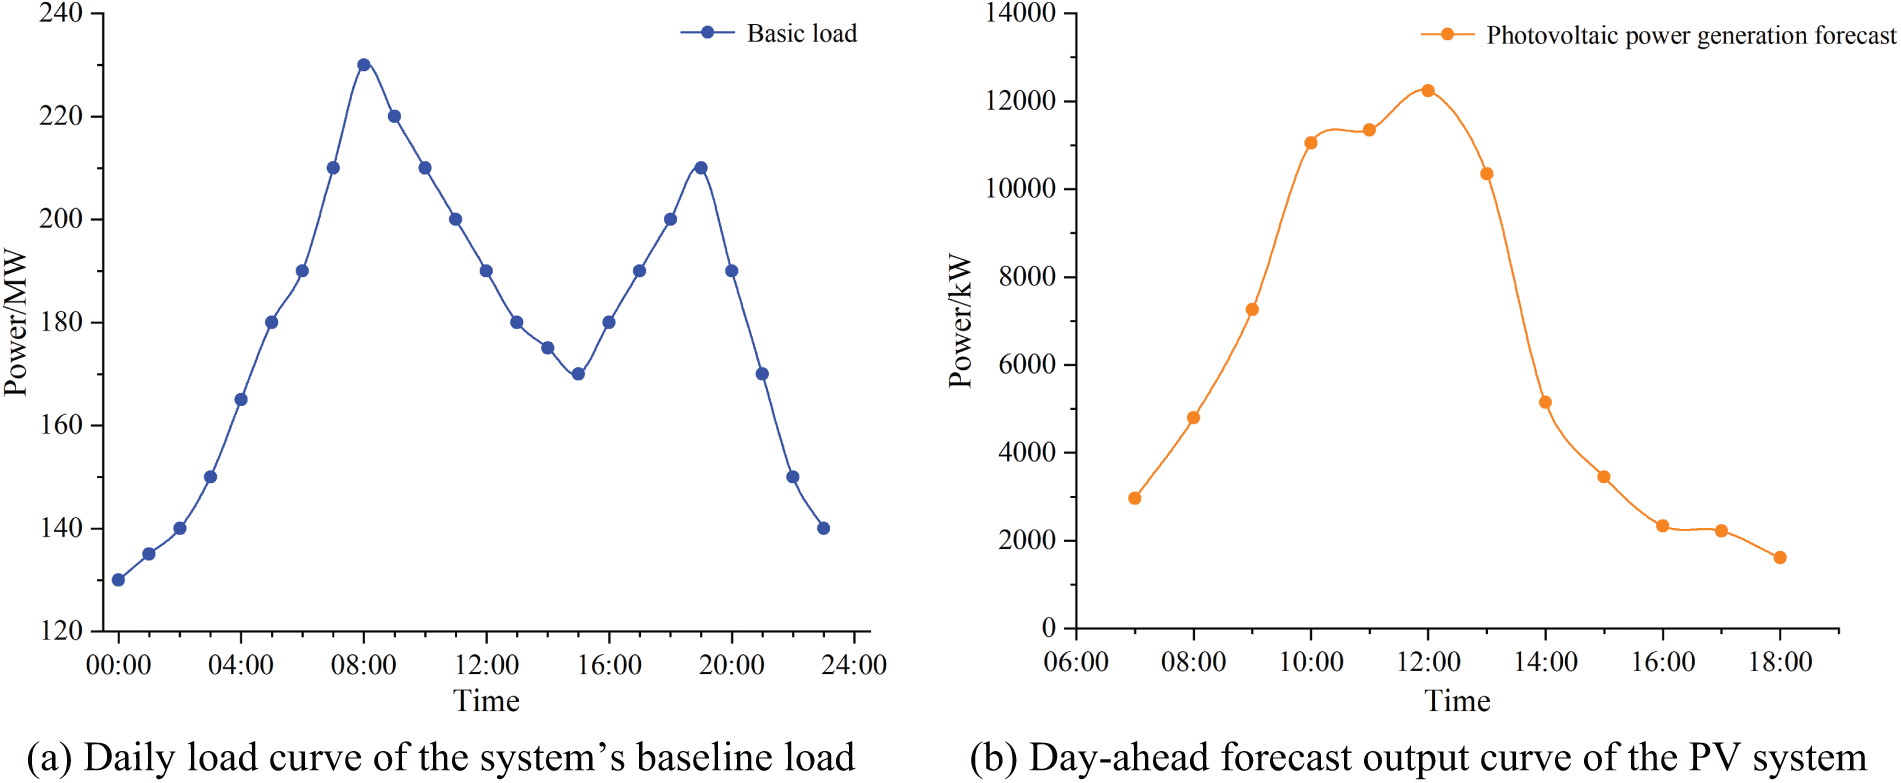
Figure 6: Load and PV output curves
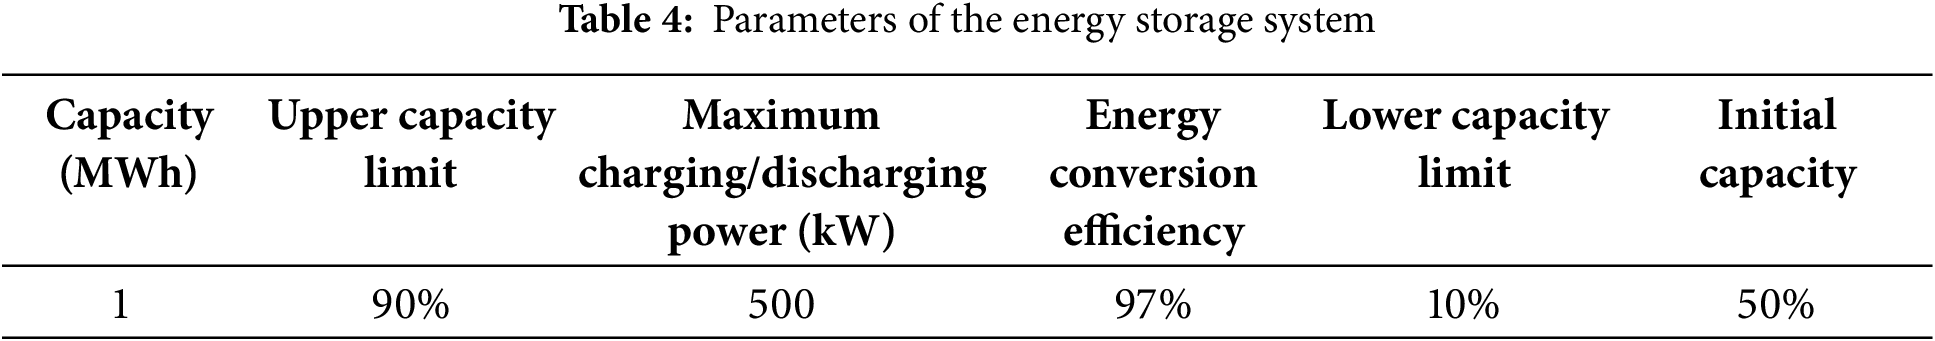
In this model, the cement plant has installed a 14 MW PV system (including rooftop and ground-mounted PV) and has deployed a battery energy storage system with a capacity of 1 MWh and a maximum charge and discharge power of 500 kW. The day-ahead forecast output data of the PV system is shown in Fig. 6 (b), and the relevant parameters of the battery energy storage system are listed in Table 4.
To verify the effectiveness and rationality of the proposed strategy in this chapter, it is assumed that the user’s carbon quota is evenly distributed daily, with a daily carbon quota of 2800 t CO2. The following four comparative scenarios are set up:
Scenario 1: The user follows a fixed time-of-use electricity price policy without considering carbon emission costs (Traditional DR Scenario).
Scenario 2: The impact of dynamic electricity prices on users is considered, but carbon emission costs are not included (DR Scenario Based on Dynamic Prices).
Scenario 3: The carbon trading price is 80 CNY/t, and the impact of dynamic electricity prices is considered (Integrated Electricity and Carbon DR Scenario under the Current Average Carbon Market Price).
Scenario 4: The carbon trading price is 120 CNY/t, and the impact of dynamic electricity prices is considered (Integrated Electricity and Carbon DR Scenario under High Carbon Price Expectation).
5.3 Analysis of Optimization Results
Table 5 presents the comparison results of the upper-level grid’s total generation cost, the user’s total energy use cost, and the user’s carbon trading cost under the four scenarios.
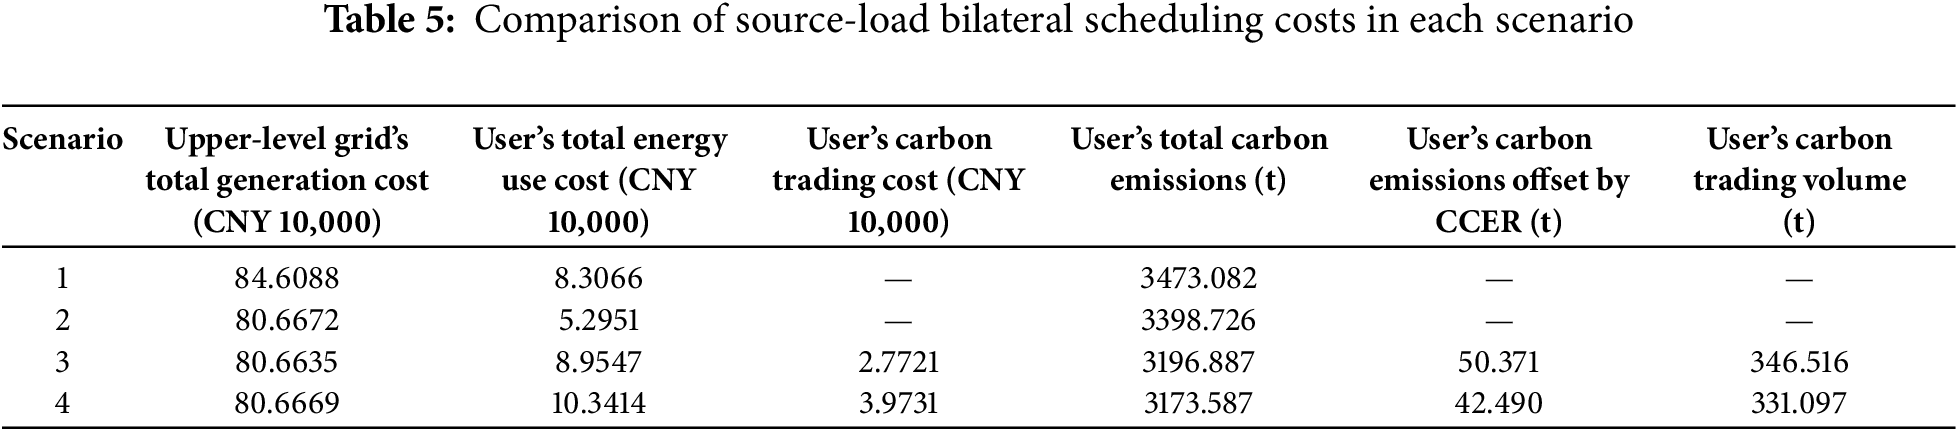
A comparison between Scenario 1 and Scenario 2 shows that the dynamic pricing mechanism significantly reduces costs for both the grid and the user. The grid’s total generation cost decreases by 4.66%, while the user-side energy cost drops by 36.25%, demonstrating the effectiveness of source–load coordinated optimization under dynamic tariffs.
Extending to Scenario 3, which incorporates both dynamic pricing and carbon trading, the results reveal that, compared to Scenario 1, the user’s energy cost increases by 7.80% due to the inclusion of carbon trading costs. However, this is accompanied by a 7.95% reduction in carbon emissions and the same 4.66% reduction in grid-side generation cost. This indicates that the proposed integrated electricity–carbon demand response strategy effectively balances economic and environmental objectives.
Further comparing Scenario 3 and Scenario 2 shows that accounting for carbon emission costs increases the user-side energy cost by 36,596 CNY, with minimal impact on the grid’s total generation cost. The dual impact of electricity and carbon pricing signals guides the user to reduce carbon emissions by 201.839 t. The user’s carbon trading cost is 27,721 CNY, reflecting 346.516 t of carbon trading volume, while electricity purchase cost increases by approximately 8900 CNY. These trends indicate a synchronization between electricity and carbon costs, with a clear synergistic effect between the two pricing signals. The elevated grid-side carbon intensity, caused by increased dispatch from high-emission thermal units, results in higher marginal generation costs and ultimately leads to increased electricity prices.
In Scenario 4, where the carbon price is increased by 50%, the user’s total energy cost rises by 13,867 CNY compared to Scenario 3, while the grid’s generation cost remains largely unchanged. However, the carbon reduction effect is limited, with total emissions reduced by only 23.3 t. This suggests that higher carbon prices may have diminishing marginal effects on carbon reduction for energy-intensive industries (EIIs). The additional user cost is primarily driven by increased carbon trading expenses rather than changes in electricity consumption. As shown in Fig. 7, the user’s electricity purchasing strategy remains largely unchanged under the two scenarios. This may be attributed to the limited flexibility of EIIs in adjusting production schedules, leading to a bottleneck in further optimizing their energy usage under high carbon pricing conditions.
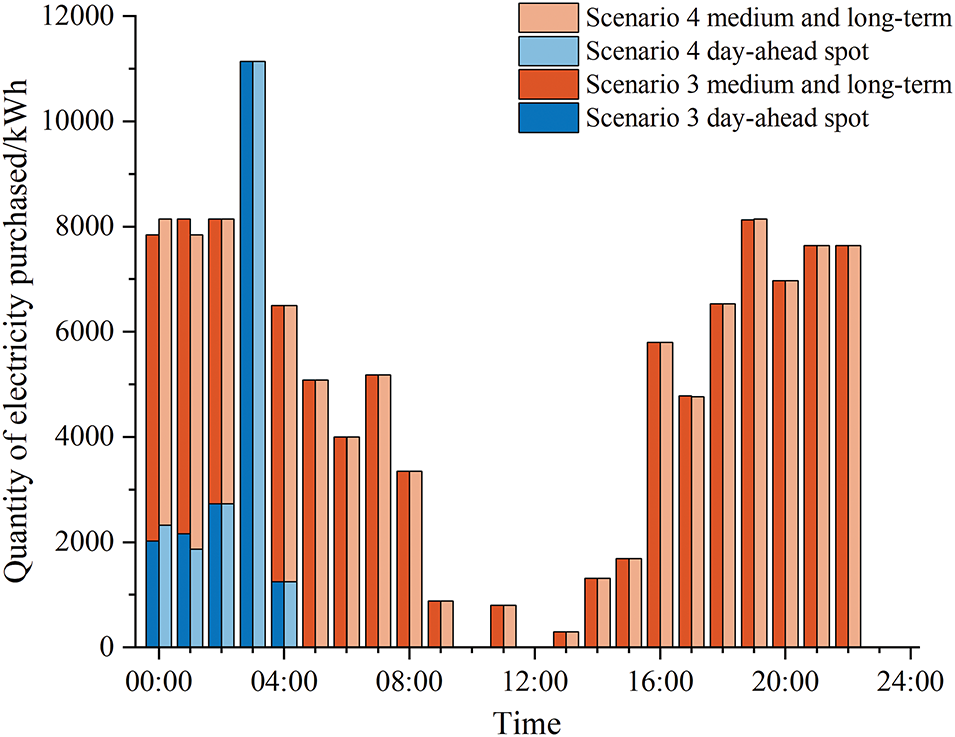
Figure 7: Comparison of electricity purchase strategies between Scenario 3 and Scenario 4
Further analysis of the dispatch results for Scenario 3 shown in Fig. 8 reveals several notable characteristics. In the upper-level grid’s unit dispatch, the actual output of wind farm G6 matches its day-ahead forecast due to the high wind curtailment cost (350 CNY/MWh), resulting in no wind curtailment. Thermal unit G1, functioning as the system’s baseload power source, operates continuously at high load levels (approaching 70% of its installed capacity) due to prolonged start-up/shutdown cycles, thereby exerting a critical influence on the grid’s carbon emission intensity.
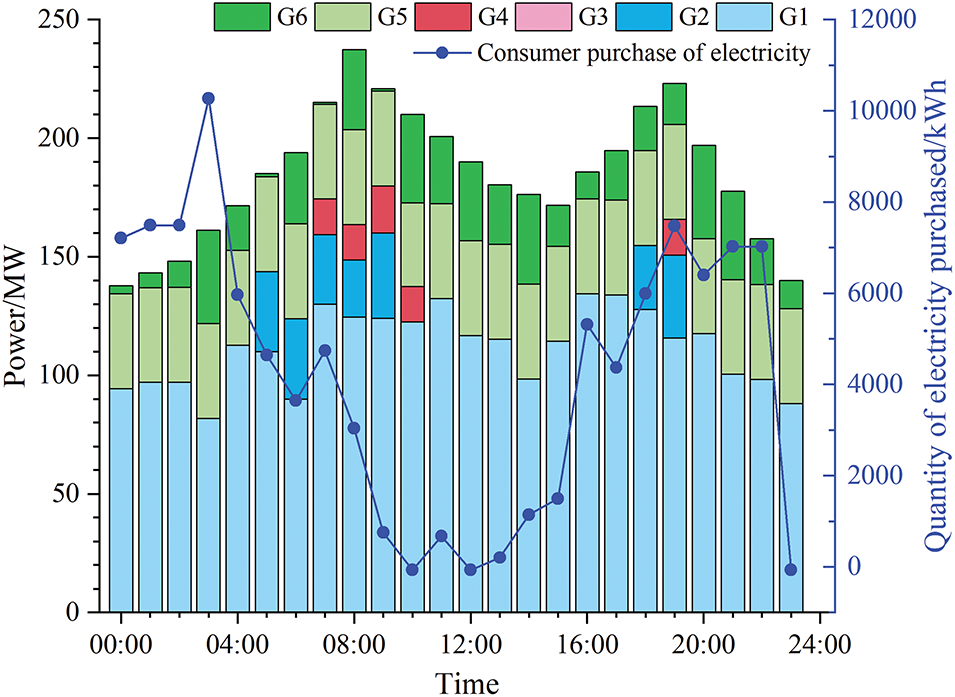
Figure 8: Schematic diagram of source-load dispatch results for Scenario 3
From the point of view of the user power purchase curve, the EIIs show obvious peak avoidance characteristics. The load peaks between 03:00 and 04:00, whereas during the grid’s operational peak hours (10:00–12:00), the user’s electricity consumption remains consistently low during peak grid hours. Even during the midday hours (11:00–12:00 and 13:00–14:00), the user’s internal PV system output is high and the purchased power drops to near-zero levels. In addition, a secondary consumption peak materializes after 20:00, successfully avoiding the evening peak hours of the grid.
As shown in Fig. 9, despite the user’s external electricity purchases dropping to zero during midday, the power of its production equipment remains at a peak level. This is mainly because the user prioritizes using its internal PV power generation to maximize the use of rooftop and ground-mounted PV systems within the plant area. In addition to optimizing the energy use structure through its internal PV power generation system, EIIs can enhance their DR capabilities by using commercial and industrial energy storage systems. Fig. 10 shows the charging and discharging conditions of the battery energy storage system for the cement plant in Scenario 3. It is evident in the figure that the charging of the energy storage system mainly focuses on periods with low electricity prices and high internal PV power generation. However, the frequency of deep discharges of the battery energy storage system is low, resulting in low overall utilization. To improve the economic and operational efficiency of the energy storage system, EIIs need to further optimize the selection and configuration of the energy storage system.
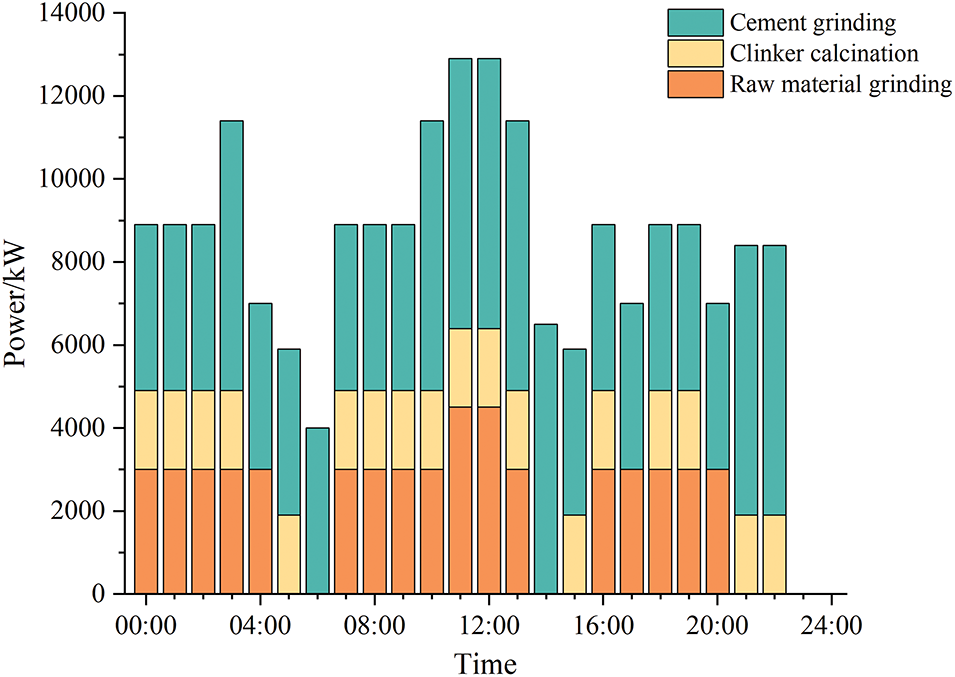
Figure 9: Operation of production equipment for the cement plant in Scenario 3
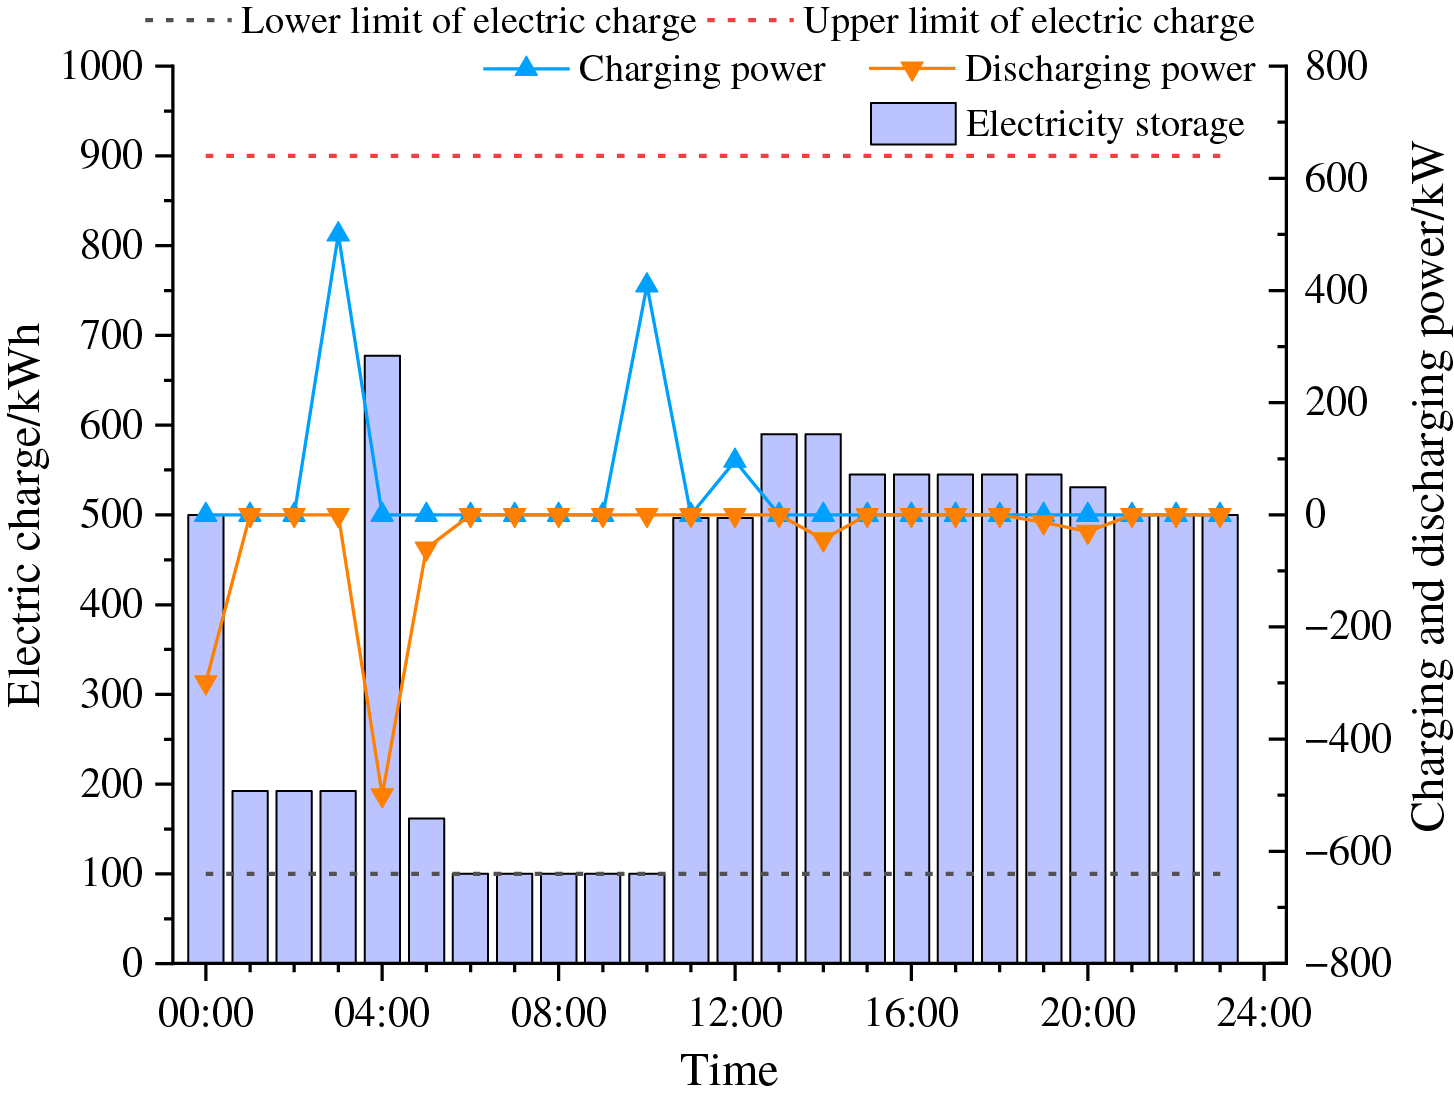
Figure 10: The operation of energy storage system for the cement plant in Scenario 3
Fig. 11 shows the user’s final product and raw material inventory. The user successfully met the daily production target for cement (4000 t), with an actual daily output of 4010 t. The energy use plan was optimized while ensuring the production task was completed.
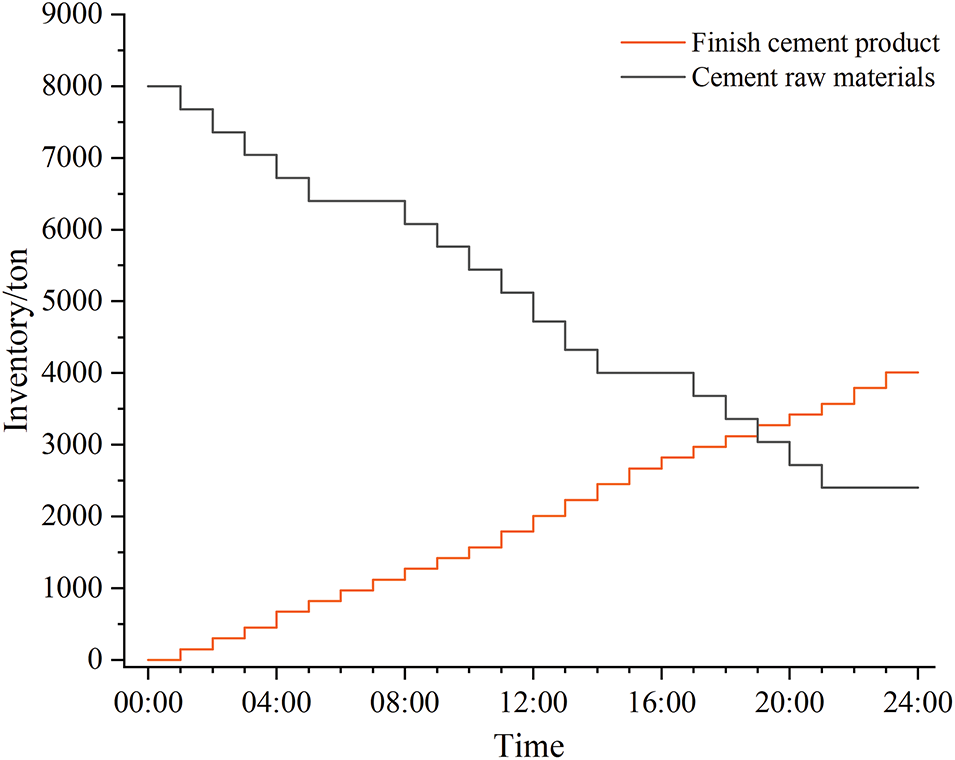
Figure 11: Final product and raw material inventory for the cement plant in Scenario 3
5.4 Analysis of the Stackelberg Game Process
Fig. 12 shows the dynamic electricity prices and dynamic carbon emission factors obtained after the game optimization.
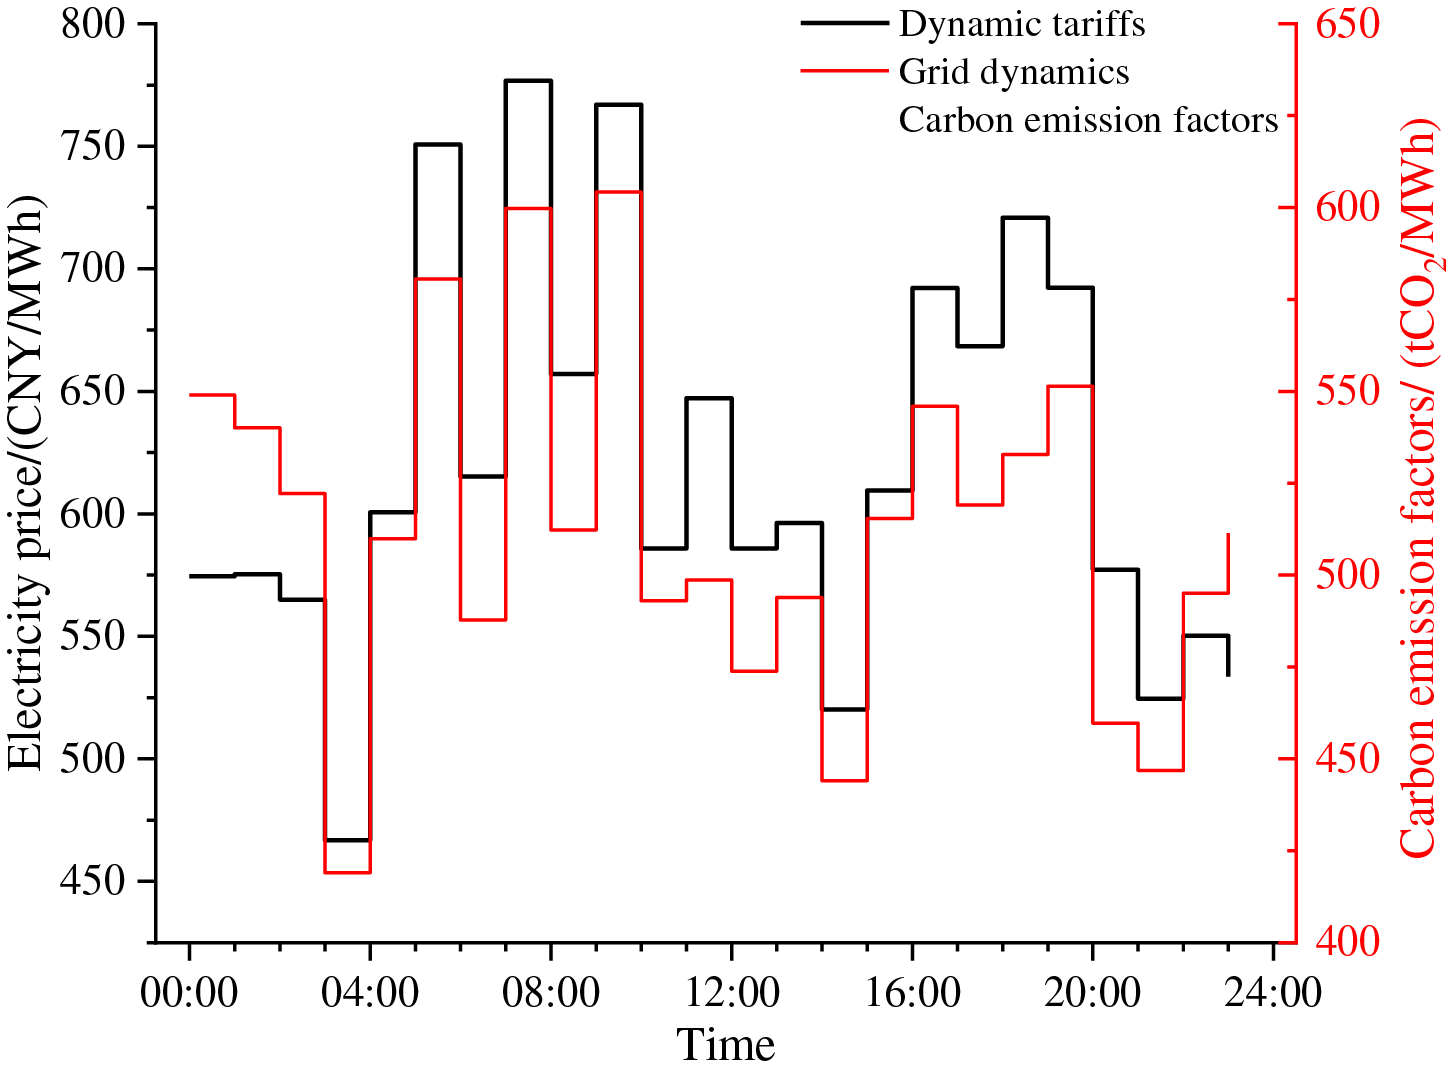
Figure 12: Dynamic electricity prices and carbon emission factors in Scenario 3
As seen from the figure, the trends of these two factors show strong consistency, mainly because they are both influenced by the power generation unit output structure. The dynamic electricity price is determined based on the highest marginal generation cost of the current power generation units, and units with higher marginal generation costs are usually high-carbon emission units. Therefore, when these high-carbon emission units dominate the output, the grid carbon emission factor increases accordingly.
Fig. 13 shows the iterative process between the supply side and the user side in the Stackelberg game. With increasing iterations, the supply side’s total generation cost decreases, while the user’s total energy use cost initially falls and then rises slightly. At equilibrium, the user’s energy strategy stabilizes. The user’s total energy use cost stabilizes at 89,547 CNY, and the supply side’s total generation cost stabilizes at 806,635 CNY, balancing economic efficiency and low carbon emissions.
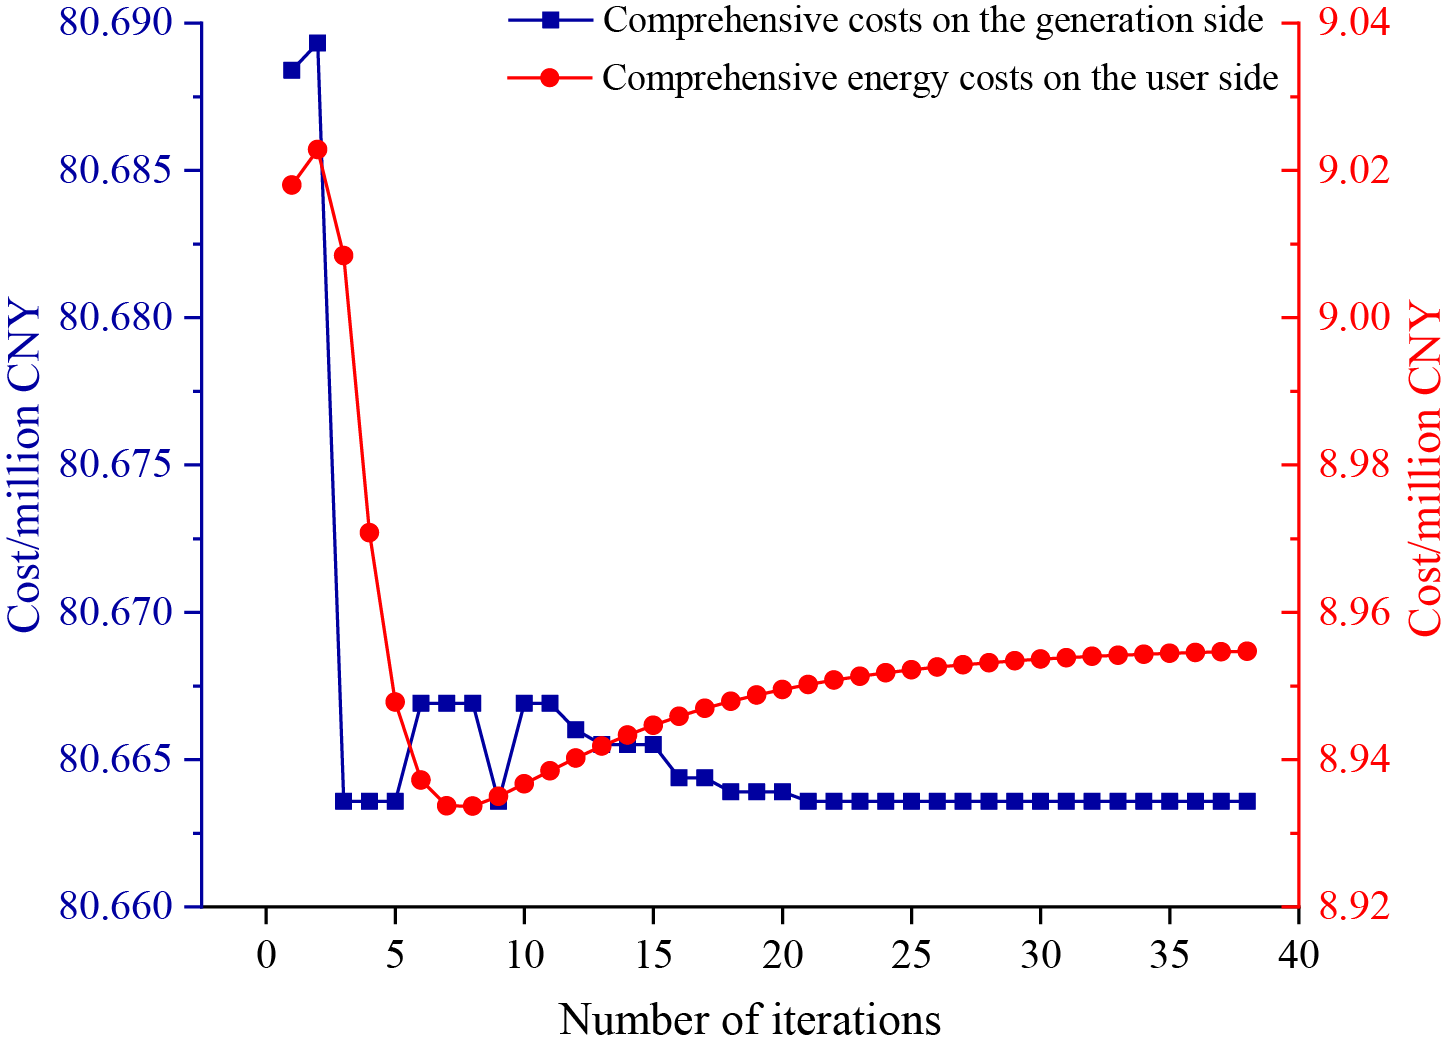
Figure 13: Iteration process for Scenario 3
Focusing on the low-carbon and economic scheduling of EIIs under the “dual carbon” goals, this paper proposes an electricity-carbon integrated demand response strategy based on a bi-level Stackelberg game framework from the perspective of source-load interaction. By introducing a dual incentive mechanism that combines dynamic carbon emission signals with dynamic electricity price signals, the proposed method optimizes the production and energy consumption plans of EIIs, thereby achieving coordinated optimization of both economic benefits and carbon reduction targets. Based on case studies, the following key conclusions are drawn:
1) The hourly dynamic carbon emission factor calculation method effectively allocates generation-side carbon emissions to the user side, providing a carbon signal for low-carbon DR and supporting low-carbon dispatch for EIIs.
2) Compared to traditional methods relying solely on electricity prices, dual guidance by electricity and carbon prices significantly enhances EIIs’ carbon reduction effects. This approach optimizes user load economics and improves the generation unit output structure, reducing overall system carbon emissions.
3) The Stackelberg game model creates a two-way interaction between the power generation and user sides, generating rational and effective dynamic electricity prices and carbon emission factors. This method reduces user costs while stimulating proactive carbon reduction, achieving dual optimization of economic benefits and low-carbon performance.
Notwithstanding carbon pricing incentives, EIIs face inherent decarbonization constraints stemming from operational inflexibility—where process continuity imperatives and self-generation configurations establish fundamental limitations. Facing future expectations of higher carbon prices, EIIs should further enhance the flexibility of their energy use structure and expand carbon reduction methods, such as adopting multi-energy complementary structures and developing safety-enhanced integrated hydrogen energy systems, to strengthen their low-carbon dispatch capabilities and adaptability.
Acknowledgement: Not applicable.
Funding Statement: This paper is supported by the Science and Technology Project of Yunnan Power Grid Co., Ltd. under Grant No. YNKJXM20222410.
Author Contributions: Conceptualization, Methodology, and Supervision, Huaihu Wang, Wen Chen, Jin Yang, Rui Su; Design and Writing original draft, Jiale Li; Writing—review & editing, Liao Yuan; Validation, Investigation, and Review, Zhaobin Du; Visualization, Yujie Meng. All authors reviewed the results and approved the final version of the manuscript.
Availability of Data and Materials: Data will be made available on reasonable request.
Ethics Approval: Not applicable.
Conflicts of Interest: The authors declare no conflicts of interest to report regarding the present study.
Nomenclature
| DR | Demand Response |
| EIIs | Energy-Intensive Industries |
| PV | Photovoltaic |
| CCER | China Certified Emission Reduction |
References
1. Gupta A, Likozar B, Jana R, Chanu WC, Singh MK. A review of hydrogen production processes by photocatalytic water splitting—from atomistic catalysis design to optimal reactor engineering. Int J Hydrogen Energy. 2022;47(78):33282–307. doi:10.1016/j.ijhydene.2022.07.210. [Google Scholar] [CrossRef]
2. Ademollo A, Mati A, Pagliai M, Carcasci C. Exploring the role of hydrogen in decarbonizing energy-intensive industries: a techno-economic analysis of a solid oxide fuel cell cogeneration system. J Clean Prod. 2024;469:143254. doi:10.1016/j.jclepro.2024.143254. [Google Scholar] [CrossRef]
3. Rakić E, Grilc M, Likozar B. Liquid organic hydrogen carrier hydrogenation-dehydrogenation: from ab initio catalysis to reaction micro-kinetics modelling. Chem Eng J. 2023;472(44):144836. doi:10.1016/j.cej.2023.144836. [Google Scholar] [CrossRef]
4. Li W, Xu P, Lu X, Wang H, Pang Z. Electricity demand response in China: status, feasible market schemes and pilots. Energy. 2016;114(03):981–94. doi:10.1016/j.energy.2016.08.081. [Google Scholar] [CrossRef]
5. Ibrahim C, Mougharbel I, Kanaan HY, Daher NA, Georges S, Saad M, et al. A review on the deployment of demand response programs with multiple aspects coexistence over smart grid platform. Renew Sustain Energ Rev. 2022;162(2):112446. doi:10.1016/j.rser.2022.112446. [Google Scholar] [CrossRef]
6. Trotignon R. Combining cap-and-trade with offsets: lessons from the EU-ETS. Climate Policy. 2012;12(3):273–87. doi:10.1080/14693062.2011.637820. [Google Scholar] [CrossRef]
7. Giakounti AE. A comparative analysis of the EU emission trading system and California’s cap and trade program [dissertation]. Piraeus, Greece: University of Piraeus; 2024. doi:10.26267/unipi_dione/4216. [Google Scholar] [CrossRef]
8. Ellerman AD, Marcantonini C, Zaklan A. The European Union emissions trading system: ten years and counting. Rev Environ Econ Policy. 2016;10(1):89–107. doi:10.1093/reep/rev014. [Google Scholar] [CrossRef]
9. Wang K, Lü C. Review and outlook of global and China’s carbon markets. J Beijing Instit Technol. 2025;27(2):19–36. doi:10.15918/j.jbitss1009-3370.2025.7132. [Google Scholar] [CrossRef]
10. Shewale A, Mokhade A, Funde N, Bokde ND. An overview of demand response in smart grid and optimization techniques for efficient residential appliance scheduling problem. Energies. 2020;13(16):4266. doi:10.3390/en13164266. [Google Scholar] [CrossRef]
11. Chen S, Liu P, Li Z. Low carbon transition pathway of power sector with high penetration of renewable energy. Renew Sustain Energ Rev. 2020;130(1):109985. doi:10.1016/j.rser.2020.109985. [Google Scholar] [CrossRef]
12. Xu B, Wang JX, Guo MY, Lu JY, Li GH, Han L. A hybrid demand response mechanism based on real-time incentive and real-time pricing. Energy. 2021;231(1):120940. doi:10.1016/j.energy.2021.120940. [Google Scholar] [CrossRef]
13. Huang WJ, Zhang N, Kang CQ, Li MX, Huo ML. From demand response to integrated demand response: review and prospect of research and application. Prot Control Mod Power Syst. 2019;4(1):12. doi:10.1186/s41601-019-0126-4. [Google Scholar] [CrossRef]
14. Stoll P, Brandt N, Nordström L. Including dynamic CO2 intensity with demand response. Energy Policy. 2014;65:490–500. doi:10.1016/j.enpol.2013.10.044. [Google Scholar] [CrossRef]
15. Zhang SX, Li YW, Du ES, Wang W, Wang M, Feng HR, et al. Research on carbon-reduction-oriented demand response technology based on generalized nodal carbon emission flow theory. Energies. 2024;17(18):4672. doi:10.3390/en17184672. [Google Scholar] [CrossRef]
16. Tan M, Jiang HW, Kuang Y, Li K, Wang R, Li ZB. Electricity-carbon dual response for energy-intensive enterprise: a co-optimization approach. Renew Energy. 2025;251(4):123330. doi:10.1016/j.renene.2025.123330. [Google Scholar] [CrossRef]
17. Zhang Q, Qiao K, Hu C, Su P, Cheng O, Yan N, et al. Study on life-cycle carbon emission factors of electricity in China. Int J Low-Carbon Technol. 2024;19:2287–98. doi:10.1093/ijlct/ctae181. [Google Scholar] [CrossRef]
18. Du YD, Li XG, Liang Y, Tan ZF. Two-stage multi-objective distributionally robust optimization of the electricity-hydrogen coupling system under multiple markets. Energy. 2024;303:131960. doi:10.1016/j.energy.2024.131960. [Google Scholar] [CrossRef]
19. Yang BW. Multi-objective optimization of integrated gas-electricity energy system based on improved multi-object cuckoo algorithm. Energy Sci Eng. 2021;9(10):1839–57. doi:10.1002/ese3.954. [Google Scholar] [CrossRef]
20. Ma FM, Ying LM, Cui X, Yu Q. Research on a low-carbon optimization strategy for regional power grids considering a dual demand response of electricity and carbon. Sustainability. 2024;16(16):7000. doi:10.3390/su16167000. [Google Scholar] [CrossRef]
21. Feng C, Li Z, Shahidehpour M, Wen F, Li Q. Stackelberg game based transactive pricing for optimal demand response in power distribution systems. Int J Elect Pow Ene Syst. 2020;118(7):105764. doi:10.1016/j.ijepes.2019.105764. [Google Scholar] [CrossRef]
22. Chen H, Han L. Electricity pricing theory based on continuous time commodity model. In: 2018 IEEE Power & Energy Society General Meeting (PESGM); 2018 Aug 5–10; Portland, OR, USA. Piscataway, NJ, USA: IEEE; 2018. p. 1–5. doi:10.1109/PESGM.2018.8586559. [Google Scholar] [CrossRef]
23. Yang N, Li YX, Zhao M, Lyu C, Liu ZL, Chen S. Establishment of a CO2 direct emission accounting model for cement clinker manufacturers. Clim Change Res. 2021;17(1):79–87. (In Chinese). doi:10.12006/j.issn.1673-1719.2019.281. [Google Scholar] [CrossRef]
24. Zhang C, Lin B. Impact of introducing Chinese certified emission reduction scheme to the carbon market: promoting renewable energy. Renew Energy. 2024;222:119887. doi:10.1016/j.renene.2023.11988. [Google Scholar] [CrossRef]
25. Ministry of Ecology and Environment of the People’s Republic of China (MEE). Interim measures for the administration of carbon emission trading [Internet]. Order No. 19. Beijing, China: MEE; 2020 Dec 31 [cited 2024 Jul 18]. Available from: http://www.mee.gov.cn/xxgk2018/xxgk/xxgk02/202101/t20210105_816131.html. [Google Scholar]
Cite This Article
 Copyright © 2025 The Author(s). Published by Tech Science Press.
This work is licensed under a Creative Commons Attribution 4.0 International License , which permits unrestricted use, distribution, and reproduction in any medium, provided the original work is properly cited.
 Downloads
 Citation Tools