
 Submit a Paper
 Propose a Special lssue
 Open Access
ARTICLE

Impact of Duty Cycling HVAC Systems on Thermal Comfort, Energy Consumption, and Operational Costs
1 Graduate Institute of Precision Manufacturing, National Chin-Yi University of Technology, Taichung, 41170, Taiwan
2 Department of Refrigeration, Air Conditioning and Energy Engineering, National Chin-Yi University of Technology, Taichung, 41170, Taiwan
* Corresponding Author: Fujen Wang. Email:
(This article belongs to the Special Issue: Innovative Strategies for Energy-Efficient Buildings in a Sustainable Future)
Energy Engineering 2025, 122(9), 3839-3866. https://doi.org/10.32604/ee.2025.068586
Received 01 June 2025; Accepted 29 July 2025; Issue published 26 August 2025
 View Full Text
 Download PDF
Abstract
Air conditioning (AC) is essential for maintaining indoor comfort during Taiwan’s hot and humid summers but significantly contributes to increased energy consumption. This study evaluates the effects of AC duty-cycling strategies on energy performance, thermal comfort, and operational costs in office environments. Duty-cycling was implemented using a building energy management system (BEMS), which remotely controlled the ON/OFF cycles of AC units. Five duty-cycling modes were tested, with some modes incorporating air circulation during OFF periods. Field measurements of energy consumption, temperature, humidity, and air velocity were conducted and integrated with thermal comfort analysis tools to calculate predicted mean vote (PMV) and percentage of dissatisfied (PPD) values. The objective was to achieve energy savings while maintaining acceptable thermal comfort levels. Results show that Mode A achieved the highest energy savings, reducing monthly consumption by 40.79%; however, it slightly exceeded the PMV threshold (+0.5) and recorded a PPD greater than 10%, indicating reduced occupant comfort. In contrast, Mode C provided a better balance, achieving a 27.61% reduction in energy consumption while maintaining a PMV of +0.28 and a PPD of 7.49%, both within acceptable comfort limits. Despite the energy-saving benefits, not all duty-cycling modes ensured satisfactory thermal comfort. Additionally, the cost analysis revealed that Mode A achieved the lowest monthly electricity cost (NTD 8476.18/USD 263.38), while Mode C incurred a higher cost (NTD 10,363.00/USD 322.01), highlighting the trade-off between energy savings, comfort, and economic impact.Keywords
Taiwan is known for its hot and humid climate during the summer season; consequently, being reliant on Air Conditioning (AC) is common, especially in office spaces where people spend most of their time with air conditioning during the day. As reported in the Energy Audit Annual Report by the Bureau of Energy (BOE), Ministry of Economic and Affairs (MOEA) [1], 58.62% of the energy consumption of office buildings is used for HVAC systems. Moreover, the high temperatures and humidity influence thermal comfort, resulting in the reliance on air conditioning and ventilation systems in Taiwan [2]. This occurrence often caused peak load in summer. As a result, the biggest challenge is to regulate high energy consumption by developing optimal HVAC system approaches while simultaneously delivering adequate thermal comfort.
Recognizing the challenges of improving the energy efficiency of an air conditioning system during the summer season with high ambient temperatures and humidity levels necessitates a significant effort. Taiwan Power Company [3] implemented the duty-cycling operating method for packaged air conditioning systems to suppress energy consumption during the peak load by operating mode for 22 min and pausing the operation for 8 min. The results showed that the daily peak load was reduced by 1.07 GW on the peak load day in 2021. However, traditional on/off control methods use a thermostat to keep a set temperature. Though this method is straightforward and initially inexpensive, it can cause short cycling, which shortens the compressor’s lifespan and leads to temperature fluctuations [4]. On the other hand, variable-speed control systems continuously adjust the cooling or heating output, offering higher energy efficiency, more precise temperature control, and less noise operation [5]. Regardless of these advantages, implementing variable-speed control systems causes higher initial and maintenance costs, which makes fewer users select these systems, especially in small buildings or small spaces [6]. Therefore, utilizing duty-cycling, also known as ON/OFF systems in air conditioning systems, could be considered for small spaces to regulate energy conservation. However, the conventional ON/OFF system could be more convenient if the system is integrated with smart control systems. In a study conducted by Vadamalraj et al. [7], a hybrid ventilation system scheme was implemented in a university with a summer climate similar to Taiwan’s, which is hot and humid. The scheme was supported by the combination of an Internet of Things (IoT)-based sensor to control the ventilation system duty period, thereby achieving thermal comfort by varying the ON/OFF times. The findings revealed that this hybrid system can achieve energy saving potential of up to 19%–21% while still maintaining comfortable indoor temperature and humidity. A similar study conducted by Daissaoui et al. [8] examined the energy efficiency of an air conditioning system and simultaneously assessed the comfort level. They monitored specific areas and implemented IoT intelligent control, applying suitable rules to maintain or enhance comfort while conserving energy. Additionally, some studies conducted a similar cycle of an air conditioning compressor, operating duty cycling of the compressor, and no compression during the idle period for the purpose of reducing energy at part-load conditions. The results show that implementing a duty-cycle system on the air conditioning system could reduce energy consumption by up to 17% [9,10]. Although duty-cycle systems could reduce the energy consumption of air conditioning systems, this method could cause a fluctuation in air temperature [11,12]. The temperature fluctuation could be uncomfortable for occupants inside the conditioned spaces and reduce the productivity of the occupants [13]. Consequently, the optimal utilization of the duty-cycling system should also consider the thermal comfort inside the conditioned spaces.
Air conditioning systems strongly influence the thermal comfort condition inside a building. Implementing smart HVAC system control in a building could result in the building operating optimally, which leads to the potential of energy-saving while still also providing comfortable indoor thermal conditions [14]. Thermal comfort parameters include space temperature, relative humidity, air velocity, mean radiant temperature, metabolic rate based on occupants’ activities, and clothing insulation. The thermal comfort index evaluates how all the parameters can affect the human body’s dissipation. The predicted mean vote (PMV) and predicted percentage dissatisfied (PPD) indexes are commonly used in studies to evaluate the thermal comfort level [15,16]. Therefore, as in a hot and humid climate, high levels of humidity and temperature could present thermal discomfort in a working environment, which could influence the productivity of the employees [17,18]. Balbis-Morejón et al. [19] conducted a thermal comfort analysis in a university campus building located in a tropical climate area. In order to analyze the thermal comfort of a space, they used the CBE Thermal Comfort Tool to determine the PMV and PPD values. More studies conducted thermal comfort analysis using the same tool showed that the results helped the studies to choose optimal approaches and optimization of the ventilation systems [20–23].
Moreover, a study on thermal comfort and energy-saving potential in an office building located in Taiwan with a subtropical climate by Tsay et al. [24] revealed that the air conditioning system is controlled based on the thermal comfort of which level the occupant could tolerate the thermal environment, it could reduce the energy consumption up to 9.1%. Hassan et al. [25] studied the energy performance of air conditioners while implementing the ON-time and OFF-time during the duty-cycling operation. The cycle provides the desirable thermal environment while still being able to reduce the energy consumption of the air conditioners.
Evaluation of duty-cycle control in current studies has primarily focused on reducing energy consumption, often emphasizing the control system’s efficiency. However, limited attention has been given to the broader implications of duty-cycle control, particularly its effect on thermal comfort. Key research gaps include:
• Most existing studies emphasize energy-saving outcomes rather than thermal environment performance.
• The influence of duty-cycle control on indoor thermal comfort parameters remains underexplored.
• PMV (Predicted Mean Vote) and PPD (Predicted Percentage of Dissatisfied) indices are commonly used to assess ventilation strategies but not extensively applied to duty-cycle-controlled air conditioning systems.
• There is a lack of comprehensive analysis linking duty-cycle operations with occupant thermal comfort in real or simulated environments.
Therefore, this study implements a duty-cycling mode on the air conditioning system in a small office space. While the findings may not be directly applicable to larger buildings, they provide valuable insights for smaller spaces where localized climate control is a priority. Given that smaller buildings often have limited resources for advanced HVAC management, the study’s results can offer practical and accessible energy-saving strategies for small building operators. This study utilizes the building energy management system (BEMS) to control the ON/OFF time period during the cycle. Then, this study evaluates the daily energy performance within various duty-cycling modes to identify the energy-saving potential combined with the thermal comfort analysis determining the PMV and PPD indexes. The thermal comfort analysis is conducted by using a thermal comfort tool from the CBE Thermal Comfort Model to visualize the thermal comfort zone distribution map and the ASHRAE Standard 55 Thermal Comfort Tool to determine the PMV and PPD indexes. Additionally, field measurement is conducted to collect thermal condition data to be inputted into thermal comfort tools to realize the thermal discomfort experienced by the occupants throughout the day. Data gathered through field measurements can also be utilized to assess thermal comfort levels, including PMV and PPD, aiming to reduce energy consumption while ensuring a comfortable environment for the occupants.
2.1 Duty-Cycling Operating Mode
Duty-cycling is the amount of time when the air conditioning system is providing compression and no compression during the whole operation. Basically, the duty-cycle is the ON time and OFF time of the compressor of the air conditioning system during the total period of time. The duty-cycle percentage is expressed in Eq. (1) [26]. When the duty-cycle percentage is 100%, the compressor of the air conditioning system is running all the time. Implementing duty cycling can help reduce energy consumption and operational costs by allowing the compressor to turn off periodically rather than running continuously. However, frequent cycling of the compressor can lead to increased mechanical stress, which may shorten its lifespan. Each time the compressor starts and stops, it undergoes thermal expansion and contraction, increasing wear on internal components such as the motor, bearings, and valves. Additionally, frequent start-stop cycles can lead to higher inrush currents, which may accelerate electrical component degradation.
Despite these potential drawbacks, duty cycling remains an effective strategy for improving energy efficiency, reducing peak power demand, and lowering operational expenses. Properly optimizing the duty cycle, such as adjusting cycle durations and incorporating soft-start mechanisms, can help mitigate excessive wear and extend equipment life while still achieving significant energy savings [27].
To effectively evaluate the impact of duty-cycling control, it is essential to understand the characteristics of the building’s cooling infrastructure and control systems. The case study building, with an air-conditioned area of approximately 916 m2, is equipped with a combination of two 2 RT air-cooled window-type air conditioners and three 3 RT inverter-driven split air conditioning (IDAC) units. In addition, the facility is managed by a Building Energy Management System (BEMS), which will be upgraded to an IoT-based cloud platform as part of this study to enable enhanced data monitoring and control.
This study proposed 5 different modes of duty-cycling operation which are remotely controlled by the IDAC system, as depicted in Fig. 1a. The AC indoor units operate automatically for comfort and energy savings using a module control program. A document management system (DMS) is used to monitor and record real-time data of the power consumption, voltage, current, temperature, and humidity, where the data will be relayed to the controller. The controller will convert the signals and transmit them to the individual air conditioners using the transmission control protocol/internet protocol (TCP/IP) to regulate high energy consumption, especially during peak power load. The objective of this utilization of a smart network management system is to reduce electricity consumption and demand control to lower the peak power load during the summer season. The 5 different duty-cycling mode settings are indicated in Fig. 1b. These modes were selected to evaluate energy-saving potential while ensuring thermal comfort within the spaces analyzed in the health department, administration, accounting department, and medical affairs. All cycles run for 9 h and 30 min as long as the office is scheduled in the investigated building (8:00 a.m. to 5:30 p.m.). Every OFF time in each cycle is provided the air supply from the fan, as is the detail listed in Table 1. Each mode is tested for 5 days in summer under specific conditions, where the AC temperature is set at 26°C, aligned with Taiwan’s regulation for AC temperature setting [28], and the air velocity is set at 0.2 m/s. Then, the energy consumption data will be collected to compare which duty-cycling mode is the most suitable for the investigated building. The selection of these modes is explained as follows:
(a) Mode A: 20 min ON period, and 10 min OFF period (duty cycle percentage: 67%). This mode features the lowest duty-cycle ratio, maximizing energy savings by allowing extended compressor OFF periods. It is ideal for situations where energy conservation is prioritized, and slight indoor temperature fluctuations are acceptable.
(b) Mode B: 22 min ON period, and 8 min OFF period (duty cycle percentage: 73%). This mode offers a balanced approach by reducing OFF time compared to Mode A, improving temperature stability while still achieving energy savings. It is expected to provide better thermal comfort and serves as a compromise between energy efficiency and occupant comfort.
(c) Mode C: 25 min ON period, and 5 min OFF period (duty cycle percentage: 83%). Mode C prioritizes thermal comfort by extending AC operation and minimizing OFF periods, making it suitable for high-occupancy or temperature-sensitive spaces. While it consumes more energy, it is expected to have a balanced trade-off between comfort and energy efficiency.
(d) Mode D: 28 min ON period, and 2 min OFF period (duty cycle percentage: 93%). This mode emphasizes maximum thermal comfort with minimal OFF periods, making it ideal for spaces requiring consistent temperature control. While it ensures near-continuous cooling, it results in higher energy use and potential compressor wear, prioritizing comfort over efficiency.
(e) Mode E: 30 min ON period, and 10 min OFF period (duty cycle percentage: 74%). Mode E combines long ON and OFF periods to strike a balance between energy savings and comfort. It aims to maintain stable temperatures during ON cycles while reducing compressor wear, making it suitable for testing the effectiveness of extended cycles on comfort and equipment longevity.
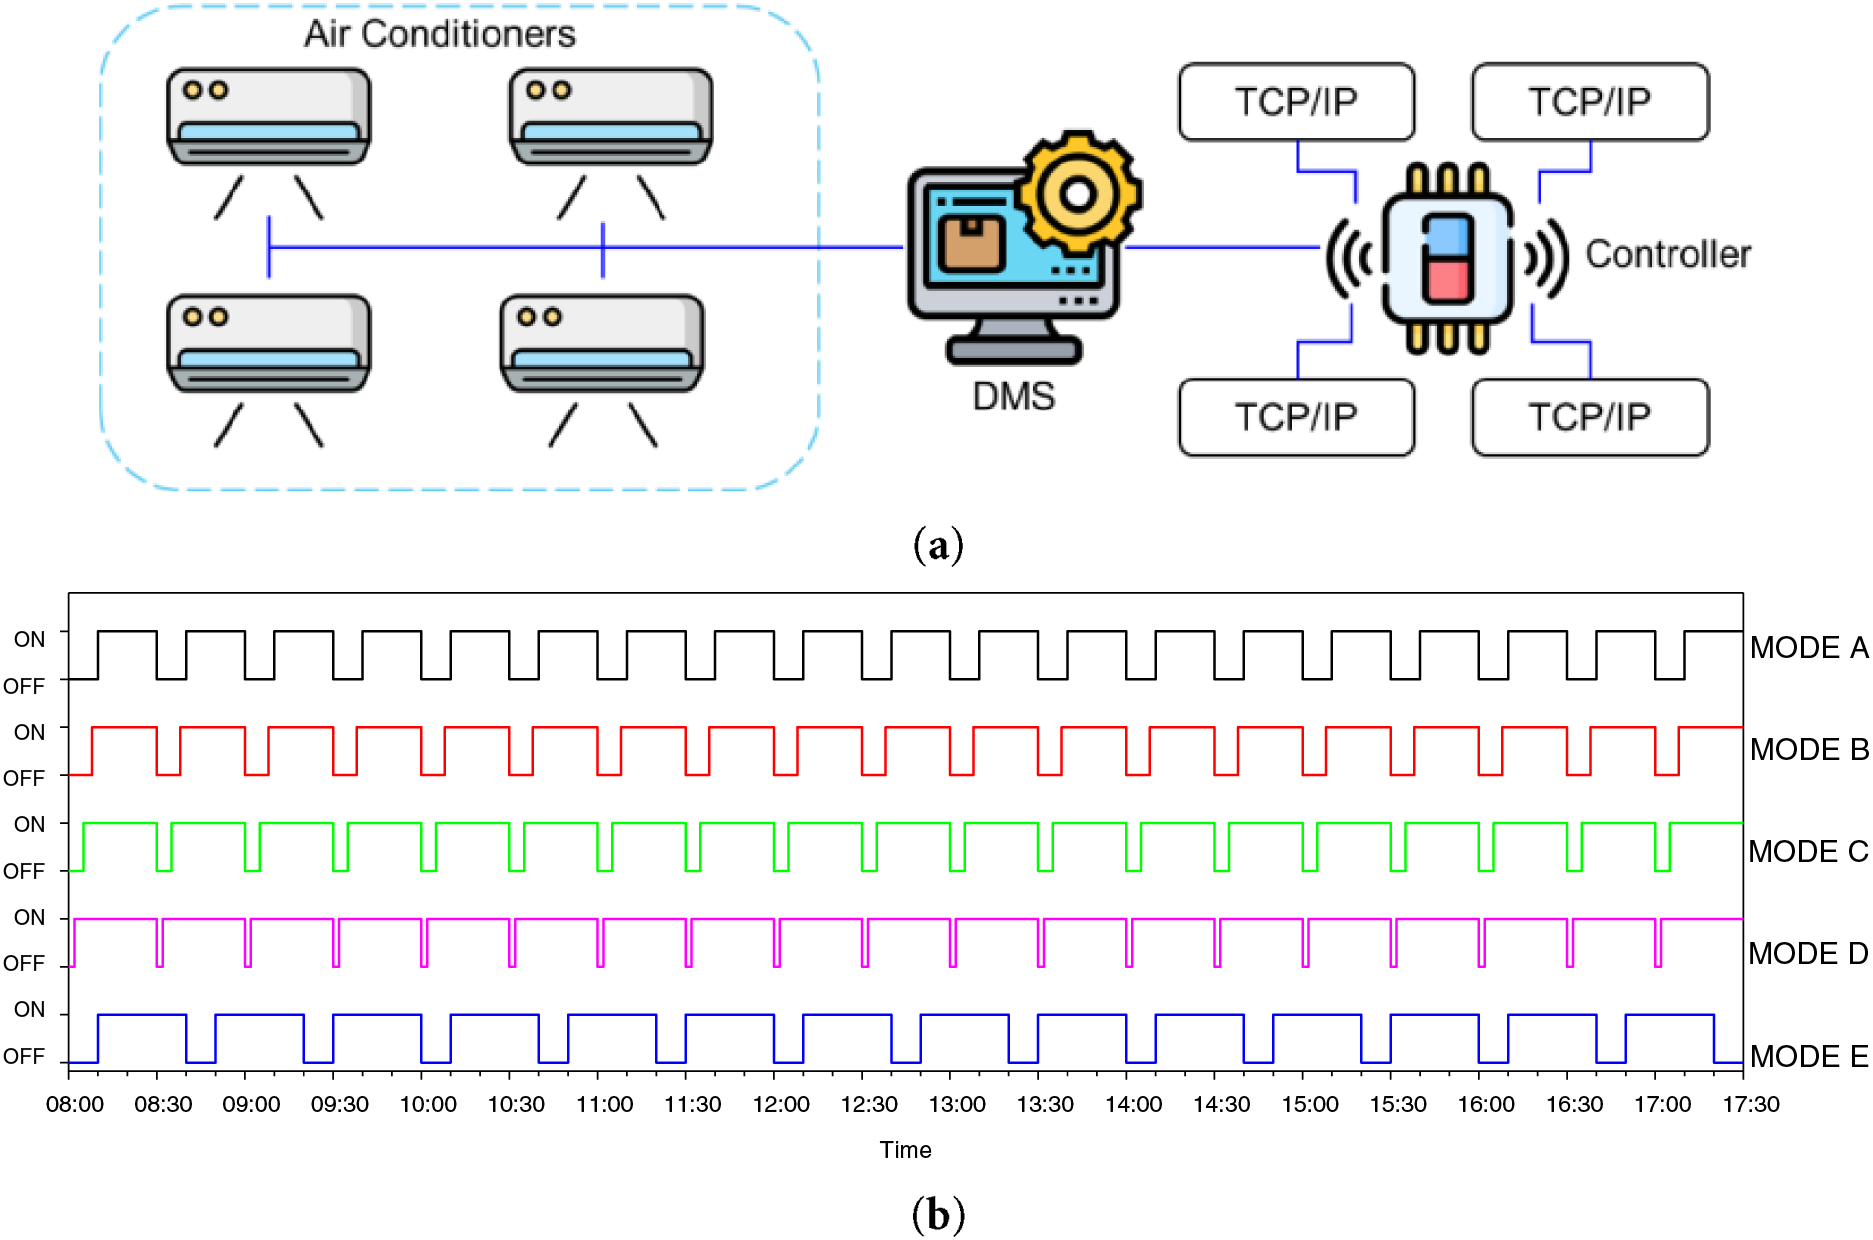
Figure 1: Duty-cycling operation, (a) HVAC control system, (b) duty-cycling modes
This study focuses on the office departments inside a medical building. The building is mainly used as an office building for a public health center, which was chosen to reflect real-world conditions in smaller office spaces. These spaces often rely on simple, localized air conditioning solutions rather than complex centralized HVAC systems. By focusing on such a setting, the study aims to explore the effectiveness of duty cycling in a context that is more relevant and accessible to small building operators seeking energy-efficient cooling strategies. The total gross floor area of the building is 1374 m2, accommodating 120 people. The area investigated in this study is in the office departments, including the Health Department, Administration, Accounting, and Medical Affairs. The layout of each department is illustrated in Fig. 2a, in which the health department, administration, and accounting are located on the first floor. In contrast, the medical affairs office is located on the second floor. This building operates for 9 h and 30 min daily on weekdays, during which occupants primarily work within their designated office spaces. The occupancy pattern is relatively stable, with employees engaging in desk-based tasks, meetings, and administrative duties throughout the operational hours, which directly influences indoor environmental conditions and AC usage.

Figure 2: The investigated building, (a) building layout, (b) weather conditions [30]
The building is located in Changhua, Taiwan. Changhua is located in the central part of Taiwan. Taiwan’s climate is categorized as hot and humid climate, falls in Climate Zone 2A according to ASHRAE Standard 169 [29]. The outdoor condition in Changhua in 2023 by the government meteorological research and forecasting institution in Taiwan, Central Weather Administration (CWA) [30], is indicated in Fig. 2b. The average monthly temperature in Changhua ranges between 26.4°C to 29.3°C during summer, with the highest record at 35.9°C. The lower average during winter ranges between 17.5°C and 23.1°C. Meanwhile, the outdoor conditions remained humid, with the relative humidity ranging from 68% to 79% throughout the year. This climate condition causes the reliance on air conditioners to be rather high in Taiwan.
The building materials properties used to construct the building are listed in Table 2. The exterior wall uses a ceramic tile wall façade, which is commonly used in Taiwan to deal with its hot and humid conditions [31]. Ceramic tile wall façades are the most advantageous cladding solution for hot and humid environments compared to common concrete exterior walls [32]. Moreover, a study by Carlini et al. [33] showed that ceramic coatings on building exteriors can reduce energy expenditure by decreasing heat losses. The findings revealed that adding a ceramic coating to the building envelope can reduce heat losses by up to 42% compared to traditional wall configurations and can reduce thermal variation by 31%–40% in existing buildings with internal insulation or coatings. Other materials used in the investigated building are common types of building envelopes. The window is single-glazed with a U-value of 5.8 W/m2K and a solar heat gain coefficient of 0.81.
The field measurement is conducted simultaneously, recording and uploading the collected data in the designated BEMS and IoT cloud. Power consumption is recorded every minute, and simultaneous air velocity measurements are taken at each air outlet, representing the perceived air velocity at the sitting height of occupants (approximately 1 m above the ground). In contrast, the air velocity of the fan is set to 0.2 m/s. Additionally, temperature and humidity recorders are strategically positioned in each department, specifically in areas where occupants are most active. The data is collected every 5 min to assess the thermal comfort conditions experienced throughout the day. The field measurement was conducted during the summer season, with each duty-cycling mode running for five days during weekdays in a month, including the normal operating mode. The field measurement process is depicted in Fig. 3a.
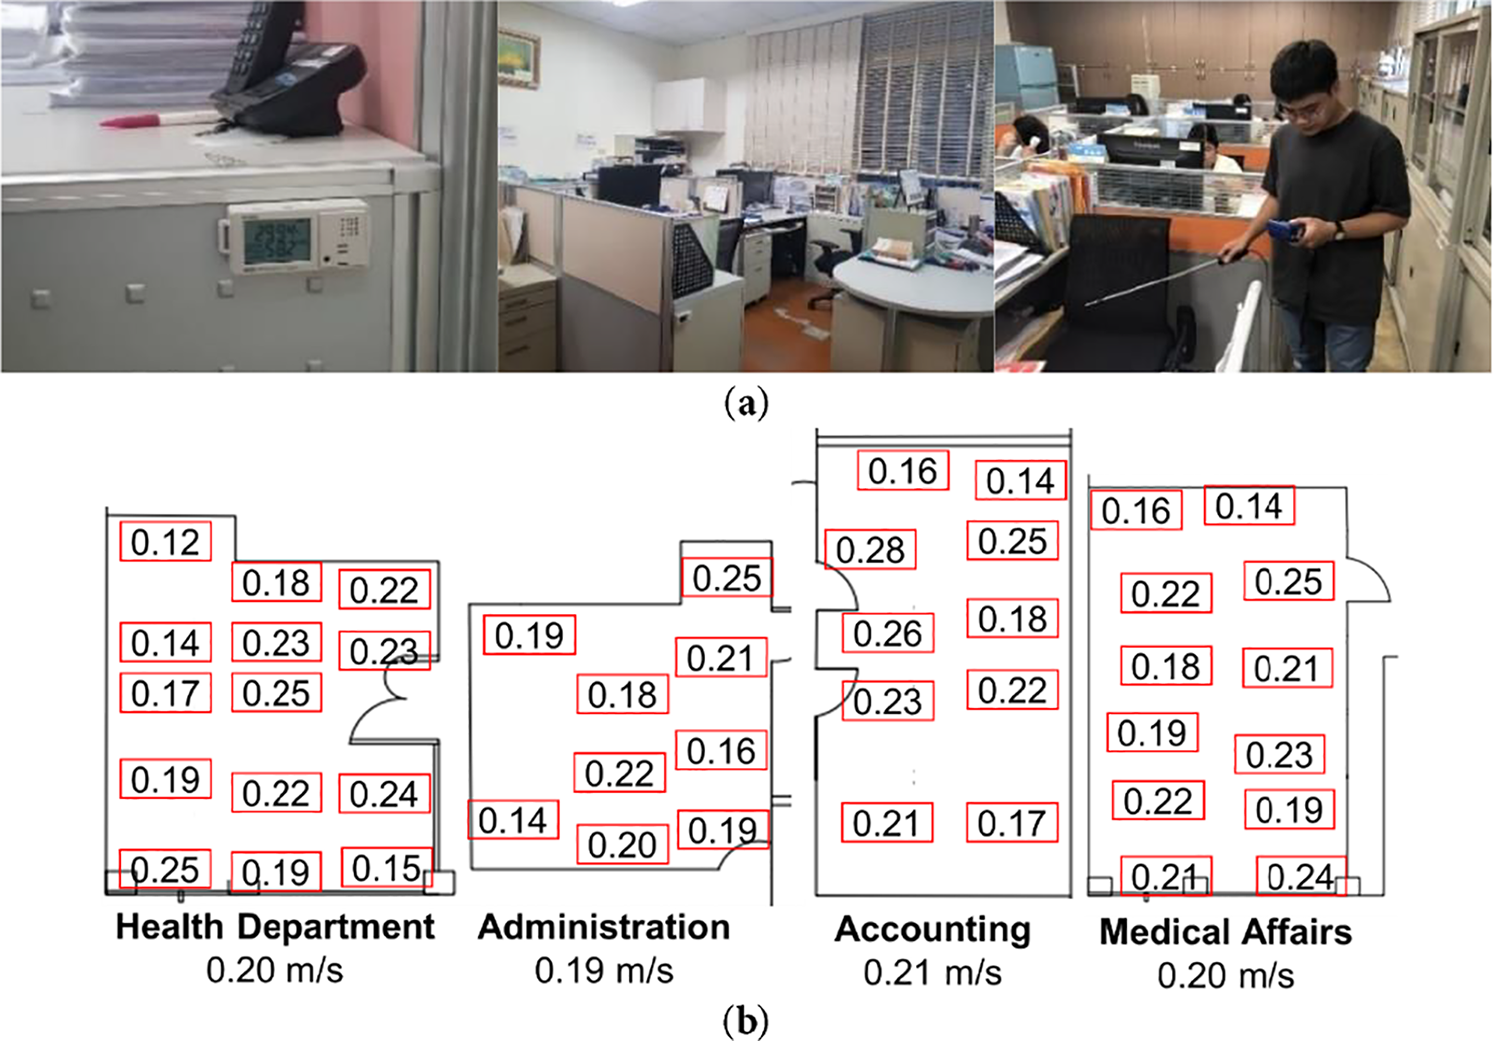
Figure 3: Field measurement, (a) air velocity measurement, (b) results of measurement points
Air velocity measurements are taken at various points, as illustrated in Fig. 3b, with a focus on occupants’ primary activity areas, such as working desks, to better evaluate their thermal environment. The figure presents the average air velocity recorded at each measurement point. The average air velocity in the health department is 0.20 m/s, in the administration department is 0.19 m/s, in the accounting department is 0.21 m/s, and in the medical affairs department is 0.20 m/s. Due to the continuous variation in wind direction from the circulating fan, the measured wind speed is averaged at 0.20 m/s.
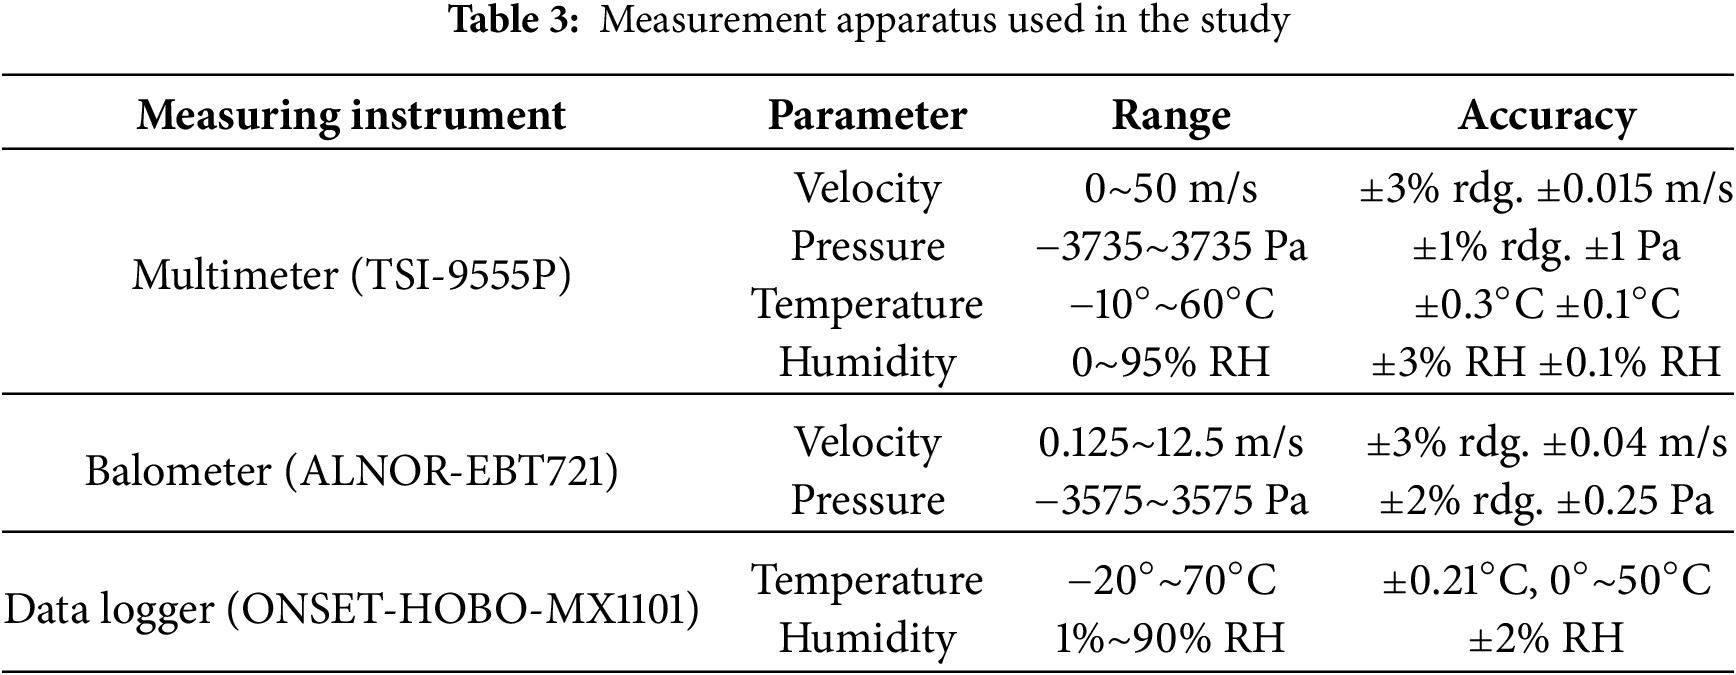
Table 3 summarizes the measurement instruments and their specifications used in this study. Three types of equipment were employed: a multimeter (TSI-9555P) for measuring air velocity, pressure, temperature, and humidity; a balometer (ALNOR-EBT721) for airflow and pressure verification; and a data logger (ONSET-HOBO-MX1101) for continuous temperature and humidity monitoring. The instruments offer high measurement accuracy, with air velocity readings as precise as ±0.015 m/s and temperature accuracy up to ±0.1°C, ensuring reliable data collection throughout the experimental period.
2.4 Thermal Comfort Evaluation
After the field measurement, the collected data is then inputted into the thermal comfort calculation tools. The study utilized the ASHRAE Standard 55 Comfort Model thermal comfort calculation software developed by the American Air Conditioning Association (ASHRAE) [34]. The software incorporates six thermal comfort parameters, including air temperature, mean radiant temperature, air velocity, humidity, metabolic rate, and clothing insulation. These parameters are input into the software, which calculates the Predicted Mean Vote (PMV) and Predicted Percentage of Dissatisfied (PPD). The results are then compared with the ASHRAE Standard 55 [34] to determine compliance with the established standards.
Furthermore, the University of California, Berkeley’s Center for the Built Environment (CBE) provides an online version of the Thermal Comfort Tool [35]. This tool follows the same usage and parameter-setting approach as the ASHRAE Standard 55-2020 Comfort Model. However, what sets apart the CBE Thermal Comfort Tool from ASHRAE is its presentation of the comfort zone on a psychrometric diagram. This diagram is based on input environmental factors and individual details like metabolic rate according to activity and clothing insulation based on clothing amount. This tool also signifies the comfort zone distribution map and the current state point. If the state point falls outside the comfort zone, it signifies discomfort in the given conditions.
In order to comply with ASHRAE 55 [34], the recommended thermal limit on the 7-point scale of PMV is between −0.5 and 0.5. ISO 7730 [36] expands on this limit, giving different indoor environments ranges. ISO defines the hard limit as ranging between −2 and +2, for existing buildings between −0.7 and +0.7, and for new buildings ranging between −0.5 and +0.5. According to ISO 7730 [36], the calculation equation of PMV is indicated in Eq. (2) [37].
The indoor microclimatic data environment includes PMV to calculate PPD value in accordance with the standard ISO 7726 [38], as indicated in Eq. (3). The PPD can range from 5% to 100%, depending on the calculated PMV. These comfort values will vary depending on where the occupant is located in the building. In order for comfort ranges to comply with standards, no occupied point in space should be above 20% PPD. However, because most people can tolerate a PPD percentage of up to 20%, the remaining persons can experience 10% dissatisfaction based on overall physical discomfort [34].
All the equations signify that the metabolic rate and clothing insulation also affect the overall thermal comfort level. Therefore, not only will the measured thermal condition be inputted into the thermal comfort calculation tool, but the metabolic rate and the clothing insulation will also be inputted. In this study, the investigated spaces are primarily used as office environments, where the occupants are adults engaged in typical desk-based tasks. This study was carried out during the summer in Taiwan, where occupants primarily wore standard indoor summer clothing, such as trousers and short-sleeve shirts, with an insulation value of approximately 0.50–0.57 clo, as outlined in ASHRAE Standard 55. Likewise, the main activities in the office spaces consisted of seated tasks, including computer work, with an estimated metabolic rate of about 1.2 met (70 W/m2), also aligning with ASHRAE Standard 55 [34]. However, thermal comfort thresholds may shift in different climate regions due to physiological and psychological adaptation, emphasized that regional and seasonal differences must be accounted for, as thermal tolerance and comfort ranges differ between tropical and temperate populations [39]. In this study, the environmental condition data, such as temperature, relative humidity, and air velocity, are collected in each department throughout the operations of all duty cycling modes, including the normal mode as the baseline case. This data will later be used to evaluate the PMV and PPD level in the facility through the ASHRAE Standard 55 Comfort Model thermal comfort calculation software and the CBE Thermal Comfort Tool.
In this section, this study will describe the results of energy consumption, temperature, relative humidity, and thermal comfort level, including thermal comfort zone, PMV, and PPD. The results will be divided by each mode, including normal operating mode and 5 different duty-cycling modes. The normal operating mode is when the air conditioning system is running all the time. On the contrary, duty-cycling mode sets the air conditioning ON/OFF times and adds the air supply from the fan during the OFF time. The ON/OFF times are set differently in each duty-cycling mode. The air conditioning time in duty-cycling mode A is ON for 20 min and OFF for 10 min. In duty-cycling mode B, the ON time is 22 min, and the OFF time is 8 min. Then, the ON time in duty-cycling mode C is set for 25 min and the OFF time is set for 5 min. In duty-cycling mode D, the ON time is set for 28 min, but the OFF time is set shortly for 2 min. Lastly, in duty-cycling mode E, the ON time is the longest at 30 min, and the OFF time is also long, set to 10 min. The comparative results of all duty-cycling modes, including the normal operating mode, will be evaluated to determine which mode has the highest energy-saving potential while also providing optimal thermal comfort levels for occupants.
Under normal operating conditions, where the air conditioning is ON during the operating hours, it will consume more energy than the duty-cycling modes. The total energy consumption is recorded at 2021.93 kWh/month, with an average daily energy consumption of 87.92 kWh/day. Table 4 lists the energy consumption and thermal conditions that result from operating normally. The Medical Affairs department has the highest energy consumption, with a value of 39.41 kWh daily, considering this department has the largest room area compared to other departments. Meanwhile, the lowest energy consumption is recorded in the accounting department, with a value of 11.52 kWh daily, where the activity inside this room is less open to the public.
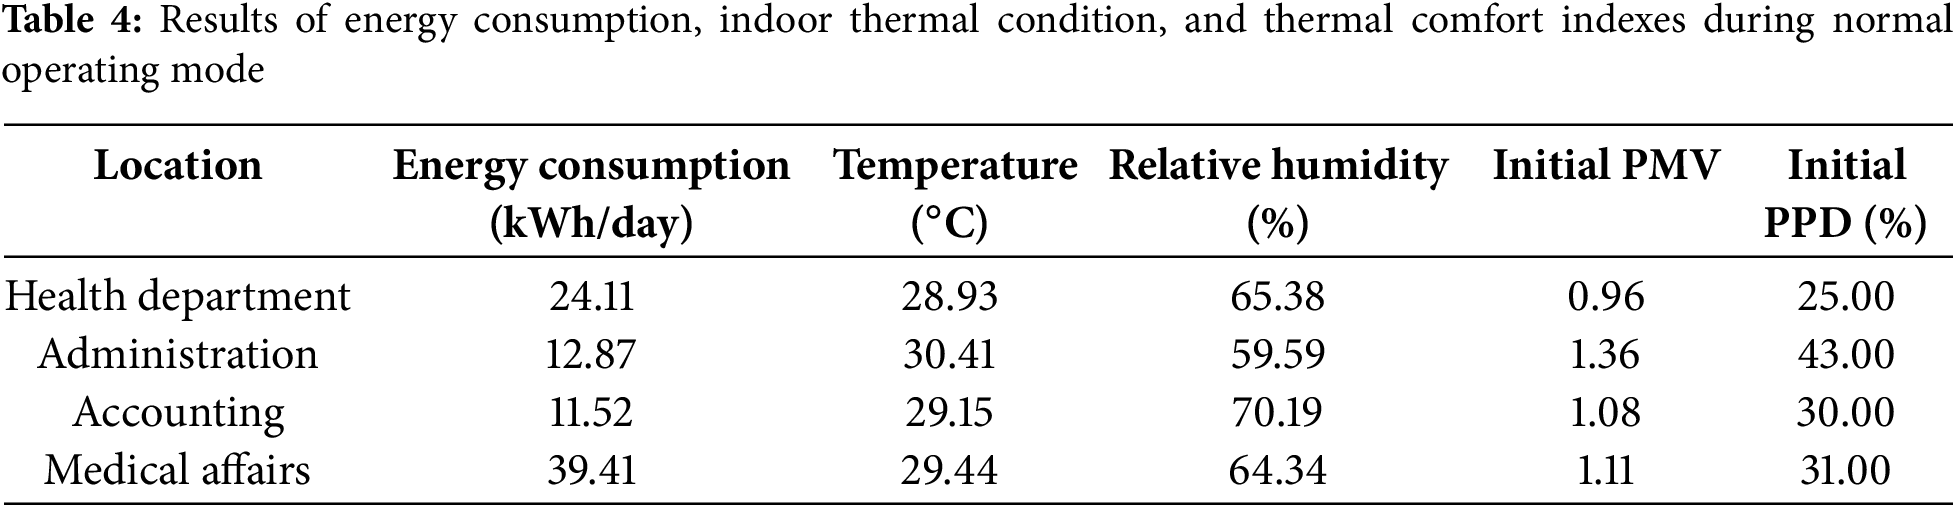
Even though the air conditioning system under normal operating mode is ON all the time during the operating hours of the building, the results of the thermal conditions are relatively high. The highest temperature in the Administration department is 30.41°C, and the relative humidity is recorded at 59.59%. The thermal comfort index calculation results for the Administration department are the highest among other departments, with a PMV value of 1.36 and a PPD value of 43%. The results mean the occupants felt uncomfortable because of the hot conditions inside the Administration department. The PPD showed how much the occupants felt dissatisfied with the thermal conditions. The slight temperature difference is found in Accounting and Medical Affairs, where the temperatures are recorded at 29.15°C and 29.44°C. Despite the slight temperature difference, the relative humidity results are significantly different, with a value of 70.19% in the Administration Department and 64.34% in Medical Affairs. However, the thermal comfort index results are similar in both departments. The PMV is 1.08, and the PPD is 30% for the accounting department. Meanwhile, the PMV is 1.11, and the PPD is 31% for Medical Affairs. The lowest temperature in the Health Department is found, reaching 28.93°C, with the relative humidity recorded at 65.38%. The thermal condition in the Health Department results in lower thermal comfort index results, with a PMV value of 0.96 and a PPD value of 25%. However, the thermal comfort level for PMV or PPD still exceeds the acceptable standard. The relationship between temperature and relative humidity inside a space influences the thermal comfort level. The relative humidity inside each department also plays a significant role in contributing to thermal discomfort. High relative humidity means a high moisture level in the air; combined with the high temperature, the occupants will feel hot and humid. Therefore, in the duty-cycling mode, during the OFF time, it will provide air supply from the fan to increase the air change and recirculate the cooled air by the air conditioners during the ON time. This method will reduce the energy consumption of air conditioning systems and improve the thermal performance inside the spaces.
Duty-cycling mode A ran the AC system operating for 20 min, then turned off for 10 min while simultaneously supplying air from a fan, with the duty-cycling running for about 9 and a half hours. Power consumption throughout the day is indicated in Fig. 4a. The fluctuation pattern is found in the daily AC power consumption due to the pattern of duty cycling mode. During duty-cycling mode A, the power consumption throughout the day fluctuates less than in the normal running mode without duty-cycling, which means the AC system consumes less energy in duty-cycling mode A. The total energy consumption during duty-cycling mode A is 1197.20 kWh/month, with a daily average of 59.86 kWh/day. These results showed that duty-cycling mode A reduces energy consumption by 824.73 kWh/month compared to the normal operating mode.
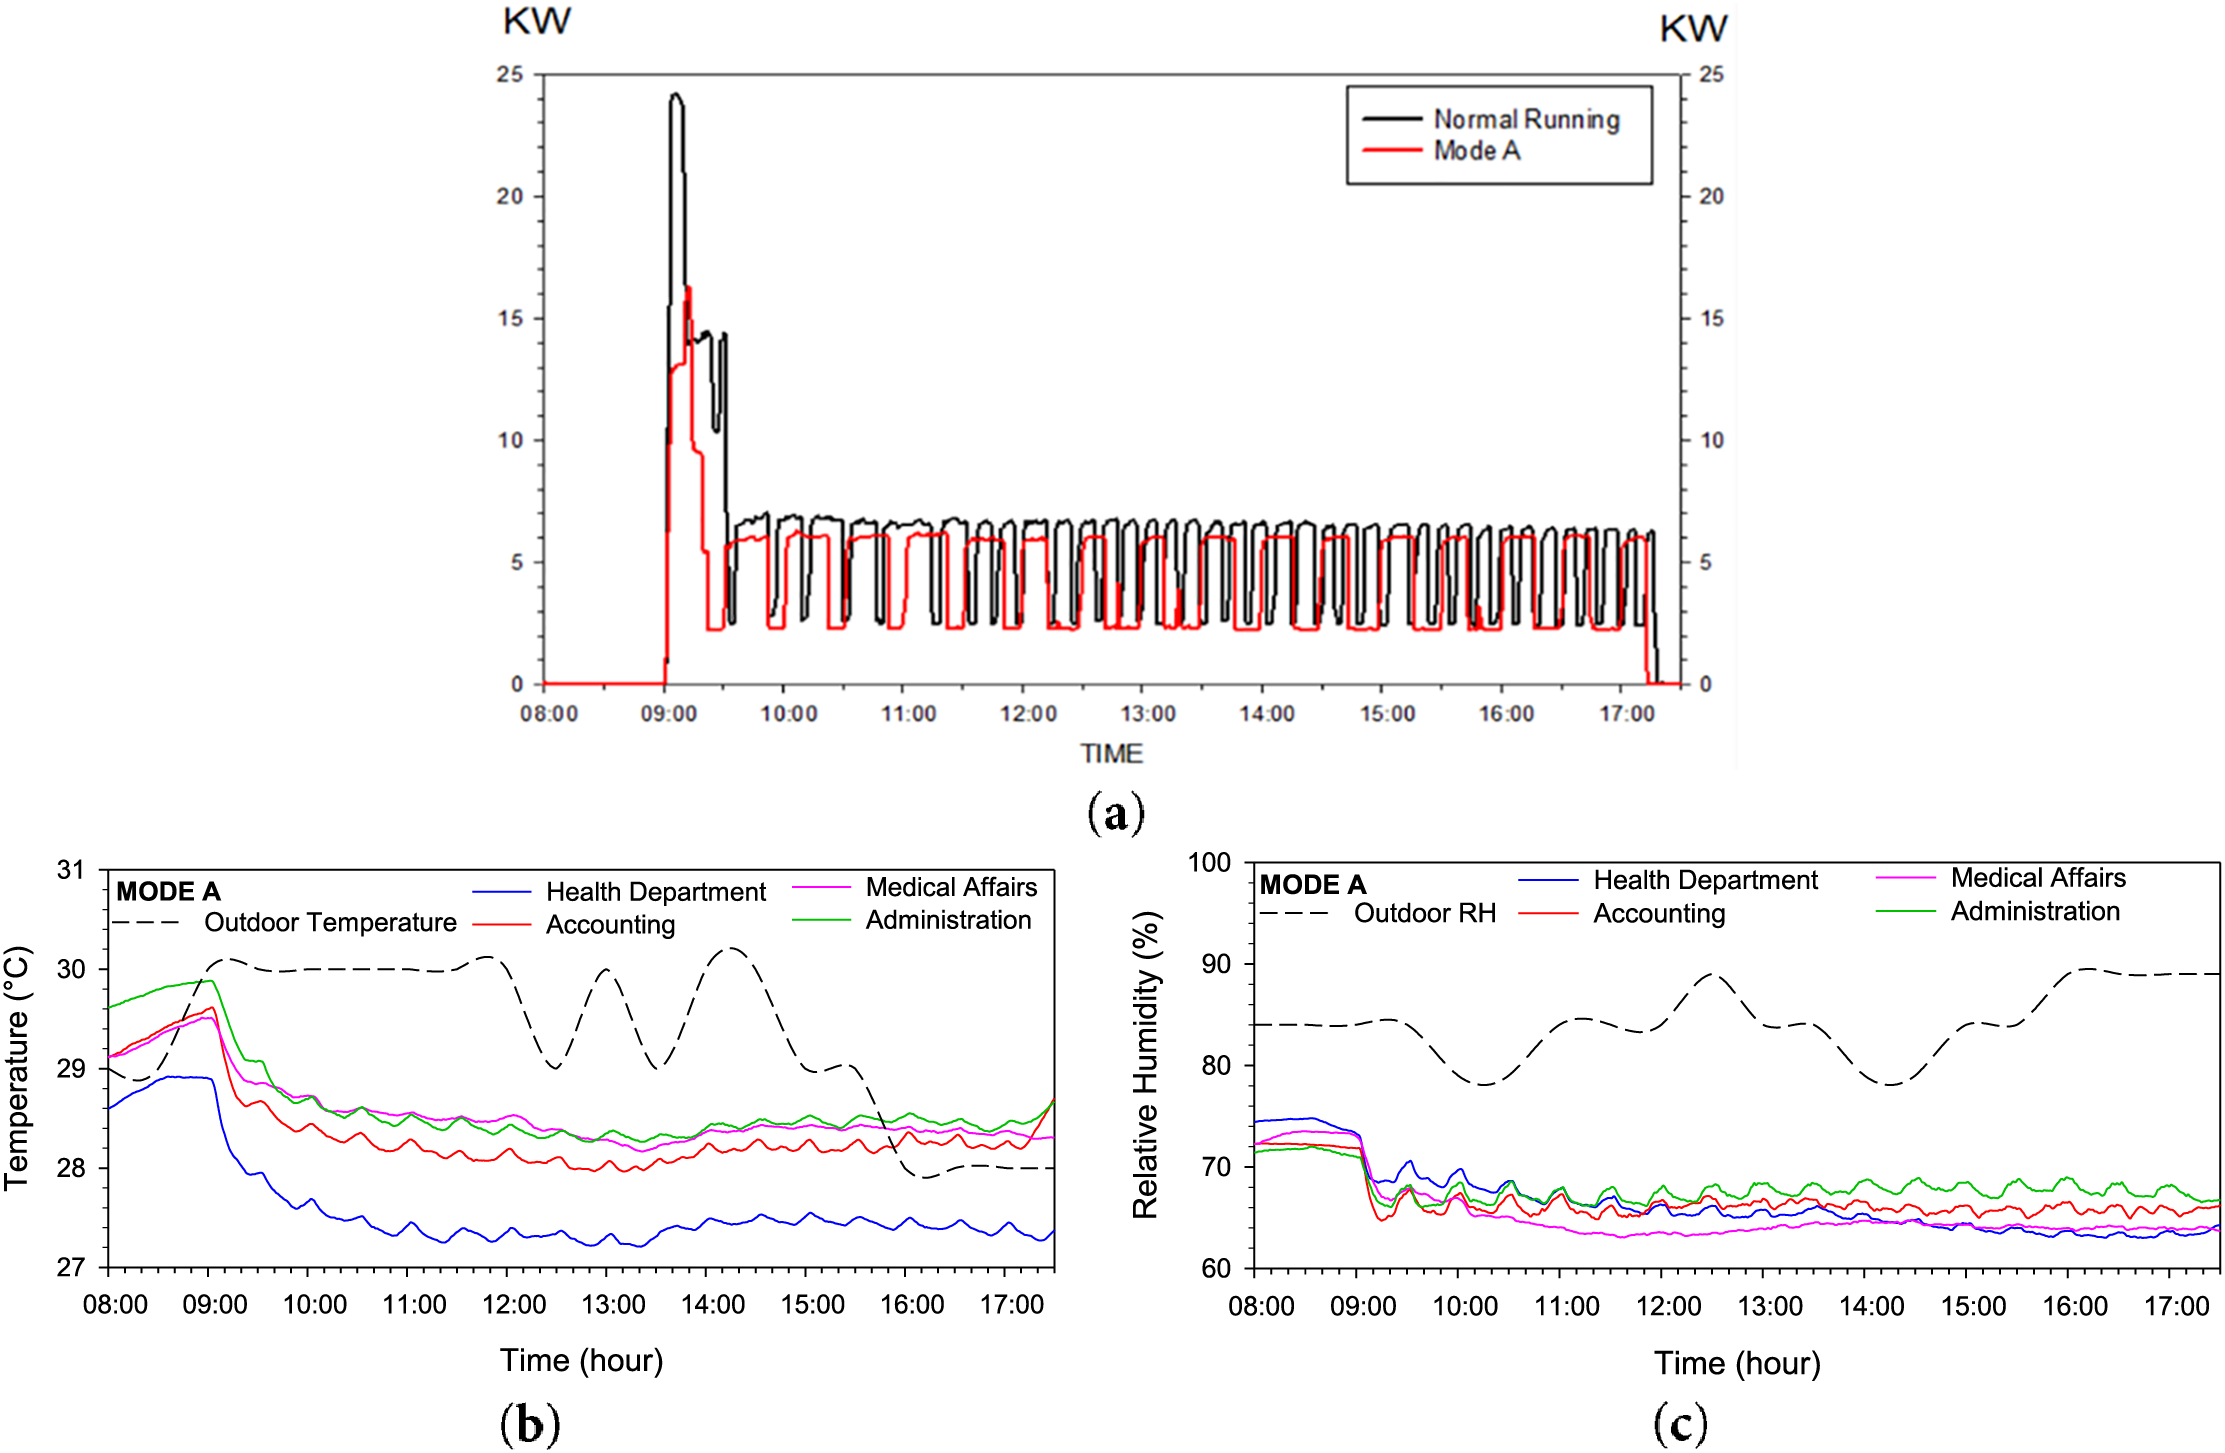
Figure 4: MODE A: (a) power consumption, (b) temperature, (c) relative humidity
However, the fluctuation pattern could also affect the indoor temperature and relative humidity conditions during duty-cycling mode A. It is revealed in Fig. 4a that the indoor temperature is slightly fluctuating following the duty-cycling pattern in mode A despite the daily outdoor temperature being mostly warmer. However, the indoor temperature is maintained between 27°C and 28°C in all investigated spaces, although the highest indoor temperature is recorded in the administration and medical affairs offices. Meanwhile, a slight fluctuation is also recorded in the relative humidity data throughout the day during the operation of duty-cycling mode A, as seen in Fig. 4b. While there is a high relative humidity outside the facility (76%–92%), the indoor relative humidity remains high, ranging between 62%–70%, despite the duty-cycling operation. Considering the indoor temperature is also high, the occupants inside the facility might feel thermal discomfort during the duty-cycling mode A operation.
Moreover, the thermal comfort in the facility is also analyzed. Fig. 5a shows that the measured temperature and relative humidity during office hours mostly fall outside the thermal comfort zone in the distribution map, with the highest recorded temperature exceeding 30°C. Additionally, Fig. 5b reveals that the average temperature in each department remains relatively high, leading to discomfort among occupants. The Medical Affairs department has the highest average daily temperature, reaching 27.84°C. Although the Accounting department does not have the highest average daily temperature, it experiences the highest relative humidity, which can contribute to an even greater feeling of discomfort. Furthermore, the PMV value in the accounting department is the highest at 0.59, although the differences among departments are relatively small. This thermal discomfort could be influenced by the operating pattern of duty-cycling mode A, where the air conditioner runs for 20 min before turning off for 10 min while a fan continues to circulate air. This cycle is maintained throughout the day to optimize energy consumption while still providing a degree of thermal comfort. However, the intermittent cooling period may lead to temperature fluctuations and reduced air movement effectiveness, affecting occupants’ perception of comfort (Fig. 4b). The length of each cooling and fan-only phase likely impacts the ability to maintain stable indoor temperatures, potentially contributing to the observed discomfort. Despite this, the PPD values in all departments remain within the acceptable range, indicating that while thermal comfort is not optimal, it is still managed within tolerable limits under this energy-saving strategy.
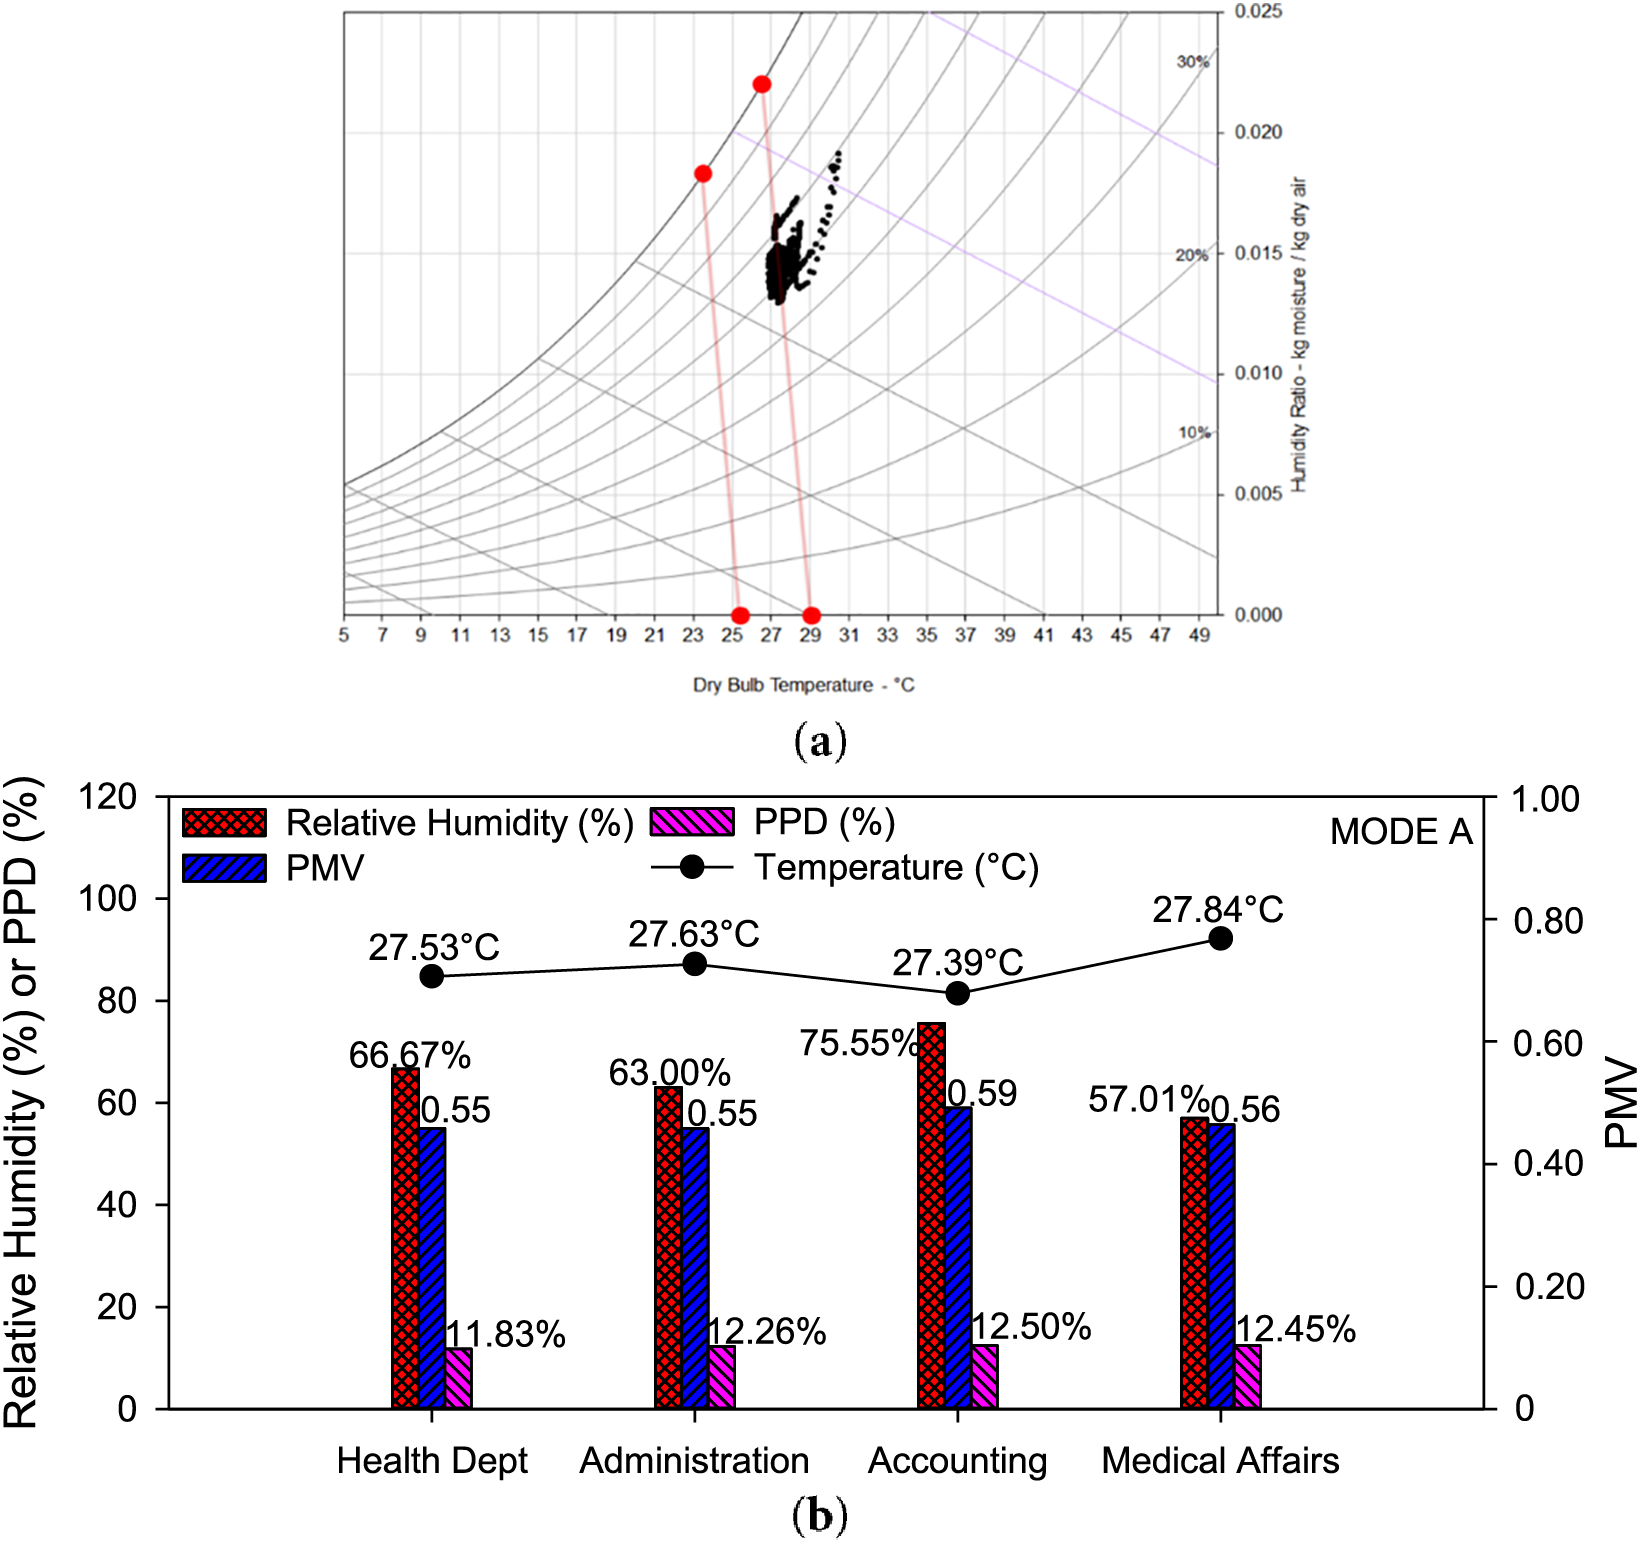
Figure 5: MODE A: Thermal comfort indexes, (a) distribution map, (b) PMV and PPD
In duty-cycling mode B, the AC system will be turned on for 22 min and turned off for 8 min while also supplying air movement by fans into the investigated spaces. Duty-cycling mode B energy consumption is shown in Fig. 6a. Moreover, the energy consumption in normal mode fluctuates more than the results of energy consumption in duty-cycling mode B. Overall, the energy consumption of duty-cycling mode B is 1536.17 kWh/month, and the daily average is 66.78 kWh. This mode has reduced 485.76 kWh/month energy consumption of the normal operating mode without duty-cycling. The indoor temperature and relative humidity are recorded by the temperature and humidity logger placed in the investigated spaces every minute, which are compared to the outdoor conditions. After around an hour, the indoor temperature condition slowly decreased and maintained at between 27°C–29°C, although there was a slight fluctuation due to the duty-cycling operation. The highest indoor temperature is recorded in the health department, as indicated in Fig. 6b. Similarly, the indoor relative humidity slowly decreased and maintained below 70% after an hour, as indicated in Fig. 6c. Despite having the highest indoor temperature, the health department has the lowest relative humidity recorded during duty-cycling mode B operation. Given the combination of high indoor temperatures and relative humidity, occupants may experience thermal discomfort during the operation of duty-cycling mode B.
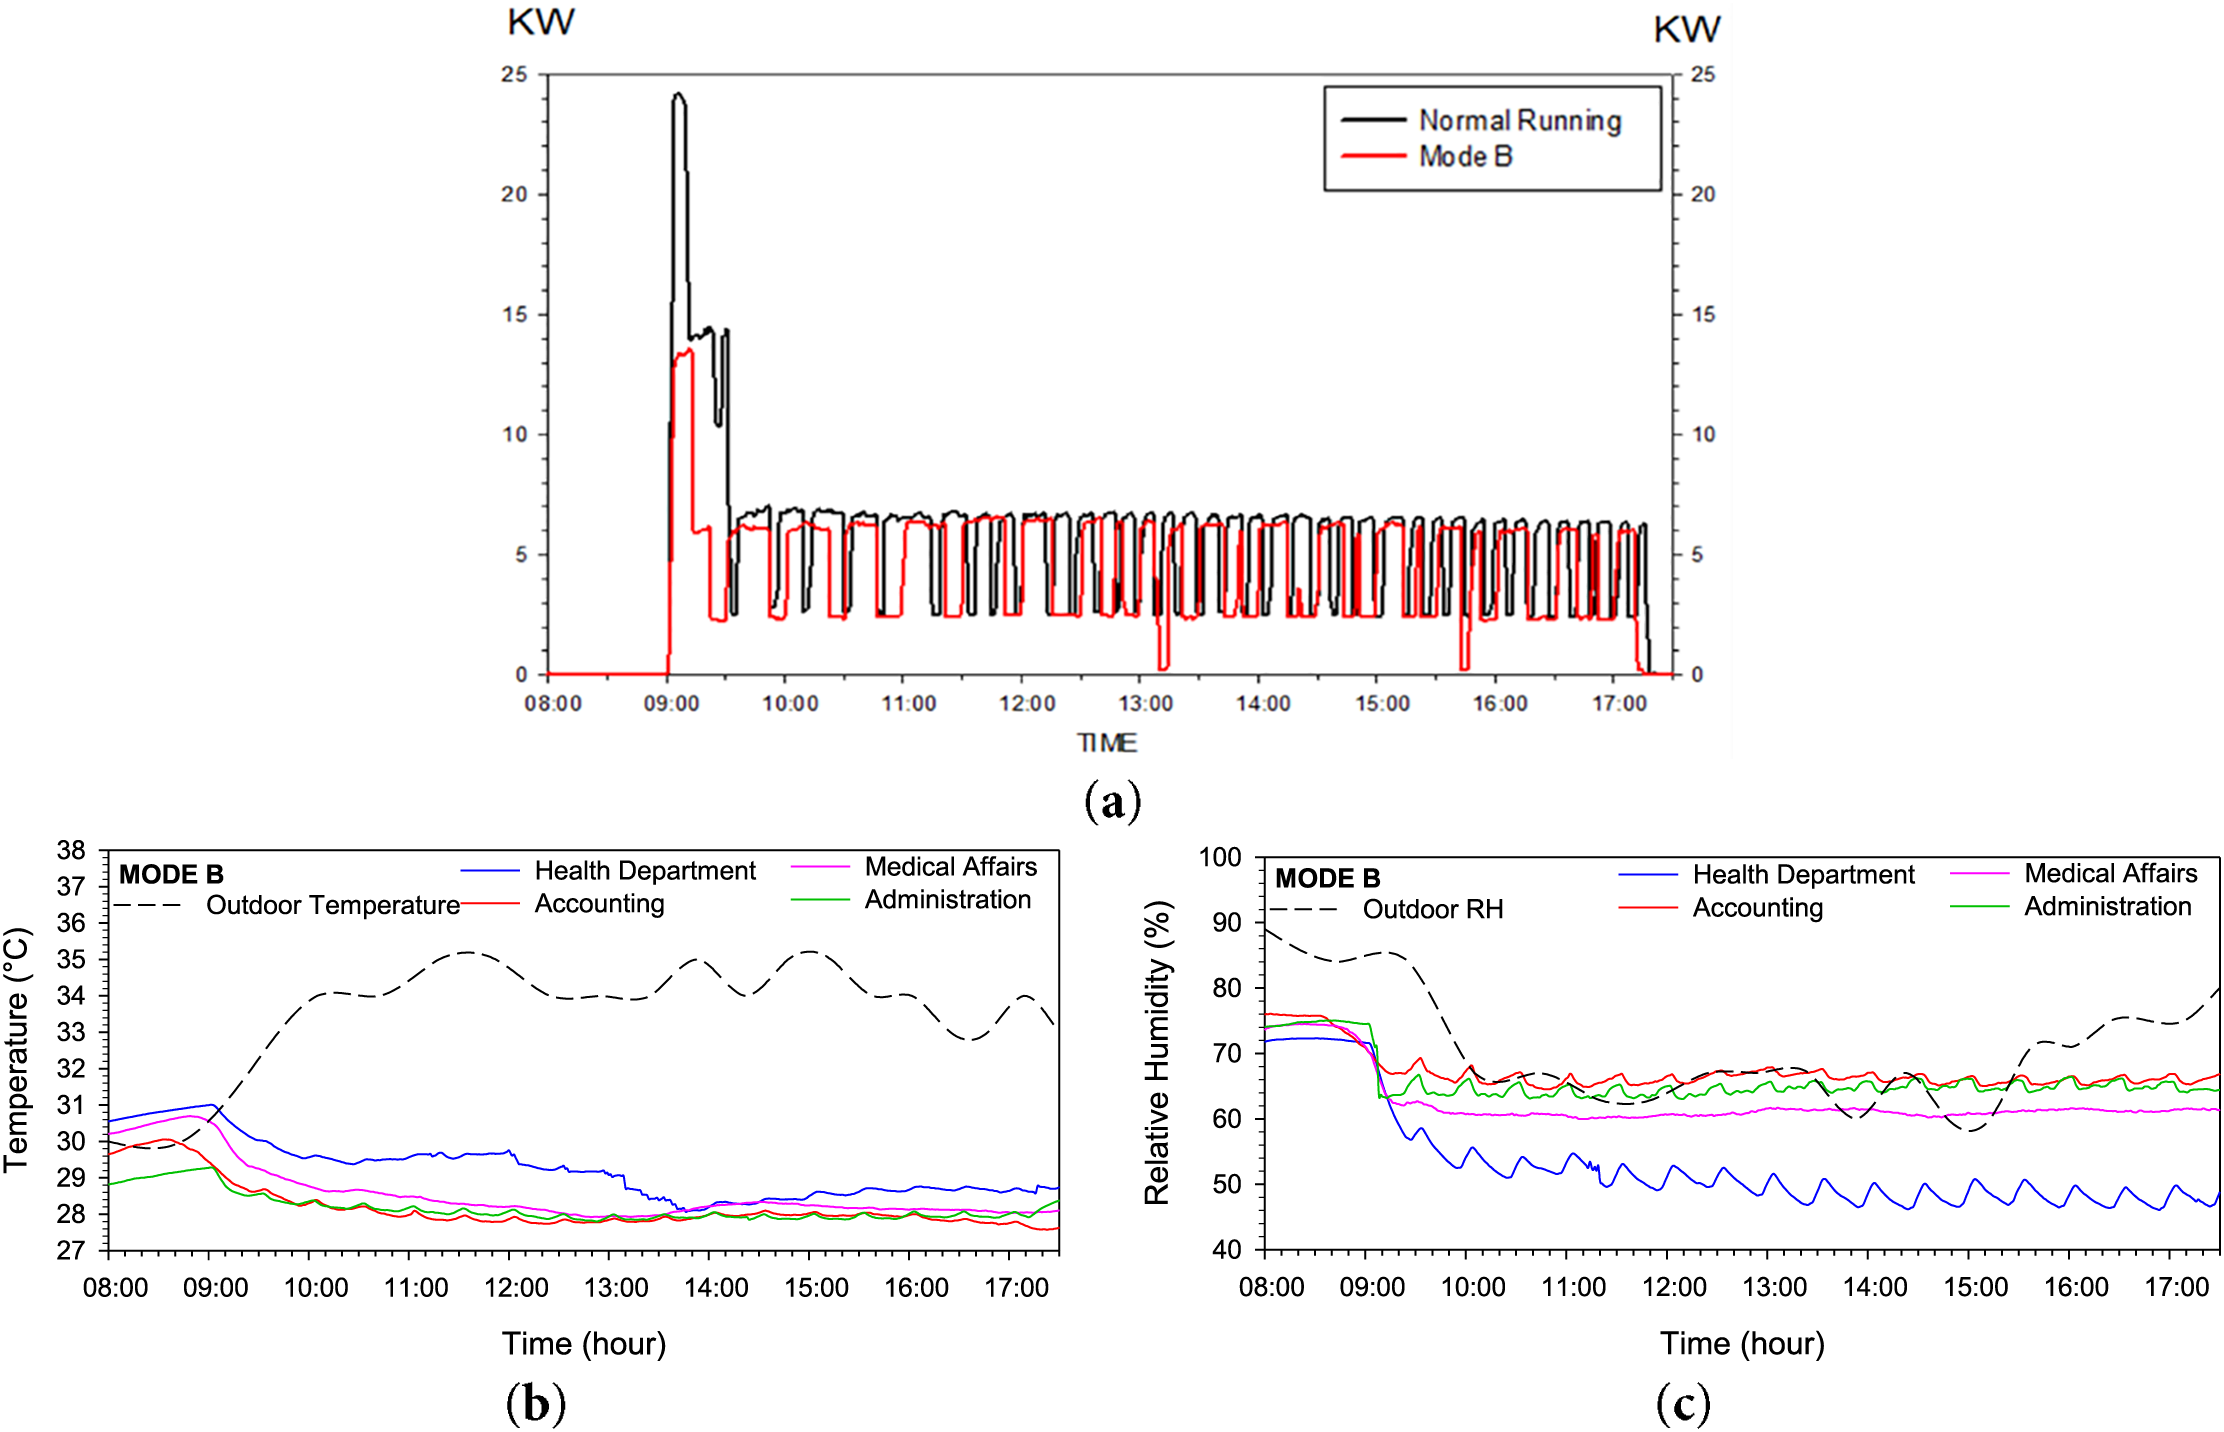
Figure 6: MODE B: (a) power consumption, (b) temperature, (c) relative humidity
Furthermore, a thermal comfort analysis for occupants was conducted. Fig. 7a presents the thermal comfort zone distribution map during duty-cycling mode B, revealing that thermal discomfort persists in certain conditions, with the highest recorded temperature exceeding 30°C. Similarly, Fig. 7b shows that the thermal comfort levels in duty-cycling mode B remain suboptimal. As in the previous mode, the PMV values exceed 0.5, indicating that occupants experience slight thermal discomfort. Although the PPD values remain below 15%, they range between 11.54% and 13.27%, which is slightly higher than those observed in mode A. The highest average daily temperature is recorded in the Health Department at 27.80°C, while the Accounting Department experiences the highest average daily relative humidity at 66.93%.

Figure 7: MODE B: Thermal comfort indexes, (a) distribution map, (b) PMV and PPD
This thermal comfort condition could be influenced by the operational characteristics of duty-cycling mode B, in which the air conditioner operates for 22 min before turning off for 8 min while a fan continues circulating air. This cycle is designed to enhance energy efficiency while still providing cooling, yet the intermittent nature of the cooling period may contribute to temperature fluctuations and variations in air movement, impacting occupants’ comfort (Fig. 6b). The slightly longer cooling duration compared to mode A may help maintain a more stable indoor temperature, but the recurring off-cooling phase could still lead to perceptible thermal variations. Even though this mode significantly reduces energy consumption, the thermal comfort level does not fully meet acceptable standards, highlighting the need to further consider occupants’ satisfaction in optimizing the duty-cycling strategy.
In duty-cycling mode C, the air conditioning system operated for 25 min, followed by a 5-min off period, during which a fan supplied air. The energy consumption results of duty-cycling mode C are depicted in Fig. 8a. Similarly, the energy consumption in this mode fluctuates less than the normal operating mode, resulting in less energy consumed daily. The total energy consumption was reduced from 2021.93 kWh/month to 1463.70 kWh/month, and the daily average of energy consumption in this mode is 69.70 kWh/day. The indoor temperature and relative humidity during this mode were collected and compared to outdoor conditions. Even though outdoor temperatures were generally warmer throughout the day, Fig. 8b shows that the inside temperature varied slightly in response to the duty-cycling pattern. Despite these fluctuations, the indoor temperature across all spaces remained between 26.8°C and 27.6°C, with the highest temperatures observed in the administration and medical affairs offices. Fig. 8c shows a similar slight fluctuation in indoor relative humidity throughout the day. While outdoor relative humidity was significantly high (72%–92%), the indoor relative humidity remained elevated, ranging between 55% and 60%, despite the duty-cycling operation. However, the relative humidity in the administration room seems to be higher than the rest of the investigated space, mostly maintained at 65%, which can affect thermal comfort. Although, the combination of indoor temperatures and relative humidity conditions during duty-cycling mode C operation might make the occupants feel more comfortable than during mode A and mode B.
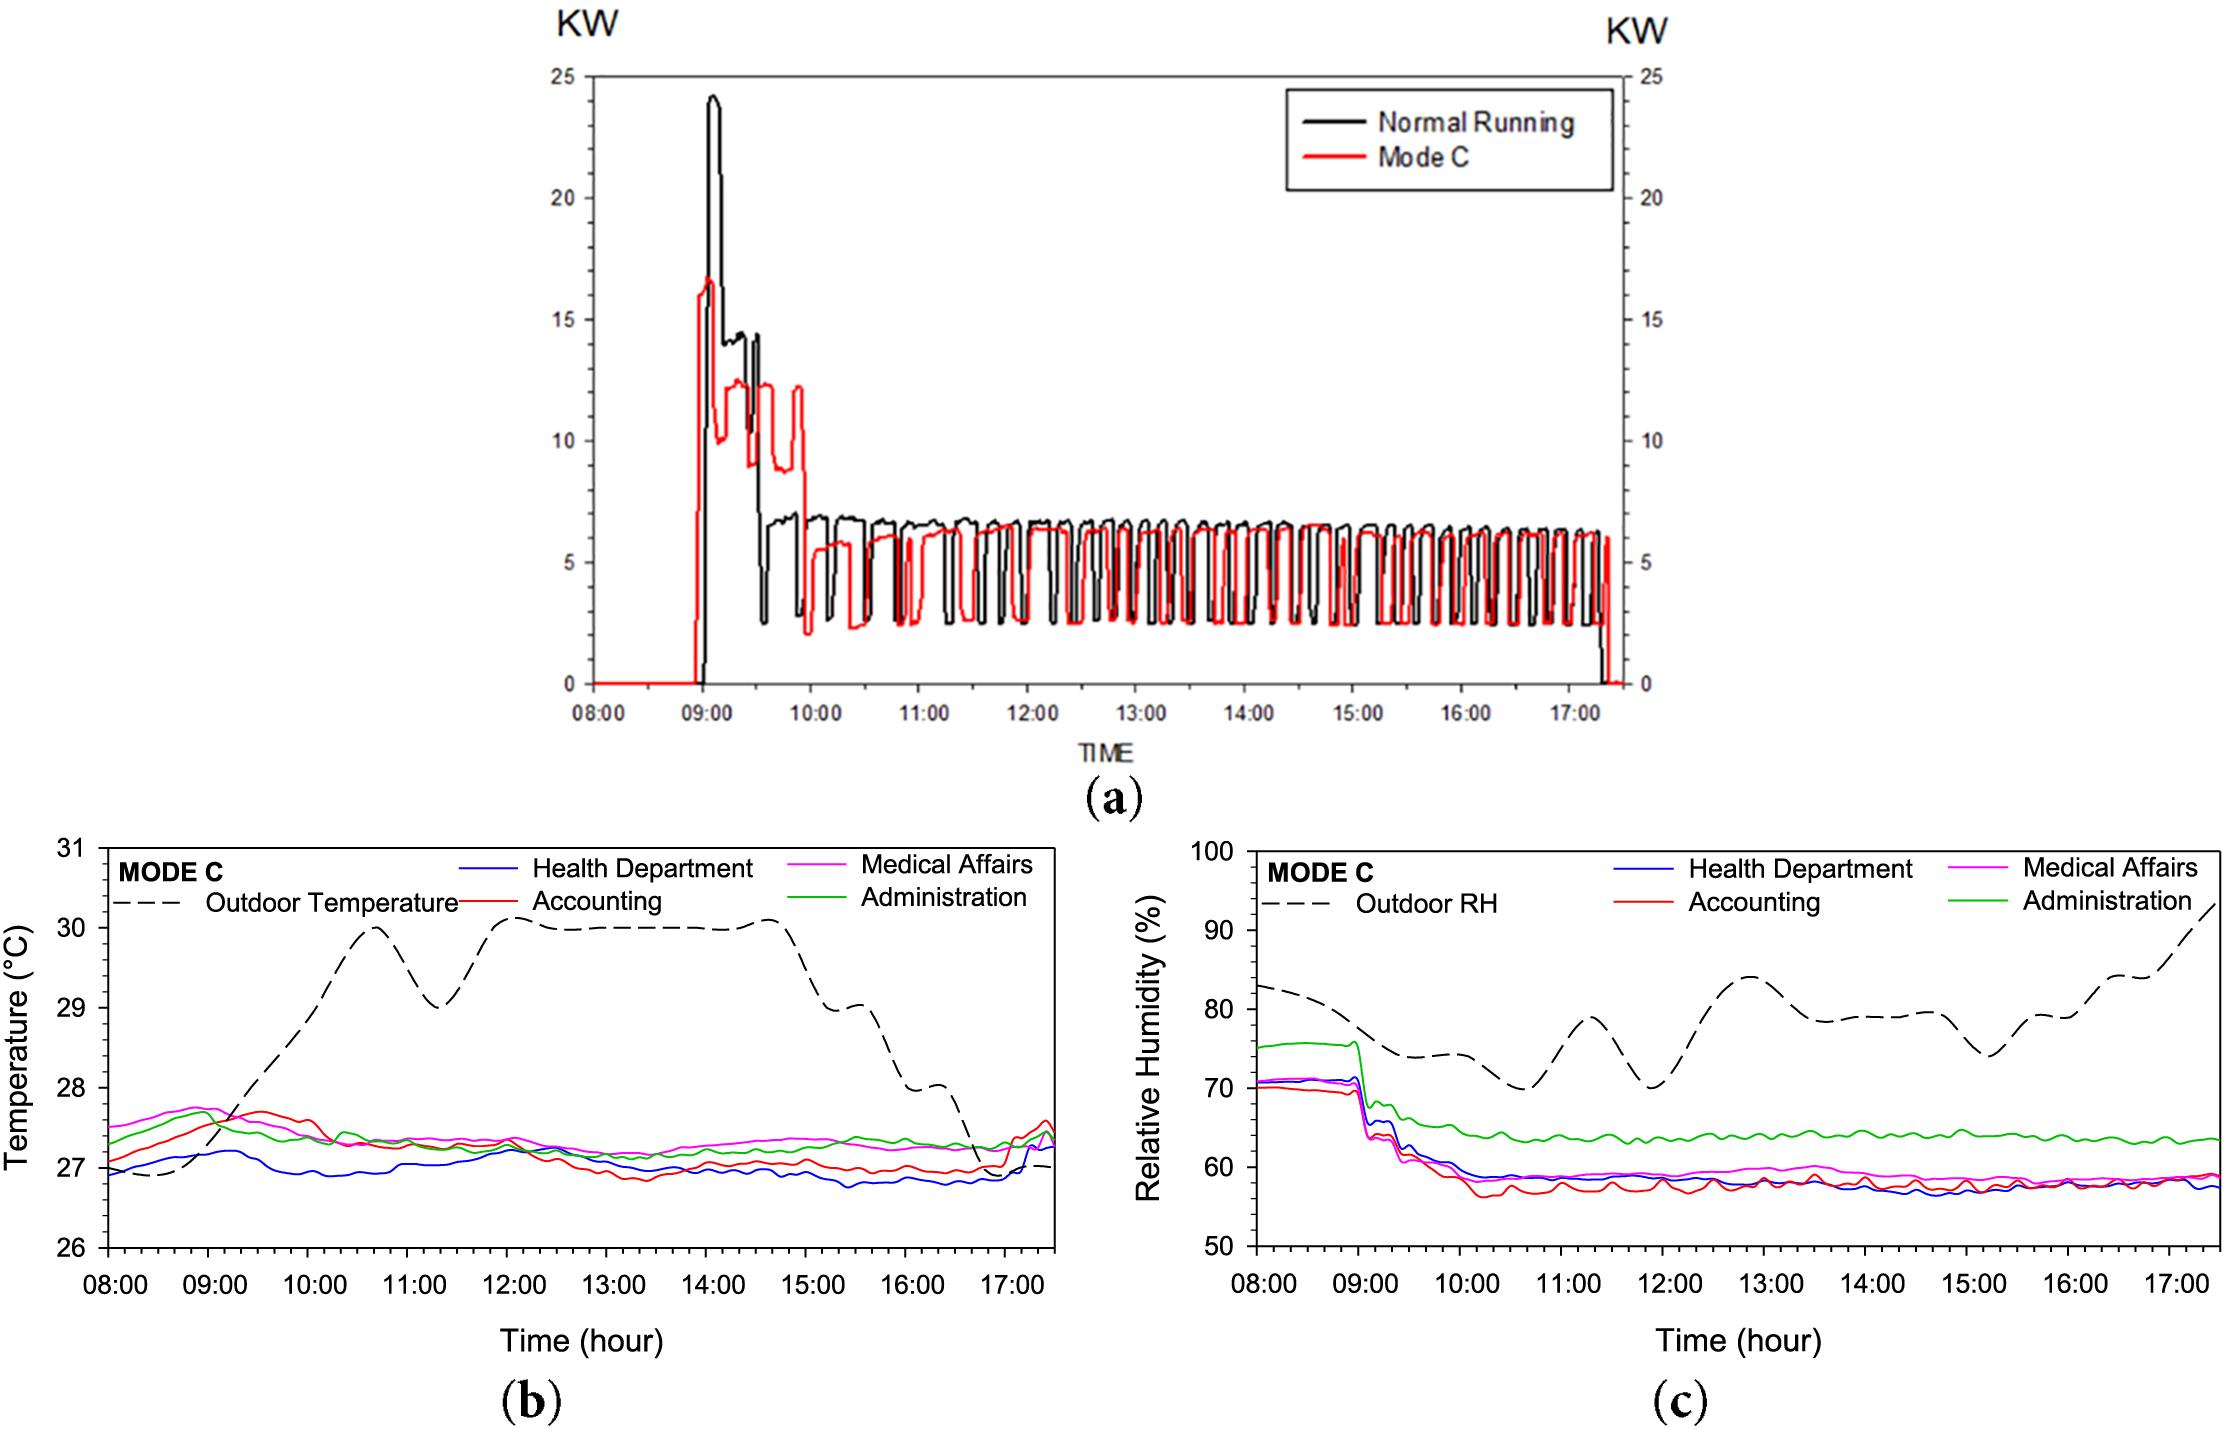
Figure 8: MODE C: (a) power consumption, (b) temperature, (c) relative humidity
Although the energy consumption reduction in mode C is less significant than in mode A, Fig. 9a shows that temperature and relative humidity conditions mostly fall within the acceptable thermal comfort zone in the distribution map. Additionally, the field measurement results for this mode, presented in Fig. 9b, indicate that the average temperature in each department is maintained below 27°C. The Medical Affairs department records the lowest air temperature at 26.73°C, while the accounting department has the highest, albeit only slightly, at 26.91°C. These findings suggest that mode C effectively balances energy savings with improved thermal comfort for occupants. The relative humidity ranges from 55.61% to 64.44%, further supporting a stable indoor environment.
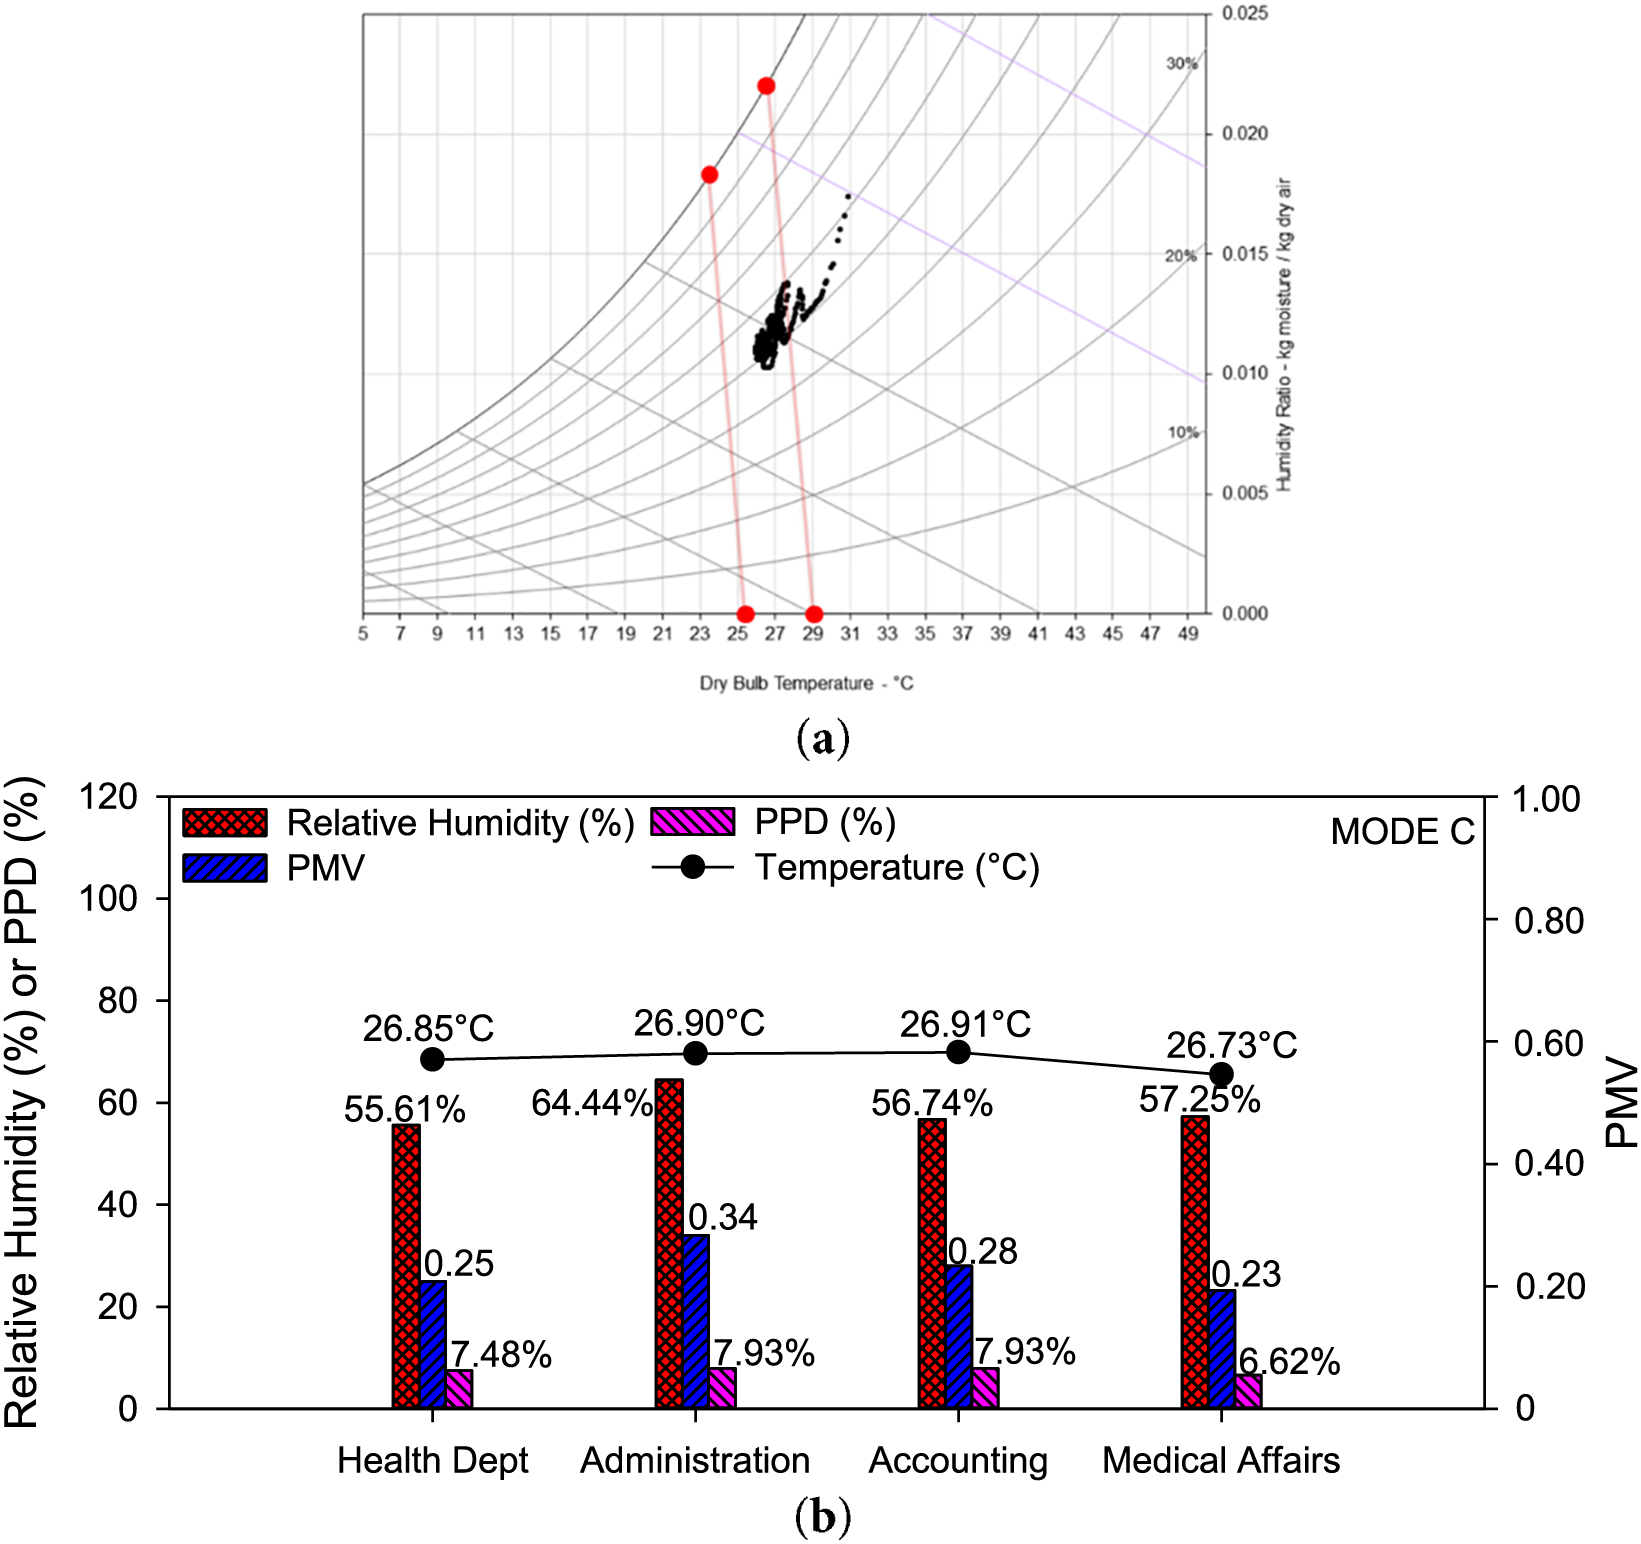
Figure 9: MODE C: Thermal comfort indexes, (a) distribution map, (b) PMV and PPD
This improved thermal comfort condition can be attributed to the operational characteristics of duty-cycling mode C, where the air conditioner runs for 25 min before turning off for 5 min while a fan continues to circulate air. The longer cooling phase and shorter off-cycle compared to modes A and B help maintain a more consistent indoor temperature and airflow, reducing fluctuations that contribute to discomfort (Fig. 8b). As a result, the PMV values remain below 0.5, indicating desirable thermal conditions throughout the day. Among all departments, the Medical Affairs department exhibits the most favorable thermal comfort, with a PMV value of 0.23 and a PPD value of 6.62%, suggesting minimal occupant discomfort. However, the overall average PPD value is 7.49%, indicating that some level of dissatisfaction still exists, albeit at a lower rate than in previous modes.
During the operation of duty-cycling mode D, the air conditioners operate on a cycle providing cooling for 28 min, followed by a 2-min period where the system supplies air via the fan without cooling. This section explains the influence of operating duty-cycling mode D on both indoor conditions and the energy consumption of the air conditioners. The energy consumption of duty-cycling mode D, compared to the normal mode without duty-cycling, is depicted in Fig. 10a. In this mode, the overall energy consumption is 1482.39 kWh/month, reducing 539.54 kWh/month. The daily average energy consumption in this mode is 65.35 kWh/day, reducing 22.57 kWh/day. However, the energy consumption fluctuates higher at the beginning of mode D than in normal mode. This mode offers energy savings ranging from 11.02% to 21.65%. Fig. 10b shows the indoor temperature compared to the outdoor temperature conditions during this cycle. This mode could maintain the indoor temperature ranging from 26.6°C–27.2°C after an hour of operation despite warmer conditions outdoors. Moreover, this mode is able to maintain a more comfortable relative humidity in Medical Affairs at 48% after about an hour and a half. Similarly, lower relative humidity is also found in the accounting area, with a value of around 56%. The relative humidity in the other departments remained higher, with the health department at 67% and administration at 70%, as indicated in Fig. 10c. This cycle can provide better thermal conditions inside the facility because of the longer cooling supply than most other modes. However, this might cause slightly higher energy consumption than in duty-cycling mode C.
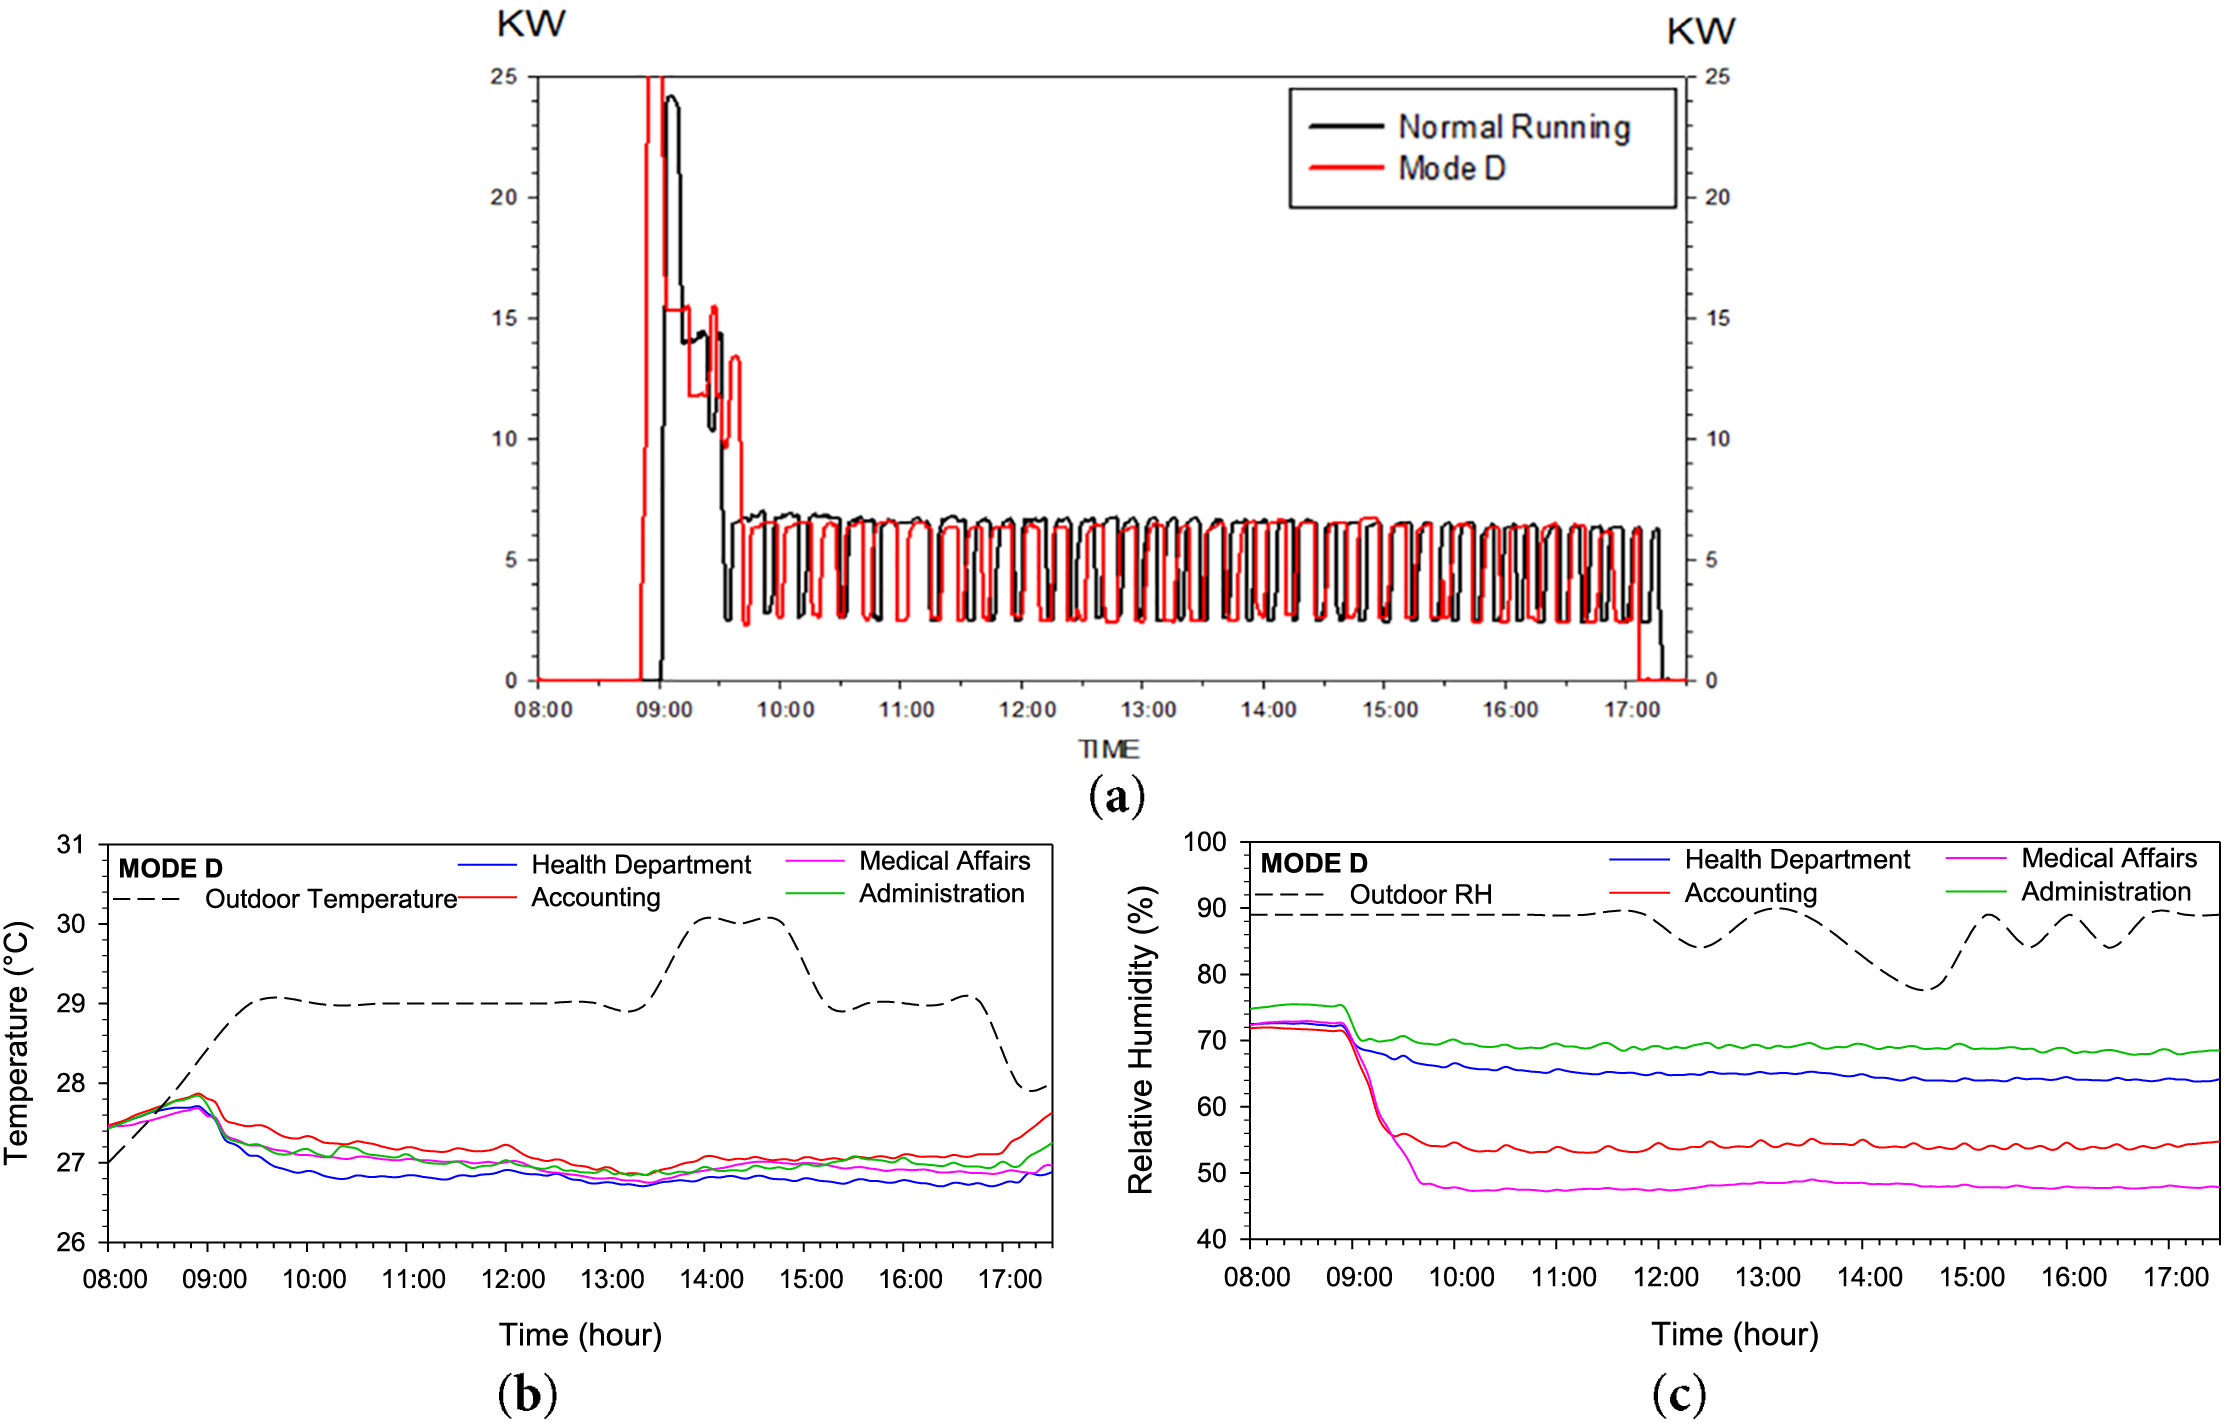
Figure 10: MODE D: (a) power consumption, (b) temperature, (c) relative humidity
Though duty-cycling mode D reduces energy consumption, the thermal conditions during this mode remain mostly comfortable, similar to mode C, despite the highest recorded temperature exceeding 31°C, as shown in the thermal comfort zone distribution map in Fig. 11a. Additionally, the thermal comfort level results, illustrated in Fig. 11b, indicate that the average daily temperature inside the facility is generally within a desirable range. The highest recorded air temperature is in the Accounting department at approximately 27.17°C, while the lowest is in the Health department at 26.86°C. Relative humidity in the Medical Affairs department is the lowest at 47.31%, where the most favorable PMV value of 0.22 is also recorded. Overall, the PMV values in duty-cycling mode D remain at or below 0.36, with PPD values ranging from 8.17% to 11.78%. These findings suggest that thermal comfort is generally well-maintained for occupants throughout the day.
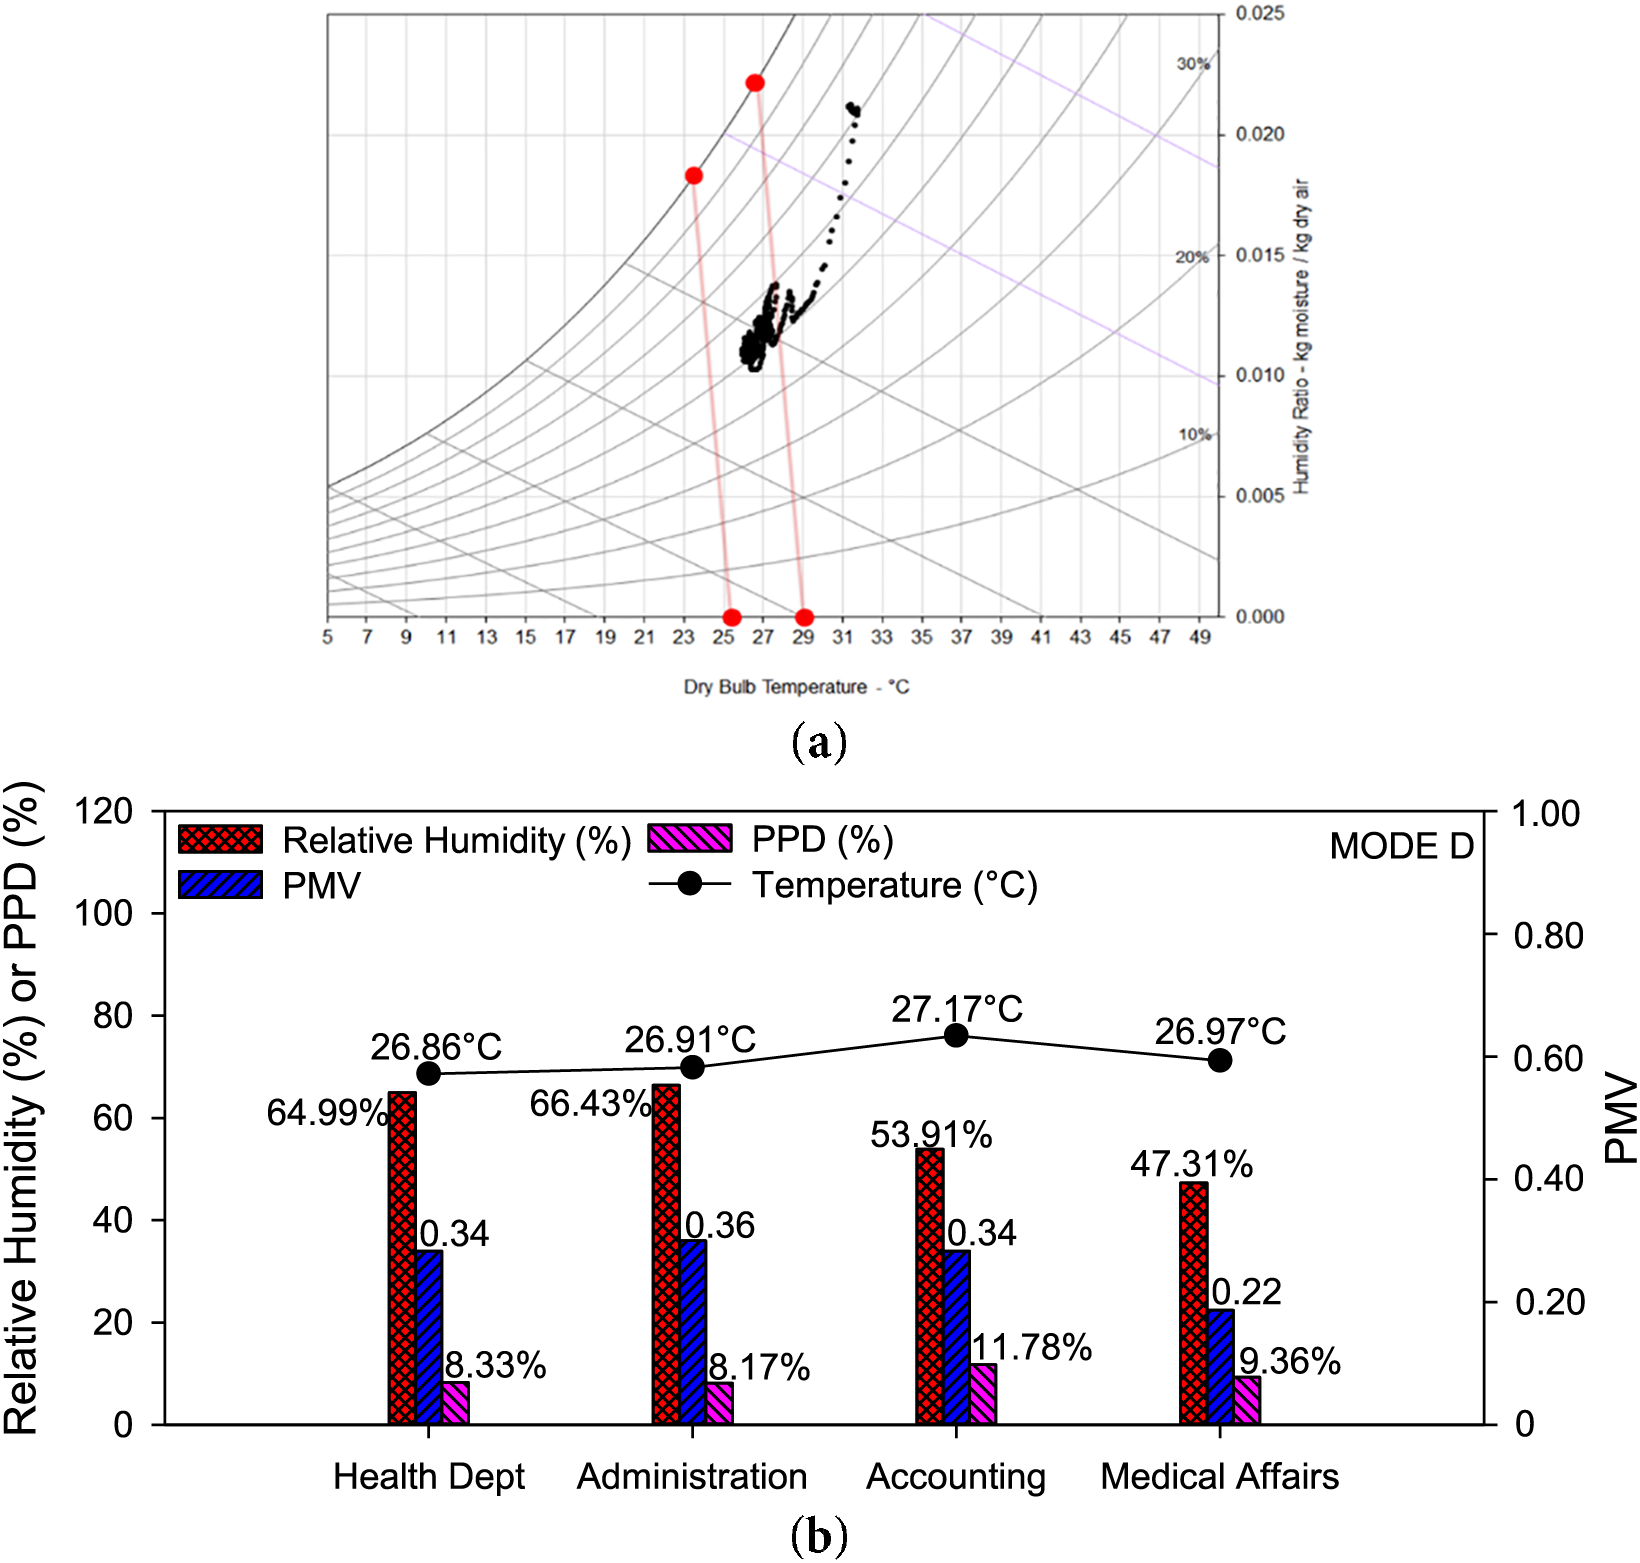
Figure 11: MODE D: Thermal comfort indexes, (a) distribution map, (b) PMV and PPD
This thermal comfort performance can be attributed to the operational characteristics of duty-cycling mode D, in which the air conditioner runs for 28 min before turning off for only 2 min while a fan continues circulating air. Compared to previous modes, this longer cooling duration and shorter off-cycle allow for more consistent indoor temperatures and air movement, minimizing thermal fluctuations and enhancing occupant comfort (Fig. 10b). The relatively stable thermal conditions in this mode contribute to maintaining acceptable humidity levels and PMV values across all departments.
Similar to duty-cycling mode C, mode D successfully balances energy savings with thermal comfort, making it a viable strategy for optimizing HVAC energy consumption while ensuring a comfortable indoor environment. The shorter off-cycle in this mode further enhances comfort levels, suggesting that it could be an effective approach for reducing energy consumption without significantly compromising occupants’ thermal satisfaction.
On the contrary, the operation cycle pattern of duty-cycling mode E differs from previous modes. This mode provides a longer cooling period of 30 min with a longer fan supply without cooling for 10 min. In this case, the indoor condition and the energy consumption pattern might differ from other modes. As seen in Fig. 12a, the energy consumption measurement results for duty-cycling mode E appear to differ from other duty-cycling mode results. This occurred due to the longer time system being turned on for 30 min and shut down for 10 min with the air supply from the fan for 10 min. The cycle period tends to be shorter than other modes, resulting in less fluctuating hourly energy consumption. Total energy consumption during this mode is 1502.82 kWh/month, with an average daily energy consumption of 65.35 kWh/day, reducing 25.67% of energy consumption.
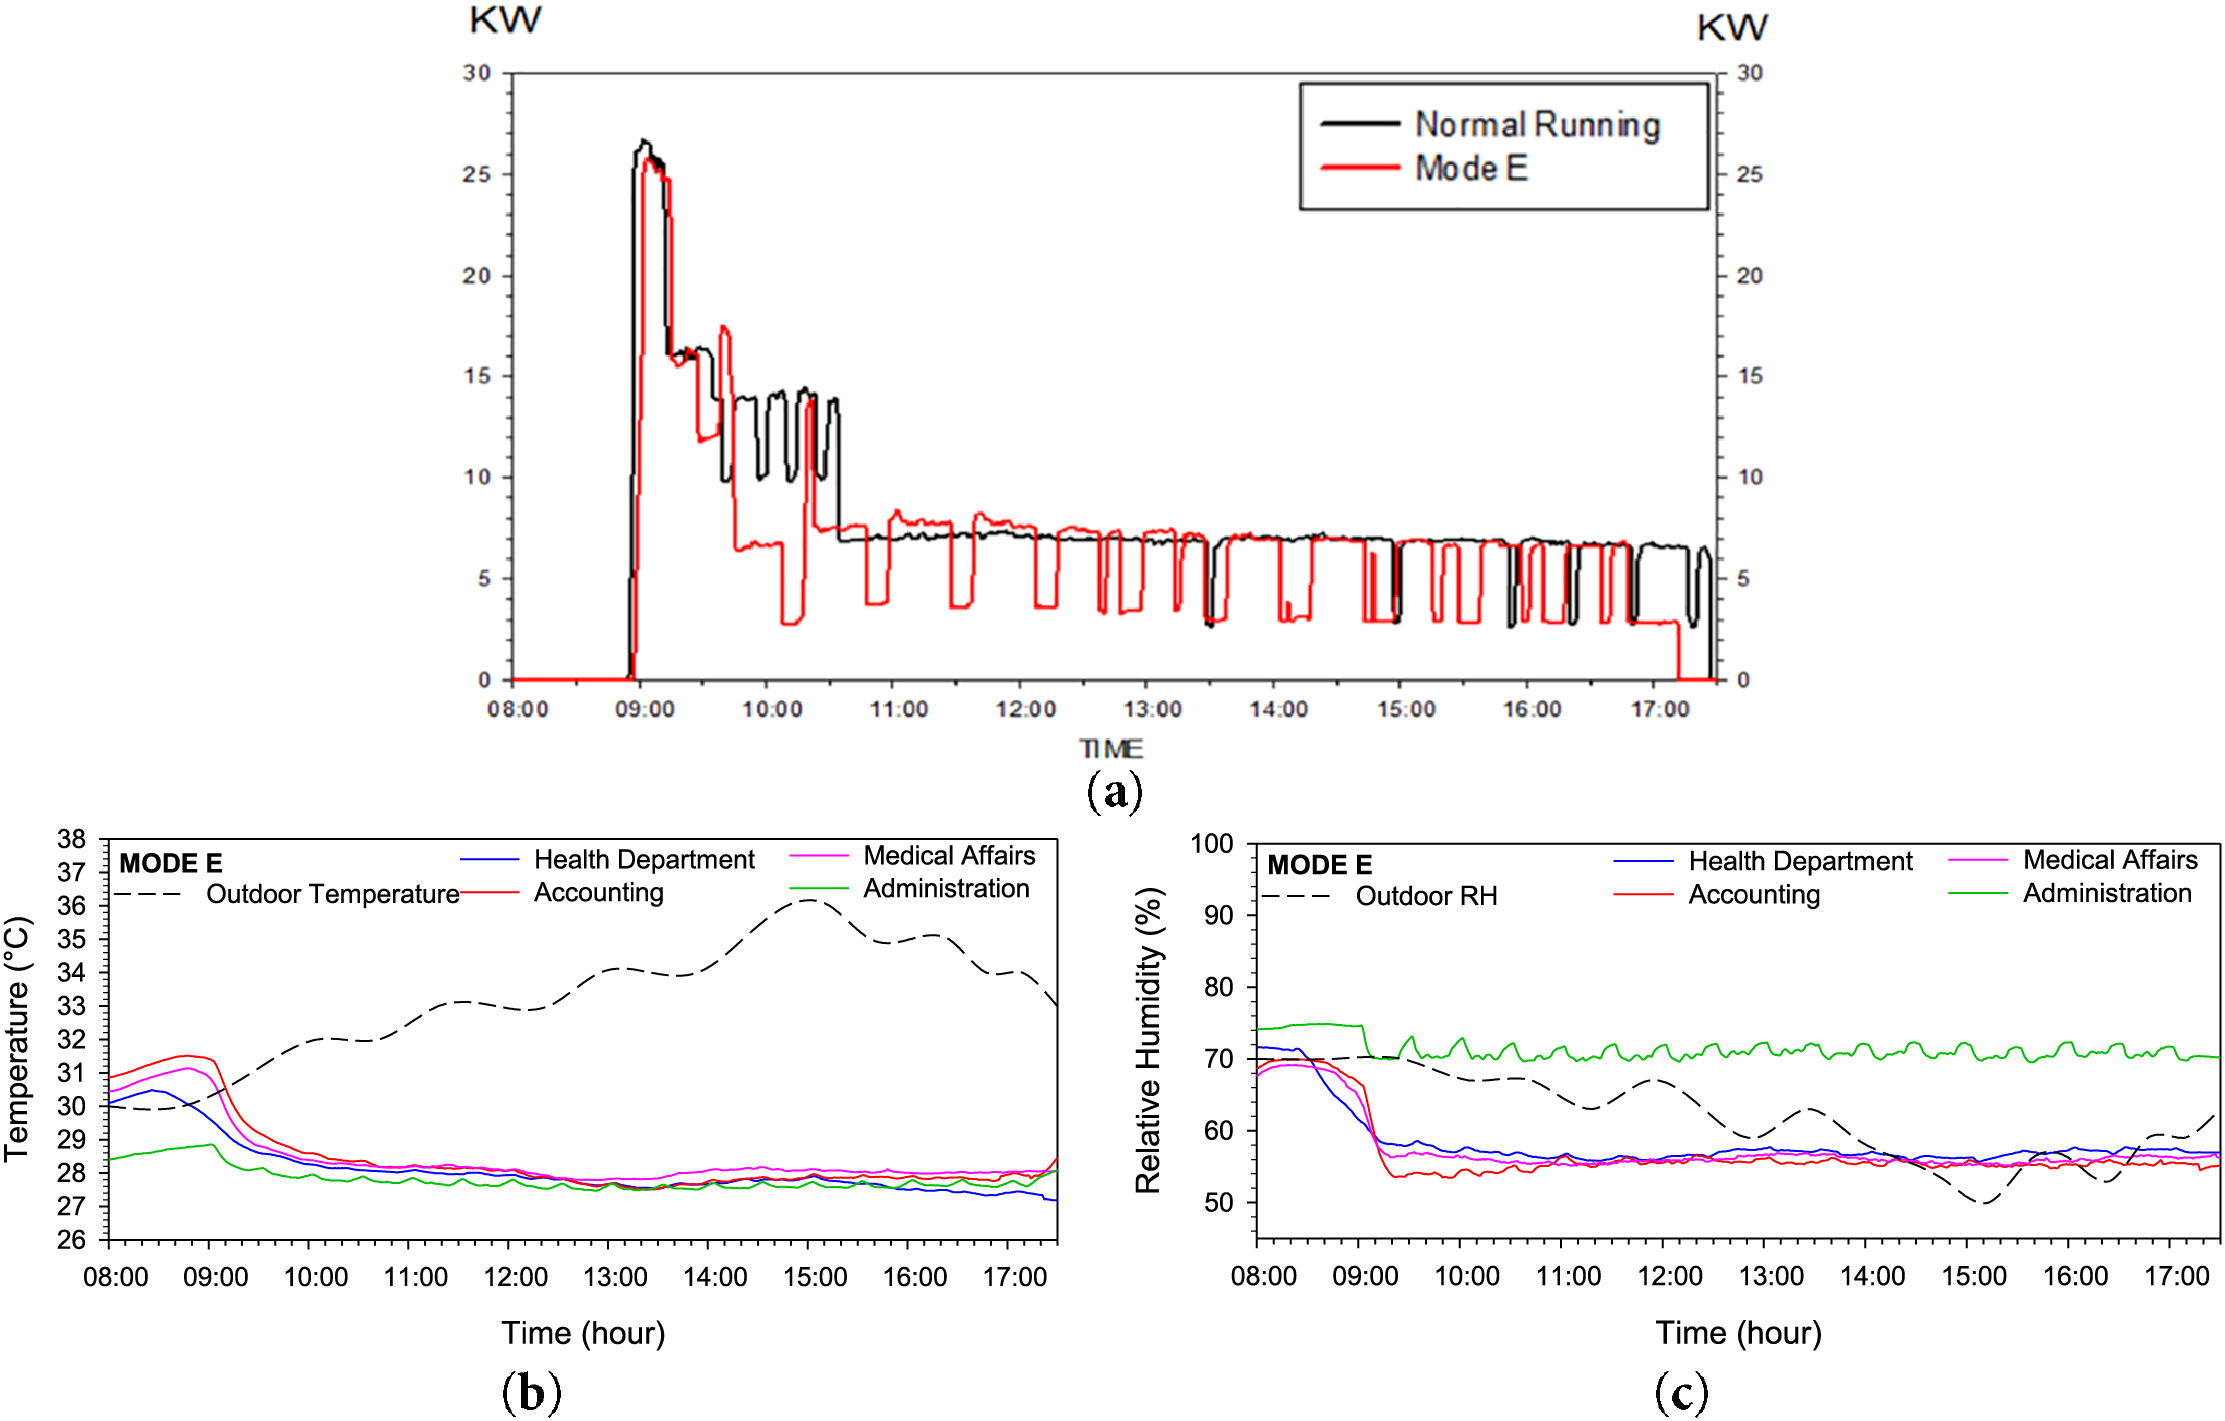
Figure 12: MODE E: (a) power consumption, (b) temperature, (c) relative humidity
Moreover, the temperature condition during this mode is shown in Fig. 12b. The indoor temperature in all investigated spaces is maintained between 27.2°C–28.6°C after about one and a half hours, even though the outdoor temperature keeps rising with the maximum temperature at 36°C throughout the day. Meanwhile, the relative humidity during duty-cycling mode E is indicated in Fig. 12c. The most significant difference in this mode is that the relative humidity in the Administration department is the highest among the other spaces, with the relative humidity ranging between 70%–74%. Concurrently, the relative humidity in other spaces is evidently lower, ranging between 52%–56%. Despite providing cooled air longer than other modes, this mode falls short compared to modes C and D. This may occur because the cycle stops providing cool air longer than other modes thoroughly. However, the energy-saving in this mode might be better than in modes C and D.
The results of the thermal comfort zone distribution map using duty-cycling mode E are shown in Fig. 13a. While this mode effectively reduces energy consumption, the thermal comfort distribution map indicates that most conditions fall outside the comfort zone, making the indoor environment uncomfortable for occupants. The highest recorded air temperature during this mode exceeds 31°C, highlighting significant thermal discomfort. Furthermore, the average thermal distribution in all departments remain steady after 10 AM, as illustrated in Fig. 13b. The Medical Affairs department records an average daily temperature of 28.03°C, while the Administration department has the lowest average air temperature at 27.39°C. However, the Administration department also experiences the highest relative humidity at 75.55% and the highest PMV value among all departments at 0.59, which can lead to significant discomfort for occupants.
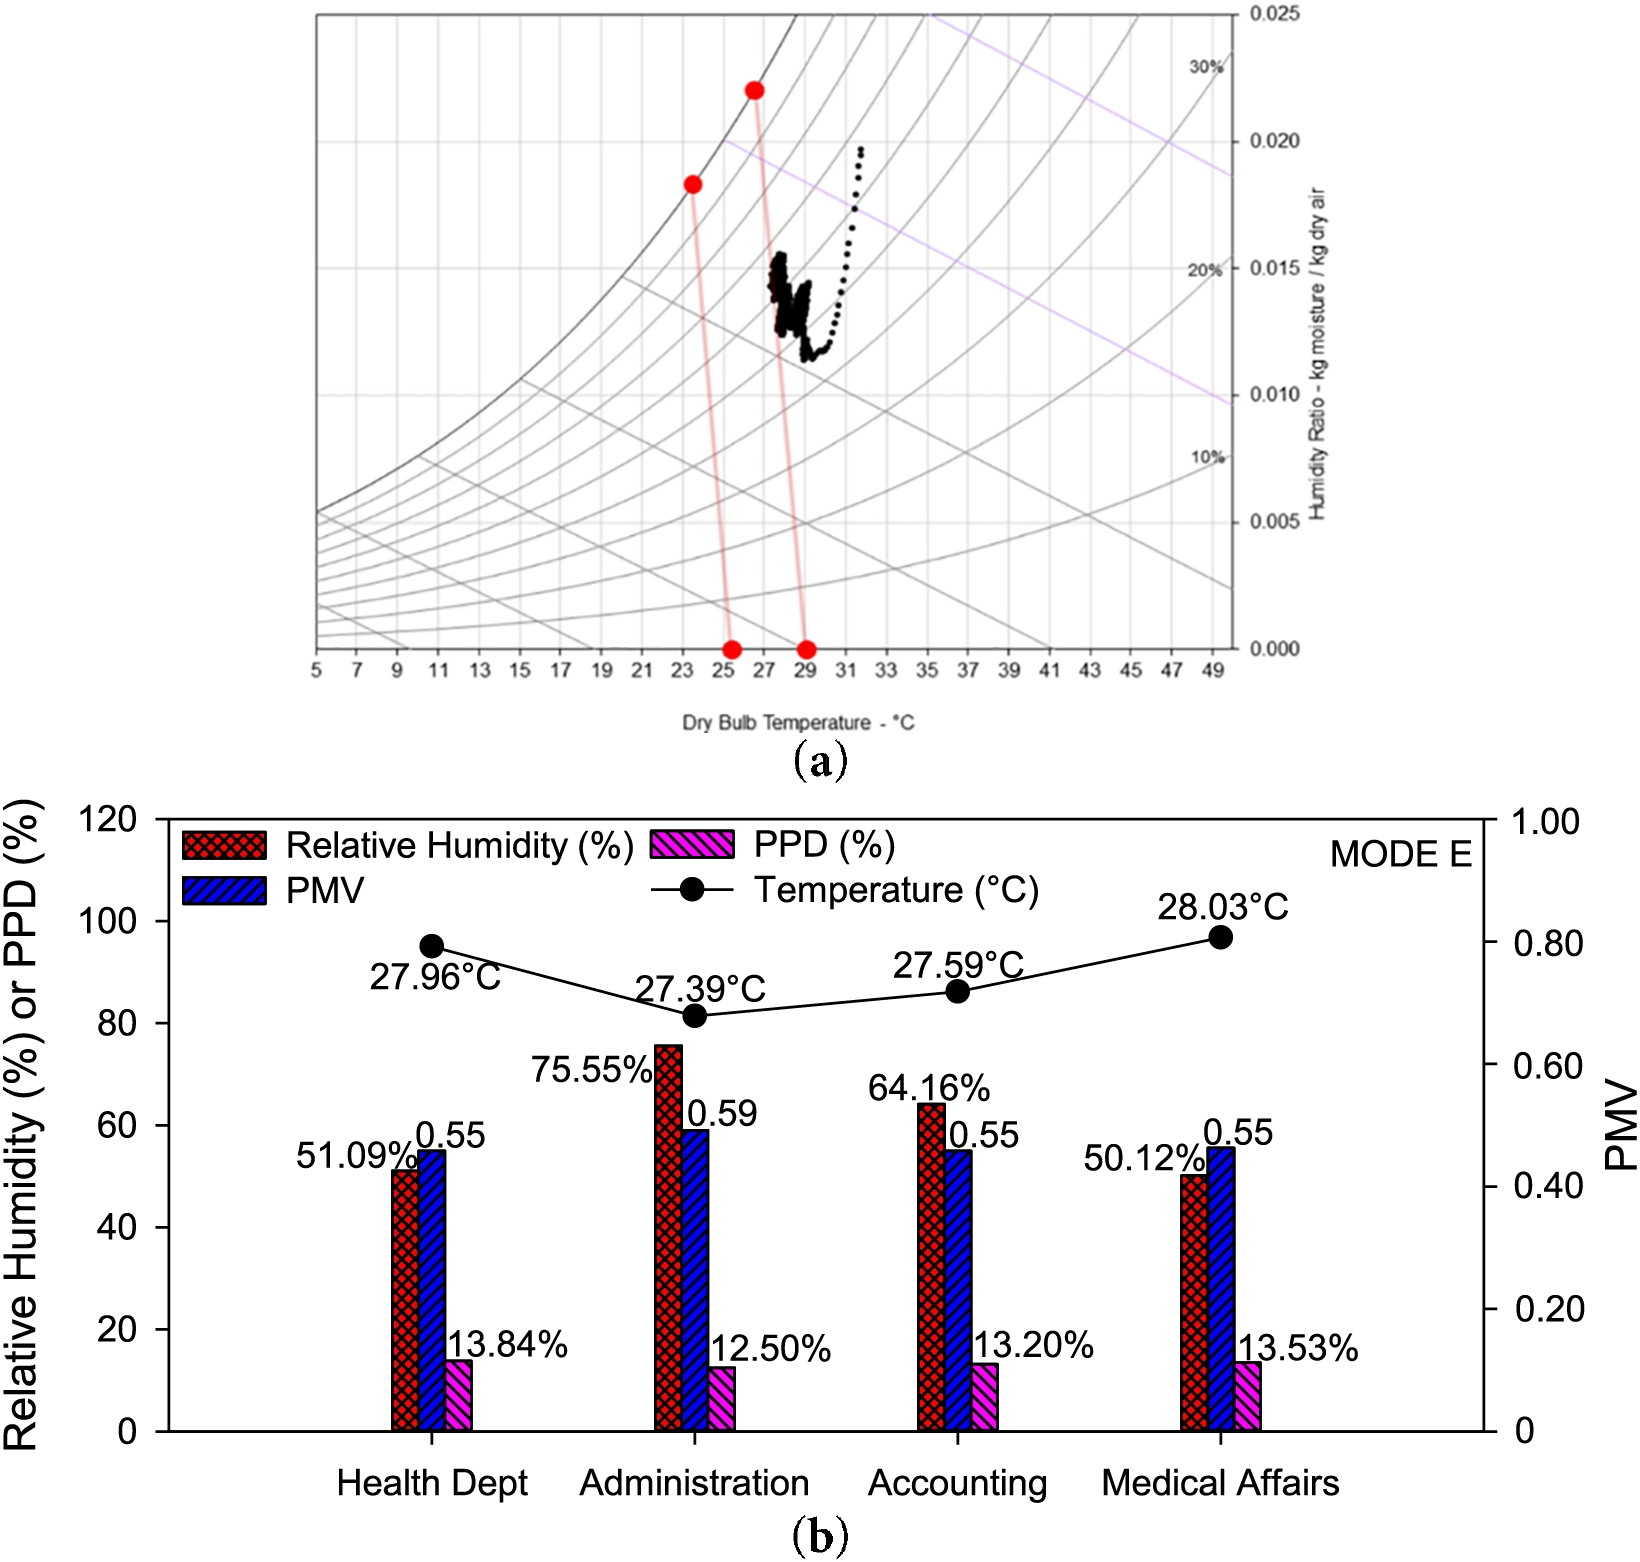
Figure 13: MODE E: Thermal comfort indexes, (a) distribution map, (b) PMV and PPD
This thermal condition is influenced by the operational characteristics of duty-cycling mode E, where the air conditioner runs for 30 min before turning off for 10 min while a fan continues circulating air. Compared to other modes, this cycle features both a longer cooling duration and a longer off-period, resulting in fewer total cycles throughout the day. While the extended cooling phase may help maintain lower temperatures for a longer period, the prolonged off-cycle likely contributes to greater temperature fluctuations and increased humidity (Fig. 12b), affecting occupants’ overall comfort.
Despite these challenges, the PPD values in all departments remain below 15%, indicating that while discomfort is present, it is still an improvement compared to normal operation without HVAC duty-cycling. However, the results suggest that this mode, despite its energy-saving benefits, may not provide sufficient thermal comfort due to the extended off-time allowing indoor temperatures and humidity levels to rise. These findings emphasize the importance of optimizing the cooling-off balance to improve comfort while maintaining energy efficiency.
3.7 Comparative Results of Energy-Saving Potential
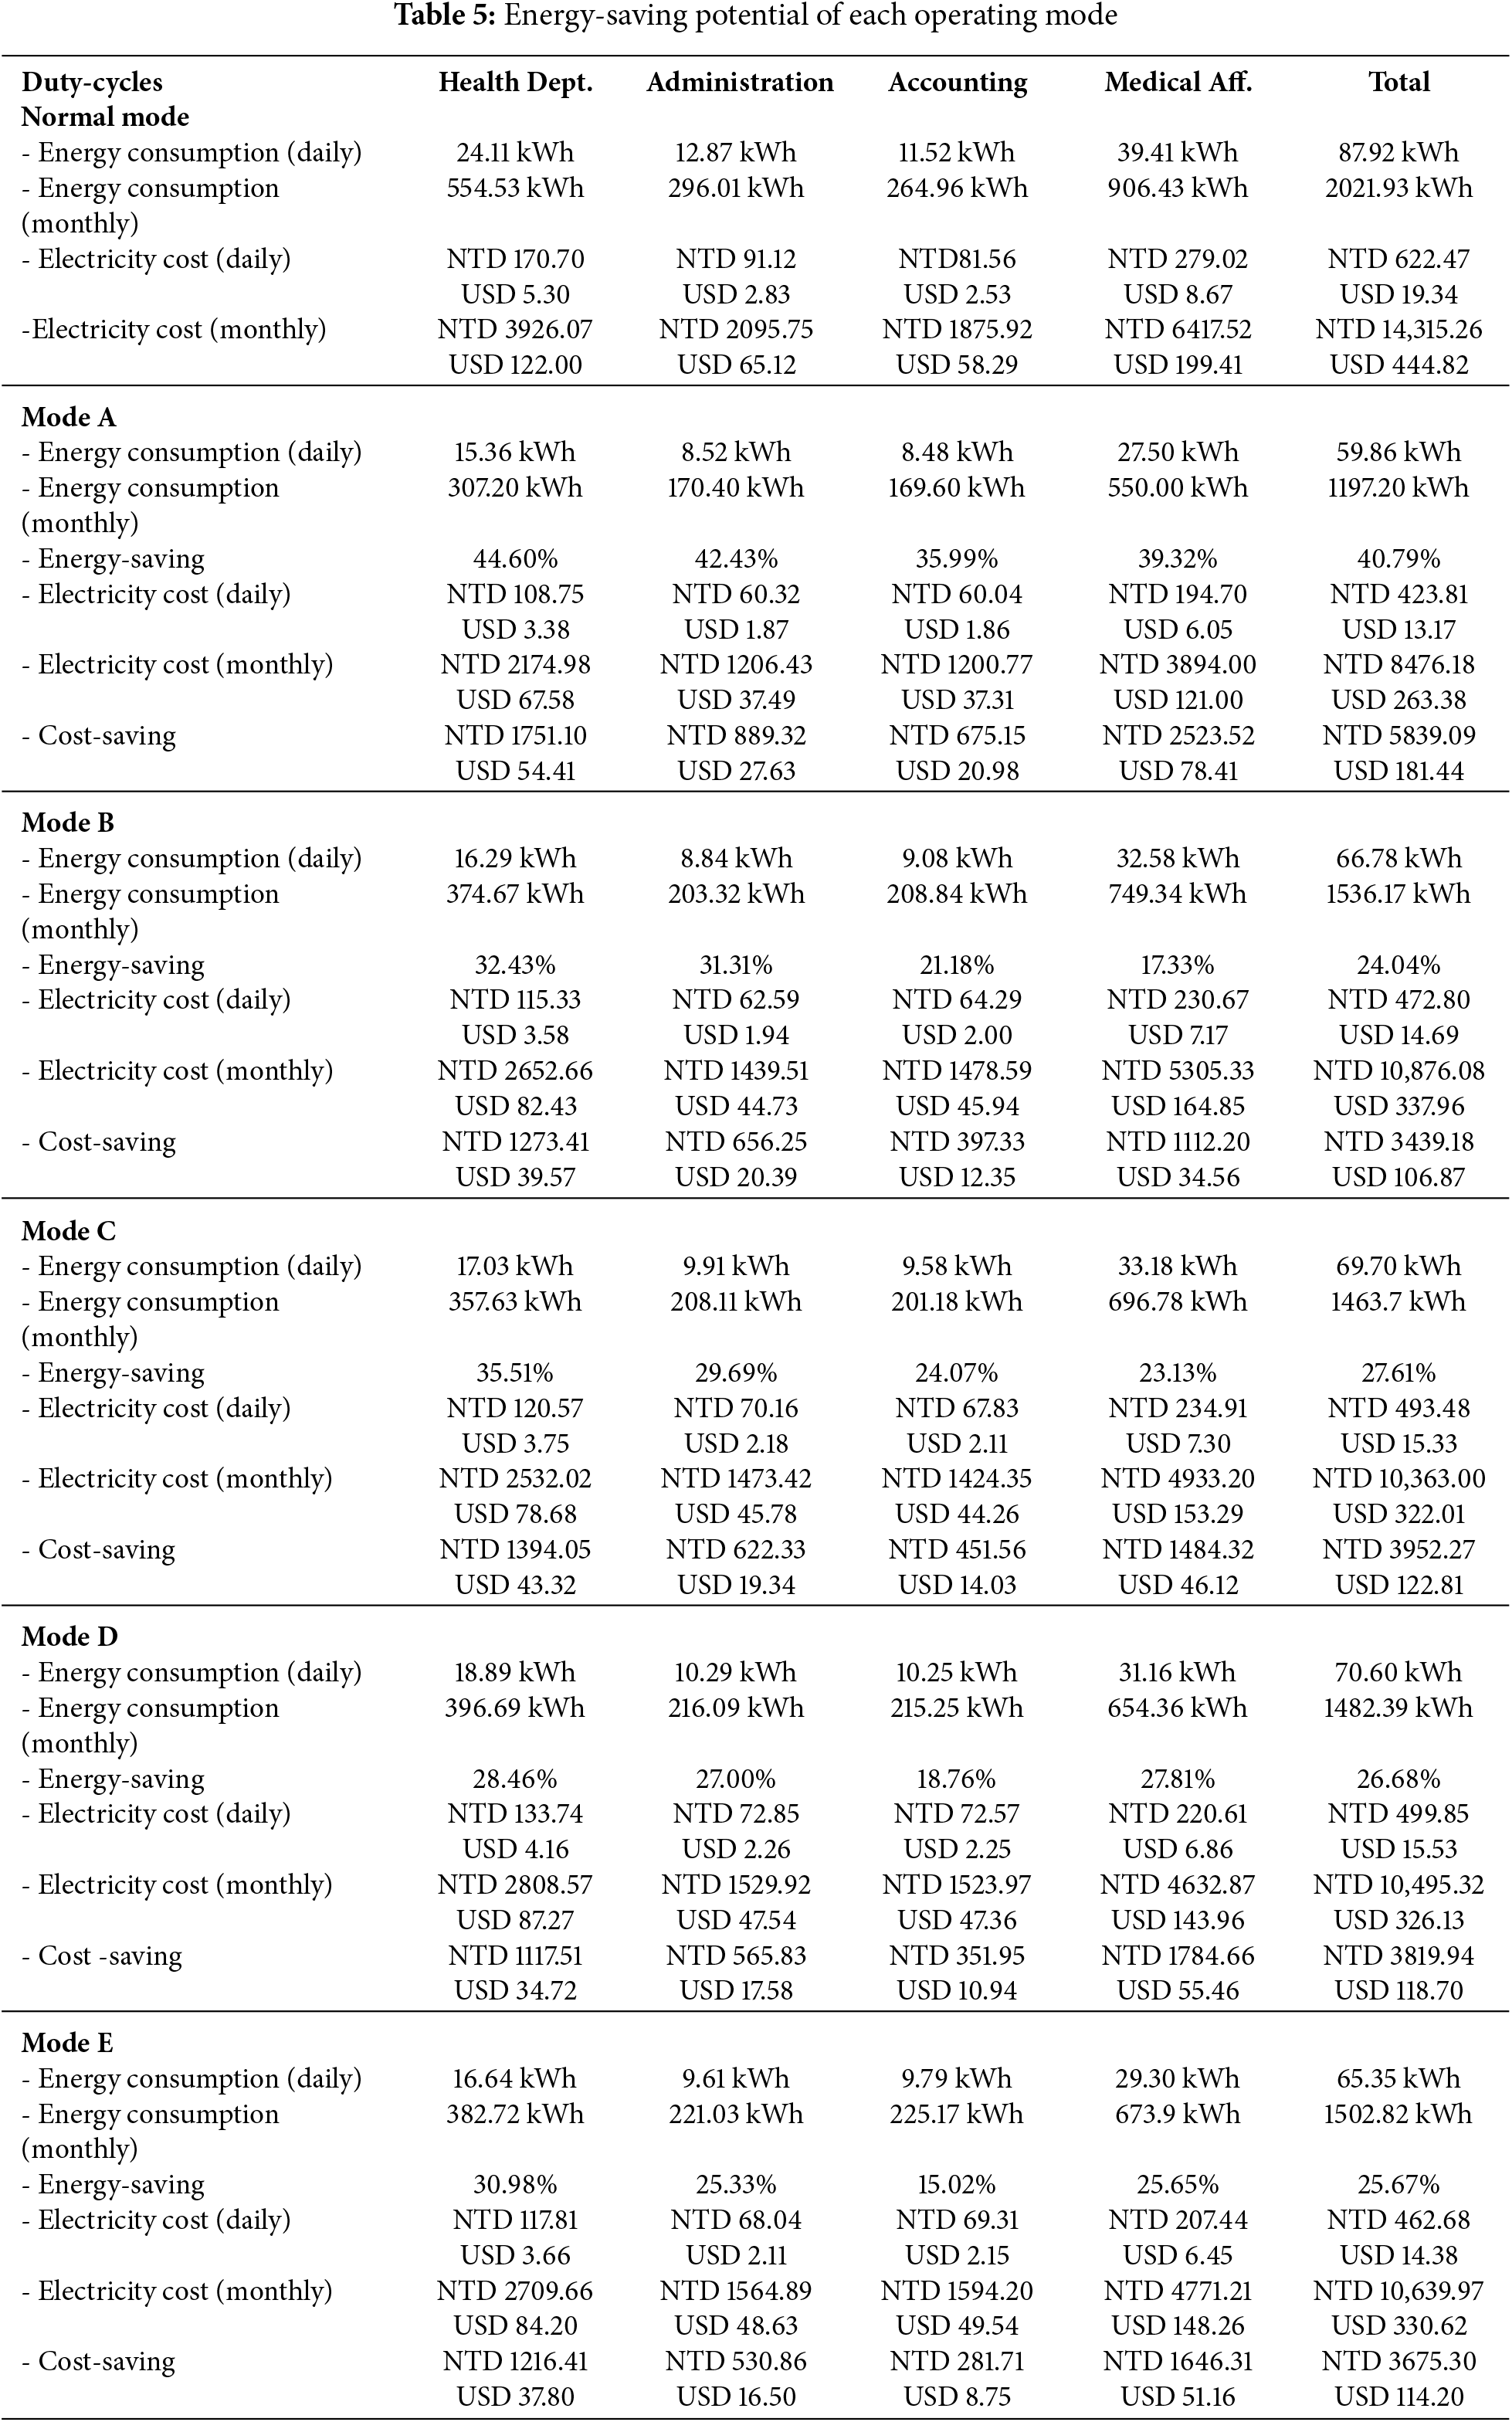
Analyzing the overall HVAC energy consumption implementing various duty-cycling modes to discover which mode presented the optimal energy saving. The comparative results of energy consumption and electricity cost of each duty-cycling mode were analyzed. The electricity cost of commercial buildings in Taiwan during the summer season is NTD 7.08/kWh (equivalent to USD 0.22/kWh) for monthly electricity consumption >1500 kWh [40]. This electricity rate will be utilized to determine the electricity cost for each mode in this study, allowing for a comparison of their impact on overall electricity expenses. The highest energy consumption is found in medical affairs in every duty-cycling mode, including the normal operating mode without the duty-cycling mode. The normal operating mode energy consumption in medical affairs is 906.43 kWh/month, and compared to all duty-cycling modes, mode A has the lowest energy consumption in medical affairs with a value of 550.00 kWh/month. The lowest energy consumption is found in the accounting department, with a value of 264.96 kWh/month for normal operating mode, and the energy consumption is reduced to 169.60 kWh/month in duty-cycling mode A. It is also discovered that mode A has the highest energy-saving results at 40.79% compared to other modes, with the lowest electricity cost by NTD 8476.18/month (equivalent to USD 263.38/month). This mode reduces monthly electricity consumption around NTD 5839.09/month (equivalent to USD 181.44/month). A slight difference in the lowest energy reductions was found in duty cycling modes B and E with the values of 24.04% and 25.67%, respectively, with their respective daily electricity costs NTD 10,876.08/month (equivalent to USD 337.96/month) and NTD 10,639.97/month (equivalent to USD 330.62/month). Meanwhile, the moderate energy-saving potentials were found in modes C and D with a slight difference, where both modes reduced to 27.61% and 26.68%, respectively, with the electricity cost of mode C NTD 10,363.00/month (equivalent to USD 322.01/month) and mode D NTD 10,495.32/month (equivalent to USD 326.13/month). However, duty-cycling mode D provides a longer cooling period but a shorter fan supply than duty-cycling mode C, which explains the slightly lower energy-saving than duty-cycling mode C. The detailed comparative energy-saving results are listed in Table 5. The results show that mode A presents the best energy-saving potential among all other duty-cycling modes. On the contrary, duty-cycling mode B has the lowest energy-saving potential among others modes. During the winter season, the effectiveness of each duty-cycling mode may vary due to lower cooling demand. Modes with longer OFF periods, such as Mode A or E, may yield even higher energy savings while maintaining acceptable indoor conditions. However, modes prioritizing thermal comfort (e.g., Mode D) may become less critical in colder months, allowing more aggressive energy-saving strategies without compromising occupant comfort. Therefore, seasonal adjustments in duty-cycling strategies could further enhance energy optimization throughout the year.
3.8 Comparative Results of Thermal Comfort
Regardless of the energy-saving potential in all duty-cycling modes, the thermal comfort of the occupants should also be considered. The average thermal condition in the facility during every duty-cycling mode is illustrated in Fig. 14. Although duty-cycling mode A presents the best energy-saving, the average indoor temperature and relative humidity are rather high at 27.60°C and 65.56%. Conversely, modes C and D provide pleasant indoor thermal conditions despite low energy performance. The average indoor air temperatures in modes C and D are 26.85°C and 26.98°C, with the relative humidity under 59%. The findings revealed that even though Mode A has the highest energy saving, the mode does not meet the acceptable value for PMV at 0.56. Correspondingly, mode B and C PMV values are 0.53 and 0.56, exceeding the acceptable thermal comfort range. On the contrary, significant differences were found in modes C and D; the PMV values are within the acceptable range, with values of 0.28 and 0.32. Compared to the normal operating mode without the duty-cycling mode, the PMV value is reduced by 75.56% under duty-cycling mode C and 71.97% under duty-cycling mode D. Overall, all duty-cycling modes can reduce the thermal discomfort compared to the initial value without duty-cycling mode. The average initial PPD value was reduced to an acceptable value. The lowest PPD value is found in duty-cycling mode C, reducing the PPD value from 32.25% to only 7.49%, which signifies this mode is the most suitable to implement to reduce the overall energy consumption while also providing a comfortable thermal condition for occupants. Duty-cycling mode C has the best thermal and energy performance with a cycle of 25 min turned on and 5 min turned off for the AC systems and additional air movement from the fan. Likewise, duty-cycling mode D also provides optimal thermal and energy performance, saving 19.70% energy while having PMV and PPD values of 0.31% and 9.41%. Both modes, C and D, can be the option to mitigate energy consumption and thermal discomfort simultaneously, specifically during the summertime. However, during winter, the reduced cooling demand may further minimize the impact of indoor temperature fluctuations, making duty-cycling modes with less favorable summer performance, such as Mode A or B more viable without compromising thermal comfort. In cooler conditions, the extended OFF periods could maintain acceptable comfort levels naturally, allowing for greater energy savings across a longer operational period. Therefore, seasonal flexibility in mode selection is recommended to optimize both energy efficiency and occupant comfort year-round. Additionally, based on thermal comfort perception studies, females are more affected by winter conditions while males are more affected by higher temperatures in summer, impacting thermal comfort, productivity, and health [41,42]. Male occupants who tend to be more sensitive to thermal variations may benefit more from modes with stable temperature conditions, such as Modes C or D, which is in line with the recommendation for summer. In contrast, female occupants, who generally tolerate slightly warmer or more fluctuating environments, may find Mode A or B acceptable in milder, which also suitable for colder season that can increase the energy-saving potential in winter.
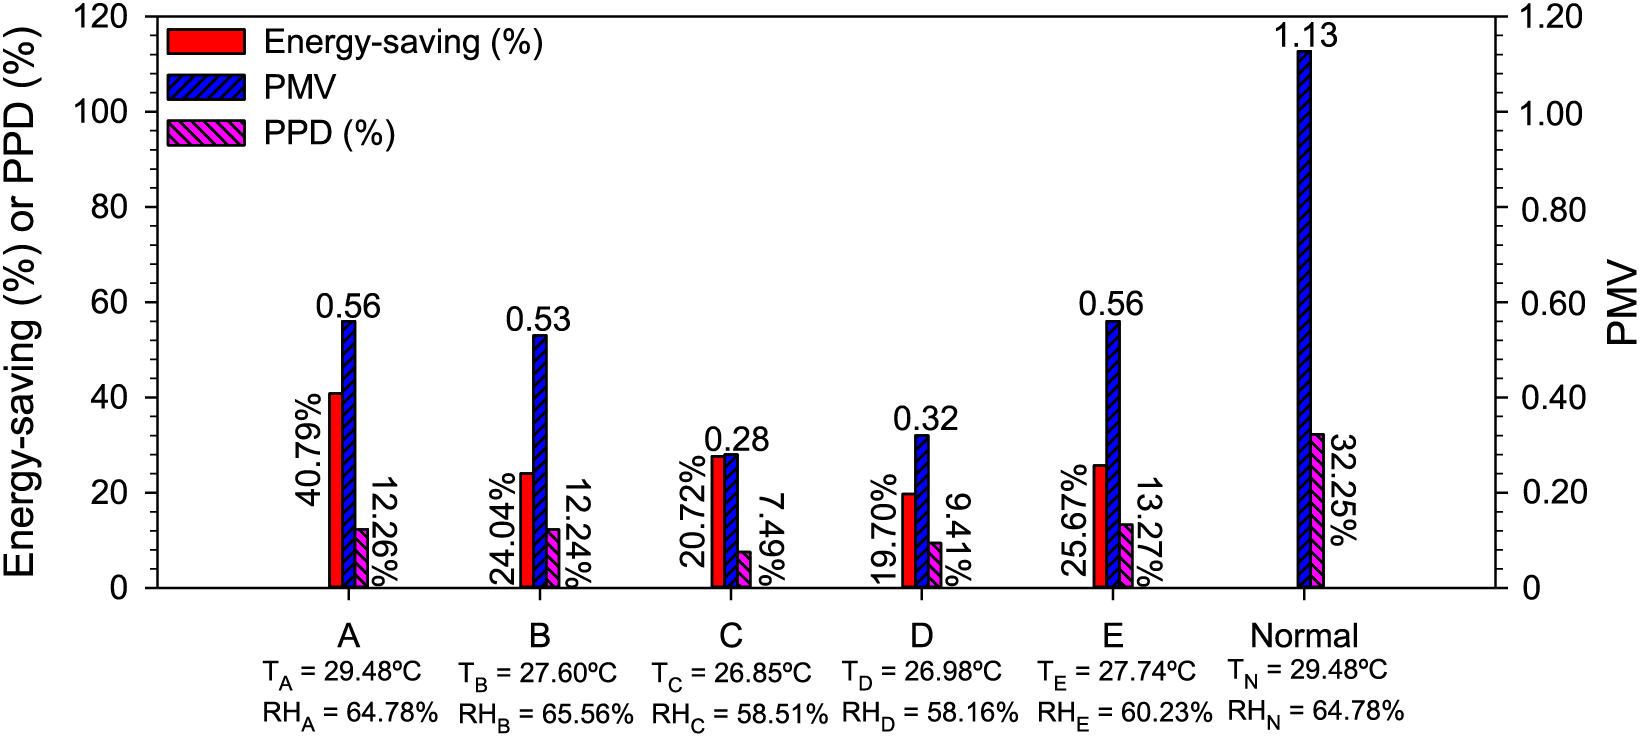
Figure 14: Compared results of energy saving and thermal comfort indexes
This study analyzed the implementation of duty-cycling control on HVAC systems for its effectiveness in reducing energy consumption while maintaining thermal comfort in office spaces specifically in hot and humid climate (Climate Zone 2A). The study targeted four departments (health, administration, accounting, and medical affairs). It analyzed five different duty-cycling modes against a normal mode where the air conditioning system operated continuously during building hours. The findings conclusions include:
• All duty-cycling modes led to energy savings compared to continuous operation.
• Mode A achieved the highest energy savings at 40.79% but failed to maintain acceptable thermal comfort based on PMV and PPD values.
• Modes B and E reduced energy consumption by 24.04% and 25.67%, respectively, but also failed to provide acceptable comfort levels.
• Mode C offered the best balance, saving 27.61% of the energy monthly while maintaining a PMV of 0.28 and a PPD of 7.49%, improving thermal comfort indicators by 75% compared to the normal mode.
• Mode D maintained PMV and PPD values within or close to acceptable comfort ranges, with 26.68% energy savings.
Although all modes save energy, only Modes C and D sufficiently balance energy efficiency and occupant comfort, highlighting that not all energy-saving strategies meet comfort standards, especially the operation during summer. Seasonal adjustments are recommended to optimize performance year-round. In winter, Mode A becomes more viable due to reduced cooling needs, allowing for greater energy savings without significantly affecting comfort. This highlights the need for careful consideration when implementing duty-cycling strategies to avoid compromising occupant comfort, and suggests that a flexible approach such as switching modes between seasons is an effective way to balance energy efficiency and thermal comfort throughout the year.
Moreover, the methodology and findings from this study have general applicability to various building types such as residential buildings, commercial facilities, educational institutions (schools, universities, and libraries), and hotel buildings, particularly in climates with similar thermal demands. However, caution should be taken when applying this method to hospital buildings, as these are energy-intensive and operate continuously with strict environmental requirements. In such cases, duty-cycling control may only be suitable during idle or low-occupancy periods.
For future research, it is recommended to investigate the long-term impacts of duty-cycling on the performance and lifespan of HVAC system compressors, as frequent ON/OFF cycling could affect their durability and operational efficiency. Furthermore, future studies should incorporate direct occupant feedback in conjunction with PMV and PPD indices to provide a more comprehensive and human-centered thermal comfort assessment, capturing subjective experiences that numerical models alone may not fully represent. Overall, the study demonstrates that duty-cycling control is a viable approach to reducing energy consumption during peak load periods, provided that the modes are selected and managed to maintain acceptable thermal comfort.
Acknowledgement: None.
Funding Statement: The authors would like to express great appreciation for the financial support by the National Science and Technology Council under grant no. NSTC 112-2221-E-167-017-MY3.
Author Contributions: The authors confirm contribution to the paper as follows: study conception and design: Alya Penta Agharid, Indra Permana, Yi-Han Luo; data collection: Alya Penta Agharid, Indra Permana, Linlan Chang, Yi-Han Luo; analysis and interpretation of results: Alya Penta Agharid, Indra Permana, Yi-Han Luo; supervision: Indra Permana, Fujen Wang; funding acquisition: Fujen Wang; draft manuscript preparation: Alya Penta Agharid, Indra Permana; draft manuscript review and editing: Alya Penta Agharid, Indra Permana. All authors reviewed the results and approved the final version of the manuscript.
Availability of Data and Materials: Data available on request from the authors.
Ethics Approval: Not applicable.
Conflicts of Interest: The authors declare no conflicts of interest to report regarding the present study.
References
1. Taiwan Power Company. Sustainability Report [Internet]. Taipei, Taiwan: Taiwan Power Company; 2023 [cited 2025 Feb 10]. Available from: https://www.taipower.com.tw/mag/Sustainability_en/2023sustainability.pdf. [Google Scholar]
2. Huang CH, Tsai HH, Chen HC. Influence of weather factors on thermal comfort in subtropical urban environments. Sustainability. 2020;12(5):2001. doi:10.3390/su12052001. [Google Scholar] [CrossRef]
3. Liu W, Zhou H, Long T, Xu Y, Bi R, Hu B, et al. A novel modulation algorithm for efficient heating of air conditioning compressor. In: Proceedings of the 2024 IEEE 7th International Electrical and Energy Conference (CIEEC); 2024 May 10–12; Harbin, China. doi:10.1109/CIEEC60922.2024.10583019. [Google Scholar] [CrossRef]
4. Chan JY, Ahn J. Spatial distribution and transient responses of the thermal environment in an office space equipped with a standing-type air conditioner. Int J Air Cond Refrig. 2024;32(1):5. doi:10.1007/s44189-024-00050-2. [Google Scholar] [CrossRef]
5. Kamal MA, Khan SA. Variable refrigerant flow in air conditioning of buildings: system configuration and energy efficiency. Am J Civ Eng Archit. 2021;9(2):42–51. doi:10.12691/ajcea-9-2-1. [Google Scholar] [CrossRef]
6. Yau YH, Rajput UA, Badarudin A. A comprehensive review of variable refrigerant flow (VRF) and ventilation designs for thermal comfort in commercial buildings. J Therm Anal Calorim. 2024;149(5):1935–61. doi:10.1007/s10973-023-12837-3. [Google Scholar] [CrossRef]
7. Vadamalraj N, Zingre K, Seshadhri S, Arjunan P, Srinivasan S. Hybrid ventilation system and soft-sensors for maintaining indoor air quality and thermal comfort in buildings. Atmosphere. 2020;11(1):110. doi:10.3390/atmos11010110. [Google Scholar] [CrossRef]
8. Daissaoui A, Boulmakoul A, Karim L, Lbath A. IoT and big data analytics for smart buildings: a survey. Procedia Comput Sci. 2020;170(15):161–8. doi:10.1016/j.procs.2020.03.021. [Google Scholar] [CrossRef]
9. Patel C, Solanki KL, Kumar V, Chakradhar V, Panigrahi SK. IoT-driven monitoring and controlling to improve performance of thermoelectric air conditioning system. J Build Eng. 2024;95(5):110081. doi:10.1016/j.jobe.2024.110081. [Google Scholar] [CrossRef]
10. Zhang WJ, Zhang CL. Transient modeling of an air conditioner with a rapid cycling compressor and multi-indoor units. Energy Convers Manag. 2011;52(1):1–7. doi:10.1016/j.enconman.2010.05.002. [Google Scholar] [CrossRef]
11. ANSI/ASHRAE. ASHRAE Fundamentals Handbook [Internet]. Atlanta, GA, USA: American Society of Heating, Refrigerating, and Air-Conditioning Engineer, Inc.; 2017 [cited 2024 Dec 24 1]. Available from: www.ashrae.org. [Google Scholar]
12. Kang L, Wang G, Wang Y, An Q. The power simulation of water-cooled central air-conditioning system based on demand response. IEEE Access. 2020;8(5):67396–407. doi:10.1109/access.2020.2986309. [Google Scholar] [CrossRef]
13. Arsad FS, Hod R, Ahmad N, Baharom M, Ja’afar MH. Assessment of indoor thermal comfort temperature and related behavioural adaptations: a systematic review. Environ Sci Pollut Res Int. 2023;30(29):73137–49. doi:10.1007/s11356-023-27089-9. [Google Scholar] [PubMed] [CrossRef]
14. Homod RZ, Gaeid KS, Dawood SM, Hatami A, Sahari KS. Evaluation of energy-saving potential for optimal time response of HVAC control system in smart buildings. Appl Energy. 2020;271(9):115255. doi:10.1016/j.apenergy.2020.115255. [Google Scholar] [CrossRef]
15. Zhao W, Liu J, Zhang B, Jian C, Zhang H, Du X. Evaluation and application research on thermal comfort of mining face in hot and humid mines. Case Stud Therm Eng. 2024;59(1):104493. doi:10.1016/j.csite.2024.104493. [Google Scholar] [CrossRef]
16. Liu Y, Yao W, Gao W. Thermal environment evaluation and thermal comfort zone deviation—a case study of Chinese seaweed house in summer. J Build Eng. 2023;78(4):107703. doi:10.1016/j.jobe.2023.107703. [Google Scholar] [CrossRef]
17. dos Reis AS, Vaquero P, Dias MF, Tavares A. Passive discomfort index as an alternative to predicted mean vote and predicted percentage of dissatisfied to assess occupant’s thermal discomfort in dwellings. Energy Rep. 2022;8(1):956–65. doi:10.1016/j.egyr.2022.07.128. [Google Scholar] [CrossRef]
18. Kawakubo S, Sugiuchi M, Arata S. Office thermal environment that maximizes workers’ thermal comfort and productivity. Build Environ. 2023;233(5):110092. doi:10.1016/j.buildenv.2023.110092. [Google Scholar] [CrossRef]
19. Balbis-Morejón M, Rey-Hernández JM, Amaris-Castilla C, Velasco-Gómez E, San José-Alonso JF, Rey-Martínez FJ. Experimental study and analysis of thermal comfort in a university campus building in tropical climate. Sustainability. 2020;12(21):8886. doi:10.3390/su12218886. [Google Scholar] [CrossRef]
20. Lakhiar MT, Sanmargaraja S, Olanrewaju A, Lim CH, Ponniah V, Mathalamuthu AD. Evaluating and comparing objective and subjective thermal comfort in a Malaysian green office building: a case study. Case Stud Therm Eng. 2024;60(11):104614. doi:10.1016/j.csite.2024.104614. [Google Scholar] [CrossRef]
21. Iatauro D, Lavinia C, Nardi I, Sannino R. Thermal comfort monitoring in office buildings: a case study. E3S Web Conf. 2024;523:06006. doi:10.1051/e3sconf/202452306006. [Google Scholar] [CrossRef]
22. Galarretta IJJ, Ibarra EJB, Fronda RMA. Developing a wearable automatic air conditioning control system based on thermal comfort. In: Proceedings of the 2022 IEEE 18th International Colloquium on Signal Processing & Applications (CSPA); 2022 May 12; Selangor, Malaysia. doi:10.1109/CSPA55076.2022.9782031. [Google Scholar] [CrossRef]
23. de Dear R, Brager G. Adaptive comfort and mixed-mode conditioning. In: Sustainable built environments. New York, NY, USA: Springer US; 2020. p. 481–94. doi:10.1007/978-1-0716-0684-1_1049. [Google Scholar] [CrossRef]
24. Tsay YS, Chen R, Fan CC. Study on thermal comfort and energy conservation potential of office buildings in subtropical. Build Environ. 2022;208:108625. doi:10.1016/j.buildenv.2021.108625. [Google Scholar] [CrossRef]
25. Hassan KN, Biswas S, Uddin MF. Electrical power consumption profile modelling of air conditioner for smart grid load management. In: Proceedings of the 2020 11th International Conference on Electrical and Computer Engineering (ICECE); 2020 Dec 17–9; Dhaka, Bangladesh. doi:10.1109/icece51571.2020.9393101. [Google Scholar] [CrossRef]
26. Potvin JR. Predicting maximum acceptable efforts for repetitive tasks: an equation based on duty cycle. Hum Factors. 2012;54(2):175–88. doi:10.1177/0018720811424269. [Google Scholar] [PubMed] [CrossRef]
27. Sanchez J, Jiang Z, Cai J. Modelling and mitigating lifetime impact of building demand responsive control of heating, ventilation and air-conditioning systems. J Build Perform Simul. 2022;15(6):771–87. doi:10.1080/19401493.2022.2094466. [Google Scholar] [CrossRef]
28. MOEA. Energy Policies. Energy Saving Regulation [Internet]. Taipei, Taiwan: Ministry of Economic Affairs; 2014 [cited 2024 Sep 15]. Available from: www.moeaea.gov.tw/ECW/english/content/ContentLink2.aspx?menu_id=965&sub_menu_id=1519. [Google Scholar]
29. ANSI/ASHRAE Standard 169. Climatic Data for Building Design Standards [Internet]. Atlanta, GA, USA: American Society of Heating, Refrigerating, and Air-Conditioning Engineer, Inc.; 2021 [cited 2024 Dec 15]. Available from: www.ashrae.org. [Google Scholar]
30. Central Weather Administration (CWA). Climate Statistic Monthly Data in Taiwan [Internet]. 2024 [cited 2024 Jul 14]. Available from: https://www.cwa.gov.tw/V8/E/C/Statistics/monthlydata.html. [Google Scholar]
31. Liao CT. Study on exterior wall tile degradation conditions of high-rise buildings in Taoyuan city. J Asian Archit Build Eng. 2018;17(3):549–56. doi:10.3130/jaabe.17.549. [Google Scholar] [CrossRef]
32. Ferreira C, Barrelas J, Silva A, de Brito J, Dias IS, Flores-Colen I. Impact of environmental exposure conditions on the maintenance of facades’ claddings. Buildings. 2021;11(4):138. doi:10.3390/buildings11040138. [Google Scholar] [CrossRef]
33. Carlini M, Castellucci S, Ceccarelli I, Rotondo M, Mennuni A. Study of a thermal dispersion in buildings and advantages of ceramic coatings for the reduction of energy expenditure. Energy Rep. 2020;6(October 2017):116–28. doi:10.1016/j.egyr.2020.08.031. [Google Scholar] [CrossRef]
34. ANSI/ASHRAE Standard 55. Thermal Environment Condition for Human Occupancy [Internet]. Atlanta, GA, USA: American Society of Heating, Refrigerating, and Air-Conditioning Engineer, Inc.; 2020 [cited 2024 Dec 15]. Available from: www.ashrae.org. [Google Scholar]
35. Tartarini F, Schiavon S, Cheung T, Hoyt T. CBE Thermal Comfort Tool: online tool for thermal comfort calculations and visualizations. SoftwareX. 2020;12(6):100563. doi:10.1016/j.softx.2020.100563. [Google Scholar] [CrossRef]
36. ISO. ISO 7730:2005. Ergonomics of the thermal environment—analytical determination and interpretation of thermal comfort using calculation of the PMV and PPD indices and local thermal comfort criteria. Geneva, Switzerland: International Organization for Standardization; 2005 [cited 2024 Dec 15]. Available from: www.iso.org/standard. [Google Scholar]
37. Fabbri K. The indoor thermal comfort indexes PMV and PPD. In: Thermal comfort perception. Cham: Springer International Publishing; 2024. p. 83–135. doi:10.1007/978-3-031-52610-7_4. [Google Scholar] [CrossRef]
38. ISO. ISO 7726:1998. Ergonomics of the thermal environment—instruments for measuring physical quantities. Geneva, Switzerland: International Organization for Standardization; 1998 [cited 2025 Dec 15]. Available from: www.iso.org/standard. [Google Scholar]
39. Zheng J, Du Y, Zhu X, Dong W. Mapping global human thermal comfort: spatiotemporal variability of UTCI regions under climate change. Sustain Cities Soc. 2025;119(6):106111. doi:10.1016/j.scs.2024.106111. [Google Scholar] [CrossRef]
40. Taiwan Power Company Rate Schedules [Internet]. Taipei, Taiwan: Taiwan Power Company; 2024 [cited 2025 Apr 15]. Available from: www.taipower.com.tw/2764/2765/2801/56429/normalPost. [Google Scholar]
41. Asif A, Zeeshan M, Khan SR, Sohail NF. Investigating the gender differences in indoor thermal comfort perception for summer and winter seasons and comparison of comfort temperature prediction methods. J Therm Biol. 2022;110(4):103357. doi:10.1016/j.jtherbio.2022.103357. [Google Scholar] [PubMed] [CrossRef]
42. Faisal T, Salahuddin S, Ijaz Z, Ashraf U, Jan KU. Examining relationship between indoor thermals and visual environment of educational institute: a case study of engineering university, main campus Lahore. Qlantic J Soc Sci Humanit. 2024;5(4):98–105. doi:10.55737/qjssh.691003576. [Google Scholar] [CrossRef]
Cite This Article
 Copyright © 2025 The Author(s). Published by Tech Science Press.
This work is licensed under a Creative Commons Attribution 4.0 International License , which permits unrestricted use, distribution, and reproduction in any medium, provided the original work is properly cited.
 Downloads
 Citation Tools