
 Submit a Paper
 Propose a Special lssue
 Open Access
ARTICLE

Low-Carbon Economic Dispatch Strategy for Integrated Energy Systems with Blue and Green Hydrogen Coordination under GHCT and CET Mechanisms
1 School of Electric Power Engineering, School of Shen Guorong, Nanjing Institute of Technology, Nanjing, 211167, China
2 Jiangsu Collaborative Innovation Center for Smart Distribution Network, Nanjing, 211100, China
3 State Grid Huaian Power Supply Company, Huai’an, 223000, China
4 State Grid Jiangsu Electric Power Co., Ltd., Nanjing, 210000, China
* Corresponding Author: Aidong Zeng. Email:
(This article belongs to the Special Issue: Revolution in Energy Systems: Hydrogen and Beyond)
Energy Engineering 2025, 122(9), 3793-3816. https://doi.org/10.32604/ee.2025.069410
Received 22 June 2025; Accepted 30 July 2025; Issue published 26 August 2025
 View Full Text
 Download PDF
Abstract
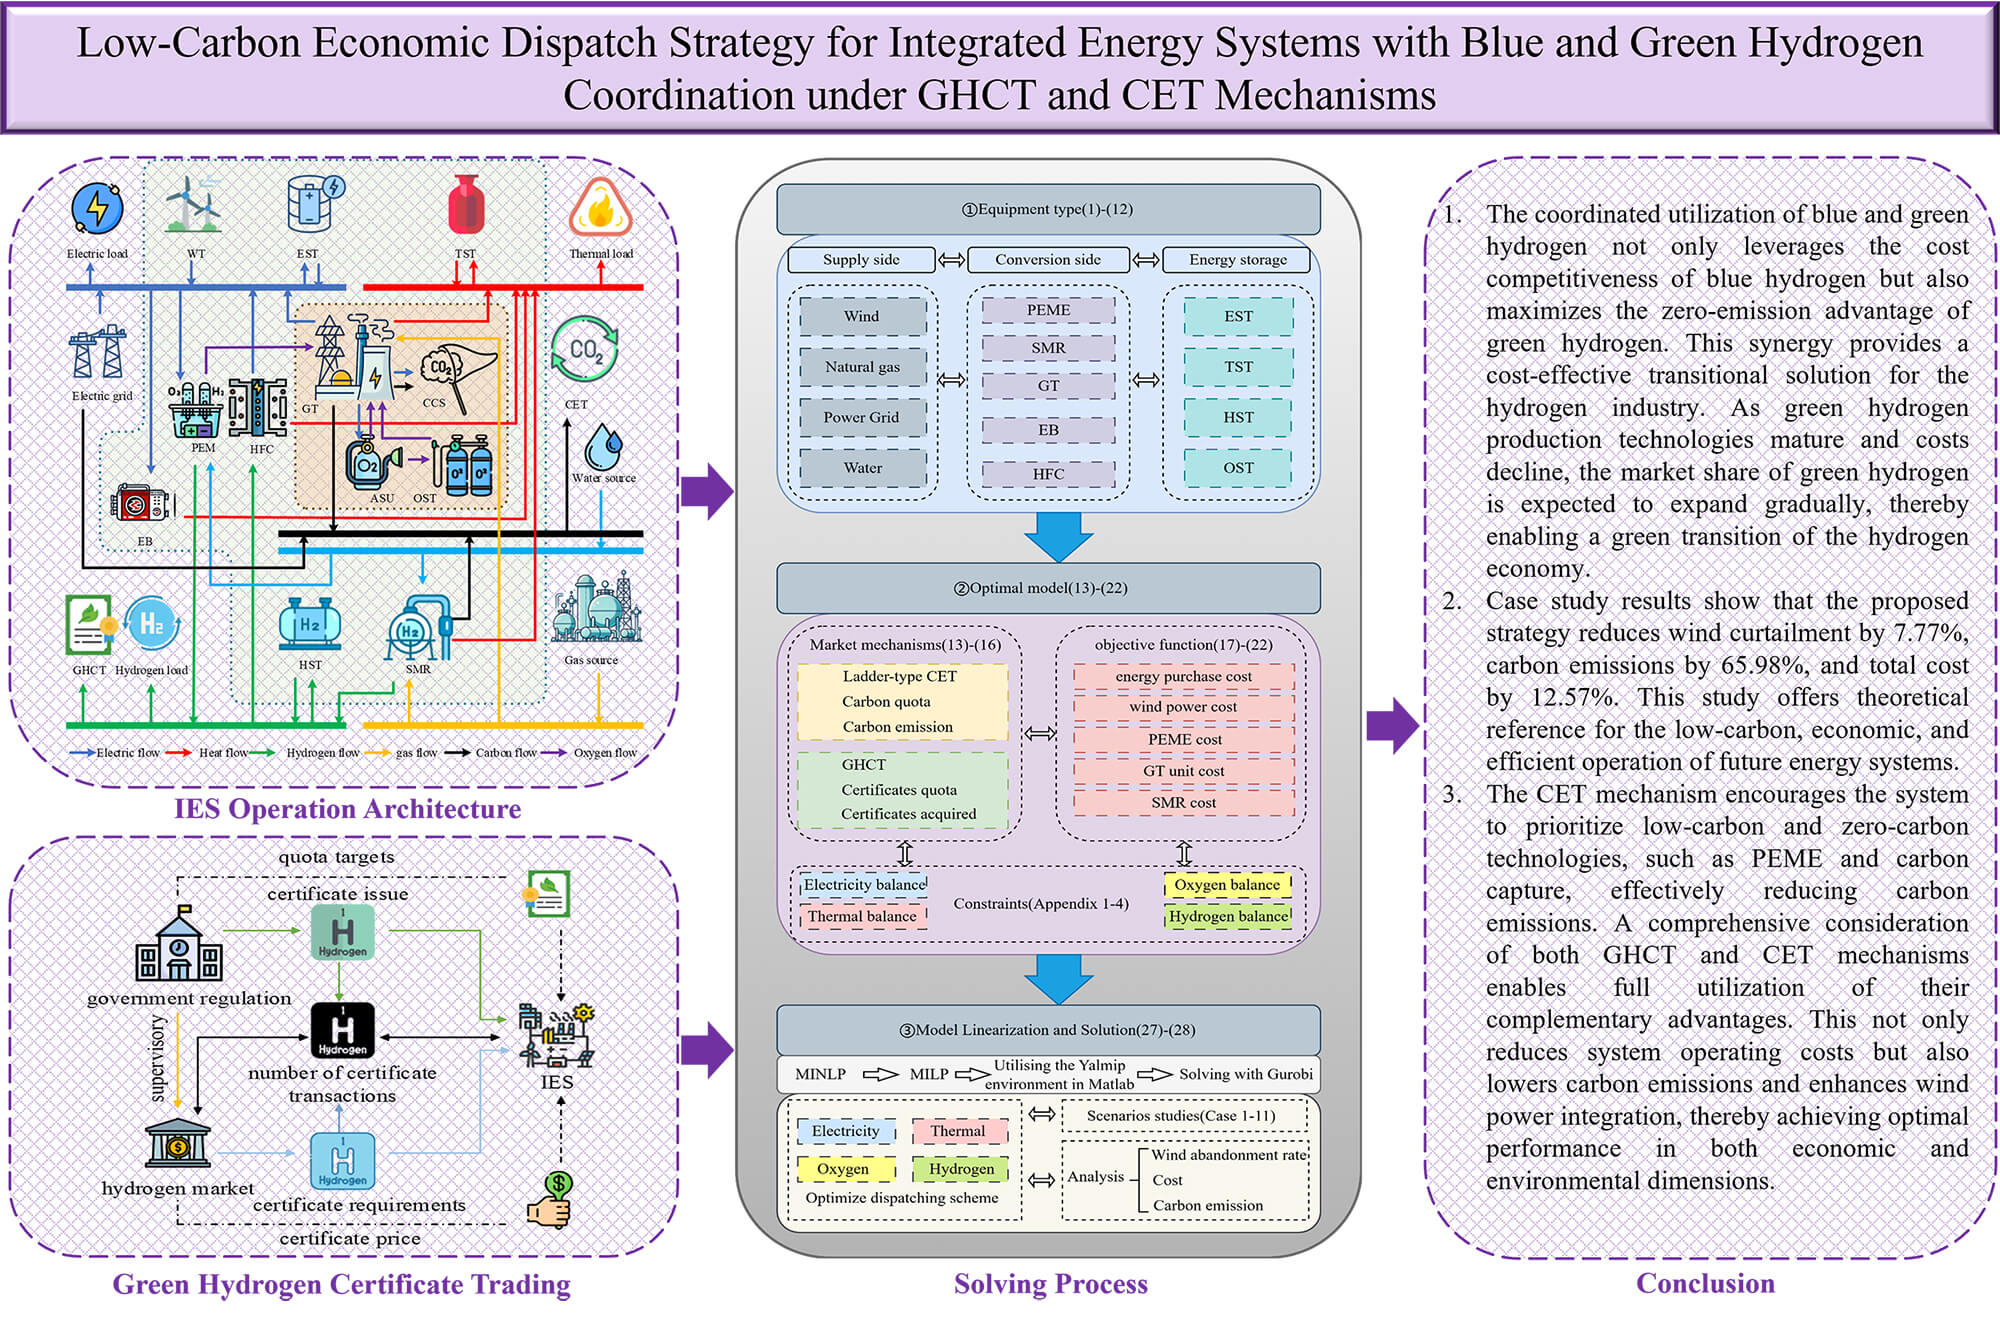
With the intensification of the energy crisis and the worsening greenhouse effect, the development of sustainable integrated energy systems (IES) has become a crucial direction for energy transition. In this context, this paper proposes a low-carbon economic dispatch strategy under the green hydrogen certificate trading (GHCT) and the ladder-type carbon emission trading (CET) mechanism, enabling the coordinated utilization of green and blue hydrogen. Specifically, a proton exchange membrane electrolyzer (PEME) model that accounts for dynamic efficiency characteristics, and a steam methane reforming (SMR) model incorporating waste heat recovery, are developed. Based on these models, a hydrogen production–storage–utilization framework is established to enable the coordinated deployment of green and blue hydrogen. Furthermore, the gas turbine (GT) unit are retrofitted using oxygen-enriched combustion carbon capture (OCC) technology, wherein the oxygen produced by PEME is employed to create an oxygen-enriched combustion environment. This approach reduces energy waste and facilitates low-carbon power generation. In addition, the GHCT mechanism is integrated into the system alongside the ladder-type CET mechanism, and their complementary effects are investigated. A comprehensive optimization model is then formulated to simultaneously achieve carbon reduction and economic efficiency across the system. Case study results show that the proposed strategy reduces wind curtailment by 7.77%, carbon emissions by 65.98%, and total cost by 12.57%. This study offers theoretical reference for the low-carbon, economic, and efficient operation of future energy systems.Graphic Abstract
Keywords
Against the backdrop of depleting fossil fuel reserves and continuously growing energy demand, the low-carbon transition of the energy structure has become increasingly imperative. Meanwhile, with the rapid expansion of renewable energy capacity, the power system is facing challenges in renewable energy accommodation. As a high-quality secondary energy carrier complementary to electricity, hydrogen exhibits broad application prospects in sectors such as transportation, industry, and power systems [1]. IES, characterized by multi-energy flow coordination and optimization, provide an effective platform for coupling hydrogen with electricity and thermal energy, thereby offering a promising pathway to address the aforementioned challenges.
A large number of studies have been focused on the coupled utilisation of hydrogen energy in IES. Ref. [2] developed a collaborative hydrogen production model based on multiple renewable energy sources, significantly enhancing energy conversion efficiency; Ref. [3] proposed a planning methodology for electricity-hydrogen coupled systems under high-renewable penetration scenarios. These studies lay a solid theoretical foundation for advancing hydrogen integration into IES. Hydrogen as energy carrier can be produced however, freshwater supply for hydrogen production at largescale would be major challenge as electrolyser requires high quality freshwater as suggested by several researchers [4,5].
Hydrogen can be produced via multiple pathways, including fossil fuel-based hydrogen production, water electrolysis, and industrial by-product hydrogen. The resulting hydrogen is generally categorized as blue and green hydrogen. Among them, green hydrogen is produced by electrolysis of water, a process with near-zero carbon emissions, which is a key direction for the future development of hydrogen energy [6,7]. Ref. [8] highlighted the substantial potential of producing green hydrogen from surplus hydropower, which can help alleviate the energy crisis and reduce carbon emissions. Ref. [9] emphasized the feasibility of integrated renewable-driven green hydrogen systems as a transformative solution for achieving energy independence. Ref. [10] assessed the impact of renewable hydrogen production on future power systems, providing valuable insights for energy transition planning. Ref. [11] developed a two-level planning and operation model for water-hydrogen integrated energy systems, demonstrating that hydrogen systems can enhance overall system stability and economic performance. Ref. [12] established a multi-timescale scheduling model for integrated energy systems based on zero-carbon hydrogen, effectively reducing system costs while achieving zero carbon emissions. The above studies on hydrogen-integrated energy systems primarily focus on green hydrogen. To reduce hydrogen production costs and explore the feasibility of a gradual transition to low-carbon green hydrogen systems, integrating both green and blue hydrogen within an IES framework holds significant research value.
Blue hydrogen, on the other hand, is produced from fossil fuels and currently has a cost advantage. Ref. [13] suggests that in the short term, leveraging the cost advantage of fossil fuels to develop hydrogen-related infrastructure and integrate the hydrogen supply chain is a pragmatic approach, thereby enabling a gradual transition from fossil-based hydrogen to renewable-based hydrogen production. Ref. [14] explored the complementary and competitive dynamics between blue and green hydrogen, concluding that prioritizing the development of blue hydrogen at this stage is more conducive to market expansion and can facilitate the future growth of green hydrogen. Ref. [15] highlights the critical role of blue hydrogen as a major low-cost source during the energy transition phase. Ref. [16] incorporated gas-based hydrogen production into a multi-energy integrated system and proposed a flexible energy supply mode that couples electrolytic and methane-based hydrogen production, enhancing the system’s economic performance, carbon reduction, and operational flexibility. Ref. [17] further analyzed the impact of different hydrogen production pathways on carbon emissions in integrated energy networks. Against the backdrop of the still high cost of green hydrogen and an undeveloped industrial chain, blue hydrogen has significant economic viability in the early stages of hydrogen energy promotion.
In addition, there is a waste of resources in the existing hydrogen production pathways. PEME is considered an ideal approach for green hydrogen production from renewable energy sources, owing to its high efficiency, strong dynamic response, and wide power regulation range. SMR, on the other hand, is currently the most widely adopted and technologically mature hydrogen production method based on fossil fuels. However, both SMR and PEME processes involve resource wastage: SMR discharges waste heat, while the oxygen by-product from PEME is typically vented and unused [18]. The secondary utilization of these resources may provide valuable support for the transition from blue hydrogen to green hydrogen. To this end, the waste heat generated by SMR can be recovered, and OCC technology can be introduced. Specifically, the oxygen produced by PEME can be used for oxygen-enriched combustion in the GT unit. Ref. [19] proposed a coordinated operation mode for IES that considers OCC and hydrogen blending in GT units, and verified the energy-saving and carbon-reduction benefits of integrating OCC with hydrogen energy resources. Ref. [20] addressed the issue of unused by-product oxygen from hydrogen production and proposed a configuration and optimal scheduling method for an integrated energy system that incorporates hydrogen-based ammonia production in thermal power units, along with ammonia co-firing and oxygen-enriched combustion, thereby enabling full utilization of system by-products. OCC features high carbon reduction efficiency, and its integration with hydrogen energy systems holds significant low-carbon potential that warrants further research.
In terms of market regulatory mechanisms, the CET mechanism and the GHCT mechanism provide strong support for promoting low-carbon operation of IES and the development of green hydrogen. Ref. [21] developed a hydrogen-based IES operation framework under a carbon trading environment, achieving reductions in cost, carbon emissions, and wind power curtailment. Ref. [22] developed an IES model incorporating offshore wind-powered hydrogen production under the CET framework. Ref. [23] investigated the environmental value of green hydrogen by modeling hydrogen transmission networks in detail and accounting for the benefits of green certificates associated with power-to-hydrogen processes. Ref. [24] proposed a coordinated optimization model for integrated energy systems under multi-market coupling conditions, in which hydrogen energy, carbon certificates, and green certificates are deeply integrated through hydrogen and carbon price mechanisms to enhance the economic performance and low-carbon operation of the system. Ref. [25] investigated a multi-timescale optimization strategy for hydrogen-based integrated energy systems under the coupling of green certificate and carbon trading mechanisms, achieving improvements in both economic efficiency and carbon reduction. Most existing studies consider either the CET or GHCT mechanism in isolation and have not sufficiently explored their combined impact on the optimal operation of IES integrating both green and blue hydrogen pathways.
To address the gaps in existing research, this paper proposes a low-carbon economic dispatch strategy for IES that incorporates both green and blue hydrogen under the GHCT and CET mechanisms.
First, a hydrogen production-storage-utilization model is established, which includes a PEME model considering dynamic efficiency characteristics and an SMR model incorporating waste heat recovery.
Second, the GT unit is retrofitted by introducing OCC technology, where the oxygen produced by PEME is utilized to create an oxygen-enriched combustion environment, thereby improving energy utilization and enabling low-carbon power supply.
Furthermore, the GHCT mechanism is incorporated into the system, and its complementary effect with the ladder-type CET mechanism is analyzed.
Finally, an integrated optimization model is developed to simultaneously achieve low carbon emissions and economic performance. The effectiveness of the proposed strategy is validated through case studies, with results showing a 7.77% reduction in wind power curtailment, a 65.98% decrease in carbon emissions, and a 12.57% reduction in total system cost.
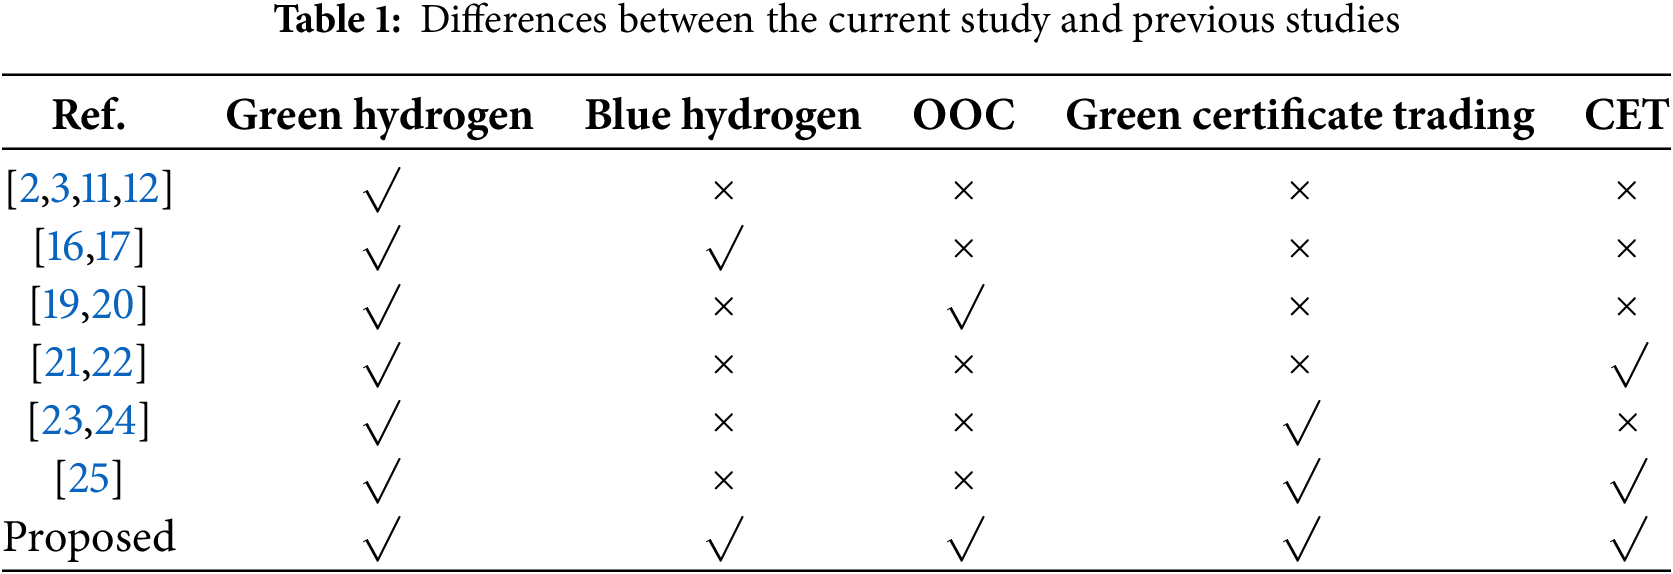
A comparison between the proposed method and existing studies is presented in Table 1.
The IES, as shown in Fig. 1, is constructed to encompass multiple stages of energy supply, conversion, storage, and utilization. The system derives its energy from the power grid, wind power, water sources, and natural gas. On the demand side, the energy loads include electricity, hydrogen, and thermal loads. The energy conversion side consists of PEME, SMR, GT unit, hydrogen fuel cell (HFC), and electric boiler (EB). The storage devices include an electrical storage tank (EST), thermal storage tank (TST), hydrogen storage tank (HST), and oxygen storage tank (OST). The purple section in the figure represents the overall operational framework of the IES under market mechanisms. The green section illustrates the specific devices included in the IES, while the brown section highlights the GT unit retrofitted with the OOC technology.
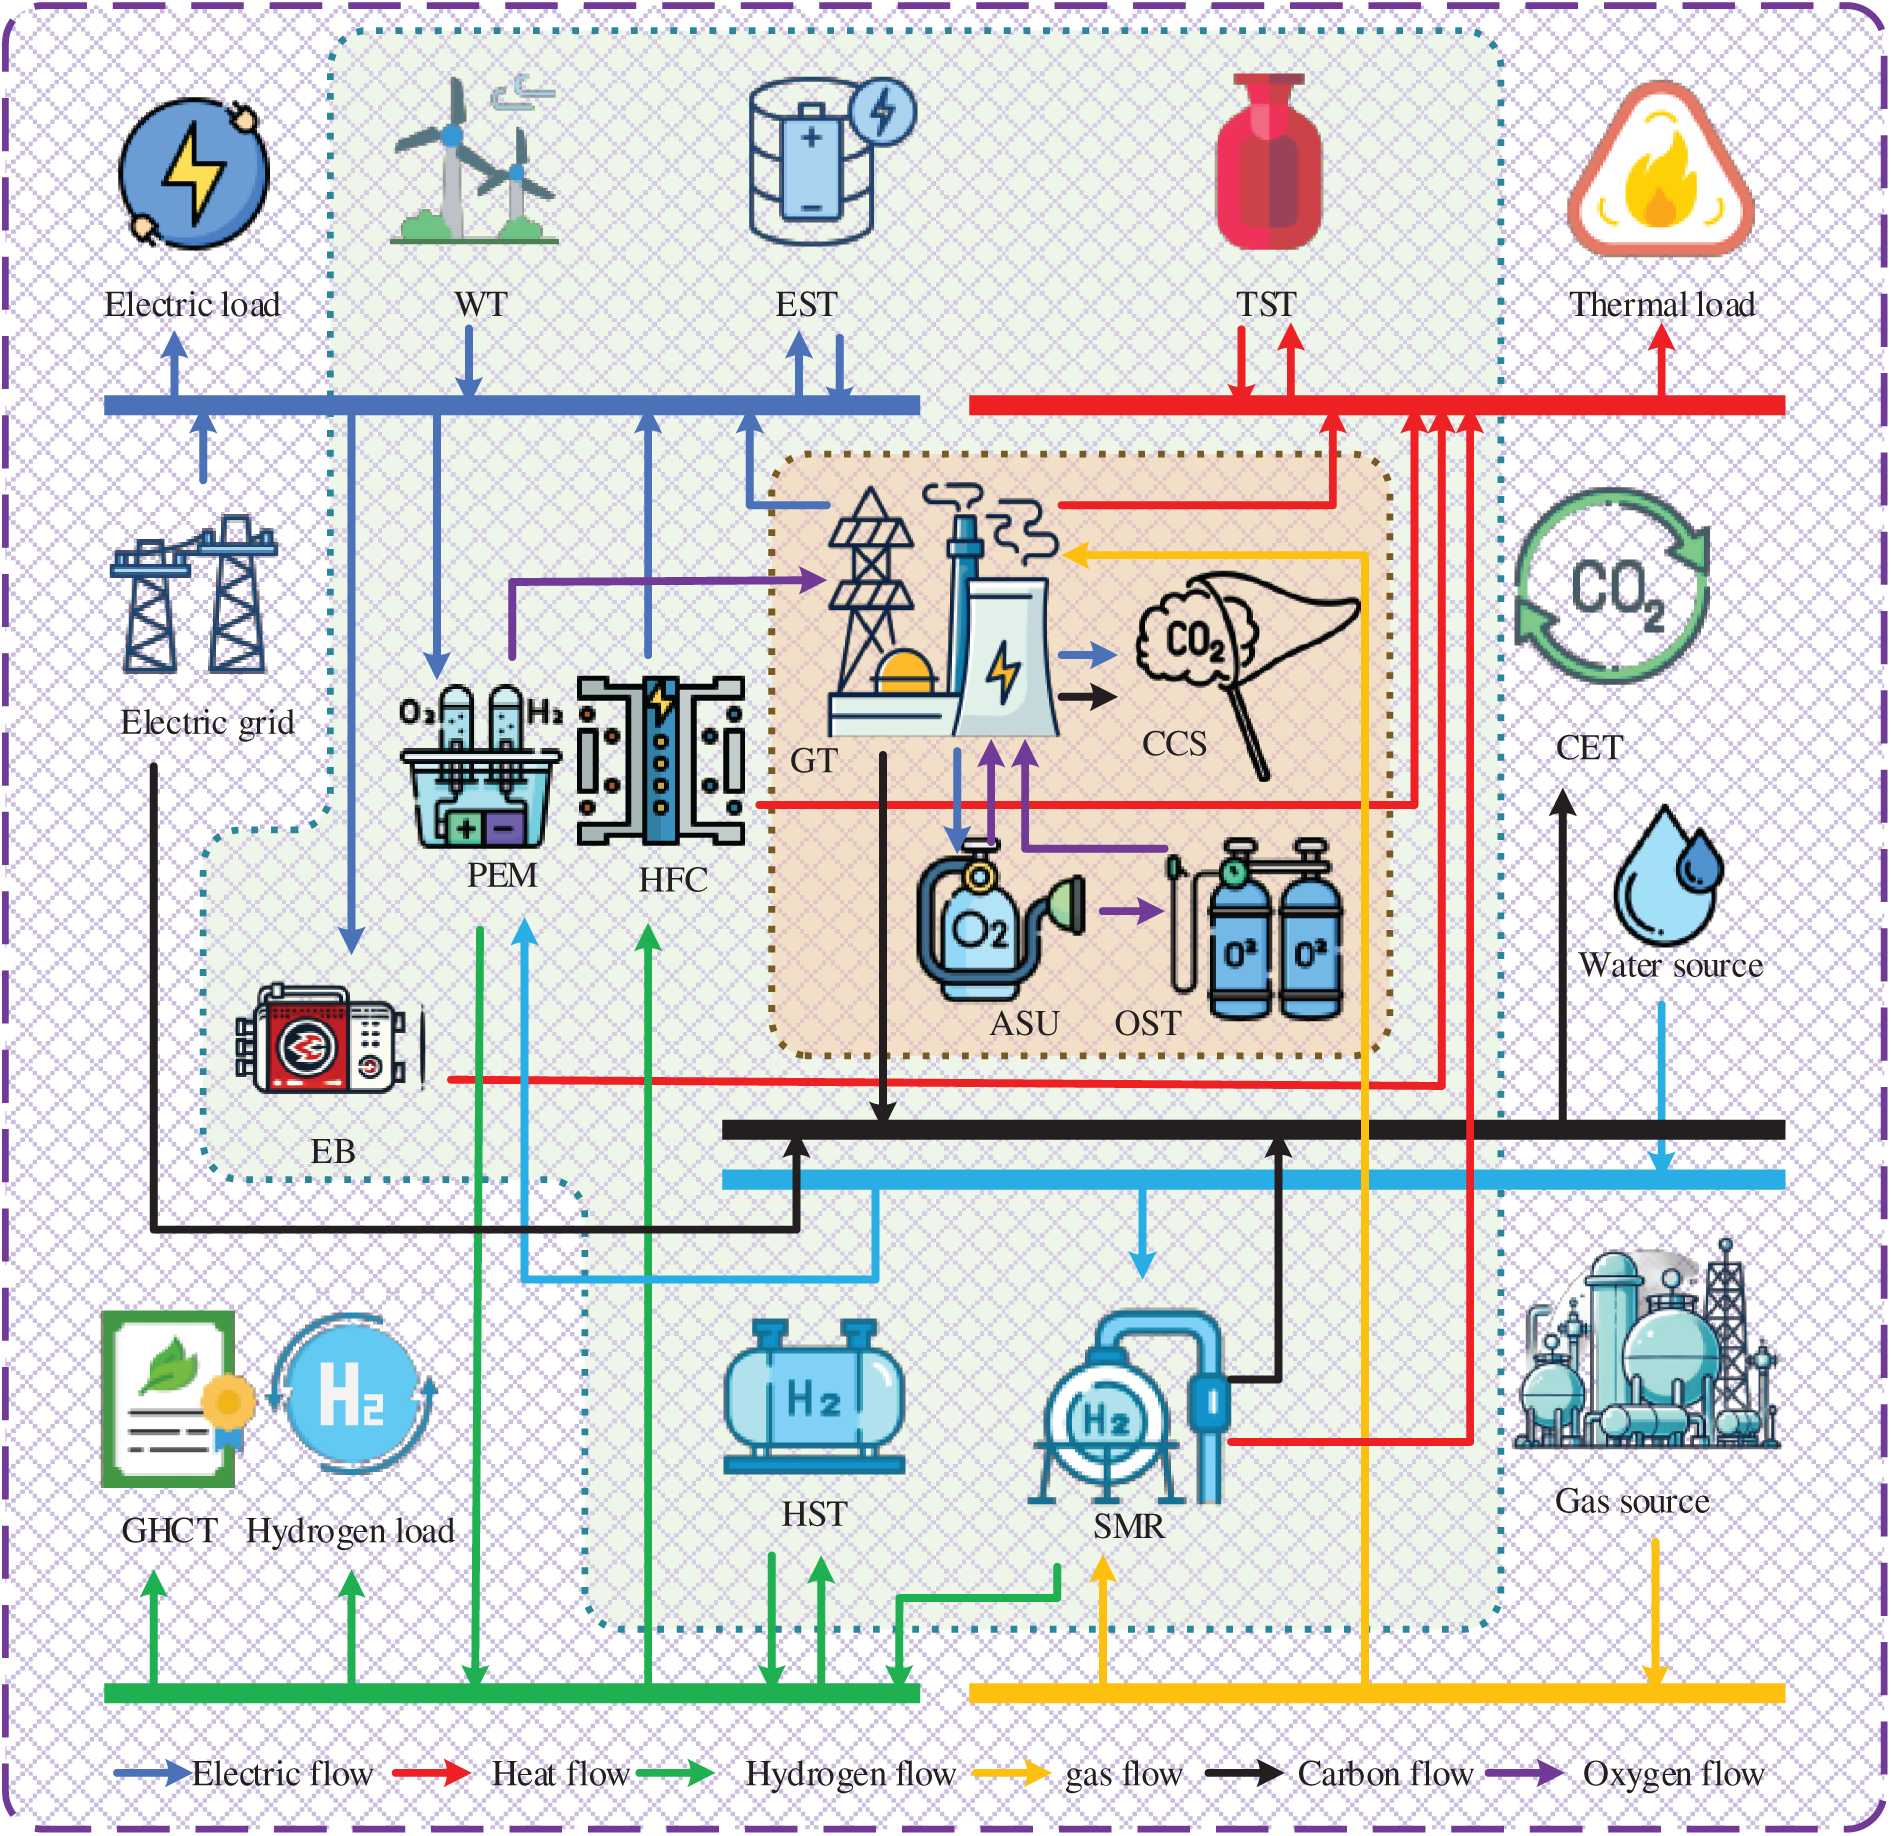
Figure 1: Integrated energy system operation architecture
2.2 Hydrogen Production-Utilization-Storage Model
PEME utilizes electrical energy to produce green hydrogen, with no carbon emissions during the entire process. However, it consumes both electricity and water. The model is as follows:
where
To ensure the hydrogen production equipment model more accurately reflects real-world conditions, this paper treats the hydrogen production efficiency of the PEME as a variable dependent on the input power. The electric power consumption of the PEME at time
where
The calculation of
where
The hydrogen production efficiency of the PEME is determined by both the Faradaic efficiency and the voltage efficiency. Based on Faraday’s law, it is expressed as follows:
where
Based on the above equations, a semi-empirical model of PEME power and efficiency can be derived by introducing current density as an intermediate variable. Under a fixed temperature of 333 K, the power–efficiency and power–hydrogen production relationships of PEME are illustrated in Fig. 2. The blue lines represent the hydrogen production efficiency, while the red lines indicate the hydrogen production output. As shown in the figure, during the initial stage of operation, the hydrogen production efficiency of PEME increases rapidly with rising input power. After reaching its peak, further increases in power lead to a gradual decline in efficiency. Meanwhile, as the power level continues to rise, the hydrogen output increases accordingly. However, due to fluctuations in efficiency, the growth slope of hydrogen production first increases and then decreases.
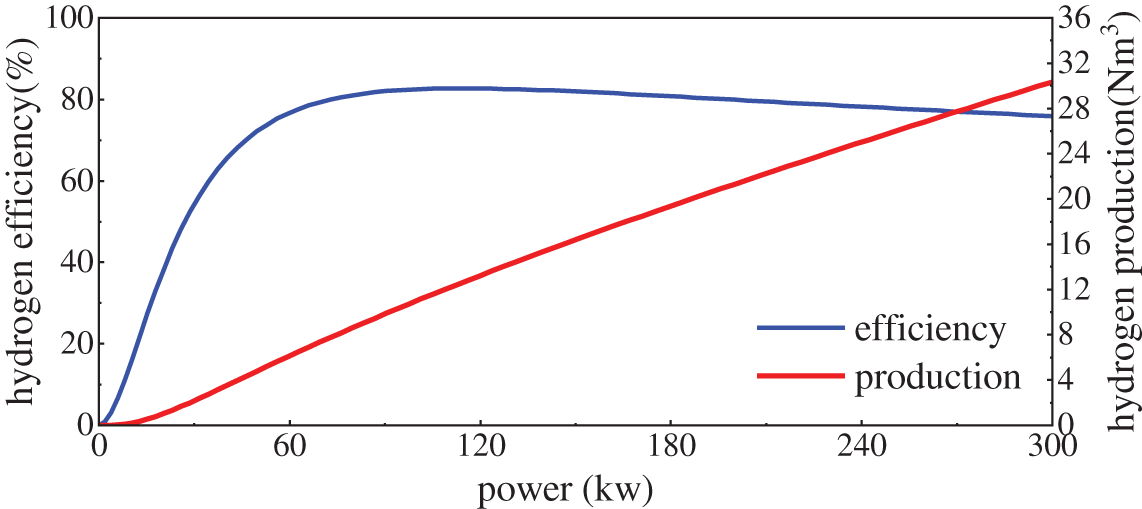
Figure 2: Characteristic power-efficiency-yield curve of PEME hydrogen production at 333 K
SMR produces blue hydrogen from natural gas and is currently one of the most mature industrial hydrogen production technologies. It is also considered the simplest and most cost-effective method [28]. During the hydrogen production process, SMR consumes water and releases waste heat and CO2. The model is as follows:
where
HFC is clean and emission-free, serving as a key coupling component for hydrogen-to-electricity conversion. The model is as follows:
where
As a mature hydrogen storage technology, HST have been widely adopted. The corresponding model is given as follows:
where
2.3 Oxygen-Enriched Combustion Carbon Capture
Unlike conventional combustion technologies, OCC employs high-purity oxygen as the oxidant to increase the CO2 concentration in the flue gas, thereby facilitating carbon capture by downstream equipment. The energy flow of the oxygen-enriched combustion unit is illustrated by the brown section in Fig. 1. In this study, a back-pressure GT unit is selected for OCC-based retrofit, with a constant heat-to-power ratio. The corresponding model is as follows:
where
The internal energy consumption of the oxygen-enriched combustion unit includes the air separation unit (ASU) and the carbon capture equipment (CCE). Their power consumption can be dynamically adjusted based on the capture intensity of the CCE and the power demand of the ASU, thereby regulating the power delivered to the electrical and thermal loads. During the hydrogen production process via PEME, a large amount of high-purity oxygen is simultaneously generated and can be supplied to the GT unit for combustion. Since the GT unit requires an oxygen source in every time period, the ASU is configured to produce oxygen for constructing the oxygen-enriched combustion environment, while the oxygen storage tank is used to store the oxygen generated by the ASU for cross-period utilization. The corresponding model is as follows:
where
The OST model is similar to that of the HST and can also be represented by Eq. (7).
EB converts electrical energy into thermal energy, its model is given as follows:
where
The energy storage models include thermal storage and electrical storage, both of which can be uniformly represented by the following formulation:
where
3.1 Ladder-Type Carbon Emission Trading Mechanism
The CET mechanism serves as an important instrument for promoting system-wide carbon reduction. Through the carbon allowance trading market, power producers are incentivized to formulate rational production and emission plans based on their allocated carbon quotas, thereby achieving emission reduction targets. In the proposed system, only the GT unit is granted free carbon allowances, which are determined based on the unit’s electricity and heat outputs and can be expressed as follows:
where
Considering the carbon emissions from grid electricity purchases and hydrogen production via SMR, the actual carbon emissions of the system are given by:
where
The ladder-type CET mechanism defines multiple carbon allowance purchase tiers, where a higher quantity of carbon purchases corresponds to a higher unit price. This mechanism provides stronger incentives for emission reduction. The corresponding carbon trading cost is expressed as follows:
where
3.2 Green Hydrogen Certificate Trading Mechanism
At present, the production cost of green hydrogen remains relatively high; however, its environmental benefits are significant. To address this, the green certificate trading mechanism in the electricity market is introduced into the hydrogen market, and the trading price of green hydrogen certificates is determined based on certificate demand. Holding a green hydrogen certificate indicates that the hydrogen is produced via PEME. If the amount of green hydrogen production fails to meet the government-mandated quota, the system is required to purchase green certificates; otherwise, a penalty will be imposed. Conversely, if the green hydrogen production exceeds the quota, the system receives an equivalent number of green certificates, which can be sold for economic gain. A schematic diagram of the GHCT mechanism is shown in Fig. 3.
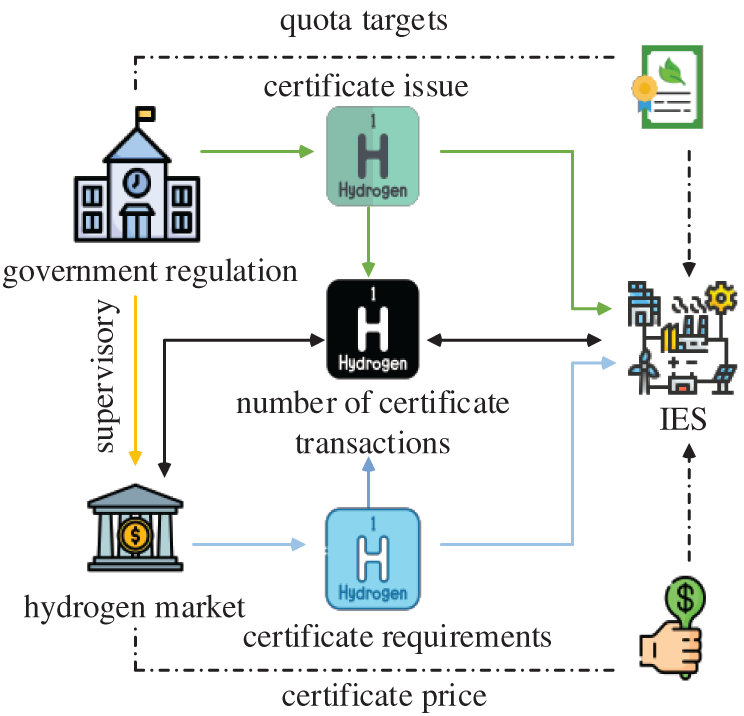
Figure 3: Schematic diagram of green hydrogen certificate trading
Under market dynamics, the trading price of green certificates varies with their quantity. According to the Cournot model formulation [29], the market trading price of green hydrogen certificates can be expressed as:
where
From the perspective of economic cost, this paper proposes an objective function aimed at minimizing the total system cost, under the premise of meeting the electricity, hydrogen, and thermal load demands of the IES. A 24-h scheduling horizon is adopted with a time step of 1 h. The objective function is formulated as follows:
where
Constraints, including electricity, thermal, hydrogen, and oxygen balances:
where
4.3 Model Linearization and Solution
Considering the power–efficiency characteristics of PEME introduces nonlinearity into the model, thereby increasing the complexity of the solution process. To address this, a piecewise linearization strategy is adopted, in which the power–output curve is divided into N segments and approximated linearly within each segment. This approach simplifies the model structure and improves computational efficiency. The principle of piecewise linearization is illustrated as follows:
where
Since the absolute value term in Eq. (19) introduces nonlinearity, an auxiliary variable representing power fluctuation,
The mixed-integer nonlinear programming (MINLP) problem is thereby transformed into a mixed-integer linear programming (MILP) problem, which can be solved using the Gurobi solver within the YALMIP environment in MATLAB. The solution procedure is illustrated in Fig. 4.
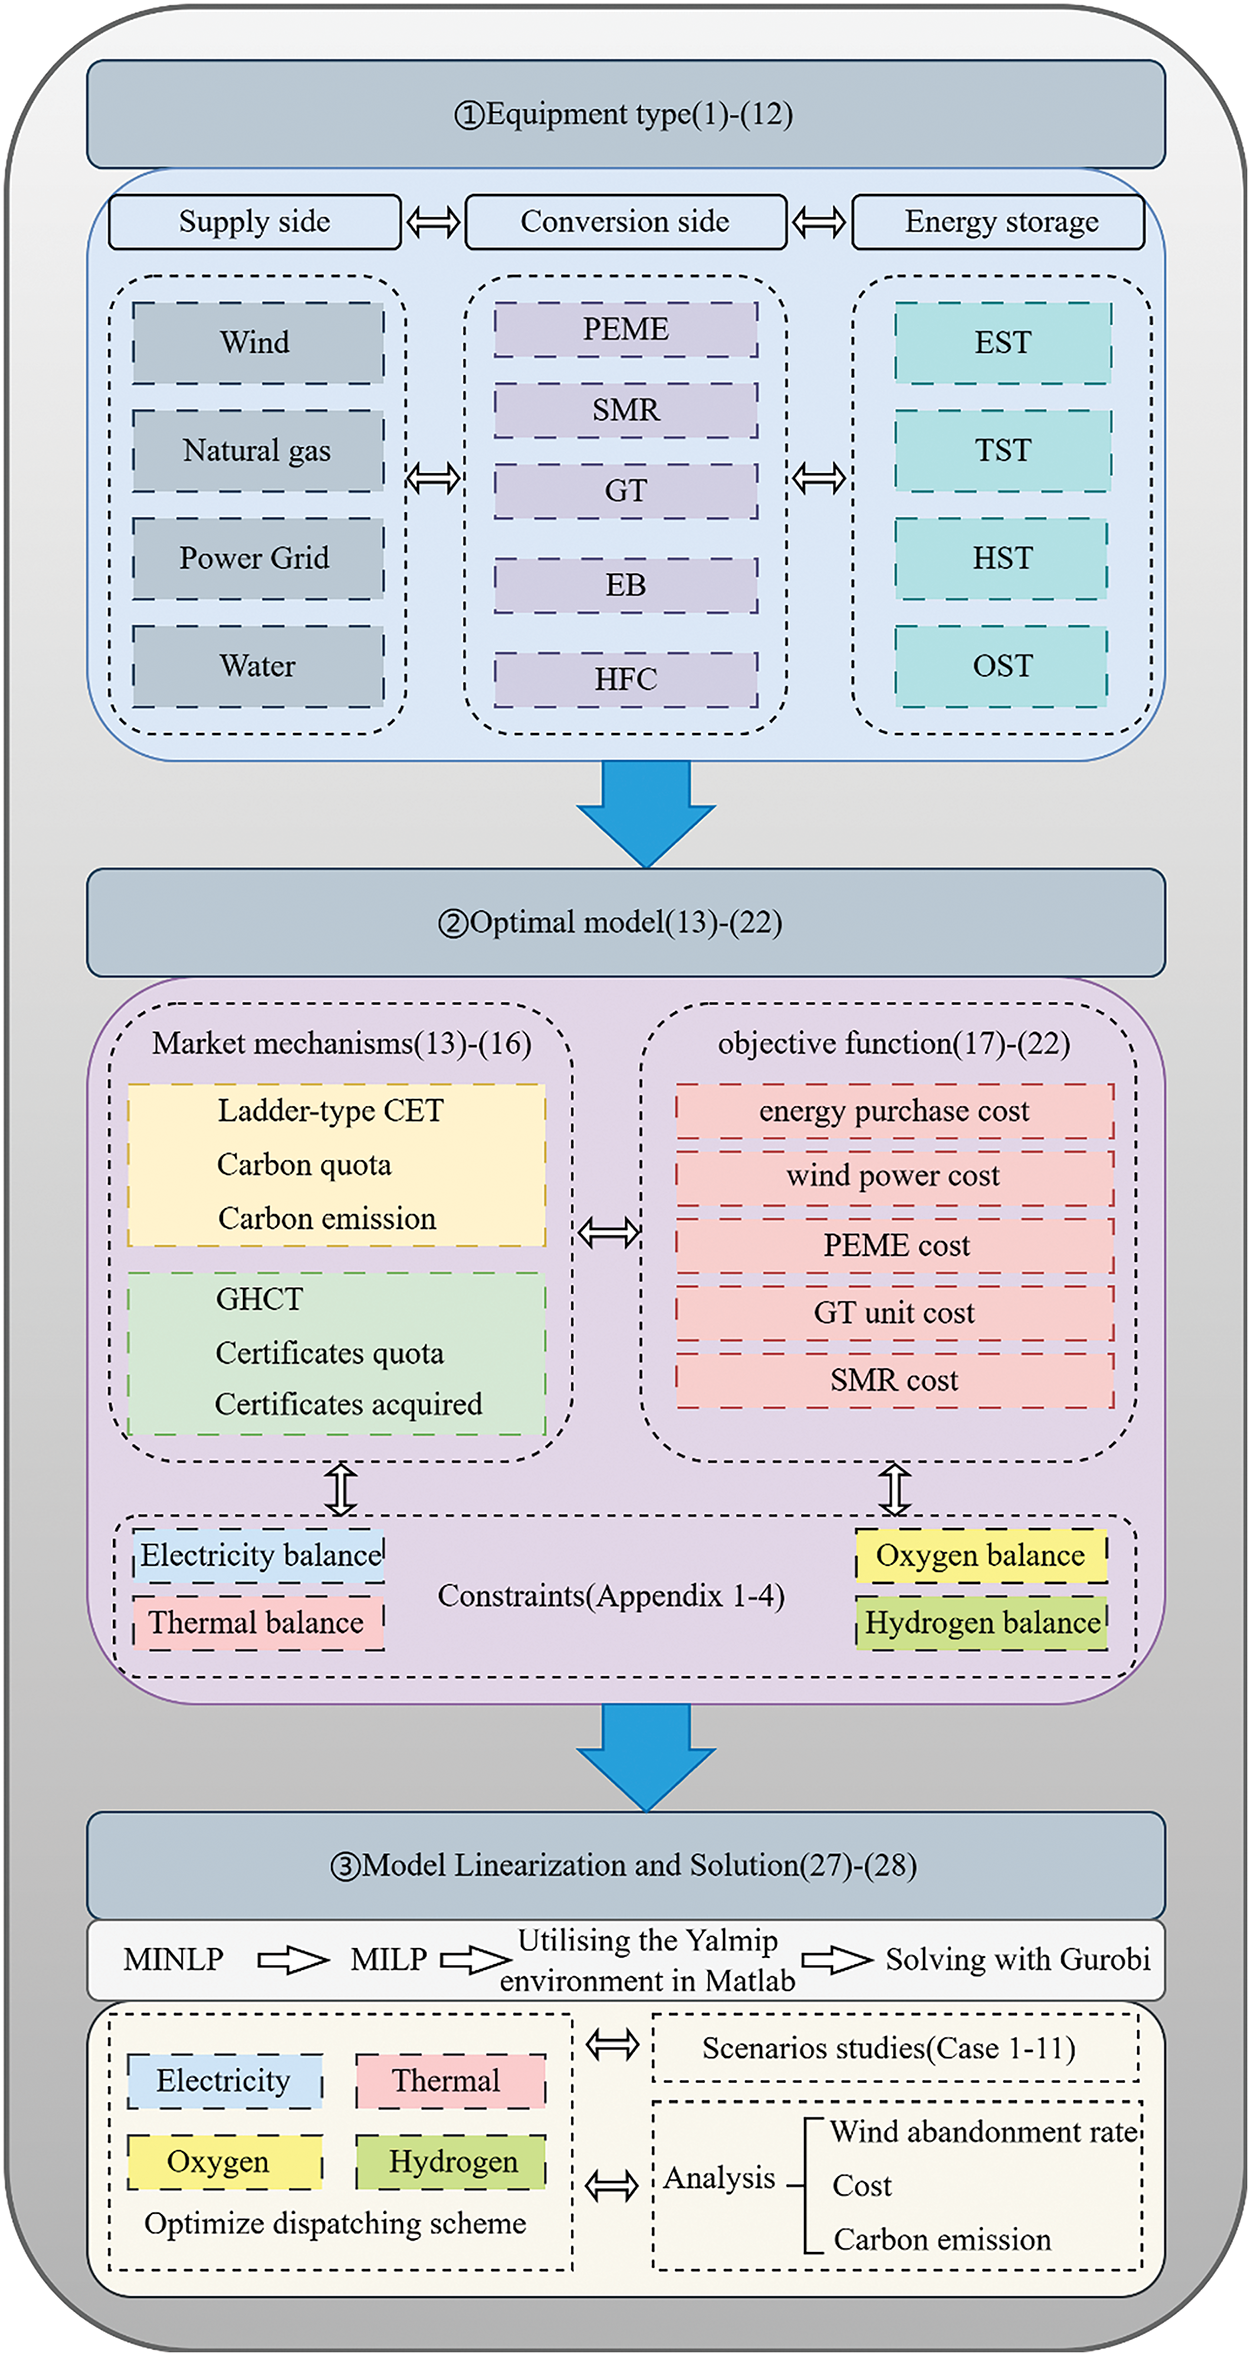
Figure 4: Schematic overview of the solving process
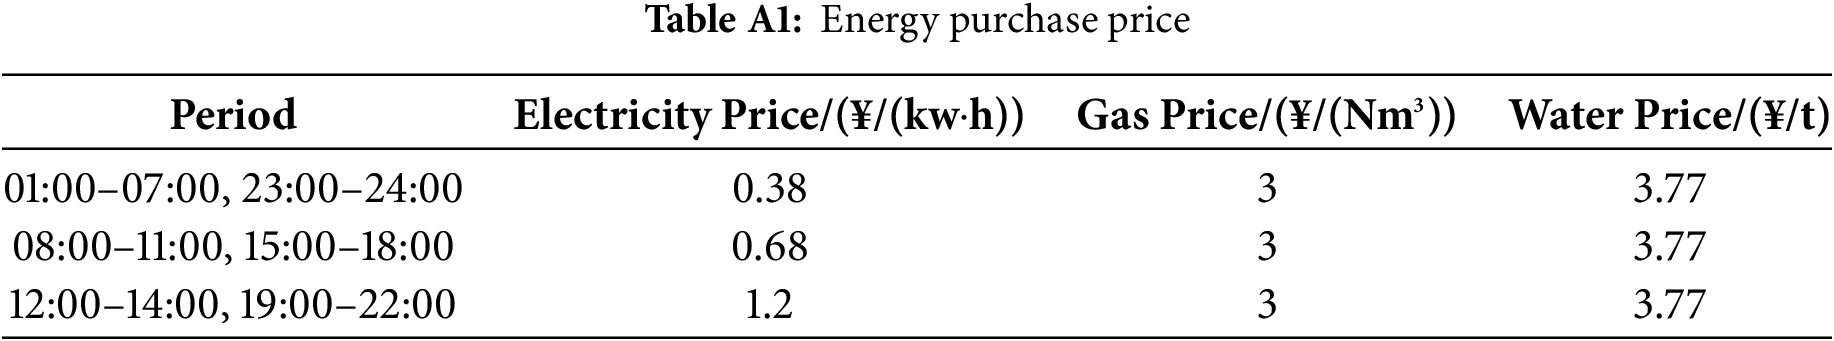
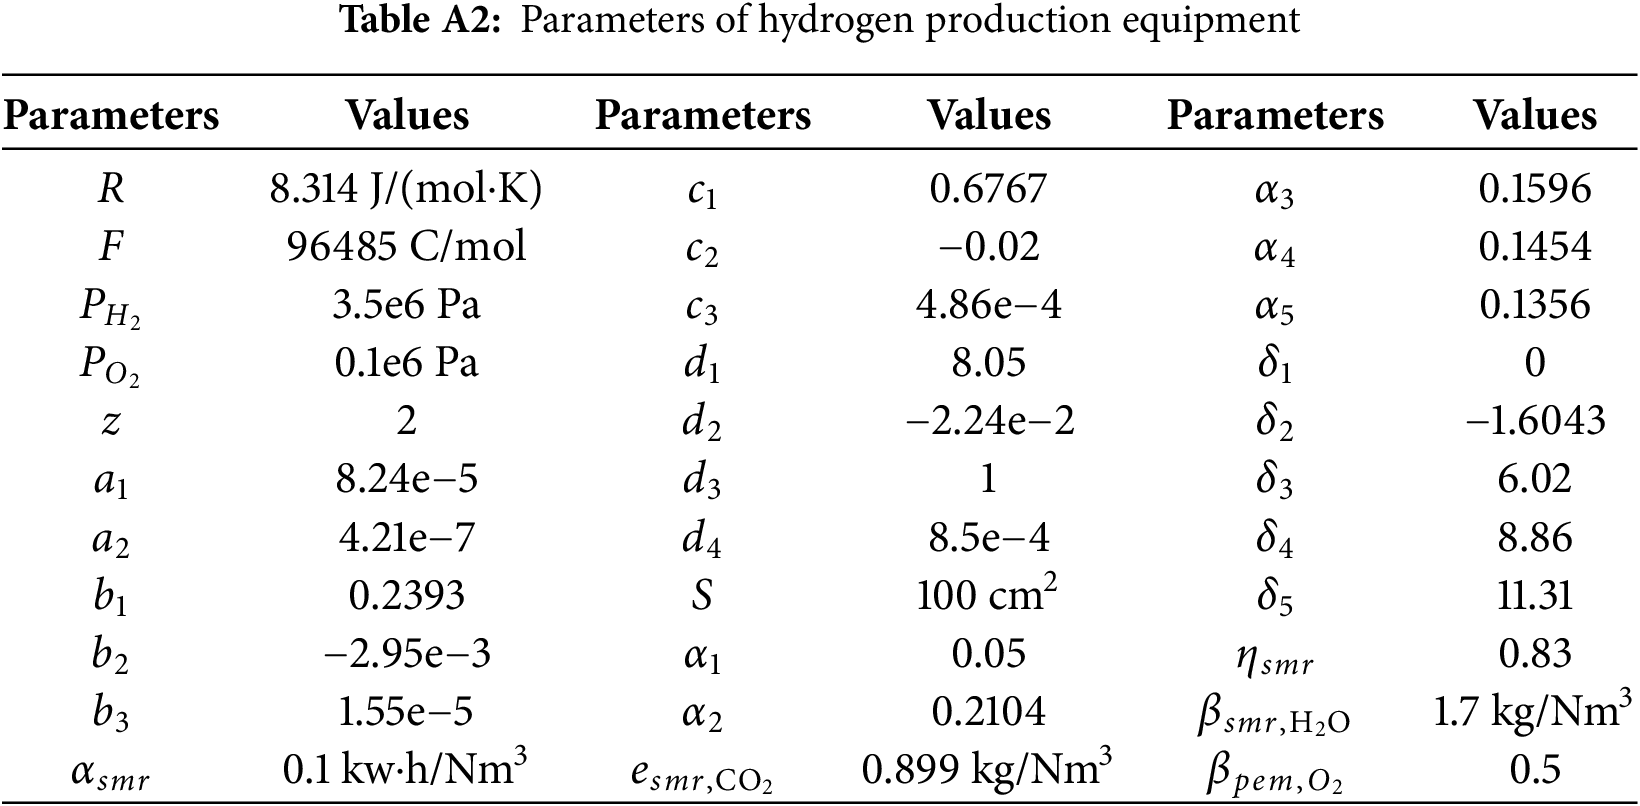
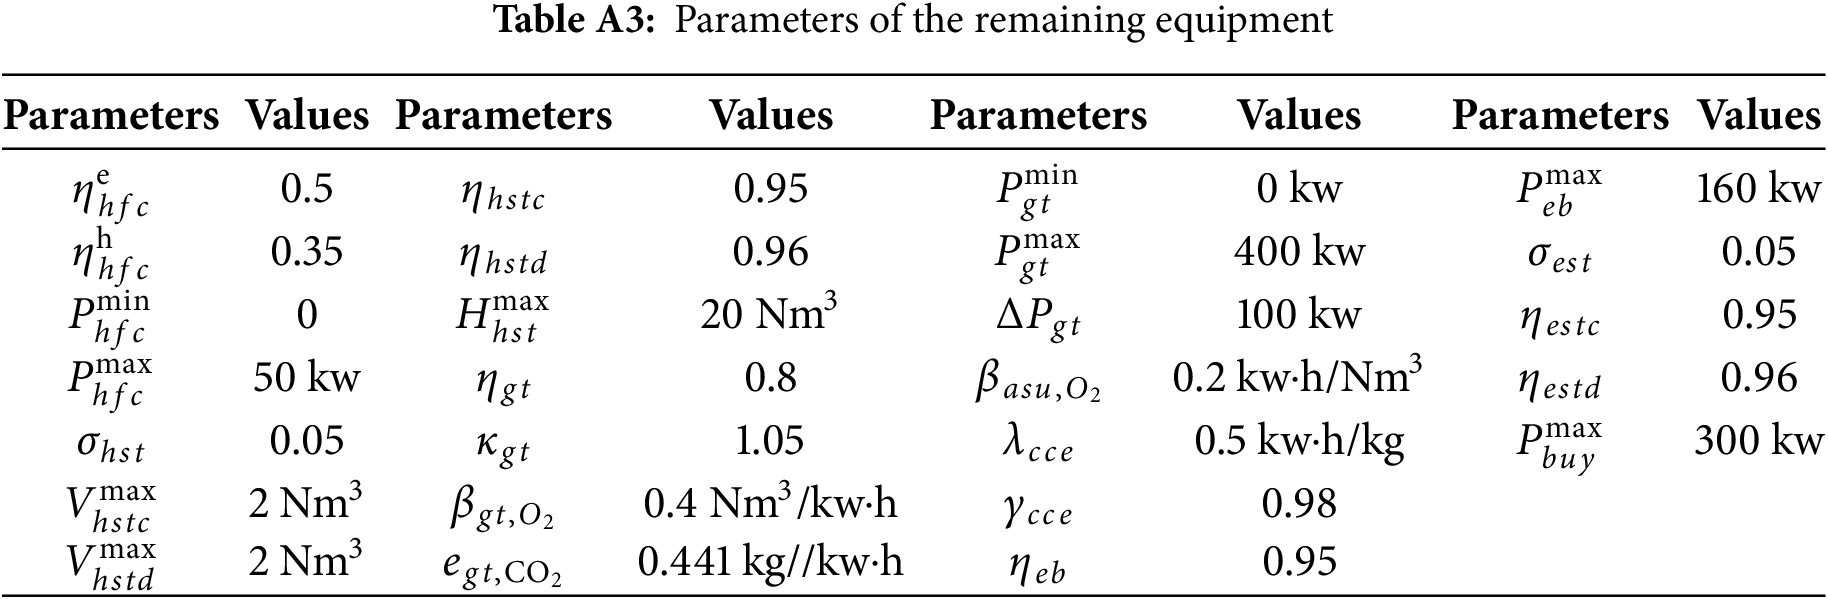
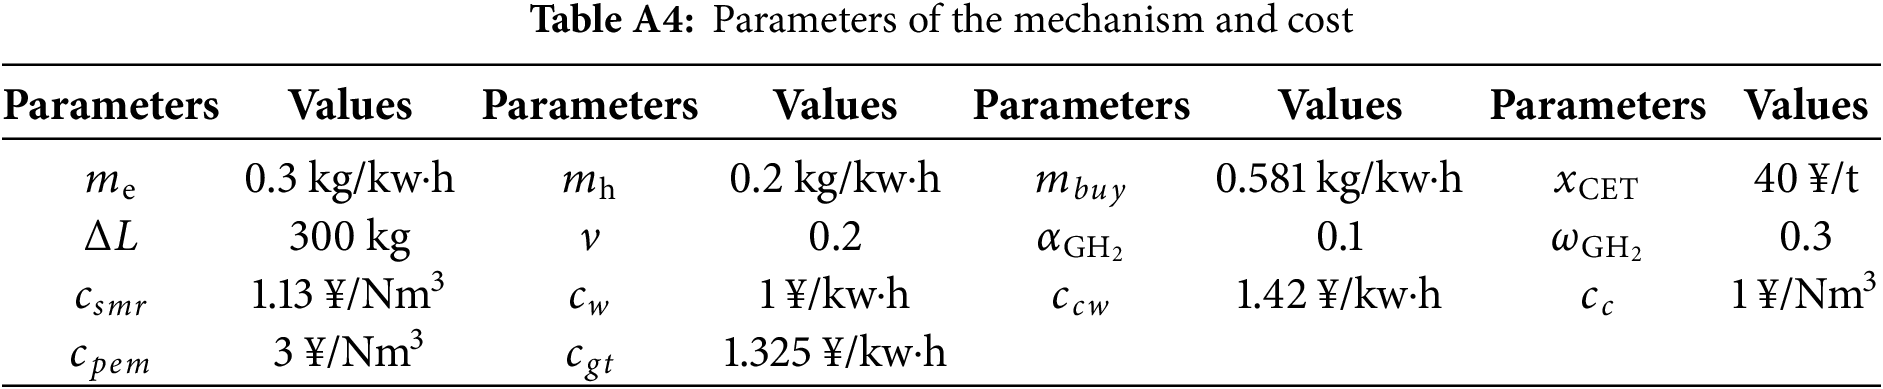
To validate the effectiveness of the proposed model, a case study is conducted based on the IES architecture shown in Fig. 1. The time-of-use electricity price, natural gas price, and water price are listed in Table A1. The hydrogen production system consists of PEME and SMR, with relevant parameters provided in Table A2. Operating parameters for the remaining devices are detailed in Table A3. Mechanism parameters and cost coefficients are presented in Table A4. The hourly forecasts of load demand and wind turbine output over a day are shown in Fig. 5. The blue bars represent the predicted output of the wind turbines, the red line indicates the thermal load, the black line denotes the electrical load, and the green line represents the hydrogen load.
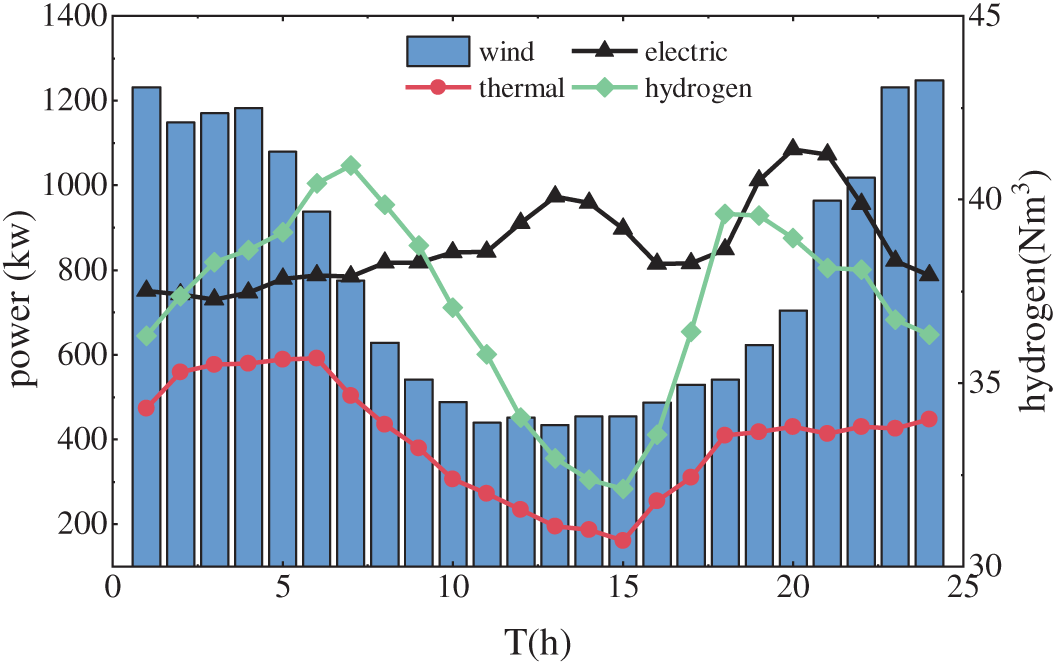
Figure 5: Load demand and wind output forecasts
To evaluate the overall effectiveness of the proposed model in optimizing IES operation, five cases are designed for comparative analysis: Case 1: Coordinated utilization of green and blue hydrogen, with hydrogen produced jointly by PEM and SMR. Case 2: Utilization of oxygen produced by PEME for oxygen-enriched combustion in the GT unit, and recovery of waste heat from SMR. Case 3: Only the GHCT mechanism is considered. Case 4: Only the ladder-type CET mechanism is considered. Case 5: Both the GHCT mechanism and the ladder-type CET mechanism are considered. The dispatch results for the five scenarios are presented in Table 2.
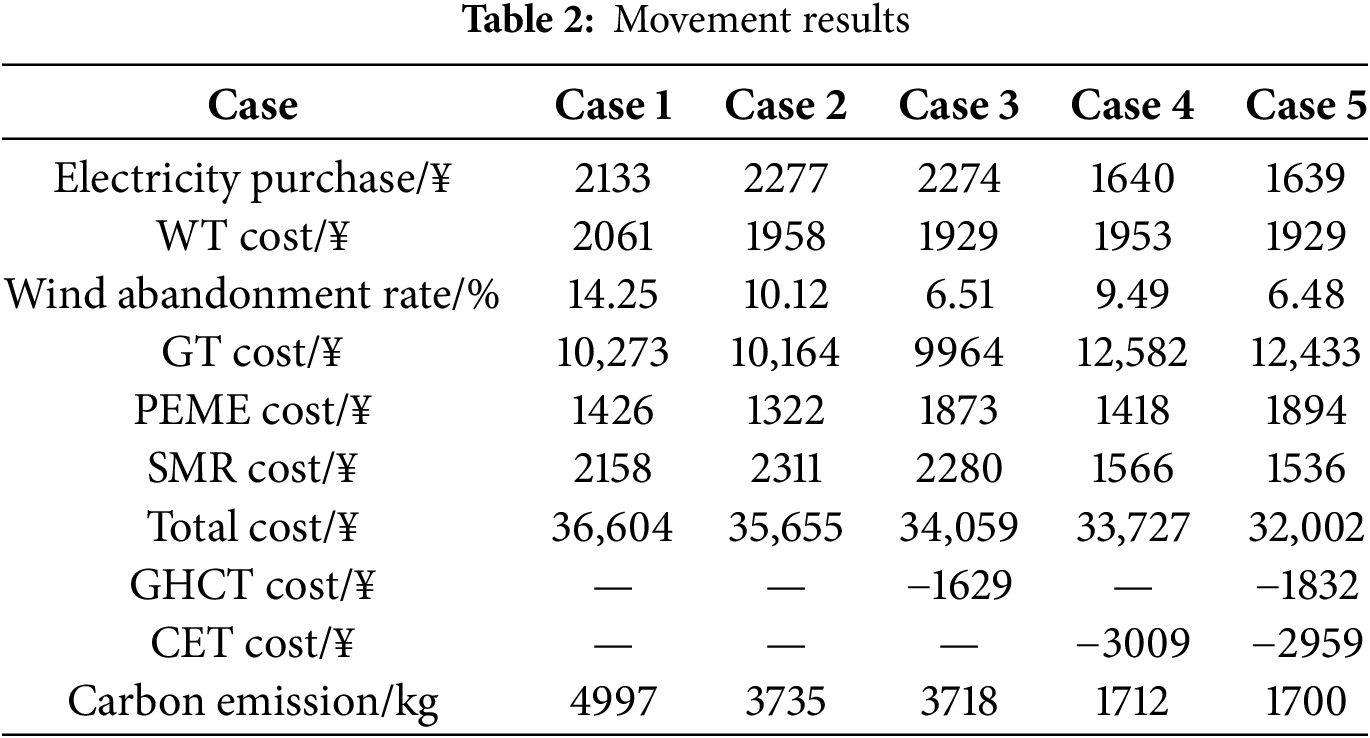
As shown in Table 2, compared with Case 1, the system operating cost in Case 2, Case 3, and Case 4 is reduced by 2.59%, 6.95%, and 7.86%, respectively; the wind power curtailment rate is reduced by 4.13%, 7.74%, and 4.72%; and carbon emissions are reduced by 25.26%, 25.60%, and 65.74%, respectively. These results highlight the positive effects of resource reuse, as well as the CET and GHCT mechanisms. Compared with Case 2, Case 5 considers both the GHCT and CET mechanisms simultaneously. Under this configuration, the system operating cost, wind curtailment rate, and carbon emissions are further reduced by 12.57%, 7.77%, and 65.98%, respectively. In addition, the revenue from green hydrogen certificate trading increases by 12.46%. These results demonstrate the effectiveness of jointly considering GHCT and CET in improving renewable energy utilization, enhancing system decarbonization, and reducing operational costs.
5.1 Effect Analysis of Oxygen-Enriched Combustion Carbon Capture Unit
To evaluate the effectiveness of the OCC unit, a comparison is made between Case 1 and Case 2 in terms of GT unit operation, carbon emissions, and wind curtailment. As shown in Table 2 and Fig. 6, Case 1 adopts conventional air combustion, whereas Case 2 employs oxygen-enriched combustion. Compared with Case 1, the carbon emissions in Case 2 are reduced by 25.25%. Figs. 7 and 8 show that CCE primarily operates during periods 1–7 and 22–24, which coincide with high wind generation intervals. By consuming the forced electrical output of the GT unit, additional space is created for wind power integration, resulting in a 4.13% reduction in the wind curtailment rate.
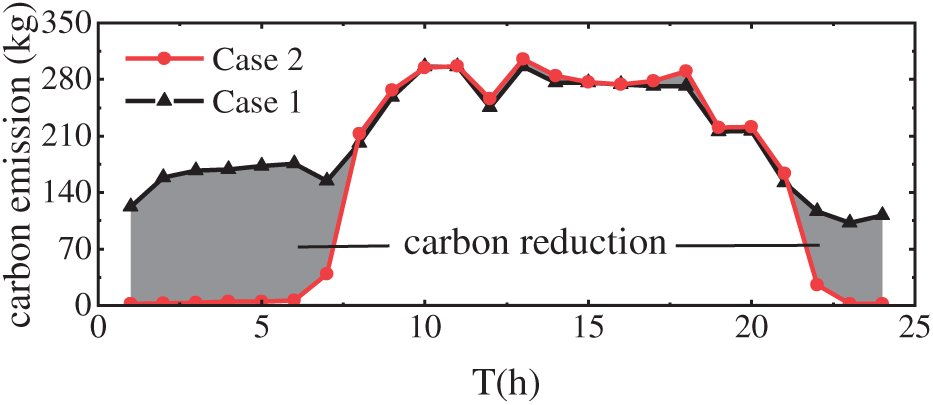
Figure 6: Carbon emissions by time period
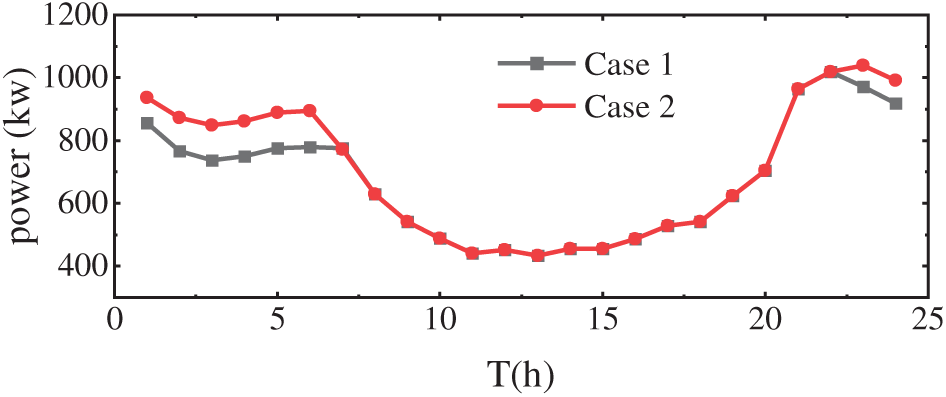
Figure 7: Wind power consumption
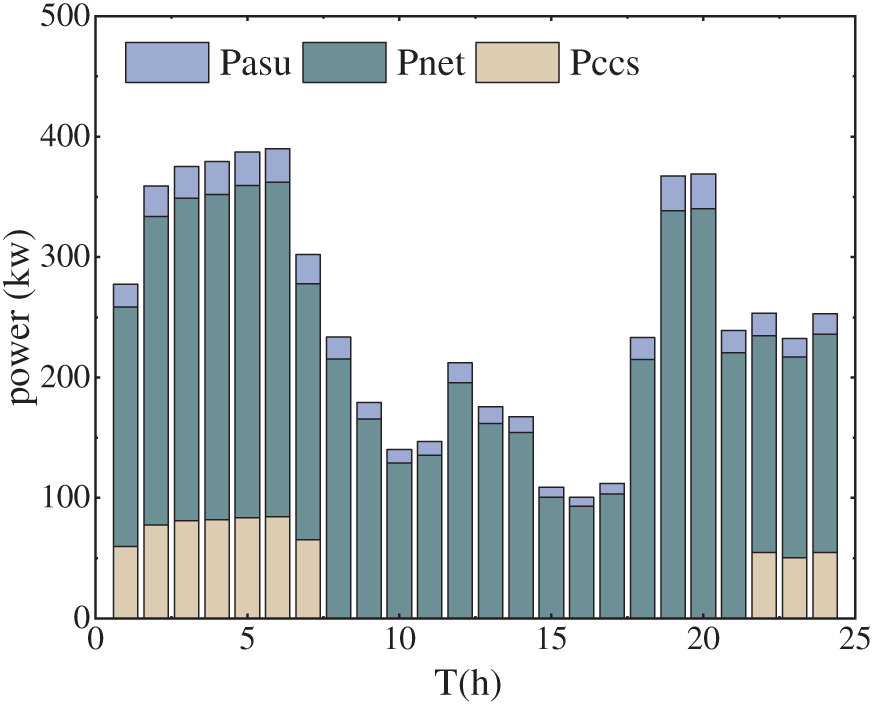
Figure 8: Composition of GT unit output
In Case 2, the OOC effectively reduces carbon emissions during the early morning and evening hours. However, since oxygen-enriched combustion requires a sufficient oxygen supply, the GT unit must operate under an oxygen-enriched environment. As shown in Fig. 9, HST enables the storage of oxygen produced by ASU and PEME during nighttime, which is then released during daytime operation. This facilitates cross-period oxygen utilization and supports the low-carbon retrofit of the GT unit.
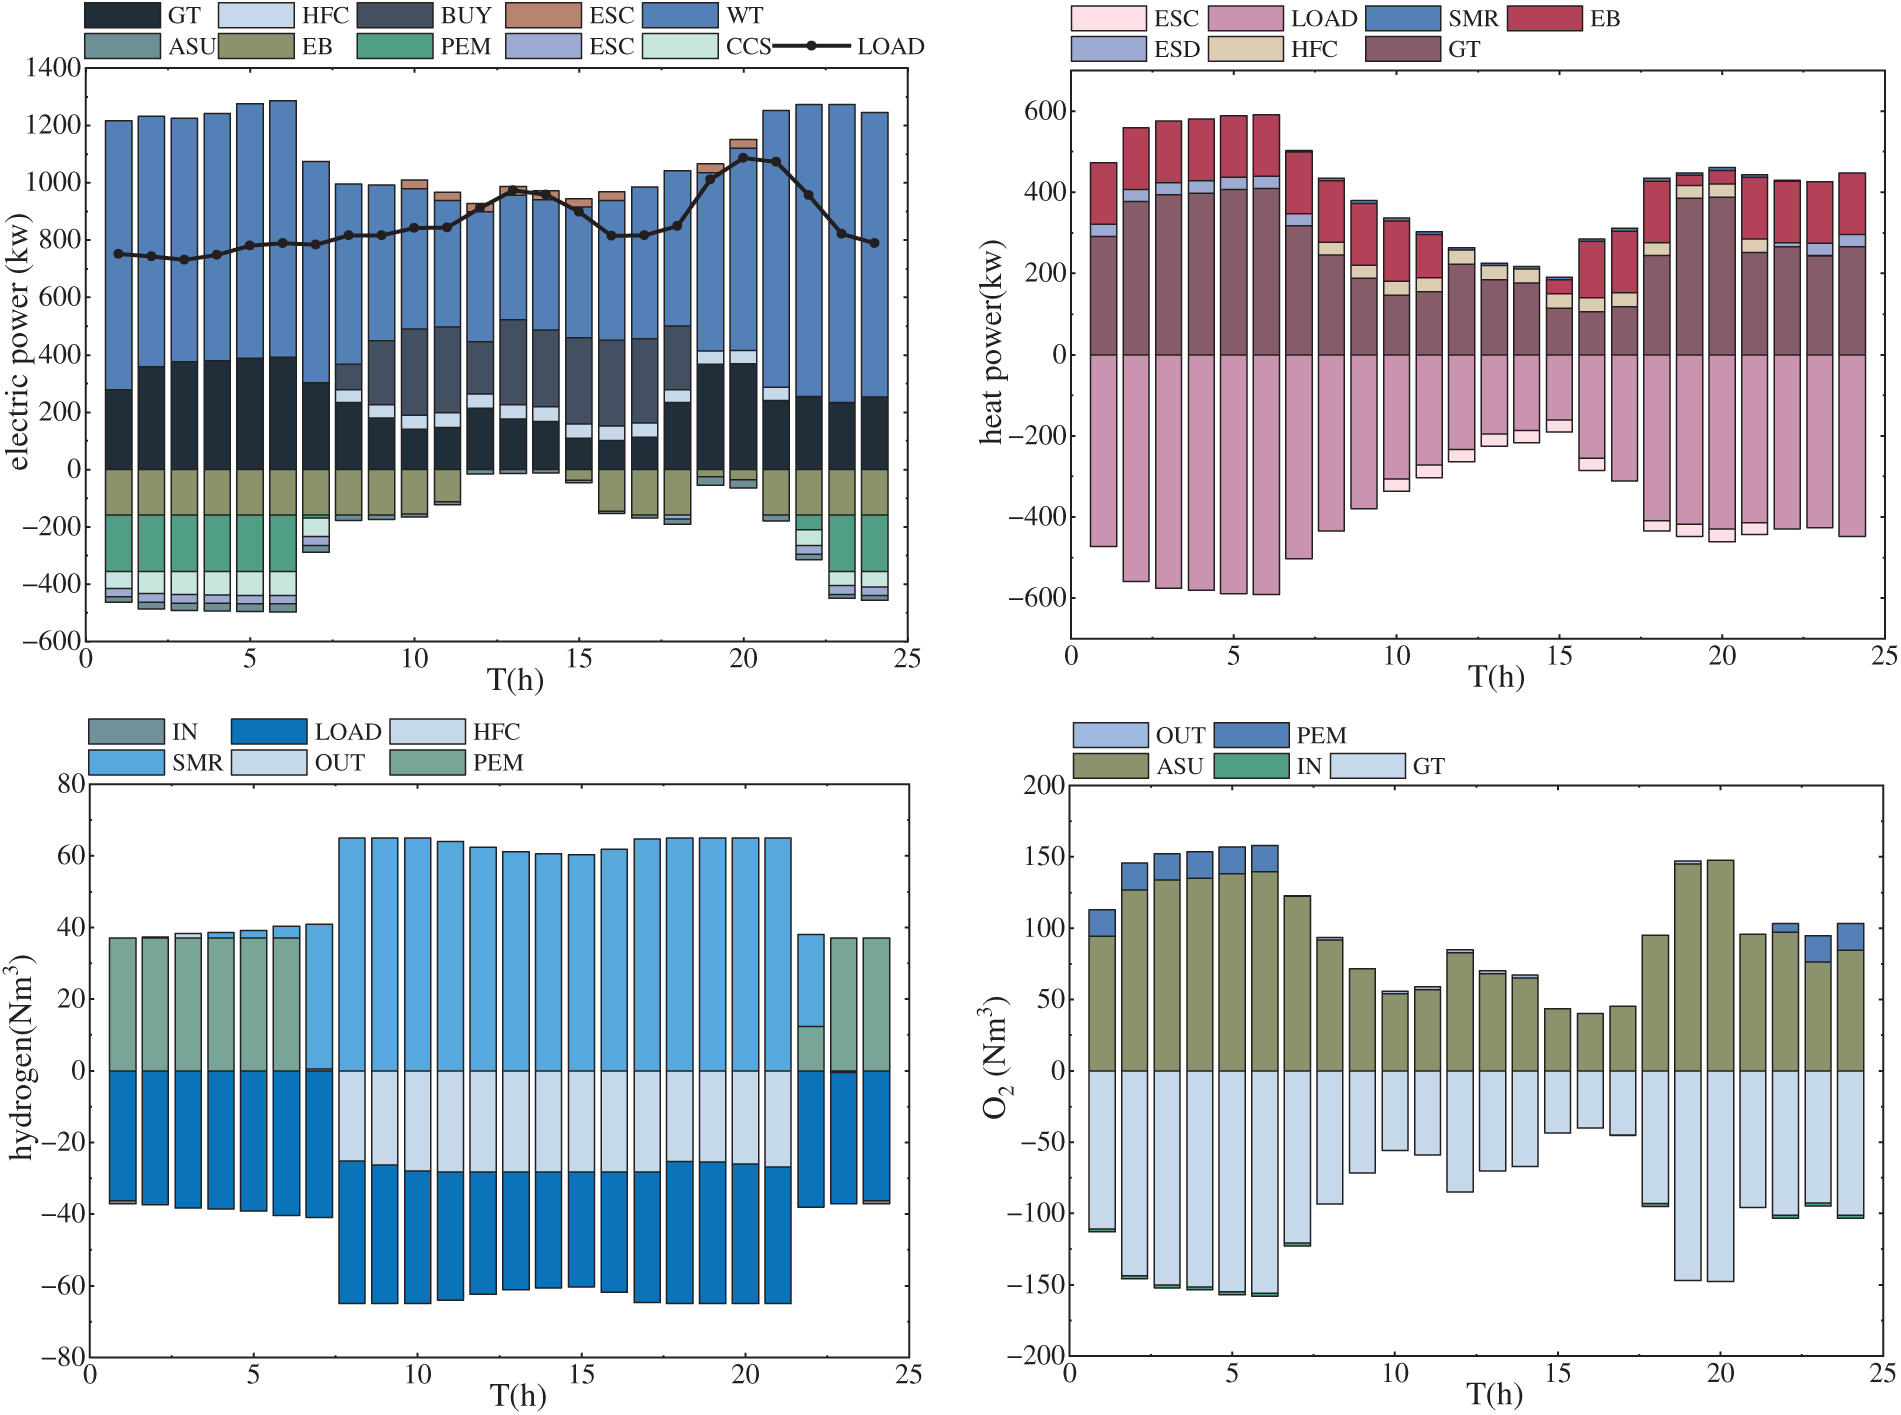
Figure 9: System scheduling results
Considering the “heat-defined power” characteristic of the GT unit and their utilization of SMR waste heat, the system faces a power shortage during daytime periods with low thermal demand. When wind power output is weak, the electrical output of the GT unit is constrained by its thermal output, leading to insufficient system power supply. Moreover, the requirement of oxygen-enriched combustion for oxygen production via the ASU further exacerbates the power deficit. To ensure load supply, the system tends to prioritize allocating the GT unit’s power output to meet load demand rather than to drive the CCE. Since the grid electricity price is lower than the GT unit’s generation cost, the system also purchases a large amount of electricity from the grid. Although this strategy increases carbon emissions on the grid side, it results in an overall reduction in system-wide carbon emissions.
5.2 Effect Analysis of Green Hydrogen Certificate Prices
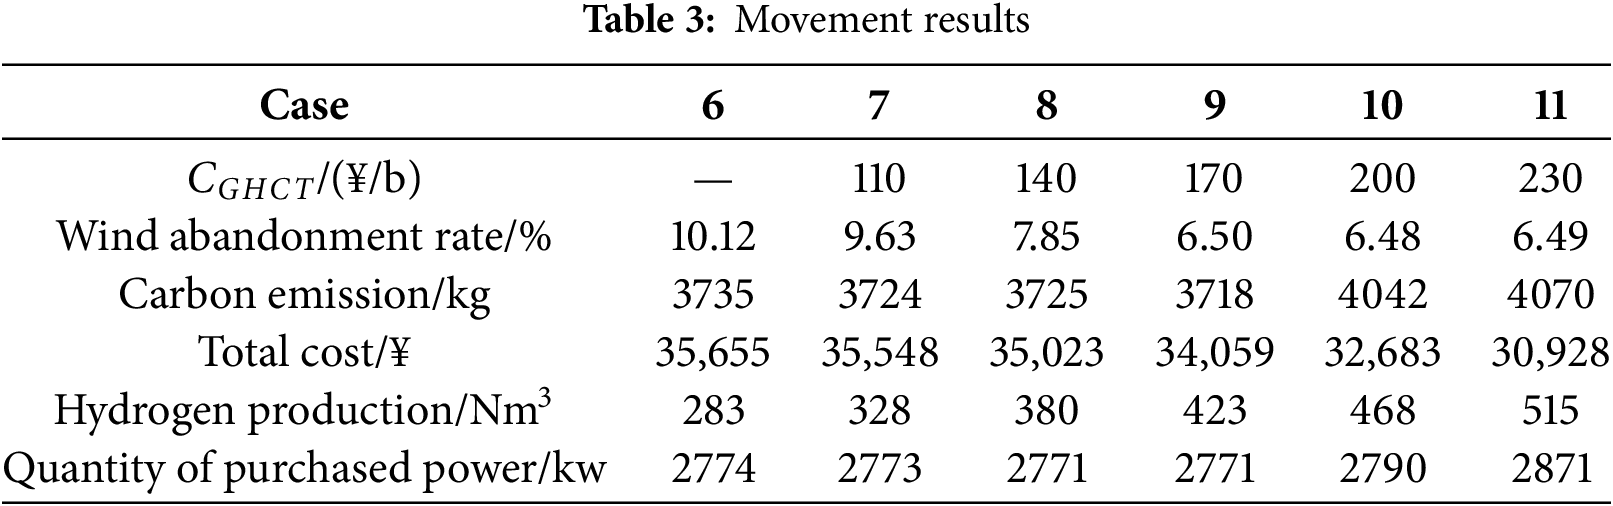
To compare the variations in total system cost and PEME-based hydrogen production under different green hydrogen certificate prices, six scenarios are designed based on whether the GHCT mechanism is considered and the specific certificate pricing levels. The green hydrogen certificate prices and corresponding dispatch results for each scenario are summarized in Table 3. The data indicate that incorporating the GHCT mechanism helps improve system economic performance and reduce wind curtailment. Specifically, compared to Case 6 (the baseline scenario), the total system cost in Case 9 and Case 11 decreases by 4.47% and 13.25%, respectively, while hydrogen production increases by 49.77% and 81.97%, respectively.
As shown in Fig. 10, the output of PEME is primarily concentrated during periods 1–9 and 22–24, mainly due to high wind power generation and significant wind curtailment in these intervals. The GHCT mechanism incentivizes increased hydrogen production by PEME. Considering the revenue from green hydrogen certificates, the effective operating cost of PEME becomes lower than the combined cost of wind curtailment and wind power operation. As a result, PEME increases its output and facilitates greater wind power utilization.
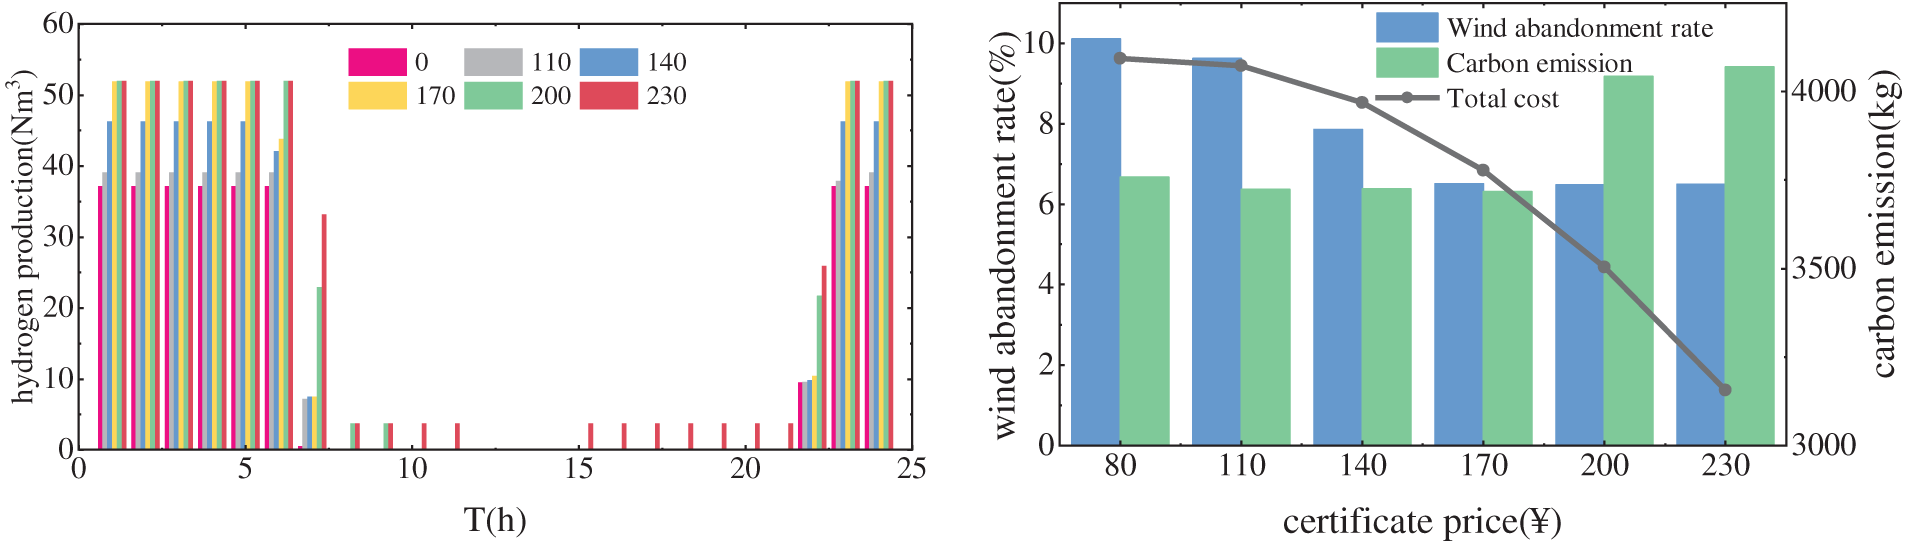
Figure 10: PEME output by time period and comparison of price results by certificat
During periods 10–21, when the green hydrogen certificate price is below 200 ¥/book, the cost of hydrogen production via SMR remains lower than that of PEME, and the system tends to prioritize SMR. However, when the certificate price exceeds 200 ¥/book, the economic incentive from certificate revenue makes PEME-based hydrogen production more favorable, prompting the system to gradually increase the share of green hydrogen. The hydrogen production of PEME in each period is shown in Fig. 10. A comparison of Cases 7–11 reveals that higher green hydrogen certificate prices lead to more operating periods for PEME and greater hydrogen production in each period.
In addition, Fig. 10 shows that the overall wind curtailment rate decreases with the increase in green hydrogen certificate trading prices. When the certificate price is 110 ¥/book, the PEME output remains low, and the system’s wind curtailment rate is 9.63%, representing only a 0.48% reduction compared to the baseline scenario. This result indicates that a low certificate price fails to effectively promote wind power integration, thereby limiting the production and utilization of green hydrogen. In Cases 9–11, when the certificate price exceeds 170 ¥/book, the wind curtailment rate tends to stabilize, while carbon emissions begin to rise. This is because during periods 1–9 and 22–24, the PEME has already reached its maximum operating capacity and cannot further absorb excess wind power. Meanwhile, during periods 10–21, the increased certificate incentive drives the system to produce more green hydrogen by purchasing electricity from the grid, leading to a rise in total system carbon emissions. Considering both wind curtailment and carbon emissions, a green hydrogen certificate price of 170 ¥/book is recommended as the optimal setting.
Finally, the results in Fig. 11 indicate that the hydrogen produced by PEME not only meets the hydrogen demand but also provides surplus hydrogen to the HFC to support electricity and heat supply. This reduces the thermal output of the GT unit, lowers the forced power generation, increases the system’s capacity to accommodate wind power, and decreases the fuel cost of the GT unit.
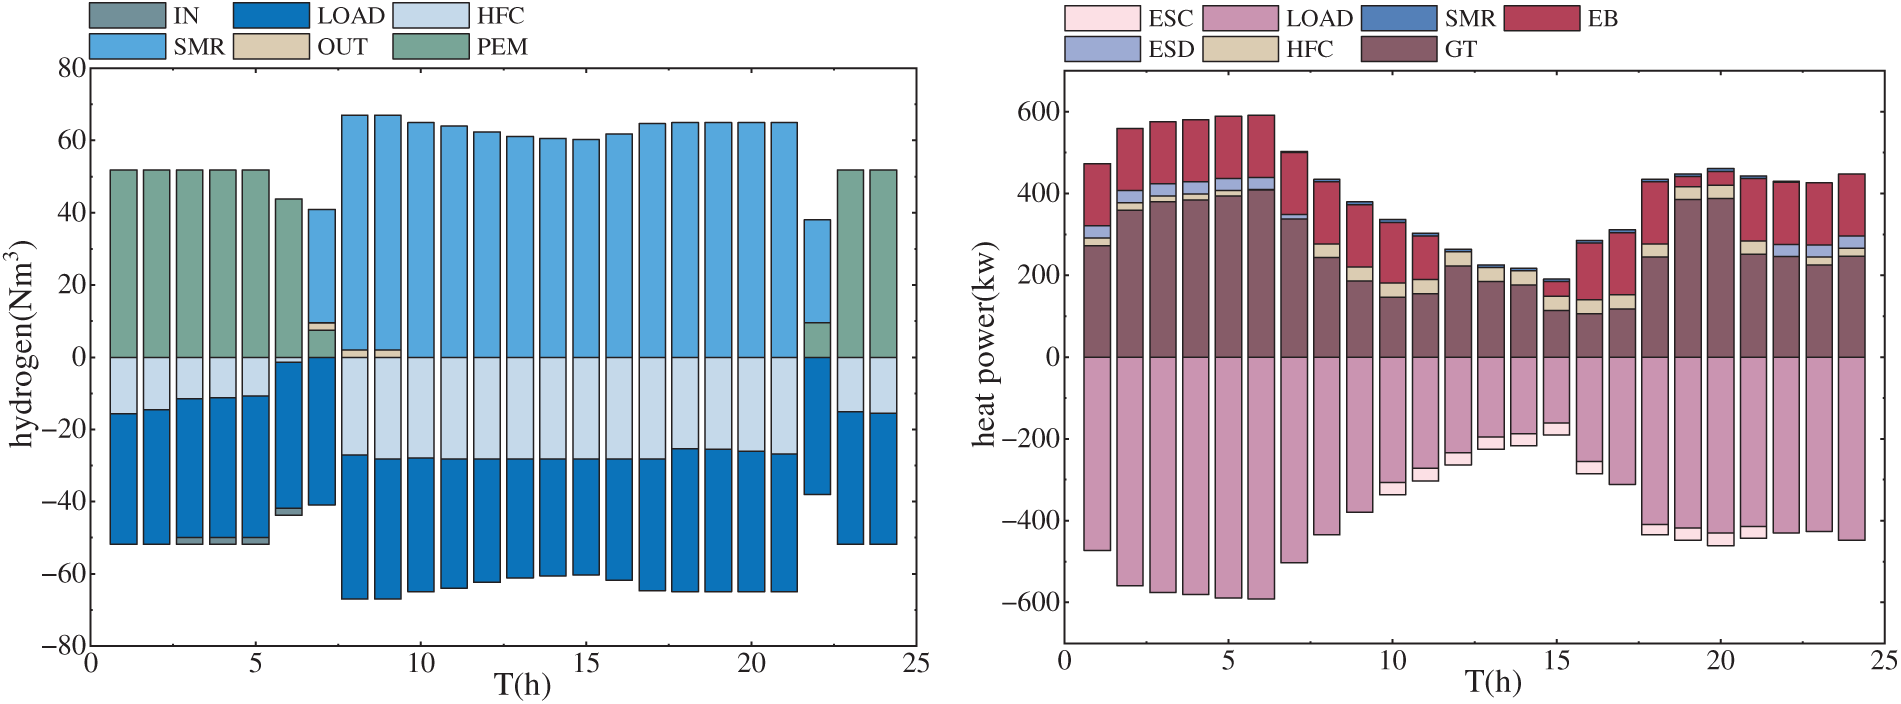
Figure 11: Hydrogen equilibrium and heat equilibrium
5.3 Effect Analysis of the GHCT and CET Mechanisms
In this section, four scenarios (Case 2 to Case 5) are designed to compare system performance in terms of economic operation, wind curtailment rate, and carbon emissions. A comprehensive analysis is conducted to evaluate the impact of the GHCT and CET mechanisms on IES operation.
According to the data in Table 2, compared with Case 2, the wind curtailment rate in Case 3 decreases by 3.61%. With the introduction of the GHCT mechanism, wind power integration is enhanced, and the total system cost is reduced by 4.47%. In Case 4, carbon emissions are reduced by 54.15% and the total cost decreases by 5.40% relative to Case 2, indicating that the CET mechanism effectively reduces system carbon emissions. However, when applied independently, the GHCT mechanism has a limited impact on emission reduction, while the CET mechanism alone does not significantly improve wind power utilization. Case 5 considers the combined effect of both GHCT and CET mechanisms and achieves the best performance in terms of wind curtailment, carbon emissions, and total cost. Compared with Case 2, Case 5 reduces the wind curtailment rate by 3.64%, lowers carbon emissions by 54.47%, and decreases total cost by 10.24%.
Fig. 12 illustrates the green and blue hydrogen production under different scenarios, as well as the variations in GT unit output, electricity purchase, and PEME power consumption. It can be observed that Case 5 achieves the highest proportion of green hydrogen production. Under the influence of the GHCT mechanism, green hydrogen output in Cases 3 and 5 increases compared to Cases 2 and 4, enabling greater wind power utilization. In contrast, under the CET mechanism, blue hydrogen production in Cases 4 and 5 decreases relative to Cases 2 and 3 as a result of carbon reduction incentives. The output of the GT unit is jointly determined by the energy consumption of ASU, CCE, and load. Driven by the GHCT mechanism, Case 3, compared with Cases 2 and 4, reduces GT output on the supply side to create additional grid space for wind power and increases PEME power demand on the load side, further expanding wind power integration. This dual-sided adjustment improves wind power utilization and enhances GHCT-related revenue.
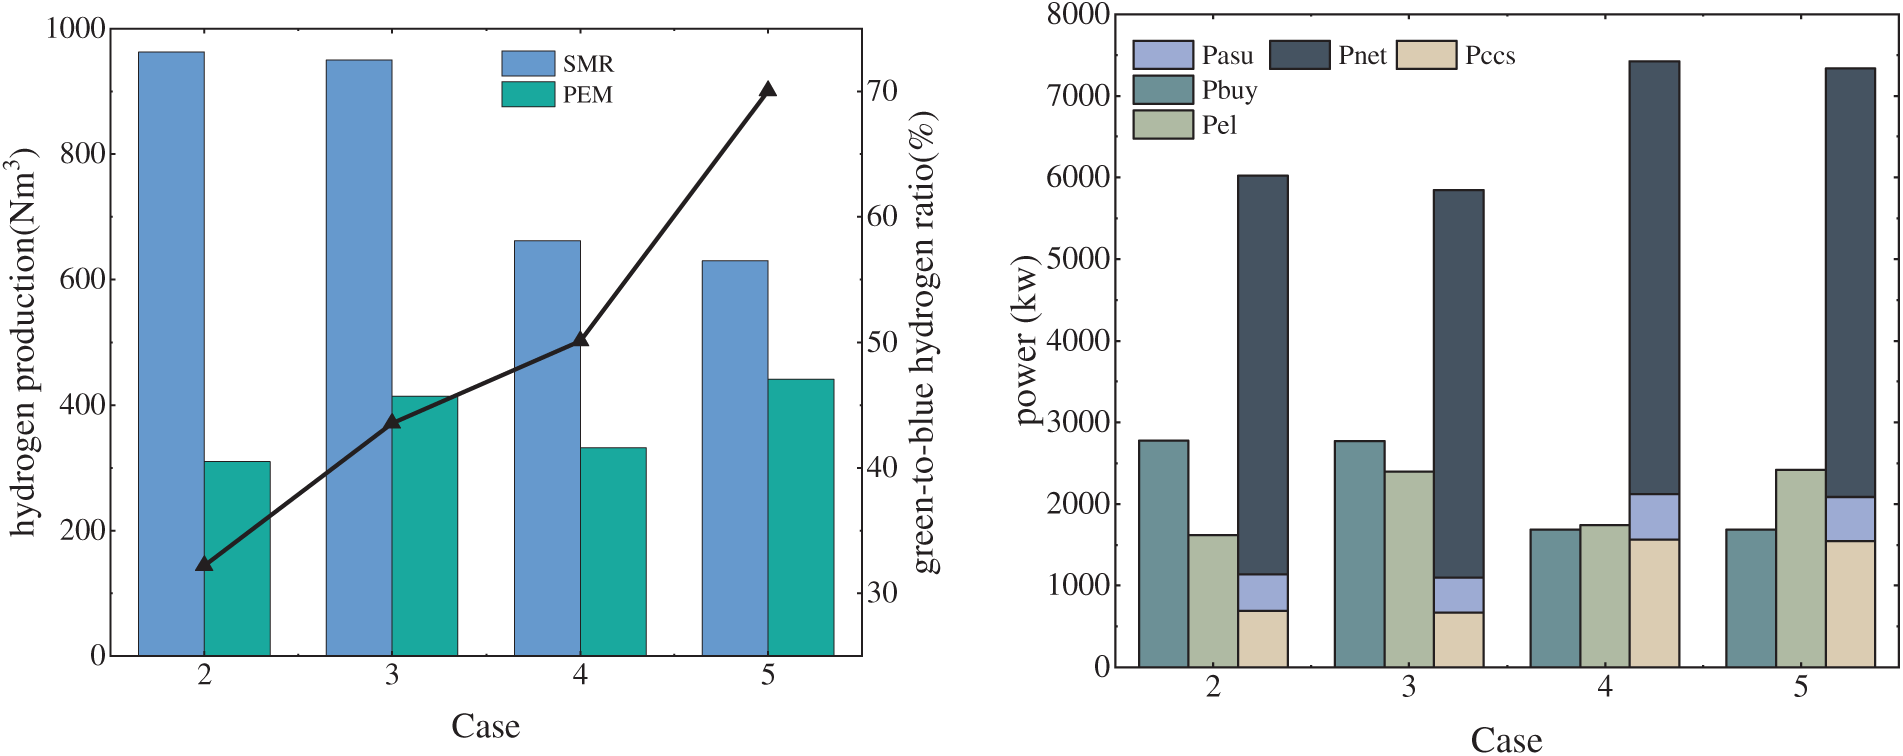
Figure 12: Hydrogen production and system output by scenario
Fig. 13 presents the wind curtailment across different time periods and the carbon emissions and carbon capture volumes of each device under various scenarios. The results show that scenarios incorporating the GHCT mechanism significantly reduce wind curtailment. Additionally, due to the OCC-based retrofit of the GT unit, its carbon emissions are effectively lowered. By increasing the power supply to CCE, the actual carbon emissions fall below the allocated carbon allowance. The rise in CCE power consumption enhances the CET revenue. Under the incentive of the CET mechanism, the CCE power in Cases 4 and 5 increases compared to Cases 2 and 3. Furthermore, the carbon emission intensity of the GT unit, after OCC retrofit, is lower than that of the grid. As a result, the system tends to reduce electricity purchases from the grid. The results indicate that electricity purchases in Cases 4 and 5 are lower than those in Cases 2 and 3.
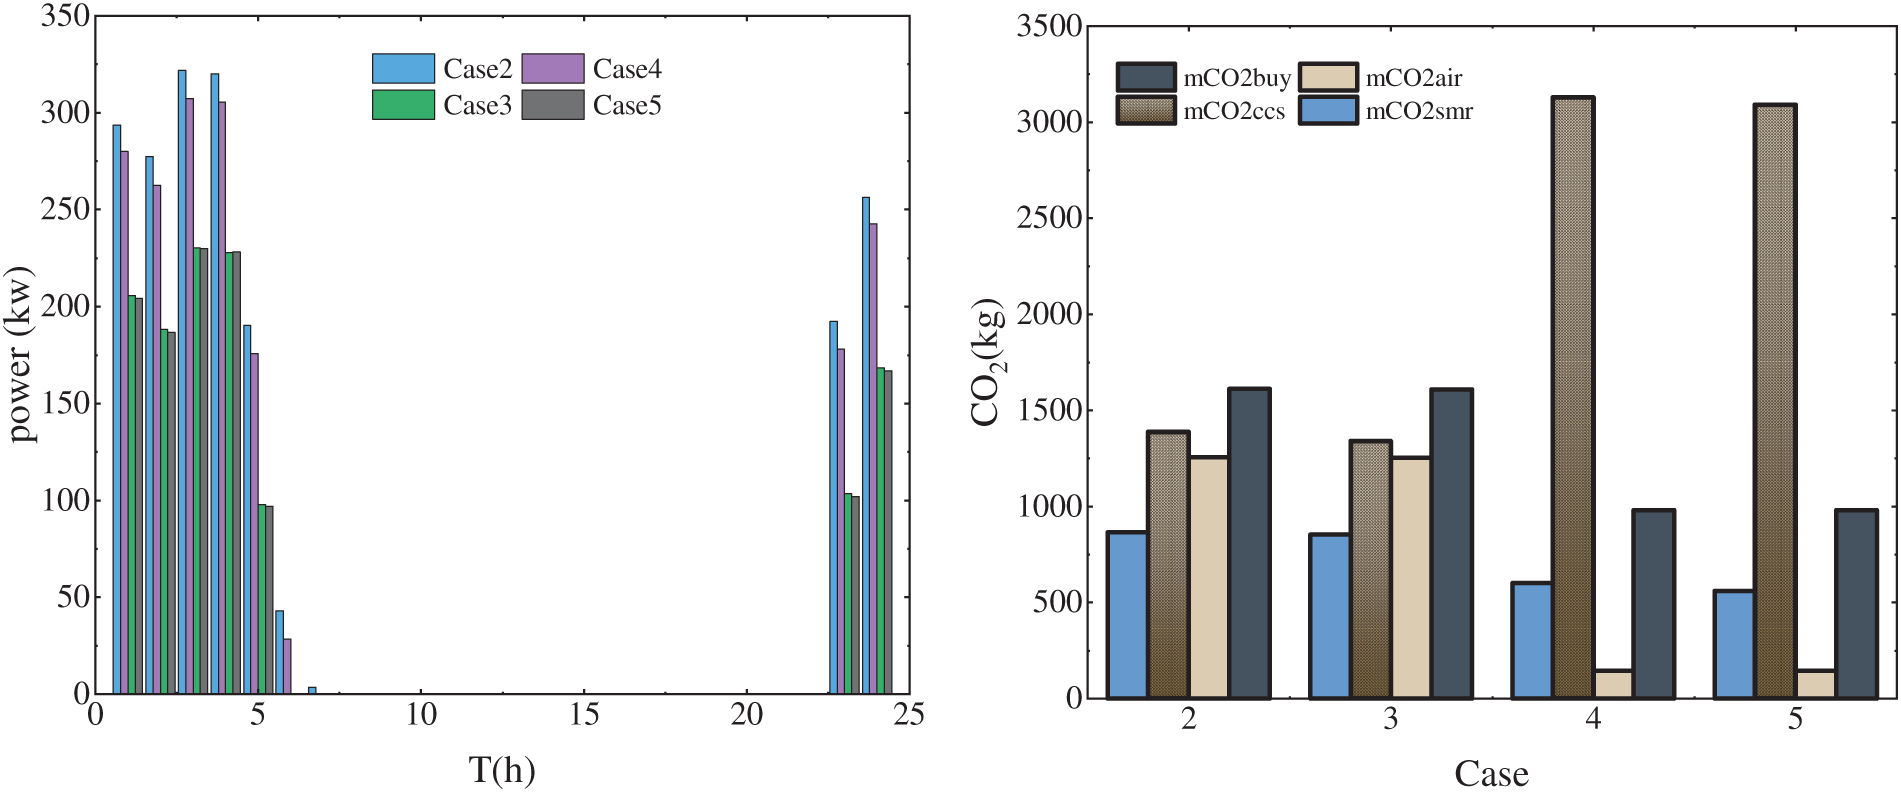
Figure 13: Wind abandonment by time period and carbon emissions by scenario
To verify the reliability of the conclusion that “the coordinated utilization of blue and green hydrogen can balance cost advantages and low-carbon benefits”, this section introduces two additional comparative scenarios: (1) the system operates with blue hydrogen only, and (2) the system operates with green hydrogen only. These scenarios are compared with the baseline scenario involving the coordinated use of both blue and green hydrogen. The scheduling results are presented in Table 4.
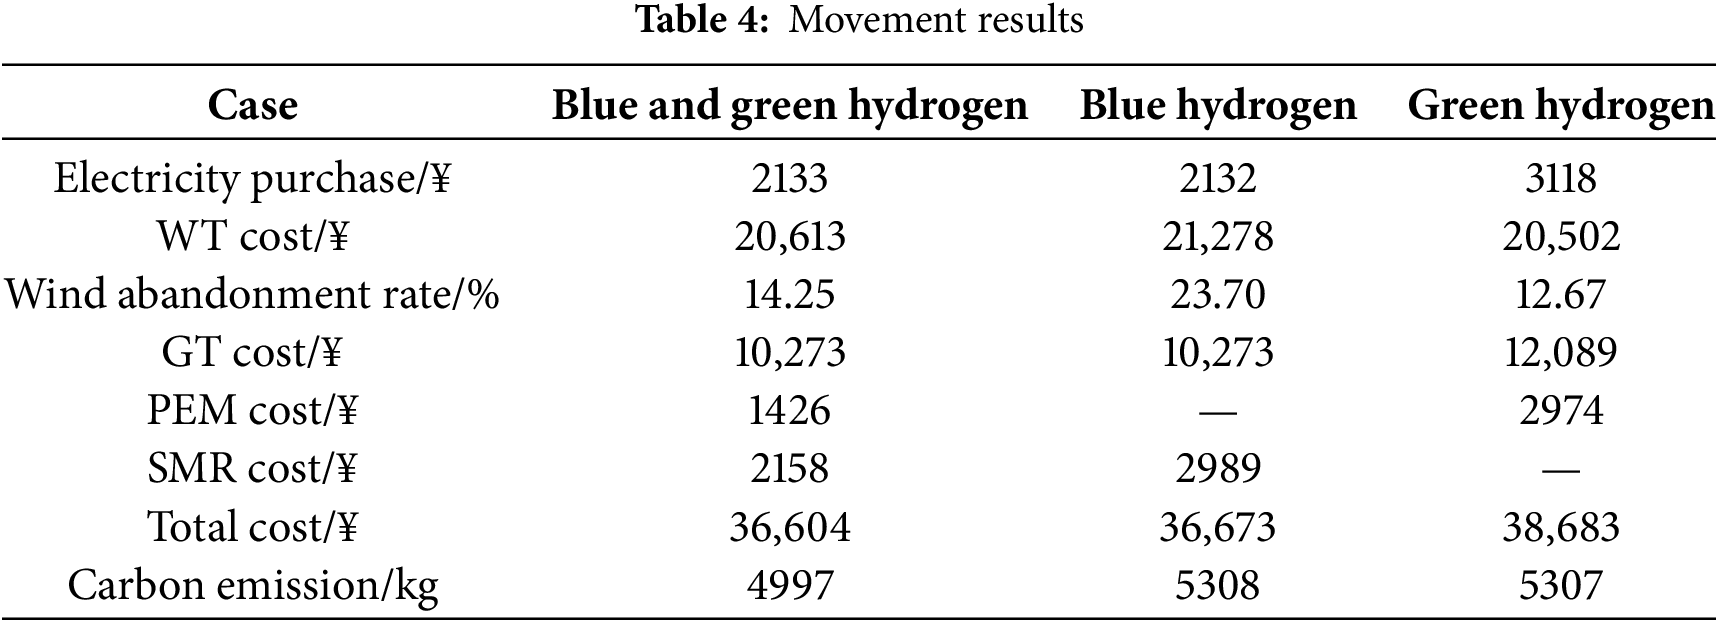
In the scenario using only blue hydrogen, the wind power curtailment rate increased by 9.45% compared to the baseline scenario. The total system cost increased only slightly due to the low production cost of blue hydrogen, all hydrogen demand was met by SMR throughout the day, resulting in a 6.22% increase in carbon emissions.
In the scenario using only green hydrogen, the curtailment rate decreased by 1.58%. However, due to the high production cost of PEME-based hydrogen, the total system cost rose by 5.68%. Meanwhile, carbon emissions also increased by 6.20%. The main reason is that the high cost limited the amount of green hydrogen available for HFC-based power generation. Consequently, the system relied more heavily on GT units and electricity purchases from the grid to meet demand, with their respective costs increasing by 17.68% and 46.18%. Since both power sources have higher carbon emission factors than SMR, this offset the inherent zero-carbon advantage of green hydrogen.
In contrast, the scenario with coordinated utilization of blue and green hydrogen can better leverage the respective advantages of each. During daytime periods of low wind power output, low-cost blue hydrogen produced by SMR is used to meet the hydrogen demand, while excess hydrogen is supplied to HFC units, thereby reducing the output of GT units and electricity purchases. During morning and evening wind power peaks, green hydrogen is produced by PEME electrolyzers, making full use of renewable electricity and reducing carbon emissions. Therefore, the coordinated use of blue and green hydrogen not only ensures economic performance but also maximizes the zero-emission advantage of green hydrogen, thereby validating the reliability of the proposed conclusion.
To reduce the carbon emissions of IES, improve its economic performance, and enhance wind power integration, this paper proposes a low-carbon economic dispatch strategy under the GHCT and CET mechanisms, incorporating both green and blue hydrogen pathways. The strategy involves retrofitting the GT unit with OCC technology, utilizing oxygen generated by PEME for oxygen-enriched combustion in the GT unit, and recovering waste heat from the SMR process. The main conclusions are as follows:
(1) The coordinated utilization of blue and green hydrogen not only leverages the cost competitiveness of blue hydrogen but also maximizes the zero-emission advantage of green hydrogen. This synergy provides a cost-effective transitional solution for the hydrogen industry. As green hydrogen production technologies mature and costs decline, the market share of green hydrogen is expected to expand gradually, thereby enabling a green transition of the hydrogen economy.
(2) Utilizing oxygen for oxygen-enriched combustion in GT unit and recovering waste heat from the SMR process contribute to lower-carbon energy production. These measures provide additional thermal support to the system, reduce dependence on external energy sources, and minimize resource waste.
(3) Accounting for the benefits of green hydrogen certificates helps to capture the environmental value of green hydrogen and provides additional economic incentives for its production and utilization, thereby enhancing its market competitiveness. The GHCT mechanism also effectively improves wind power integration, particularly during periods of high wind generation, enabling the system to better utilize surplus electricity and reduce wind curtailment.
(4) The CET mechanism encourages the system to prioritize low-carbon and zero-carbon technologies, such as PEME and carbon capture, effectively reducing carbon emissions. A comprehensive consideration of both GHCT and CET mechanisms enables full utilization of their complementary advantages. This not only reduces system operating costs but also lowers carbon emissions and enhances wind power integration, thereby achieving optimal performance in both economic and environmental dimensions.
Acknowledgement: This paper was completed with the hard help of every author.
Funding Statement: This work is supported by National Natural Science Foundation of China (52477101); Natural Science Foundation of Jiangsu Province (BK20210932).
Author Contributions: Conceptualization, Zirui Wang and Aidong Zeng; methodology, Zirui Wang; software, Zirui Wang; validation, Zirui Wang, Aidong Zeng and Jiawei Wang; formal analysis, Zirui Wang, Aidong Zeng and Jiawei Wang; resources, Aidong Zeng, Mingshen Wang and Sipeng Hao; data curation, Zirui Wang and Jiawei Wang; writing—original draft preparation, Zirui Wang; writing—review and editing, Zirui Wang, Aidong Zeng, Sipeng Hao and Mingshen Wang; supervision, Aidong Zeng; funding acquisition, Aidong Zeng and Mingshen Wang. All authors reviewed the results and approved the final version of the manuscript.
Availability of Data and Materials: Data will be made available on request.
Ethics Approval: Not applicable.
Conflicts of Interest: The authors declare no conflicts of interest to report regarding the present study.
Appendix A
References
1. Rabiee A, Keane A, Soroudi A. Green hydrogen: a new flexibility source for security constrained scheduling of power systems with renewable energies. Int J Hydrogen Energy. 2021;46(37):19270–84. doi:10.1016/j.ijhydene.2021.03.080. [Google Scholar] [CrossRef]
2. Zhang K, Zhou B, Or SW, Li C, Chung CY, Voropai N. Optimal coordinated control of multi-renewable-to-hydrogen production system for hydrogen fueling stations. IEEE Trans Ind Appl. 2022;58(2):2728–39. doi:10.1109/TIA.2021.3093841. [Google Scholar] [CrossRef]
3. Pan G, Gu W, Lu Y, Qiu H, Lu S, Yao S. Optimal planning for electricity-hydrogen integrated energy system considering power to hydrogen and heat and seasonal storage. IEEE Trans Sustain Energy. 2020;11(4):2662–76. doi:10.1109/TSTE.2020.2970078. [Google Scholar] [CrossRef]
4. Kumar P, Date A, Shabani B. Towards self-water-sufficient renewable hydrogen power supply systems by utilising electrolyser and fuel cell waste heat. Int J Hydrogen Energy. 2025;137(5):380–96. doi:10.1016/j.ijhydene.2025.05.124. [Google Scholar] [CrossRef]
5. Kumar P, Singh O. Fuel cell and hydrogen-based hybrid energy conversion technologies. In: Shukla AK, Singh O, Chamkha AJ, Sharma M, editors. Prospects of hydrogen fueled power generation. New York, NY, USA: River Publishers; 2024. p. 207–21. doi: 10.1201/9781032656212-9. [Google Scholar] [CrossRef]
6. Elazab MA, Elgohr AT, Bassyouni M, Kabeel AE, El Hadi Attia M, Elshaarawy MK, et al. Green hydrogen: unleashing the potential for sustainable energy generation. Results Eng. 2025;27(2):106031. doi:10.1016/j.rineng.2025.106031. [Google Scholar] [CrossRef]
7. Elazab MA, Elbrashy A, Elgohr AT, Hussein AH. Innovative electrode design and catalytic enhancement for high-efficiency hydrogen production in renewable energy systems. Energy Sources Part A Recovery Util Environ Eff. 2025;47(1):9394–412. doi:10.1080/15567036.2025.2490800. [Google Scholar] [CrossRef]
8. Thapa BS, Neupane B, Yang HS, Lee YH. Green hydrogen potentials from surplus hydro energy in Nepal. Int J Hydrogen Energy. 2021;46(43):22256–67. doi:10.1016/j.ijhydene.2021.04.096. [Google Scholar] [CrossRef]
9. Laimon M, Yusaf T. Towards energy freedom: exploring sustainable solutions for energy independence and self-sufficiency using integrated renewable energy-driven hydrogen system. Renew Energy. 2024;222(9):119948. doi:10.1016/j.renene.2024.119948. [Google Scholar] [CrossRef]
10. Walter V, Göransson L, Taljegard M, Öberg S, Odenberger M. Low-cost hydrogen in the future European electricity system-Enabled by flexibility in time and space. Appl Energy. 2023;330:120315. doi:10.1016/j.apenergy.2022.120315. [Google Scholar] [CrossRef]
11. Huang Y, Shi M, Wang W, Lin H. A two-stage planning and optimization model for water-hydrogen integrated energy system with isolated grid. J Clean Prod. 2021;313(2):127889. doi:10.1016/j.jclepro.2021.127889. [Google Scholar] [CrossRef]
12. Song Y, Mu H, Li N, Wang H, Kong X. Optimal scheduling of zero-carbon integrated energy system considering long- and short-term energy storages, demand response, and uncertainty. J Clean Prod. 2024;435:140393. doi:10.1016/j.jclepro.2023.140393. [Google Scholar] [CrossRef]
13. Pan G, Gu Z, Luo E, Gu W. Analysis and prospect of electrolytic hydrogen technology under background of new power systems. Autom Electr Power Syst. 2023;47(10):1–13. (In Chinese). doi:10.7500/AEPS20220630003. [Google Scholar] [CrossRef]
14. Durakovic G, del Granado PC, Tomasgard A. Are green and blue hydrogen competitive or complementary? Insights from a decarbonized European power system analysis. Energy. 2023;282(4):128282. doi:10.1016/j.energy.2023.128282. [Google Scholar] [CrossRef]
15. Novotny V. Blue hydrogen can be a source of green energy in the period of decarbonization. Int J Hydrogen Energy. 2023;48(20):7202–18. doi:10.1016/j.ijhydene.2022.11.095. [Google Scholar] [CrossRef]
16. Wang X, Wang S, Zhao Q, Lin Z. Low-carbon coordinated operation of electric-heat-gas-hydrogen interconnected system and benchmark design considering multi-energy spatial and dynamic coupling. Energy. 2023;279(4):128042. doi:10.1016/j.energy.2023.128042. [Google Scholar] [CrossRef]
17. Zhang X, Gao X, Zheng Y, Xu Y, Chung E, Sayed AR. Low-carbon oriented collaborative planning of electricity-hydrogen-gas-transportation integrated system considering hydrogen vehicles. IEEE Trans Netw Sci Eng. 2024;11(6):5515–25. doi:10.1109/TNSE.2023.3279994. [Google Scholar] [CrossRef]
18. Yun S, Lee J, Cho H, Kim J. Oxy-fuel combustion-based blue hydrogen production with the integration of water electrolysis. Energy Convers Manag. 2023;291:117275. doi:10.1016/j.enconman.2023.117275. [Google Scholar] [CrossRef]
19. Yun Y, Zhang D, Yang S, Li Y, Yan J. Low-carbon optimal dispatch of integrated energy system considering the operation of oxy-fuel combustion coupled with power-to-gas and hydrogen-doped gas equipment. Energy. 2023;283(6):129127. doi:10.1016/j.energy.2023.129127. [Google Scholar] [CrossRef]
20. Li W, Liu W, Lin Y, Liu C, Wang X, Xu J. Optimal dispatching of integrated energy system with hydrogen-to-ammonia and ammonia-mixed/oxygen-enriched thermal power. Energy. 2025;316(6):134514. doi:10.1016/j.energy.2025.134514. [Google Scholar] [CrossRef]
21. Jin J, Wen Q, Cheng S, Qiu Y, Zhang X, Guo X. Optimization of carbon emission reduction paths in the low-carbon power dispatching process. Renew Energy. 2022;188(12):425–36. doi:10.1016/j.renene.2022.02.054. [Google Scholar] [CrossRef]
22. Gao X, Wang S, Sun Y, Zhai J, Chen N, Zhang XP. Low-carbon energy scheduling for integrated energy systems considering offshore wind power hydrogen production and dynamic hydrogen doping strategy. Appl Energy. 2024;376(2):124194. doi:10.1016/j.apenergy.2024.124194. [Google Scholar] [CrossRef]
23. Chen M, Chen S, Wang Y, Wei Z, Pan X, Peng Y. Chance constrained optimal scheduling of electric-hydrogen integrated energy system considering green certificate of hydrogen energy. Electr Power Autom Equip. 2023;43(12):206–13. (In Chinese). doi:10.16081/j.epae.202309024. [Google Scholar] [CrossRef]
24. Zhang J, Hu Z. Game optimization research of integrated energy system based on the Kriging meta-model with multi-market coupling. Energy. 2025;322(8):135596. doi:10.1016/j.energy.2025.135596. [Google Scholar] [CrossRef]
25. Wang LL, Xian RC, Jiao PH, Chen JJ, Chen Y, Liu HG. Multi-timescale optimization of integrated energy system with diversified utilization of hydrogen energy under the coupling of green certificate and carbon trading. Renew Energy. 2024;228(2):120597. doi:10.1016/j.renene.2024.120597. [Google Scholar] [CrossRef]
26. Hernández-Gómez Á, Ramirez V, Guilbert D. Investigation of PEM electrolyzer modeling: electrical domain, efficiency, and specific energy consumption. Int J Hydrogen Energy. 2020;45(29):14625–39. doi:10.1016/j.ijhydene.2020.03.195. [Google Scholar] [CrossRef]
27. Huang W, Zhang B, Ge L, He J, Liao W, Ma P. Day-ahead optimal scheduling strategy for electrolytic water to hydrogen production in zero-carbon parks type microgrid for optimal utilization of electrolyzer. J Energy Storage. 2023;68(7830):107653. doi:10.1016/j.est.2023.107653. [Google Scholar] [CrossRef]
28. Ueckerdt F, Verpoort PC, Anantharaman R, Bauer C, Beck F, Longden T, et al. On the cost competitiveness of blue and green hydrogen. Joule. 2024;8(1):104–28. doi:10.1016/j.joule.2023.12.004. [Google Scholar] [CrossRef]
29. Pan G, Gu W, Lu Y, Qiu H, Lu S, Yao S. Accurate modeling of a profit-driven power to hydrogen and methane plant toward strategic bidding within multi-type markets. IEEE Trans Smart Grid. 2021;12(1):338–49. doi:10.1109/TSG.2020.3019043. [Google Scholar] [CrossRef]
Cite This Article
 Copyright © 2025 The Author(s). Published by Tech Science Press.
This work is licensed under a Creative Commons Attribution 4.0 International License , which permits unrestricted use, distribution, and reproduction in any medium, provided the original work is properly cited.
 Downloads
 Citation Tools