
 Login
Login Register
 Submit a Paper
 Propose a Special lssue
 Open Access
ARTICLE

Determination of Optimal Location and Sizing of Distributed Generators in Multi-Microgrid System Using Spider Wasps Optimization Technique
1 Department of Electrical and Electronics Engineering, BVRIT HYDERABAD College of Engineering for Women, Hyderabad, India
2 Department of Global Railways, Woosong University, Daejeon, Republic of Korea
* Corresponding Author: Surender Reddy Salkuti. Email:
Energy Engineering 2026, 123(10), 19 https://doi.org/10.32604/ee.2026.083940
Received 13 April 2026; Accepted 18 May 2026; Issue published 30 August 2026
 View Full Text
 Download PDF
Abstract
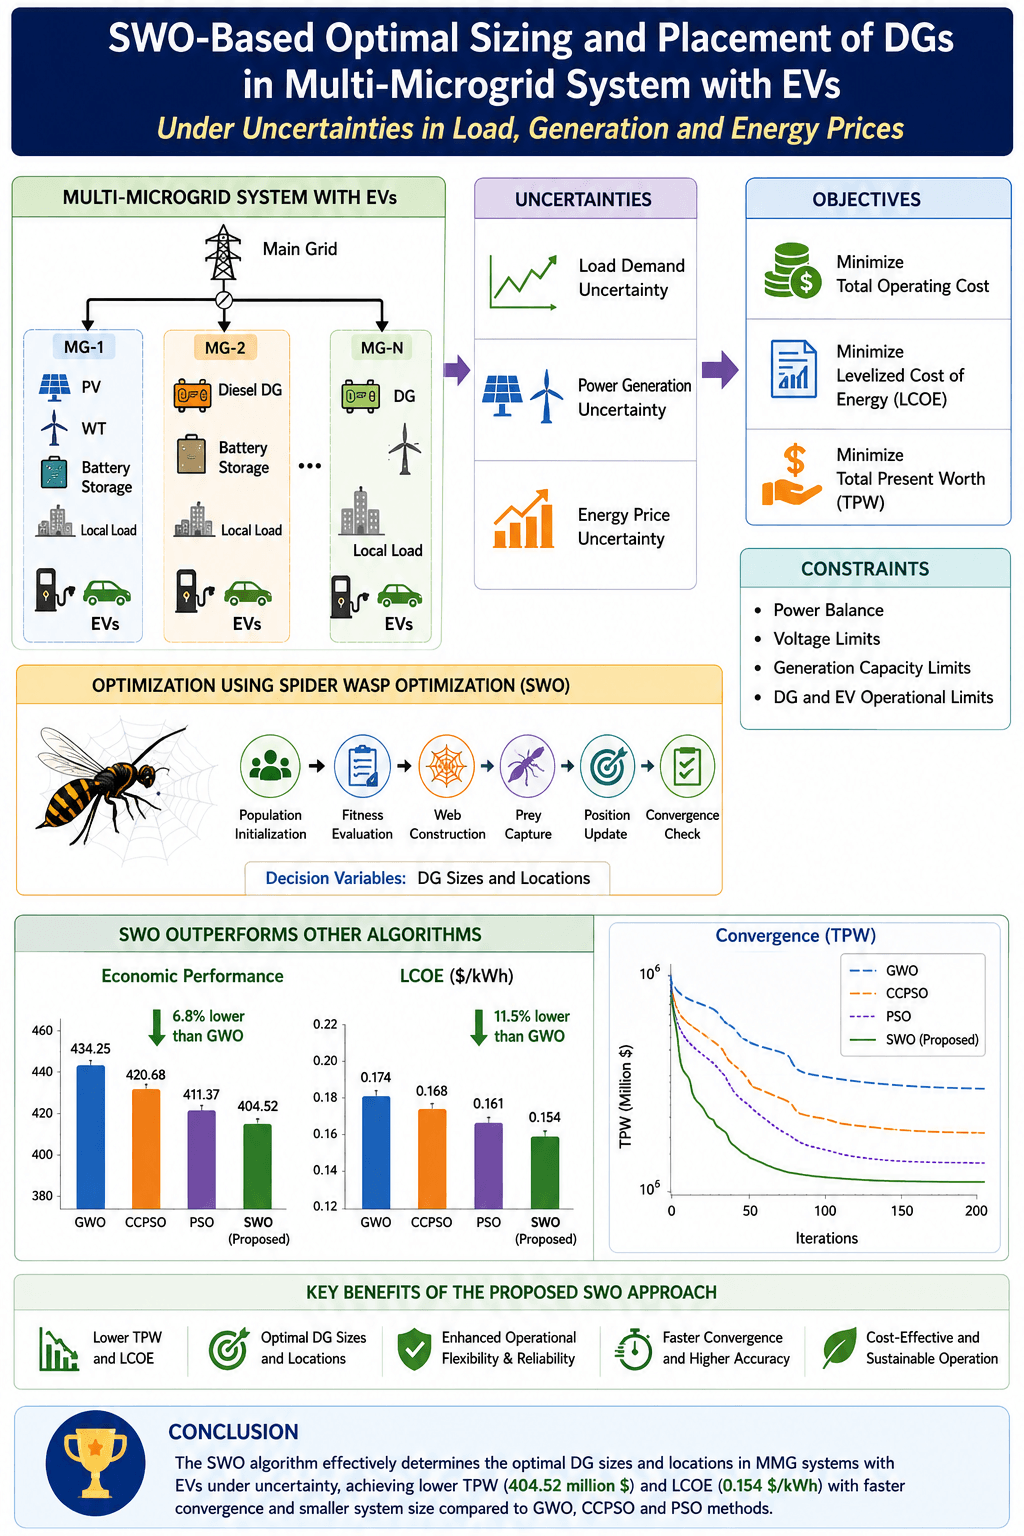
The operational flexibility and reliability of Multi-Microgrid (MMG) networks have been greatly increased by the growing adoption of Distributed Generation (DG) within the operational framework of the contemporary power infrastructure. Optimal location and size of DG units are, however, significant issues since the problem is complex, nonlinear, and multi-objective. A proposed study will develop a sophisticated optimization model using the Spider Wasp Optimization (SWO) algorithm to optimally allocate and size DGs in MMG systems. The goal of the proposed approach is to reduce essential economic goals, such as total operating cost, Levelized Cost of Energy (LCOE), and Total Present Worth (TPW), and meet the system requirements, such as power balance, voltage limits, and generation capacity. The study aims at examining the DG sizing and location in Multi-Microgrid system considering the uncertainties in load and power generation This is possible because a decrease in the Total Present Worth (TPW) of 434.25 million to 404.52 million and the Levelized Cost of Energy (LCOE) is narrowed to 0.174/kWh to use the Spider Wasps Optimization (SWO) algorithm to determine the optimal of the DG sizes and locations. This optimization method considers the fluctuation in the energy demand, the generation information, and the dynamic energy prices. The effectiveness of the suggested methodology can be explained by the fact that its results are compared to the outcomes of the implementation of the algorithms of the Grey Wolf Optimization (GWO) and Cyclonic Convergent Particle Swarm Optimization (CCPSO). The Spider Wasps Optimization (SWO) algorithm demonstrates better results in lower TPW, system size, as well as minimization of LCOE, besides converging faster than GWO, CCPSO, and PSO algorithms, which translates to an accurate and reliable algorithm.Graphic Abstract
Keywords
Decentralized energy production (DEP) makes the energy network more resilient to disruptions and blackouts, as it is not dependent on large-scale power stations. It is crucial in providing a stable power supply in cases of emergencies, as it produces electricity in proximity to the point where it is required. A good location of Distributed Generation (DG) [1] can offer backup power when there is a power outage, thus enhancing the stability and reliability of the energy distribution, particularly in critical or remote locations. Localized energy production (LEP) [2] can assist in putting the strain on the available electrical grids. Appropriate decentralization of renewable-based generation [3], including solar or wind, will maximize the use of the resources and provide seamless integration of the power into the grid. Also, the use of distributed generation systems will reduce voltage fluctuations, thus enhancing the quality of the entire supply of electricity to end consumers. The process of establishing the optimum configuration of a multi-microgrid will entail establishing connections among various microgrids to achieve an increment of power loss reduction and operating cost, as well as the scale of distribution and transmission network to control energy flow and system stability. Long-term financial sustainability is the main objective of microgrid configuration design. The major consideration in order to maximize cost-effectiveness and technical feasibility is strategic placement and optimal sizing of Distributed Energy Resources (DERs) [4]. By implementing this methodology, the result is the reduction of the general spending in a meticulously established deployment of DER components. The authors [5–8] point to such essential issues in microgrid planning as the choice of DERs and their location to ensure minimum costs in capital and minimize the losses in power during the implementation and optimization of the schedule to ensure minimal operational costs. The Genetic Algorithm (GA) [9,10] and Particle Swarm Optimization (PSO) [11–13] are among the most popular that have been used to a significant extent in the placement and sizing of DGs. These algorithms have good capability of searching the world and tend to have problems of premature convergence and slow convergence rate in a complex search space. To address these drawbacks, several new advanced and nature-inspired algorithms have been presented. They have proposed various optimization strategies to address some of the problems in MG planning. As highlighted in [14–16], the introduction of MMGs has led to a substantial increase in the complexity of managing multiple interconnected coordinate systems. Optimizing energy exchange, reducing the cost of operation, and enhancing the reliability of systems are the major goals of MMG energy management systems (EMS).
The scheme of the Multi-Microgrid system is shown in Fig. 1. References [17–19] present an uncertainty in distributed generation (DG) resources that is taken into account during the enhancement of DG system design, primarily to minimize operational expenses. A table presents a summary of previous research on the optimal placement and sizing of DG units, focusing on uncertainty management through stochastic analysis. Distributed Generation (DG) provides a number of key benefits for today’s power systems. It helps in reducing transmission and distribution losses, as it generates power nearer to the load centers. DG also helps to improve the voltage profile and increase system stability, especially in radial distribution networks. Moreover, it enhances the reliability and resilience of the system as it lessens the reliance on centralized generation. Further, the introduction of renewable energy-based DG (REDG), such as Solar and Wind power, is towards environmental sustainability by reducing greenhouse gas emissions (GHGs). Furthermore, DG offers the possibility of system modulations and expansions, which are important for smart grid and microgrid developments.

Figure 1: Scheme of a multi-microgrid system.
Table 1 is a summary of the literature review on the best location and sizing selection of Distributed Generation. Based on the work done above, it offers a bi-level optimum planning model, which will help maximize the sizing of MMG, but uses the instantaneous variations of the price of energy. This problem can be tackled in [20] by optimizing the size of DERs, considering the uncertainties and energy trading processes, and in the end minimizing the overall cost of the MMG. There is a need to ensure that they are validated through the assistance of optimization techniques. In this study, a new optimization method is presented, the spider wasp’s optimization algorithm, which will be used to figure out the best size and location of photovoltaic DG units. The objectives include achieving a reduction in the total active power loss, economic losses per year, and improving the voltage profile. This study has contributed significantly to the field of knowledge in the following ways:
• Implementation of a Spider Wasps Optimization (SWO) technique to enhance power through DGs in Multi-Microgrid systems.
• Implementing the Spider Wasps Optimization (SWO) optimization technique to reduce the Total Present Worth (TPW) of the entire MMG system.
• Utilizing the Spider Wasps Optimization (SWO) method to validate the optimal positioning and size rating of DGs in an MMG system.
• Highlighting the importance of incorporating DGs into the MMG system, demonstrating that properly deployed DGs can minimize overall losses and improve the profile of voltage, while maintaining compliance with network design constraints.
• Combines the expansion of loads and contingencies of DGs and load demand in planning and operational models of optimal deployment of DGs.

While the objective of this study is mainly technical optimization of the placement and size of distributed generation (DG), social and institutional factors are also important. The introduction of DG will depend on the willingness of stakeholders as well as regulatory policies and supportive infrastructure. The actual viability of the suggested configurations may be influenced by various factors, including consumer participation, policy incentives, and organizational readiness. Future research could therefore consider socio-economic and regulatory issues along with technical optimization so as to create a more comprehensive framework. It is worth highlighting that distributed power generation encompasses off-grid or standalone power generation, especially in remote and rural locations where access to the electric grid is limited. This study targets grid-connected DG, but off-grid systems also have a major role in decentralized energy access.
Novelty
The novelty of this work is that, in addition to the application of the Spider Wasp Optimization (SWO) algorithm, it has also been able to effectively deal with the nonlinear and multi-objective nature of the DG placement and sizing problem. SWO is better than the traditional metaheuristic methods with respect to the exploration—exploitation balance, convergence speed, and local optima avoidance. Moreover, it can be extended to multi-microgrid optimization, which will lead to more robust solutions under various operating conditions.
2 Configuration of Multi-Microgrid System
Recent research has also shown the importance of social and organizational aspects in addition to technical aspects of distributed generation systems, focusing on the role of energy communities and decentralized institutional structures in shaping distributed generation systems. All Distributed Generations (DGs), both established and newly incorporated ones, are strictly regulated to bring the maximum economic rewards, with those that are limited by emission obligations. This study, in [19], concentrates on two trendy BTM services, namely the utilization of DERs to reduce the cost of energy consumption and demand. Moreover, the process can be adjusted to provide grid services such as energy arbitrage, frequency regulation, and deferring significant asset upgrades. In the event of any power failure, the system operates in isolated mode [20], relying on all accessible DGs to meet the required local power generation. The aim, considering the economic characteristics of different DG options, is to minimize the net costs and guarantee the existence of the microgrid in case of an unexpected power outage. In this case, reliability is defined as the microgrid’s ability to remain operational during an outage. Fig. 2 presents the structure of a multi-Microgrid system, which consists of a distribution network, which is combined with a multi-microgrid system.

Figure 2: Modified 33 bus system and subdivision of zones of microgrids.
Distributed Generation (DG) is the modeling of small-scale power generation units that are put near the demand they are intended to fulfill. It is necessary to model DGs in order to examine their effects on power systems, optimize their use, and properly integrate them with the grid.
2.1.1 Photovoltaic System Modeling
Mathematical modeling of photovoltaic (PV)-based systems is critical in designing and optimizing the performance and optimization of solar energy systems. Effective modeling guarantees that PV systems will have the ability to satisfy energy requirements at the bare minimum costs and maximum efficiency. These arrays have their power output under the influence of sun irradiation and may be potentially computed by the formula below [21]:
In this case, PSolar is the power generated by photovoltaic panels and PmSolar is the power that the individual array generates at that point in time of It = 1000, It is the amount of sunlight hitting the solar PV panel, and M is the number of PV modules.
Fuel cell modeling is concerned with the simulation and evaluation of the performance under varying operating conditions. Their design and control methods [22] require accurate modeling so as to be enhanced.
The simulation of the wind turbine helps to improve turbine design, determine the feasibility of wind energy projects, and add wind power to larger electrical grids. Factors like the speed of wind, the density of air, and the structure of the turbine determine the efficiency of a wind turbine. Wind power is also a possible alternative because it is a renewable power source, and it is available a lot. The modelling equation of wind turbines is presented below [23]:
2.2 Consideration of Load Growth
This is the prediction of increased load of electricity within a 24-h period over a given area or power system. Proper development of dynamic load models is critical to the proper design and growth of the electrical systems to ensure the reliability of the future provision of energy demands. The growing power demand in the networks is stimulated by various reasons, including population growth and the creation of new industrial plants. The coefficient of demand growth in all categories of loads in any year is shown in [24] below:
where
The uncertainty in distributed generation deals with the exploration of the uncertainty and potential inaccuracies of the performance and integration of the distributed energy resources. This entails the study of factors such as the generation of output, load requirements, and the impact of environmental factors. It is important to understand these uncertainties in order to plan, operate, and integrate DG into the electricity system optimally. The output power of PV and wind can be predicted, but it has various uncertainties which arise from the unpredictability of DGs, such as PV radiation and wind speed. Therefore, in order to ensure effective planning and utilization of renewable resources, it is important to incorporate such uncertainties in the forecasting. In order to compute the uncertainties, forecast the PV radiation, wind, and demand of the load. Finally, Eqs. (1) and (2) can be used to determine the power produced by solar and wind. One must keep in mind that deviations between the expected figures and the actual numbers measured by [25] are always possible:
This study’s uncertainty analysis is performed using pre-specified variations in the input parameters that represent, albeit simplistically, the real-world variations. Uncertainties related to renewable generation and load demands may be better represented in future studies using more advanced methods, like stochastic modeling or scenario-based analysis.
One of the main problems in the optimization of Multi-Microgrid systems is the location, capacity, and size of Distributed Generation (DG) units that are supposed to be used in order to optimize the total costs of the whole system and comply with the numerous requirements. As an economic goal, minimizing total losses in the Multi-Microgrid system is one of the key aims. Technical requirements are crucial limitations, such as load balance, voltage stability, and power flow regulation, which means that the energy requirements of the system are supplied by DG-generated electricity. These aspects are outlined as follows: Total Present Worth (TPW) [18] serves as a crucial financial metric for evaluating the total worth of power generation and consumption transactions. This research employs TPW to evaluate the overall expenses related to DG units in the interconnected system. The expenses for every DG encompass capital investment, operational costs, maintenance, and ancillary expenditures. The Total Present Worth for each DG unit is determined using the following equation:
where NRE is the optimal number of DGs, Capital CostRE is the capital cost of the DG, RMCRE is the replacement cost of DG units, CR is the capital recovery factor, OPMCRN is the operation and maintenance cost of all DG units.
where R is the lifetime of the project, and L is the lifetime of each component.
3.1 Cost Required for Total Power Losses
Power loss is a vital element of the total cost and must be included in the objective element. The total Present Worth for power loss (TPWloss) is represented by the following equation:
where Closs is the penalty constant for overall losses. Ploss is the overall power loss, and CR is the capital recovery factor.
3.2 Greenhouse Gas Emission Penalties
The cost associated with gas emissions is included as an objective function. The penalty factor for pollution resulting from carbon emissions is represented by the following equation:
where TPWPenalty is the total present worth for gas emission, CPenalty is the coefficient of penalty ($/kg) for different emissions of greenhouse gases.
In this work, the electricity is mainly produced due to the fuel natural gas. The Total Present Worth of natural gas is as follows:
where TPWfuel is the total present worth for purchasing natural gas from the main grid, E is the quantity of fuel needed to produce energy of 1 kWh by fuel cell.
The objective function aims to minimize the Total Present Worth as follows:
where TPWtotal is the Total Present Worth for the total MMG system, TPWPV is the Total Present Worth for the PV generation, TPWWind is the Total Present Worth for Wind energy generation, TPWFC is the Total Present Worth for Fuel Cell, TPWfuel is the Total Present Worth for purchasing gas from the grid, TPWloss is the Total Present Worth for overall losses.
Objective Function:
The overall generated power from DGs must be sufficient to supply the required loads while compensating for distribution system losses. Consequently, the load balance constraint is formulated as follows:
DG Constraints:
The power output of DG units must operate within specified upper and lower limits.
The setup offering the greatest balance, which reduces the cost and increases reliability, is chosen based on the Levelized Cost of Energy (LCOE).
where LCOE is the Levelized Cost of Energy, PLoad is the total load connected to the MMG system.
A Multi-objective formulation is used to decide the optimal DG siting and placement to minimize the LCOE and Total Present Worth (TPW) using the Spider Wasp Optimization algorithm. Spider Wasps Optimization (SWO) is a nature-inspired metaheuristic algorithm based on the predatory and reproductive behavior of spider wasps. These wasps are known for their hunting strategies, where they paralyze spiders and use them as a food source for their larvae. The SWO algorithm mimics these behaviors to solve optimization problems efficiently. Spider Wasps Optimization (SWO) is a metaheuristic algorithm inspired by the hunting and reproductive behavior of spider wasps. These wasps have a predatory behavior that is strategic, whereby they paralyze spiders as a food supply for the larvae. Based on this natural behavior, SWO is developed to be efficient in the search and exploitation of the search space in optimization problems. The algorithm starts by having a preliminary set of possible solutions, which are evaluated according to an objective function. It is then followed by an exploration phase, where solutions seek superior alternatives on a global scale, and thereafter, an exploitation phase, where solutions that have been found best can be refined via memory-based learning. The flowchart of optimal DG sizing is provided in Fig. 3.

Figure 3: Optimal sizing of DG flowchart proposed algorithm.
The balance aids in avoiding premature convergence and also improves optimization efficiency. A survival phase is used to select the best solutions, which makes the algorithm move towards an optimal solution. The use of SWO is beneficial because it effectively examines solutions and it reduces the chances of local optima. Its adaptability makes it applicable to a wide range of problems, such as renewable energy optimization, machine learning model tuning, engineering design, and wireless sensor network deployment. By leveraging the intelligent foraging strategies of spider wasps, SWO provides an effective approach to solving complex optimization challenges.
Fig. 4 shows the proposed algorithm flowchart, which represents the power balance through DGs in multi-microgrids, and the implementation of the proposed algorithm is presented in the following section.

Figure 4: Illustrates the balancing of power through DG in MMG.
1. Initialize SWO parameters
2. Generate initial population Xi (i = 1, 2, 3, …, N)
Each Xi contains:
DG locations, DG sizes
3. Check system constraints:
Voltage limits
DG capacity limits
Branch current constraints
4. Conduct load flow analysis of each solution
5. Compute objective function:
F = w1 × TPW + w2 × LCOE
6. Determine Xbest
7. Let t = 1 (iteration counter)
8. While (t ≤ Tmax)
For every search agent Xi…
Randomly generate number r1 and r2
If exploration condition satisfied then
Update position using exploration:
Xi(t + 1) = Xi(t) + r1 × (Xrand − Xi(t))
Else
Update position with exploitation:
Xi(t + 1) = Xbest(t) + r2 × (Xbest(t) − Xi(t))
End If
Check feasibility constraints
Evaluate fitness value
If a better solution is found, update Xbest
End For
Store best fitness value
t = t + 1
9. End While
End
The whole procedure of the proposed Spider Wasp Optimization (SWO) algorithm for optimal Distributed Generation (DG) allocation and microgrid (MG) performance enhancement is shown in Fig. 5. The algorithm is iterative and finds the best solution through a mixing of exploration and exploitation processes that mimic the spider wasp’s hunting strategy.

Figure 5: Implementation of SWO for the proposed MMG.
Spider Wasp Optimization (SWO) Validation
The mathematical validation of the proposed Spider Wasp Optimization (SWO) algorithm is reported in this section by comparing its performance with other optimization algorithms with the help of benchmark functions of CEC2020, along with various statistical performance measures. The 10 benchmark functions are chosen from the CEC2020 test suite for evaluating the effectiveness of the proposed SWO algorithm. For comparison, the performance of the proposed SWO approach is compared with seven existing optimization algorithms, such as Grey Wolf Optimization (GWO), Particle Swarm Optimization (PSO), Tabu Search Algorithm (TSA), Whale Optimization Algorithm (WOA), Stochastic Paint Optimizer (SPO), Harris Hawks Optimization (HHO), and Sine Cosine Algorithm (SCA). To make a fair and unbiased comparison, each algorithm is run 30 times for a population size of 30 over a maximum of 1000 iterations. The performance evaluation is performed on statistical indicators including minimum fitness value, maximum fitness value, mean fitness value, standard deviation, and p-values of wilcoxon rank-sum test.
Statistical Results
The statistical results of the performance of the proposed SWO algorithm compared to the other presented optimization techniques in the previous section are shown here. The comparative statistical results of SWO and existing optimization algorithms on the CEC2020 benchmark functions are shown in Table 2. As shown from the obtained results, the proposed SWO algorithm provides better performance for most of the benchmark functions, and it gets the best position in several test cases. The results show the effectiveness, robustness, and competitive optimization capability of the proposed SWO method. Moreover, the SWO algorithm shows stable convergence characteristics and consistent optimization performance in comparison to other competing algorithms, thus attaining optimal/near-optimal solutions for most of the CEC2020 benchmark functions (Table 2). The statistical results for the proposed SWO algorithm are compared to other optimization algorithms in the CEC2020 benchmark functions for validation purposes. Fig. 6 shows the validation of the proposed SWO optimization with standard test functions as shown in Fig. 6a–e by comparing it with other optimization algorithms.


Figure 6: Characteristics of SWO with different standard test functions, (a) shows for the Hybrid Function 2 (N = 4); (b) Hybrid Function 1 (N = 3); (c) Shifted and Rotated Lunacek bi-Rastrigin Function; (d) Expanded Rosenbrock’s Griewangk’s Function; (e) Shifted and Rotated Schwefel Function; (f) Shifted and Rotated Bent Cigar Function.
This study is structured into five scenario categories and presents an optimal method for determining the placement and sizing of Distributed Generation (DG) units utilizing the spider wasp’s optimization algorithm (SWO). The proposed MMG system is implemented with a novel proposed SWO algorithm. The effectiveness of the proposed optimization strategy is supported by the assessment of a modified 33 bus system fragmented into separate microgrid areas, where the optimal DG sizing and placement are reviewed in different situations involving different load categories:
Scenario Type-I: Constant power load
Scenario Type-II: Industrial power demand
Scenario Type-III: Domestic load
Scenario Type-IV: Commercial load
Scenario Type-V: Mixture of all loads.
For every demand category scenario, the corresponding case studies are verified using the proposed SWO optimization. Its performance is assessed by benchmarking it against several other optimization methods. All case studies are simulated in MATLAB 2023a to optimize the multi-objective function, and simulations are carried out in MATLAB 2023a on a PC having an Intel® Core™ i7-6700 CPU @ 3.4 GHz RAM. The case studies are analyzed under the following:
Case-i: When a single DG in the MMG
Case-ii: When two DGs are included in the MMG
Case-iii: When three DGs are included in the MMG
(i) Category Scenario-I: Stable power load
The load flow analysis is conducted using the Newton–Raphson method. For a steady demand, both without DG and with the incorporation of DG, the provisions are made for a three-year DG planning period, as presented in Table 3. A rise in load demand results in increased overall losses and a decrease in the voltage profile of the MMG system. For the initial year, the lowest magnitude of voltage was observed at 0.9056 p.u., reduced to 0.8813 p.u. at the end of the third year. The main reason for the reduction is the increase in demand at the end of the third year, which leads to an increase in the drop.

Base year:
The MMG carries a demand of active and reactive power of 3.85 MW and 1.9658 MVar. When there is no DG included in the system, the amount of ‘P’ loss is 211.1 MW, and with the minimum voltage in the system at bus 18, which is 0.9154 p.u.
IInd year:
The MMG carries a demand of active and reactive power, amounting to 4.1239 MW and 2.1315 MVar, respectively. During this year, the power dissipation in the absence of DG integration is 0.2184 MW, while the least value of observed voltage at bus 18 in the network was about 0.9034 p.u.
IIIrd year:
The MMG carries a demand of active and reactive power, amounting to 4.3977 MW and 2.2717 MVar, respectively. During this year, the power dissipation in the absence of DG integration is 0.284 MW, while the least value of observed voltage at bus 18 in the network was about 0.9034 p.u.
Case-i: When one DG is included in the MMG
With the incorporation of a one DG, the SWO algorithm optimally determines its capacity as 2.55 MW, with the best location identified at bus 6. Fig. 7 illustrates the voltage fluctuations in the MMG system with the incorporation of one DG. In order to validate the proposed system, the optimized voltage profile obtained using the proposed SWO algorithm is compared with the other optimization techniques. Accordingly, the system experiences power losses of 111.1 kW and 73.91 kVar for P and Q, respectively. Implementing a single DG allows for a 57.22% reduction in losses compared to the initial year and the subsequent two years. Additionally, integrating a one DG into the MMG, this improves the voltage profile by up to 5.0% over the same period.

Figure 7: Profile of the voltage magnitude of the MMG with one DG.
Case-ii: When two DGs are included in the MMG
By incorporating two DG units, generators with ratings of 0.8567 and 1.3532 kW are optimally positioned at buses 13 and 30, respectively. Under these conditions, the system experiences power losses of 85.2 kW and 59.9 kVar for P and Q, respectively. While a single DG achieved a 57.22% reduction in losses, the deployment of two DG units further reduces power dissipation by 37.22% compared to the Initial year and the subsequent two years. Fig. 8 illustrates the voltage fluctuations in the MMG system with the incorporation of two DGs. In order to validate the proposed system, the optimized voltage profile obtained using the proposed SWO algorithm is compared with the other optimization techniques.

Figure 8: Profile of the voltage magnitude of the MMG with two DGs.
Case-iii: When three DGs are included in the MMG
By incorporating three DG units, generators with capacities of 0.7595, 1.204, and 1.0584 kW are optimally allocated at buses 14, 24, and 30, respectively. Under this arrangement, the system experiences power losses of 73.4 kW and 51.2 kVar for P and Q, respectively. Fig. 9 illustrates the voltage fluctuations in the MMG system with the incorporation of three DGs. In order to validate the proposed system, the optimized voltage profile obtained using the proposed SWO algorithm is compared with the other optimization techniques. While a single DG resulted in a 72.25% loss reduction, integrating three DG units further enhances the reduction to approximately 91.2% in comparison to the initial year and the subsequent three years.

Figure 9: Profile of the voltage magnitude of the MMG with three DGs.
(ii) Category Scenario-II: Industrial power load
MMG carries a demand of active and reactive power, amounting to 3.75 MW and 1.64 MVar, respectively. Without DG, the MMG experiences 124.7 kW loss. At bus 18, the minimum voltage observed in the network is 0.9162 p.u. Table 4 presents the power demand for industrial load demand both in the absence of DG and with the incorporation of DG, for a two-year DG planning period.

First year:
MMG carries a demand of active and reactive power, amounting to 3.91 MW and 1.720 Mvar. Before integrating DG, the MMG experiences an overall loss of 191.1 kW. At bus 18, the minimum value of voltage observed in the network is 0.9124 p.u.
Second year:
MMG carries a demand of active and reactive power, amounting to 4.25 MW and 1.89 MVar, respectively. Before integrating DG, the MMG experiences a power loss of 223.4 kW, at bus 18, the minimum value of voltage observed in the network is 0.9091 p.u.
Third year:
MMG carries a demand of active and reactive power, amounting to 4570.9 kW and 2034.5 kVar. The MMG experiences a power loss of 261 kW, at bus 18, the minimum value of voltage observed in the network is 0.9043 p.u.
Case-i: When a single DG is included in the MMG
With the incorporation of a single DG, the SWO algorithm optimally determines its capacity as 2.65 MW, with the best placement at bus 6. Under this setup, the total power losses are 115.1 kW and 68.91 kVar, respectively. The voltage fluctuations in the MMG system, with the incorporation of one DG, are shown in Fig. 8. In order to validate the proposed system, the optimized voltage profile obtained using the proposed SWO algorithm is compared with the other optimization techniques. The integration of a single DG allows for a 55.45% reduction in losses.
Case-ii: When two DGs are included in the MMG
By deploying two DG units, generators with capacities of 0.8379 and 1.45 kW are positioned at buses 13 and 30, respectively. Under this configuration, the power losses are 81.20 kW and 61.8 kVar, respectively. The voltage fluctuations in the MMG system after integration of two DGs are shown in Fig. 9. In order to validate the proposed system, the optimized voltage profile obtained using the proposed SWO algorithm is compared with the other optimization techniques. While a single DG achieves a 55.45% loss reduction, the incorporation of two DG units further reduces losses by 82.31%.
Case-iii: When three DGs are included in the MMG
By incorporating three DG units, generators with capacities of 0.715, 1.1604, and 1.1284 kW are optimally located at buses 14, 24, and 30. This configuration leads to a power loss of 72.6 kW and 50.62 kVar. Fig. 10. illustrates the voltage fluctuations in the MMG system with the incorporation of three DGs. In order to validate the proposed system, the optimized voltage profile obtained using the proposed SWO algorithm is compared with the other optimization techniques. While a single DG achieves a 73.95% reduction in losses, integrating DG units of three further enhances the decrease in power loss to approximately 93.3%.

Figure 10: The convergence features through the integration of one DG into the MMG system.
(iii) Category Scenario-III: Domestic load
From Table 5 for a three-year DG planning period, domestic load data is provided for both scenario with absence of DG and with presence of DG. The MMG carries a demand of active and reactive power, amounting to 3537.6 kW and 1823.0 kVar, respectively, while the lowest observed voltage in the network is 0.9174 p.u. at bus 18.

First year:
The MMG carries a demand of active and reactive power, amounting to 3.829 MW and 1.9597 MVar, respectively. Before integrating DG, the MMG experiences a power loss of 185.8 kW, while the lowest observed voltage in the network is 0.9107 p.u. at bus 18.
Second year:
The MMG carries a demand of active and reactive power, amounting to 1.1 MW and 2.17 MVar, respectively. Without DG, MMG experiences a power loss of 217.1 kW, while the lowest observed voltage in the network is 0.9034 p.u. at bus 18.
Third year:
The MMG carries a demand of P and Q, amounting to 4.45 MW and 2.157 MVar, respectively. Without DG, MMG experiences a power loss of 254.1 kW, and the lowest observed voltage in the network is 0.8953 p.u. at bus 18.
Case-i: When one DG is included in the MMG
By integrating a one DG, the SWO algorithm optimally determines its capacity as 2.654 MW, with the best optimal placement at bus 6. Under this setup, the overall power losses are 114.19 kW and 72.45 kVar, respectively. Fig. 7 illustrates the voltage fluctuations in the MMG system with the incorporation of one DG. In order to validate the proposed system, the optimized voltage profile obtained using the proposed SWO algorithm is compared with the other optimization techniques. The implementation of a single DG enables a 55.24% reduction in losses compared to the initial year and the subsequent two years.
Case-ii: When two DGs are included in the MMG
By deploying two DG units, generators with capacities of 0.837 and 1.425 kW are positioned at buses 13 and 30, respectively. Under this configuration, the total active and reactive power losses are 84.32 kW and 60.9 kVar, respectively. Fig. 8 illustrates the fluctuations in the MMG system with the incorporation of two DGs. In order to validate the proposed system, the optimized voltage profile obtained using the proposed SWO algorithm is compared with the other optimization techniques. While a single DG achieves a 55.45% reduction in losses, integrating two DG units further minimizes losses by 82.31%.
Case-iii: With three DGs included in the system
Distributed generators with their capacities of 0.7145, 1.124, and 1.1014 kW are optimally positioned at buses 13, 23, and 29. Fig. 9 illustrates the voltage fluctuations in the MMG system with the incorporation of three DGs. In order to validate the proposed system, the optimized voltage profile obtained using the proposed SWO algorithm is compared with the other optimization techniques. This setup results in resulting the total active and reactive power losses of 73.4 kW and 51.2 kVar, respectively. While a single DG achieves a 72.65% reduction in losses, the incorporation of three DG units further enhances the reduction to approximately 93.3%.
(iv) Category Scenario-IV: Commercial load
From Table 6, for the load demand of commercial load, the presence and absence of DG data are provided for a three-year DG planning period. The MMG experiences a loss of power of 3.32 MW and 1.765 MVar. Without DG, the MMG experiences a power loss of 145.45 kW, and at bus 18, the minimum value of voltage observed in the network is 0.9245 p.u.

First year:
MMG carries a demand of active and reactive power, amounting to 3.45 MW and 1.85 MVar. Before integrating DG, the MMG experiences a power loss of 153.14 kW, while the lowest observed voltage in the network is 0.9145 p.u. at bus 18.
Second year:
MMG carries a demand of active and reactive power, amounting to 3.63 MW and 1.95 MVar. Without DG, the MMG experiences a power loss of 185.65 kW, while the lowest observed voltage in the network is 0.9125 p.u. at bus 18.
Third year:
MMG carries a demand of active and reactive power, amounting to 3.95 MW and 2.01 MVar. Before integrating DG, the MMG experiences a loss of power of 194.5 kW, while the lowest observed voltage in the network is 0.917 p.u. at bus 18.
Case-i: When a single DG is included in the MMG
By incorporating one DG, the SWO algorithm optimally determines its capacity as 2.78 kW, with the ideal placement at bus 6. The voltage fluctuations in the MMG system with the incorporation of one DG were illustrated in Fig. 6. In order to validate the proposed system, the optimized voltage profile obtained using the proposed SWO algorithm is compared with the other optimization techniques. Under this setup, the overall losses are 124.45 kW and 79.65 kVar, respectively. The integration of a single DG enables a 45.24% reduction in losses.
Case-ii: When two DGs are included in the MMG
By integrating two DG units, generators with capacities of 0.8445 and 0.947 kW are installed at buses 13 and 30, respectively. Under this configuration, the total active and reactive power losses are 92.14 kW and 72.8 kVar, respectively. The voltage fluctuations in the MMG system with the incorporation of the two DGs are shown in Fig. 7. In order to validate the proposed system, the optimized voltage profile obtained using the proposed SWO algorithm is compared with the other optimization techniques. While a single DG achieves a 53.45% reduction in losses, the incorporation of two DG units further decreases losses by 73.21%.
Case-iii: When three DGs are included in the MMG
The voltage fluctuations in the MMG system with the incorporation of three DG, as illustrated in Fig. 8. In order to validate the proposed system, the optimized voltage profile obtained using the proposed SWO algorithm is compared with other optimization techniques. By deploying three DG units, generators with capacities of 0.6586, 0.6774, and 1.012 kW are optimally positioned at buses 14, 24, and 30. This setup results in total active and reactive power losses of 82.24 kW and 63.41 kVar, respectively. While a single DG enables a 72.65% reduction in losses.
Table 7 highlights the sizing and positioning of DGs in the MMG system, considering their integration. The results indicate that incorporating three DGs yields the most optimal locations and sizes, as it significantly reduces overall system losses. Fig. 11 displays the total power loss of the MMG system concerning the integration of DGs. The system power loss without the presence of DGs is quite high. In order to counter this, there are DGs that are put in place in the system. In the case of the single DG, the total power loss decreases to 10 MW. The results show that total power loss is further reduced by the addition of several DGs. In particular, the combination of three DGs leads to a significant decrease in power loss in comparison with other combinations.


Figure 11: Integration of three DGs into the MMG system convergence characteristics.
Table 8 displays the different optimization methods for determining the sizing and positioning of DGs in an MMG system. In the absence of DG integration, the power losses incurred in the system are very high. DGs are added to the system to alleviate these losses, and the position and size of these devices are determined with the help of the SWO, GWO, CCPSO, and PSO algorithms. The SWO algorithm is best performing with a single DG, with a reduction in the power loss of 51.25% and 43.12%. The combination of two DGs results in the SWO algorithm still being the best in comparison to the rest, and there is a 57.11% reduction in active power loss and a 46.62% reduction in reactive power loss. In the MMG system, the SWO algorithm delivers optimal results, reducing active power loss by 54.98% and reactive power loss by 43.15%, demonstrating its effectiveness in enhancing system performance.

Table 9 shows the comparison of the total present worth through various optimization techniques. The TPW for individual microgrids is simulated through optimization techniques, in which the proposed SWO technique presents microgrid-1 with a lower TPW from 467.56 to 457.35 million $, when compared with the other optimization techniques, such as GWO, CCPSO, and PSO; the proposed SWO technique shows supremacy in lowering the total present worth for microgrid-1. Similarly, in the other microgrids, such as microgrid-2 and microgrid-3, the proposed SWO technique has lowered the TPW and presents supremacy among the other optimization techniques. Fig. 12 shows the comparison of the Total Present Worth (TPW) of MMG through various optimization techniques, in which the proposed SWO technique lowers the TPW from $451.354 to $434.256 million. The proposed SWO technique shows supremacy among the other optimization techniques, such as GWO, CCPSO, and PSO.


Figure 12: Comparison of Total Present Worth (TPW) using different optimization methods.
Fig. 10 presents the convergence graph of the performance of PSO, GWO, and SWO with respect to minimizing the objective function within the iterations. The objective function decreases slowly and prematurely at a larger value, 0.106 in PSO, and PSO exhibits weaker performance in terms of optimization. GWO converges more quickly than PSO and stabilizes at a lower value, 0.102, which indicates the superior quality of solutions. SWO, in contrast, converges most quickly and with the least fluctuation, with the lowest objective function value of 0.101, which is achieved in the early iterations. Altogether, the figure points out that SWO is the best option when it comes to convergence and an optimal solution.
Fig. 13 indicates the convergence graph; the performance of PSO, GWO, and SWO is compared in terms of reducing the objective function with increasing iterations. PSO exhibits a gradual decrease in the objective function and ends up at a low value too soon, 0.106, which means poorer optimization. GWO converges faster than PSO and reaches a smaller value, 0.102, which is an indicator of a higher quality of the solution. By contrast, SWO shows the most consistent and rapid convergence, with the lowest objective function value of 0.101 being achieved in the initial few iterations. On the whole, the figure demonstrates that SWO is better than PSO and GWO both in terms of convergence speed and the optimal solution quality (Fig. 11). The convergence graph presents a comparison of the performance of PSO, GWO, and SWO towards minimizing the objective function with respect to the iterations. PSO exhibits a slower decrease in the objective function, and it concludes at a much earlier point that has a better value of 0.106, which signifies poorer optimization. GWO converges more quickly than PSO and stabilizes at a lower 0.102, which is indicative of the superior quality of the solution. In contrast, SWO demonstrates the fastest and most stable convergence, reaching the lowest objective function value of 0.101 within the first few iterations. Overall, the figure highlights that SWO outperforms PSO and GWO in terms of both convergence speed and optimal solution quality.

Figure 13: Convergence features through the combination of two DGs into the MMG system.
Table 10 shows the comparison of the Levelized Cost of Energy (LCoE) through various optimization techniques. The LCoE for individual microgrids is simulated through optimization techniques, in which the proposed SWO technique lowers the Levelized Cost of Energy (LCoE) from 0.31 to 0.28 $/kWh. When comparing with the other optimization techniques, such as GWO, CCPSO, and PSO, the proposed SWO technique shows supremacy in lowering the LCoE for the MMG system. The other optimization techniques, such as Grey Wolf Optimization (GWO), offer a lower LCoE of the MMG system from 0.31 to 0.29 $/kWh, and Cyclonic Convergent Particle Swarm Optimization (CCPSO) offers a decrease in LCoE from 0.31 to 0.299 $/kWh. The Particle Swarm Optimization gives the LCoE of the entire MMG system as about 0.31$/kWh. Therefore, comparing the proposed SWO technique with other optimization techniques reveals that the proposed SWO technique offers supremacy among all other optimization techniques. Fig. 14 shows the comparison of LCoE ($/kWh) through different optimization techniques, in which the proposed SWO technique offers a decrease in LCoE from 0.31 to 0.29 $/kWh.


Figure 14: Comparison of LCoE ($/kWh) through different optimization techniques.
This study presents a structured approach for determining the optimal positioning and capacity determination of Distributed Generators (DGs) in radial distribution networks utilizing the SWO optimization method. The primary objectives are to minimize power losses and to enhance the voltage profiles at the buses within an MMG system. The proposed methodology is tested on an MMG system under the following four distinct scenarios: the base case (when there is no DG), integration of a single DG, incorporation of two DGs into the MMG system, and incorporation of three DGs into the MMG system, each considering the impact of up to three DG units. Additionally, the analysis is extended to five different load types, namely stable power load, industrial power demand, domestic load, commercial power demand, and a combination of all load demands, with a projected annual load growth of 7.5% for each category. The results demonstrate that integrating both active (P) and reactive (Q) power DGs proves more effective in reducing power losses and enhancing voltage profiles compared to other configurations. Furthermore, expanding the quantity of DG units significantly improves MMG efficiency, with the deployment of DGs yielding results in a reduction in overall losses and a notable improvement in the magnitude of the voltage. The proposed approach effectively reduces the TPW from $434.25 to $404.52 million, considering uncertainties in demand, power generation, and dynamic energy pricing. Finally, a comparative analysis of the SWO algorithm against GWO, CCPSO, and PSO reveals that SWO achieves lower TPW and LCOE, demonstrating superior and faster convergence. Future studies will aim to facilitate the energy exchange between a single microgrid and the main grid, as well as a comparison of the performance of the SWO algorithm with HSO, TLBO, and GA.
Acknowledgement: The authors gratefully acknowledge the support provided by Woosong University for facilitating this research work.
Funding Statement: This research work was supported by “Woosong University’s Academic Research Funding—2026”.
Author Contributions: Conceptualization: Sri Suresh Mavuri and Surender Reddy Salkuti; Methodology: Sri Suresh Mavuri and Surender Reddy Salkuti; Software: Sri Suresh Mavuri; Validation: Sri Suresh Mavuri and Surender Reddy Salkuti; Writing, original draft preparation: Sri Suresh Mavuri; Writing, review and editing: Sri Suresh Mavuri and Surender Reddy Salkuti. All authors reviewed and approved the final version of the manuscript.
Availability of Data and Materials: The data and code used in this study are available from the corresponding author upon reasonable request.
Ethics Approval: Not applicable.
Conflicts of Interest: The authors declare no conflict of interest.
References
1. Ahmed A, Nadeem MF, Ali Sajjad I, Bo R, Khan IA, Raza A. Probabilistic generation model for optimal allocation of wind DG in distribution systems with time varying load models. Sustain Energy Grids Netw. 2020;22:100358. doi:10.1016/j.segan.2020.100358. [Google Scholar] [CrossRef]
2. Mousavi MH, CheshmehBeigi HM, Ahmadi M. A DDSRF-based VSG control scheme in islanded microgrid under unbalanced load conditions. Electr Eng. 2023;105(6):4321–37. doi:10.1007/s00202-023-01941-0. [Google Scholar] [CrossRef]
3. Mousavi MH, Moradi H. Simultaneous compensation of distorted DC bus and AC side voltage using enhanced virtual synchronous generator in Islanded DC microgrid. Int J Electron. 2025;112(1):151–76. doi:10.1080/00207217.2023.2278440. [Google Scholar] [CrossRef]
4. Kumar S, Mandal KK, Chakraborty N. Optimal DG placement by multi-objective opposition based chaotic differential evolution for techno-economic analysis. Appl Soft Comput. 2019;78(4):70–83. doi:10.1016/j.asoc.2019.02.013. [Google Scholar] [CrossRef]
5. Mazzeo D, Oliveti G, Baglivo C, Congedo PM. Energy reliability-constrained method for the multi-objective optimization of a photovoltaic-wind hybrid system with battery storage. Energy. 2018;156(2):688–708. doi:10.1016/j.energy.2018.04.062. [Google Scholar] [CrossRef]
6. Gholami K, Jazebi S. Multi-objective long-term reconfiguration of autonomous microgrids through controlled mutation differential evolution algorithm. IET Smart Grid. 2020;3(5):738–48. doi:10.1049/iet-stg.2019.0328. [Google Scholar] [CrossRef]
7. Mavuri SS, Nakka J. Economic scheduling and dispatching of distributed generators considering uncertainties in modified 33-bus and modified 69-bus system under different microgrid regions. Trans Energy Syst Eng Appl. 2024;5(2):1–22. doi:10.32397/tesea.vol5.n2.570. [Google Scholar] [CrossRef]
8. Srinivasarathnam C, Yammani C, Maheswarapu S. Multi-objective Jaya algorithm for optimal scheduling of DGs in distribution system sectionalized into multi-microgrids. Smart Sci. 2019;7(1):59–78. doi:10.1080/23080477.2018.1540381. [Google Scholar] [CrossRef]
9. Ahmad S, Shafiullah M, Ahmed CB, Alowaifeer M. A review of microgrid energy management and control strategies. IEEE Access. 2023;11(1):21729–57. doi:10.1109/ACCESS.2023.3248511. [Google Scholar] [CrossRef]
10. Shayeghi H, Shahryari E, Moradzadeh M, Siano P. A survey on microgrid energy management considering flexible energy sources. Energies. 2019;12(11):2156. doi:10.3390/en12112156. [Google Scholar] [CrossRef]
11. Zia MF, Elbouchikhi E, Benbouzid M. Microgrids energy management systems: a critical review on methods, solutions, and prospects. Appl Energy. 2018;222(6):1033–55. doi:10.1016/j.apenergy.2018.04.103. [Google Scholar] [CrossRef]
12. Atef M, Alahakoon S, Mumtahina U, Wolfs P, Khatib T, Uddin M. A review of microgrid energy management systems: methods, challenges, and future directions. Int J Ambient Energy. 2026;47(1):2595117. doi:10.1080/01430750.2025.2595117. [Google Scholar] [CrossRef]
13. Sifat MMH, Haque ME, Islam S, Ronanki D, Kumar BK. Digital twin based microgrid control and energy management: trends, challenges, and future directions. Comput Electr Eng. 2026;134(6396):111100. doi:10.1016/j.compeleceng.2026.111100. [Google Scholar] [CrossRef]
14. Altimania MRM, Basem A, Saydullaev B, Atamuratova Z, Madaminov B, Umarov A, et al. Adaptive multi-objective optimization of microgrid energy management using deep reinforcement learning considering battery degradation and renewable uncertainty. Sci Rep. 2026;16(1):14296. doi:10.1038/s41598-026-44179-z. [Google Scholar] [PubMed] [CrossRef]
15. Tang Y, Ding S, Lu Z, Lu S, Zhang J, Cai Y, et al. Multi-objective hybrid game-theoretic framework with distributionally robust chance constraints for multi-energy microgrid energy management. Appl Energy. 2026;404(1):127184. doi:10.1016/j.apenergy.2025.127184. [Google Scholar] [CrossRef]
16. Sri Suresh M, Thanikanti SB, Aljafari B, Paramasivan M. Energy management of multi-microgrid systems using a Spotted Hyena Optimization framework under uncertain conditions. Eng Res Express. 2026;8(3):035316. doi:10.1088/2631-8695/ae3ba6. [Google Scholar] [CrossRef]
17. Ramesh S, Sukanth BN, Sathyavarapu SJ, Sharma V, Nippun Kumaar AA, Khanna M. Comparative analysis of Q-learning, SARSA, and deep Q-network for microgrid energy management. Sci Rep. 2025;15(1):694. doi:10.1038/s41598-024-83625-8. [Google Scholar] [PubMed] [CrossRef]
18. Suresh MS, Chandana M, Bhargavi E, Rahul S, Mithilesh V, Rao TE. A multi objective cost effective approach of energy management of multi-microgrid environment using hybrid Jaya-PSO optimization technique. In: Power energy and secure smart technologies. Boca Raton, FL, USA: CRC Press; 2025. p. 23–31. [Google Scholar]
19. Khosravi N, Sepehrzad R, Tahir H, Dowlatabadi M, Abdolmohammadi HR. Networked microgrid energy management: enhancing system stability and efficiency in high-variability scenarios. Electr Power Syst Res. 2026;258(8):113043. doi:10.1016/j.epsr.2026.113043. [Google Scholar] [CrossRef]
20. Zhang M, Li Z, Li H, Xu Q. Safe multi-agent deep reinforcement learning based energy management for multi-microgrid energy communities. IEEE Trans Consum Electron. 2026. doi:10.1109/tce.2026.3679622. [Google Scholar] [CrossRef]
21. Mavuri SS, Salkuti SR. A novel prairie dog optimization for energy management of multi-microgrid system considering uncertainty and load management. Designs. 2025;9(6):130. doi:10.3390/designs9060130. [Google Scholar] [CrossRef]
22. Li LL, Ji BX, Li ZT, Lim MK, Sethanan K, Tseng ML. Microgrid energy management system with degradation cost and carbon trading mechanism: a multi-objective artificial hummingbird algorithm. Appl Energy. 2025;378:124853. doi:10.1016/j.apenergy.2024.124853. [Google Scholar] [CrossRef]
23. Mavuri SS, Nakka J, Kotla A. Deep neural network based intelligent multi-microgrid energy management. In: 2023 IEEE 3rd International Conference on Sustainable Energy and Future Electric Transportation (SEFET); 2023 Aug 9–12; Bhubaneswar, India. p. 1–6. doi:10.1109/SeFeT57834.2023.10245648. [Google Scholar] [CrossRef]
24. Alilou M, Younesi A, Siano P. A sustainable approach to hybrid microgrid design: optimal sizing and energy management. Renew Energy. 2026;256(18):124078. doi:10.1016/j.renene.2025.124078. [Google Scholar] [CrossRef]
25. Esan AB, Shareef H. Network-aware coordinated multi-microgrid energy management with carbon emission considerations under uncertainty: a multi-agent double deep Q networks approach. Electr Power Syst Res. 2026;254:112683. doi:10.1016/j.epsr.2025.112683. [Google Scholar] [CrossRef]
Cite This Article
 Copyright © 2026 The Author(s). Published by Tech Science Press.
This work is licensed under a Creative Commons Attribution 4.0 International License , which permits unrestricted use, distribution, and reproduction in any medium, provided the original work is properly cited.
 Downloads
 Citation Tools
