
 Submit a Paper
 Propose a Special lssue
 Open Access
ARTICLE

Parameter Optimization Strategy for VSC-HVDC Low-Voltage Ride-Through Considering Short-CIRCUIT Current and System Stability
State Grid Xinjiang Electric Power Co., Ltd. Research Institute, Urumqi, China
* Corresponding Author: Zimin Zhu. Email:
(This article belongs to the Special Issue: Trends of Offshore Wind Technologies: Support Structure Design, Health monitoring, HVDC transmission, Control and Optimization)
Energy Engineering 2026, 123(4), 14 https://doi.org/10.32604/ee.2026.072166
Received 20 August 2025; Accepted 03 November 2025; Issue published 27 March 2026
 View Full Text
 Download PDF
Abstract
When the converter bus voltage of a voltage source converter-based high voltage direct current (VSC-HVDC) system drops below a certain predetermined threshold, the system enters low-voltage ride-through (LVRT) mode to avoid overcurrent and potential equipment failure, during which it operates as a controlled current source. The influence mechanism of LVRT control strategies on short-circuit current and overall system stability remains not yet fully and systematically investigated. First, this paper provides an overview of several LVRT strategies for VSC-HVDC systems and examines their effects on short-circuit current contribution. Next, it analyzes in detail the mechanisms through which active and reactive currents injected during LVRT impact system frequency stability, voltage stability, and synchronization stability. To address these interrelated issues, an optimized and comprehensive LVRT strategy incorporating short-circuit current constraints is proposed. The approach determines the active current ratio based on system frequency stability requirements and dynamically adjusts the active current recovery rate via phase control of the VSC-HVDC bus. The remaining capacity is allocated to reactive current support, thereby enhancing voltage and synchronization stability while maintaining sufficient short-circuit current margin and system frequency stability. Finally, simulations conducted on the PSS/E platform, using actual grid data from a selected cross-section system, validate convincingly the effectiveness of the proposed parameter optimization strategy for VSC-HVDC low-voltage ride-through.Keywords
Driven by global carbon peak and carbon neutrality goals, the power system is undergoing a profound transformation. The installed capacity proportion of renewable energy sources such as wind and photovoltaic power continues to increase, while voltage source converter-based high voltage direct current (VSC-HVDC) technology has been widely deployed in power grids due to its advantages in long-distance transmission of renewable energy [1,2]. The increasing power-electronization of the generation side has significantly altered system stability mechanisms and short-circuit current characteristics [3]. Notably, power electronic devices have limited overcurrent capability. Following a fault, VSC-HVDC systems will enter a low-voltage ride-through (LVRT) state. Unlike traditional synchronous generators, the LVRT strategies of VSC-HVDC systems are highly controllable and need to be adapted to different grid scenarios [4]. Therefore, in-depth investigation into the impact of VSC-HVDC LVRT strategies on short-circuit current and system stability is of significant engineering importance for ensuring the secure operation of new power systems.
Extensive research has been conducted on the short-circuit current characteristics and stability impacts of power electronic-based systems, which can be broadly categorized into two streams. The first stream focuses on refining the modeling and calculation of short-circuit currents. For instance, reference [5] proposed a high-precision short-circuit current calculation method based on discrete-time modeling, while reference [6] revealed the short-circuit contribution mechanism of VSC-HVDC under AC faults and designed additional control to suppress it. Further studies [7–9] analyzed the dynamic response through inner and outer loop control strategies, and reference [10] derived expressions for transient and steady-state short-circuit currents by incorporating fault ride-through strategies. Reference [11] advanced this field by achieving refined modeling of MMC short-circuit currents under V/F control. The second stream of research investigates the impact of renewable generation control on various system stability aspects. Studies [12,13] demonstrated that the rotor angle of synchronous generators is directly influenced by the type of reactive power control in wind generation, showing that terminal voltage control can reduce reactive power requirements and mitigate rotor angle swings. Reference [14] analyzed how active current from DFIGs during LVRT affects first-swing rotor angle stability, indicating that reducing active power during faults benefits stability. Reference [15] examined the effect of reactive current injection on synchronization stability, finding it can enhance damping and improve transient stability. Other works [16,17] investigated LVRT control’s impact on voltage recovery, while references [18,19] addressed frequency stability issues related to active power ramp-rate recovery after faults. Based on the Irish grid, Reference [20] studied the impact of various wind turbine LVRT control strategies on frequency stability in low-inertia islanded grids and proposed measures from an ancillary services perspective to mitigate frequency dips.
Furthermore, emerging technologies like electric vehicle (EV) integration are also recognized as new factors influencing system stability. Recent studies have begun to explore the impact of Vehicle-to-Everything (V2X) operations, such as [21] on the design of bidirectional converters for V2V charging, and [22] on predictive control for fuel cell Vehicle-to-Load (V2L) systems. These studies underscore the expanding landscape of power-electronized resources that interact with the grid.
While these studies provide valuable insights, they predominantly focus on single-dimensional risks (e.g., optimizing for short-circuit current limitation or a specific stability issue like voltage, angle, or frequency in isolation). This approach often leads to strategies that improve one stability objective at the expense of others. A critical research gap exists in the systematic analysis of multi-risk coupling effects and the development of coordinated optimization methods. Particularly in grids with high penetration of renewable energy, VSC-HVDC LVRT strategies, by altering short-circuit current characteristics, create complex interactions among voltage, frequency, and synchronization stability. This multi-factor coupling effect and the need for a holistic optimization framework have not been sufficiently studied, making it difficult to meet the security regulation requirements of complex grid scenarios. requirements of complex grid scenarios.
To bridge this gap, this paper proposes a generalized optimization framework for designing LVRT strategies oriented towards multi-stability cooperative optimization. Furthermore, it reveals the coupling mechanism of active/reactive current during LVRT and recovery stages on voltage, frequency, and synchronization stability. Based on this, a design method for LVRT strategies oriented towards multi-stability cooperative optimization is proposed, focusing on enhancing system synchronization stability by regulating active power recovery rate. Finally, the effectiveness of the proposed method is validated based on actual grid cases. It is noteworthy that the primary contribution of this work is a generalizable optimization framework, rather than a fixed set of parameters. The framework provides a methodology to calculate customized LVRT parameters tailored to specific grid conditions and stability requirements.
The main contributions, which distinctly differentiate this paper from the existing literature, are summarized as follows:
(1) Analysis of the Impact Mechanism of LVRT on System Short-Circuit Current and Stability: This paper establishes an analytical model for VSC-HVDC short-circuit current that incorporates LVRT strategies, which quantifies the impact of different control modes on the fault current. Reactive current plays a key role in contributing to the system short-circuit current. More importantly, it explicitly reveals the coupling mechanism of active and reactive current during both the LVRT hold and recovery stages on voltage, frequency, and synchronization stability, addressing the gap in multi-risk coupling analysis. During the LVRT period, a higher proportion of reactive current is more beneficial for system voltage and synchronization stability, but unfavorable for frequency stability.
(2) Comprehensively Optimized LVRT Control Strategy: The optimization method proposed in this paper operates under the premise of satisfying system security constraints. It prioritizes safeguarding the most vulnerable stability indicator based on real-time operating conditions. This approach represents an engineering trade-off within multi-objective, constrained conditions, adapting to the operational needs of different power grids, rather than pursuing a single global optimal solution.
(3) Validation and Generalizability: The effectiveness of the proposed framework is validated based on actual grid cases. Notably, the primary contribution is a generalizable optimization framework, rather than a fixed set of parameters. The framework provides a methodology to calculate customized LVRT parameters tailored to specific grid conditions and stability requirements, offering significant practical utility.
2.1 Short-Circuit Current Calculation Model
In the dq reference frame, the control strategy of the Modular Multilevel Converter (MMC) can be divided into an outer-loop power controller and an inner-loop current controller. The outer-loop power controller calculates the d-axis current reference value and the q-axis current reference value for the inner-loop current controller based on the active power control targets and the reactive power control targets. Due to the limited overcurrent capability of power electronic devices, the outputs of the outer-loop controller are subjected to current limiting.
During grid faults, the actual values of the outer-loop control parameters change, thereby causing the reference values for the inner-loop currents to change accordingly. When the inner-loop current reference values reach their limiting values, the MMC can no longer respond to the inputs from the outer-loop controller and enters the LVRT mode. At this stage, the outer-loop controller is typically disabled, and the inner-loop current references are directly assigned according to the LVRT strategy. Consequently, from the grid’s perspective, the MMC operates as a constant-amplitude current source with adjustable phase angles, as expressed in Eq. (1):
where Idref and Iqref are the d-axis and q-axis current reference values, respectively, Imax is the current limiting value of the MMC and I and ϕI represent the magnitude and phase angle, respectively, of the current injected by the MMC in its own dq reference frame. The values of Idref and Iqref determine the active and reactive currents injected by the MMC during the LVRT period. Different ratios of active to reactive current correspond to different LVRT strategies and short-circuit current.
Currently, there are no relevant national standards governing LVRT strategies for MMCs. Considering that different grid scenarios necessitate distinct LVRT strategies, existing approaches include active-priority current limiting, reactive-priority current limiting, and proportional current limiting. Drawing on the national standard for LVRT in wind farms, the reactive current during LVRT can also be configured to dynamically respond to voltage variations.
The MMC’s reactive current reference is typically calculated according to Eq. (2) [23]. In existing schemes, the dynamic reactive current proportional coefficient K1 is set to 1.5.
where, ΔIqref is the increment of dynamic reactive current injected by the wind farm, K1 is the proportional coefficient of dynamic reactive current for the wind farm, typically ranging between [1.5, 3], UPCC is the per-unit value of the voltage at the wind farm’s point of common coupling (PCC), IN is the rated current of the wind farm.
Upon fault clearance and voltage recovery, the MMC’s active power must be restored to its steady-state value. The methodology and rate of active power restoration can be configured based on the specific grid requirements.
In summary, drawing inspiration from wind farm LVRT strategies [23], this paper presents the pre-optimized LVRT implementation plan for the MMC, as detailed in Table 1.
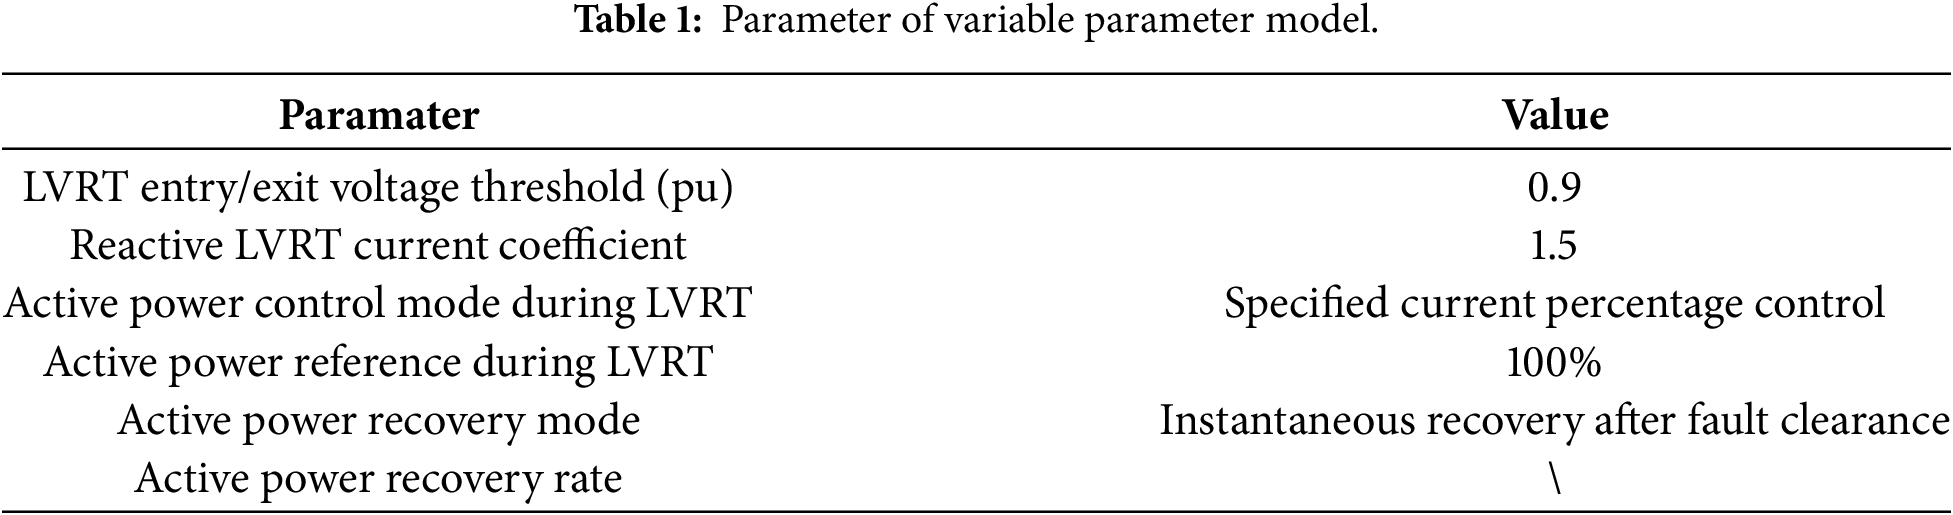
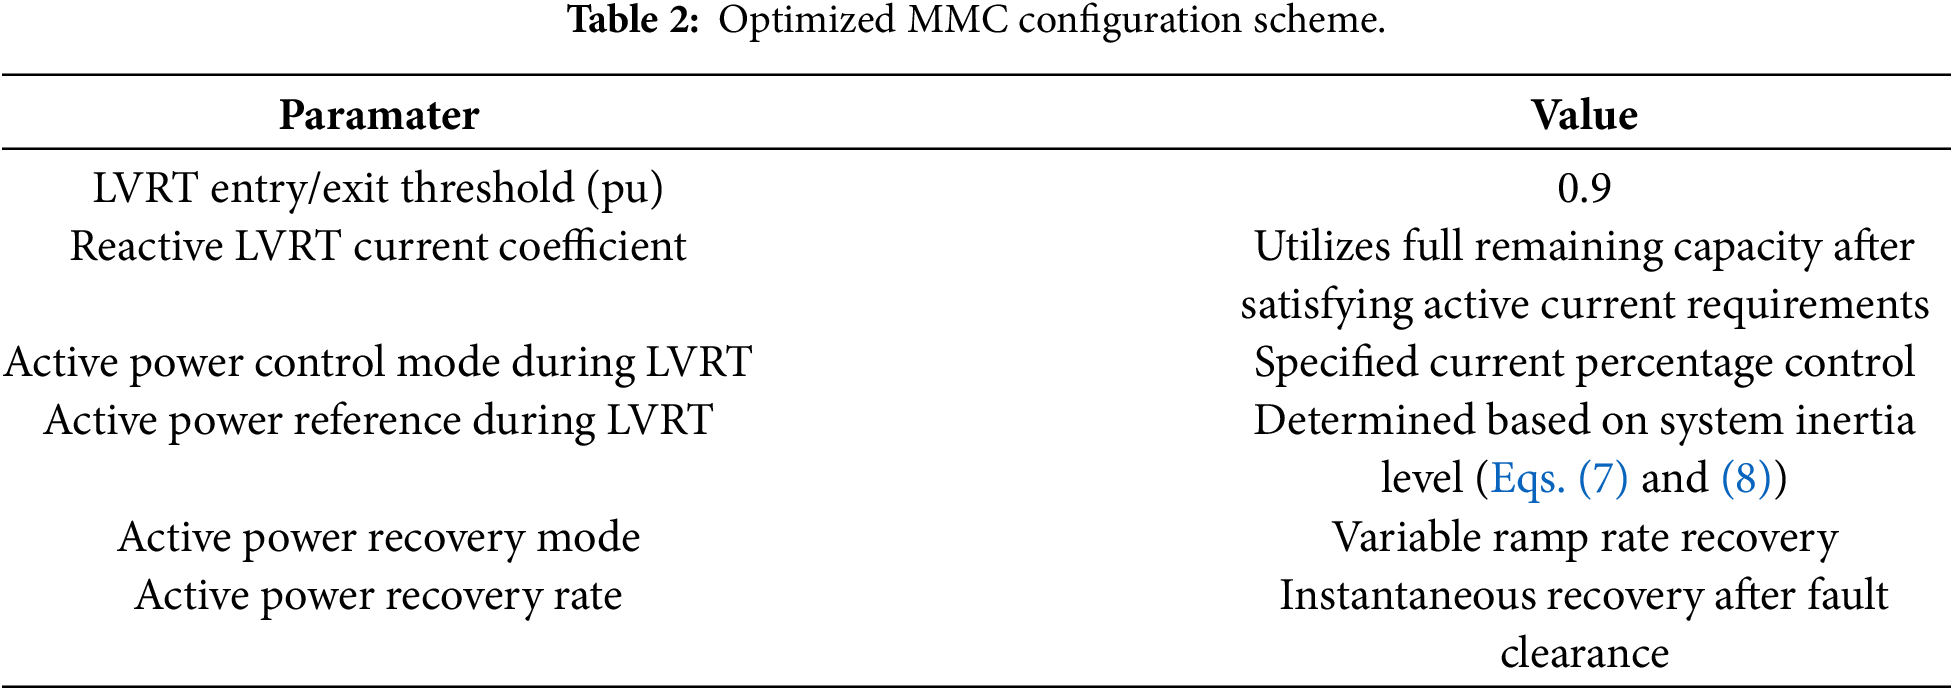
In Table 1, the LVRT entry/exit voltage threshold is set to 0.9 pu, meaning that the MMC enters LVRT mode when the AC bus voltage drops below 0.9 pu and exits LVRT when the voltage rises above 0.9 pu. The reactive LVRT current coefficient corresponds to K1 in Eq. (2). The active power control mode during LVRT refers to how the active current is regulated in this mode; in Table 1, it is implemented as a specified percentage of the pre-fault active current, set here to 100%. The active power recovery mode defines how the active current is restored after the MMC exits LVRT. In Table 1, it is configured to recover instantaneously after fault clearance.
3 Impact of LVRT Strategy on VSC-HVDC Short-Circuit Current
During grid faults, MMC injects short-circuit current into the grid. The magnitude and characteristics of this injected short-circuit current during the LVRT period are determined by the specific LVRT strategy employed according to Section 2.1. Consequently, when optimizing LVRT parameters, it is essential to consider that the system short-circuit current after MMC integration must not exceed the circuit breaker’s interrupting capacity. This necessitates an analysis of the active and reactive power contribution characteristics of the MMC’s short-circuit current.
In AC synchronous grids, the reactance (X) of high-voltage transmission lines is significantly greater than the resistance (R). Therefore, the short-circuit current is predominantly composed of reactive current. From a practical engineering standpoint, given that the MMC’s response time is on the order of tens of milliseconds [24], the steady-state short-circuit current component can be calculated. Thus, the short-circuit current contributed by the MMC equals its reference current values under the active LVRT strategy. Consequently:
When the MMC provides only active current, its contribution to the AC system short-circuit current is minimal. When the MMC provides only reactive current, its contribution to the AC system short-circuit current is maximal [6].
The mechanism of the MMC’s short-circuit current contribution is illustrated in the phasor diagram of Fig. 1. In Fig. 1, UPCC represents the voltage at the Point of Common Coupling (PCC), IS denotes the short-circuit current supplied by the synchronous generator(s), Ishort represents the total system short-circuit current and IMMC represents the short-circuit current contributed by the MMC. IS lags behind UPCC by 90°. Therefore, when the phase difference between IMMC and IS decreases, the short-circuit current contributed by the MMC to the AC system increases.
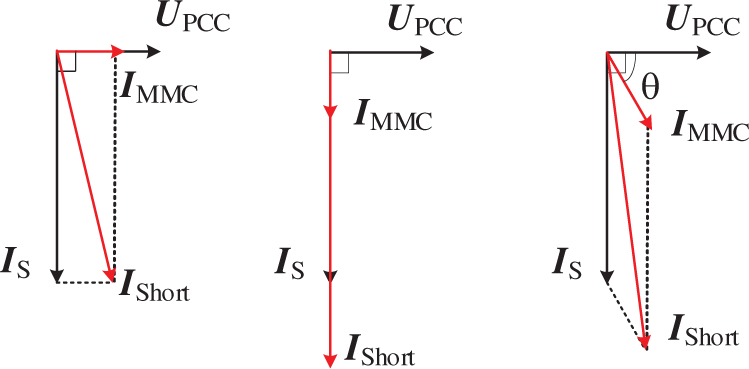
Figure 1: MMC contribution short-circuit current phasor diagram.
4 LVRT Strategy Optimization Method Addressing Multi-Stability Risk Coupling
As evident from Table 1 in Section 2.2, the primary objective of the current MMC LVRT strategy is to maintain the active current constant while providing as much reactive power support as possible. However, this strategy may potentially compromise system stability in practical applications. The impacts of MMC active and reactive power on system stability are discussed below from the perspectives of rotor angle stability, voltage stability, and frequency stability.
From the dimensions of rotor angle and voltage, the requirements for enhancing system stability through the MMC LVRT strategy are not conflicting: namely, reducing active current and increasing reactive current. The essence of frequency deviation lies in the imbalance between the replenishment and release of kinetic energy stored in rotating masses. Therefore, if the MMC reduces its active power output during LVRT, it inevitably creates an energy deficit. Consequently, regarding active power, the requirements for LVRT imposed by rotor angle stability and frequency stability are conflicting.
Nevertheless, the rotor angle swing process typically has a short duration (on the order of seconds), whereas the maximum frequency deviation usually occurs several seconds after the fault inception. Leveraging this timescale separation between rotor angle swing and frequency evolution provides an effective means to optimize the MMC LVRT strategy and enhance overall system stability. A detailed analysis follows.
First, assume the illustrative profile of the MMC’s active power during the entire LVRT and recovery process, as shown in Fig. 2 [25]. In Fig. 2, P0 and Psag represent the active power output of the MMC during steady-state operation and the LVRT period, respectively, tsag denotes the duration of the LVRT period (i.e., the duration of the voltage sag and the period of reduced power output), trc denotes the duration of the active power recovery process. Upon detecting a voltage sag at its terminal bus, the MMC reduces its power output to a low value Psag. After the LVRT duration tsag, the power recovery process begins, lasting for the duration trc.
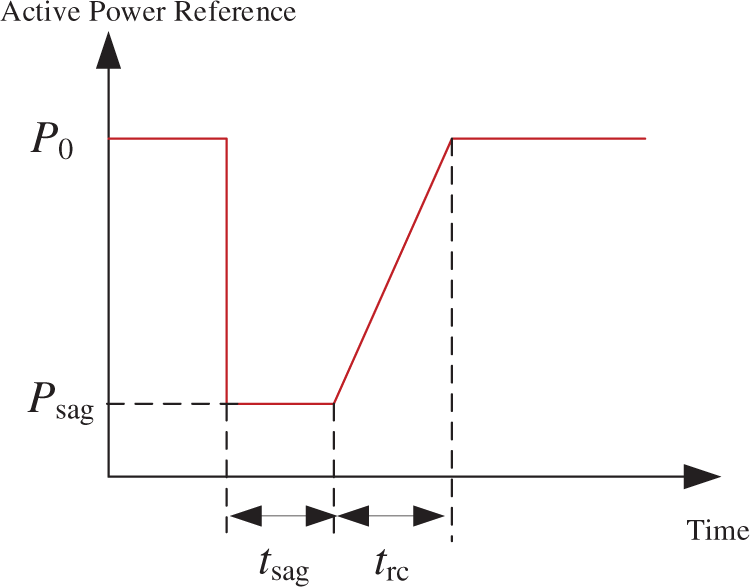
Figure 2: Complete curve of the MMC LVRT and recovery process.
The objective of optimizing the LVRT strategy is to determine the optimal parameters Psag, tsag, and the recovery ramp rate. Subsequently, parameter optimization will be performed from the perspectives of different stability aspects.
4.1 Optimization of Active Power Reference and Fault Duration
First, the optimization method for the LVRT duration tsag will be analyzed from the perspective of rotor angle stability.
During the period when the system rotor angle deviation continuously increases, the MMC maintains LVRT mode, and its active power does not recover. When the system rotor angle deviation begins to decrease, the MMC starts to restore active power from LVRT mode. Therefore, in Fig. 2, tsag is essentially the duration of continuous increase in the system rotor angle deviation. Under different short-circuit faults, due to variations in fault location and severity, the duration of increasing rotor angle deviation in the system also differs, and the rate of angle change varies across generators. This complicates the selection of tsag. To be conservative, the MMC should maintain LVRT mode until the rotor angles of all generators commence backswing. Therefore, the specific method to calculate tsag is to simulate various faults, identify the generator with the longest duration of angle increase across all faults, and use that time as tsag.
Next, the optimization method for Psag will be analyzed from the perspective of frequency stability.
The essence of frequency stability lies in the extraction or replenishment of kinetic energy stored in the rotors of synchronous generators. Since energy is inherently time-dependent, the impact of a low Psag value on potential system frequency instability critically depends on its duration tsag.
The energy deficit incurred by the system due to the MMC’s LVRT strategy over the period tsag is given by:
where, Esag denotes the energy deficit.
The relationship governing the extraction of kinetic energy from synchronous generator rotors is expressed as:
where, Ek represents the kinetic energy extracted from the rotating masses, Hsys denotes the regional system inertia constant for the area where the MMC is integrated, ω is the rotor angular velocity of the synchronous generators, ω0 is the initial rotor angular velocity prior to the disturbance.
The frequency deviation dynamics of the system resulting from the energy deficit ΔEsag can be derived as follows:
Given that the minimum permissible system frequency is Kfω0, and assuming the MMC restores active power immediately after LVRT clearance, the maximum permissible energy deficit that the system can tolerate during the LVRT period is:
where, Esagmax represents the maximum permissible energy deficit during the MMC LVRT period.
In practice, an energy deficit persists during the MMC’s active power recovery period, leading to significant inaccuracies when estimating the maximum permissible energy deficit solely using Eq. (6). To address this, an engineering empirical coefficient Ks can be introduced. This coefficient quantifies the ratio between the actual maximum energy deficit attributable to the MMC and the extractable kinetic energy from synchronous generator rotors, as expressed in Eq. (7):
The derivation of the equation is based on the following rationale: the maximum allowable energy loss, Esagmax, for the MMC is determined by the maximum kinetic energy, Ek, that can be released from the generator rotor. This establishes the relationship between the active power Psag and the duration of the low-LVRT period.
If the LVRT duration tsag is predetermined, the active power setpoint Psag during the LVRT period can be directly determined using the following equation:
Once tsag is predetermined, Eqs. (7) and (8) can be used to calculate the residual power Psag during the MMC’s LVRT period. During LVRT, the MMC reduces its active power output to Psag, thereby freeing up capacity to inject more reactive power to support grid voltage.
4.2 Optimization of Reactive Power Injection during LVRT
The optimization method for reactive power will be analyzed from the perspective of voltage stability.
The MMC’s reactive current reference is typically calculated according to Eq. (2). In existing schemes, the dynamic reactive current proportional coefficient K1 is set to 1.5. This value often fails to utilize the MMC’s full voltage support capability in many scenarios. A feasible approach is to determine the active current value first, then calculate the maximum available reactive current based on the MMC’s current limit, and use this value as the reactive current limit. Meanwhile, set the dynamic reactive current proportional coefficient K1 to a large value. When system voltage is low, the MMC directly delivers its maximum reactive capacity, thereby maximizing system voltage stability.
4.3 Optimization of the Active Power Recovery Rate
The optimization method for the active power recovery rate during LVRT will be analyzed from the perspective of rotor angle stability.
To reveal the effect of the current LVRT configuration scheme on synchronous stability, a generation-side two-machine infinite-bus system as shown in Fig. 3 [26] is established. In this system, the synchronous generator and the MMC are connected to the same busbar. In Fig. 3, Pg is the output of the synchronous machine, Ug and θg are the voltage magnitude and phase angle at the synchronous machine bus, respectively, Esys is the voltage magnitude of the infinite bus, Xsys is the system equivalent impedance, and Pn is the output of the MMC.
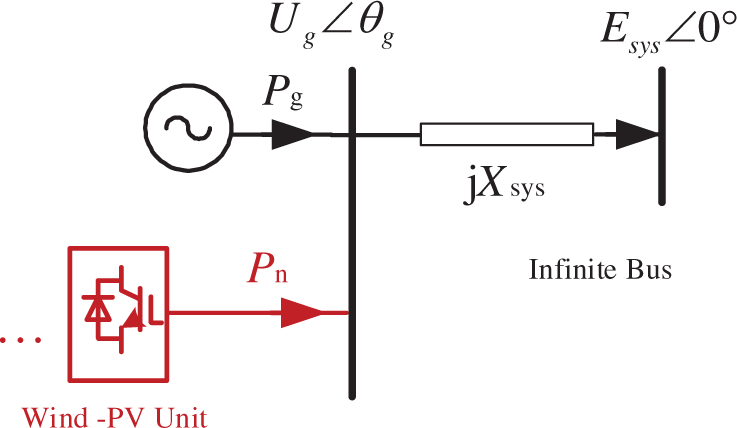
Figure 3: Complete curve of the MMC LVRT and recovery process.
First, assume that both the synchronous generator and the MMC supply power to an infinite busbar. The output of the synchronous generator then satisfies the following equation:
In the recovery phase shown in Fig. 2, if the MMC’s power restoration is too rapid, it may cause the synchronous generator’s rotor angle to reaccelerate and potentially lose stability. To reveal this mechanism, the synchronous generator’s power-angle characteristic curve shown in Fig. 4. The equal-area criterion is used to analyze synchronous stability [27]. In Fig. 4, Line 2 represents the power-angle characteristic curve without considering the MMC. When the MMC is accounted for as described in Eq. (9), the power-angle characteristic curve becomes Line 1. The points from A to J in the figure correspond to the operating points of the synchronous machine.
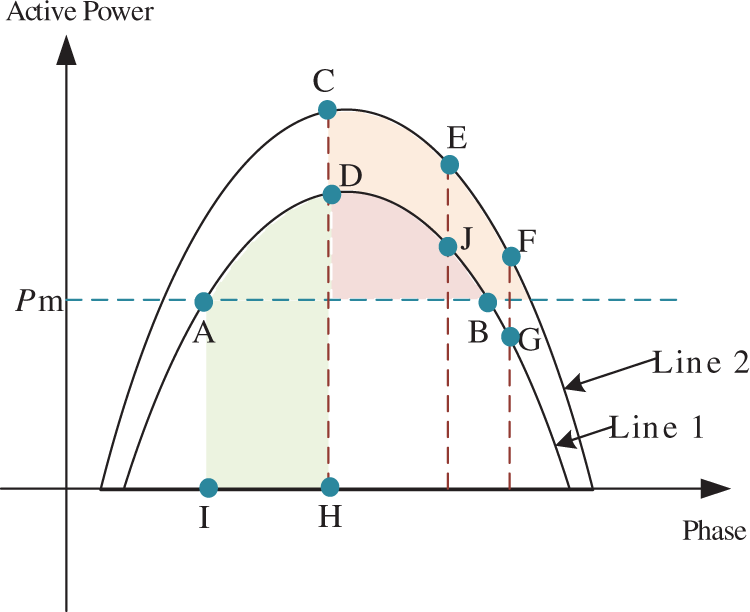
Figure 4: Synchronous machine power angle characteristic curve considering MMC impact.
At the initial operating point A, if a three-phase bolted fault occurs at the terminal, the synchronous generator’s operating point will abruptly transition to point I, then rapidly accelerate to point H. If the fault is cleared at point H and the MMC output is assumed to restore instantaneously, the synchronous generator’s operating point will abruptly transition from point H to point D and move along curve 1 under deceleration. If the MMC output does not restore to its initial value but operates at reduced power, upon fault clearance, the synchronous generator’s operating point will abruptly transition from point H to point C and move along curve 2 under deceleration. Clearly, with the MMC operating at reduced power, the synchronous generator’s deceleration area is larger, resulting in better stability.
However, if the MMC restores power before the synchronous generator’s rotor angle returns to the stable region, the synchronous generator may re-accelerate during its deceleration motion until instability occurs. For example, if the synchronous generator decelerates along curve 2 from point C to point F, and the MMC fully restores power at point F, the generator’s power-angle characteristic curve will shift from curve 2 to curve 1. Consequently, the synchronous generator will abruptly transition from point F to point G, creating the potential for re-acceleration.
To be conservative, the principle for restoring MMC output power here is set to ensure that the synchronous generator does not re-accelerate during its deceleration motion. That is, within the time trc, the MMC’s output power must ensure that the synchronous generator’s rotor angle does not experience re-acceleration.
For the system shown in Fig. 3, the condition for preventing re-acceleration of the synchronous generator’s rotor angle is:
Based on the power flow calculation formulas, the constraint on MMC output power to prevent acceleration of the synchronous generator’s rotor angle is obtained as:
In practical large-scale power systems, it is difficult to constrain the MMC’s LVRT recovery process using an explicit form similar to Eq. (11).
For a two-terminal power system with a topology as shown in Fig. 5. In Fig. 5, there are two subsystems, namely System A and System B. System A contains three nodes, while System B contains four nodes. The two systems are interconnected via four transmission lines, Line 1 to Line 4. The active power transmitted through these lines is denoted as PLine1 to PLine4, respectively.
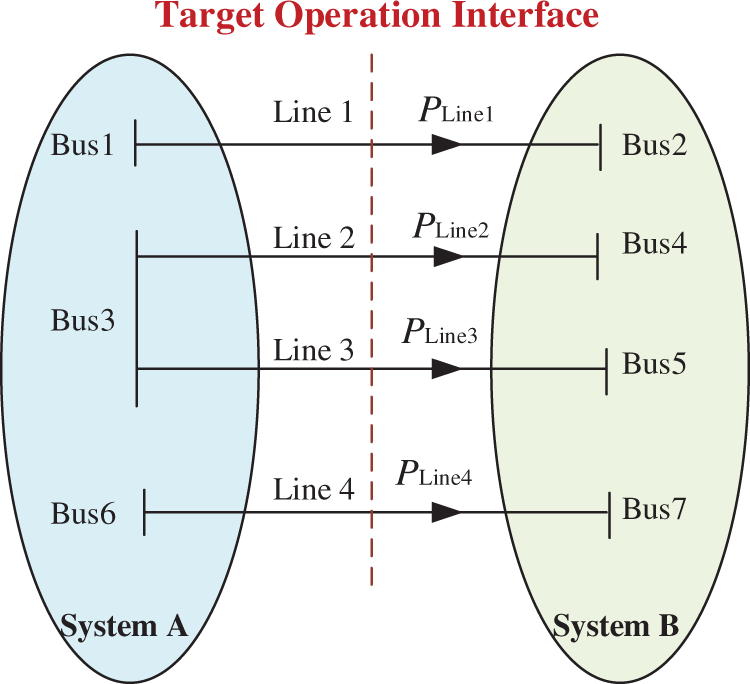
Figure 5: Schematic diagram of the two-terminal system at a transmission cross-section.
The active power recovery rate of the MMC during its restoration process can be adaptively adjusted based on the sectional power flow. Below, a feasible approach is presented: for the MMC, its post-LVRT power recovery rate is determined by:
where, v(t) represents the power recovery rate of the MMC at time t, vmax denotes the maximum permissible power recovery rate that the MMC can withstand, θ is the bus phase angle of the MMC, Δθ is the change in the bus phase angle of the MMC relative to its initial value, θc represents the critical phase angle change.
The expression for the h-function is as follows:
where: α is a constant coefficient.
The MMC monitors both the rate of change and the magnitude of change in its terminal bus phase angle. When the bus phase angle change is within a small range: The MMC restores power at the maximum rate. When the bus phase angle change exceeds the deadband threshold and the phase angle is increasing: The MMC sets the recovery rate to zero. When the bus phase angle is in a state of persistent decline: The MMC initiates power recovery. Furthermore, as the rate of decline of the bus phase angle increases, the MMC’s power recovery rate increases, but does not exceed vmax.
The fundamental principle of the above control logic is: To make the MMC reduce or even halt power recovery when the phase angle has increased to a certain extent and continues to increase. To recover power slowly when the phase angle has increased to a certain extent but begins decreasing towards its initial point. To recover power rapidly when the phase angle is decreasing quickly or has decreased to a certain extent.
Finally, the optimized MMC LVRT strategy is summarized in Table 2.
Due to the optimized LVRT reactive current control strategy—which releases full converter capacity after satisfying the active current requirement—this approach may increase the short-circuit current contributed by the MMC. Therefore, before validating the stability impact of the optimized strategy, an assessment of the short-circuit current margin under this scheme must be conducted.
To demonstrate the application of the proposed framework, a case study is conducted on a representative system with 2500 MW MMC injection in PSS/E. It should be emphasized that the system serves as an illustrative example; the framework itself is applicable to systems with varying scales and characteristics.
5.1 VSC-HVDC Short-Circuit Current Margin Assessment
A two-terminal power transfer interface was selected as shown in Fig. 5, where Buses 1–7 are all 525 kV buses. A 2500 MW power injection was added via an MMC near Bus 1. Short-circuit currents before and after VSC-HVDC integration were calculated separately. The post-integration LVRT strategy adopted specified current percentage control, with active current output percentages GLVPT set to 0, 0.3, and 0.9. The remaining capacity was entirely utilized for reactive current injection.
The short-circuit current calculations for different LVRT strategies are presented in Table 3. The observed variation can be attributed to the distinct composition of the current injected by the VSC-HVDC during faults and the network impedance characteristics.
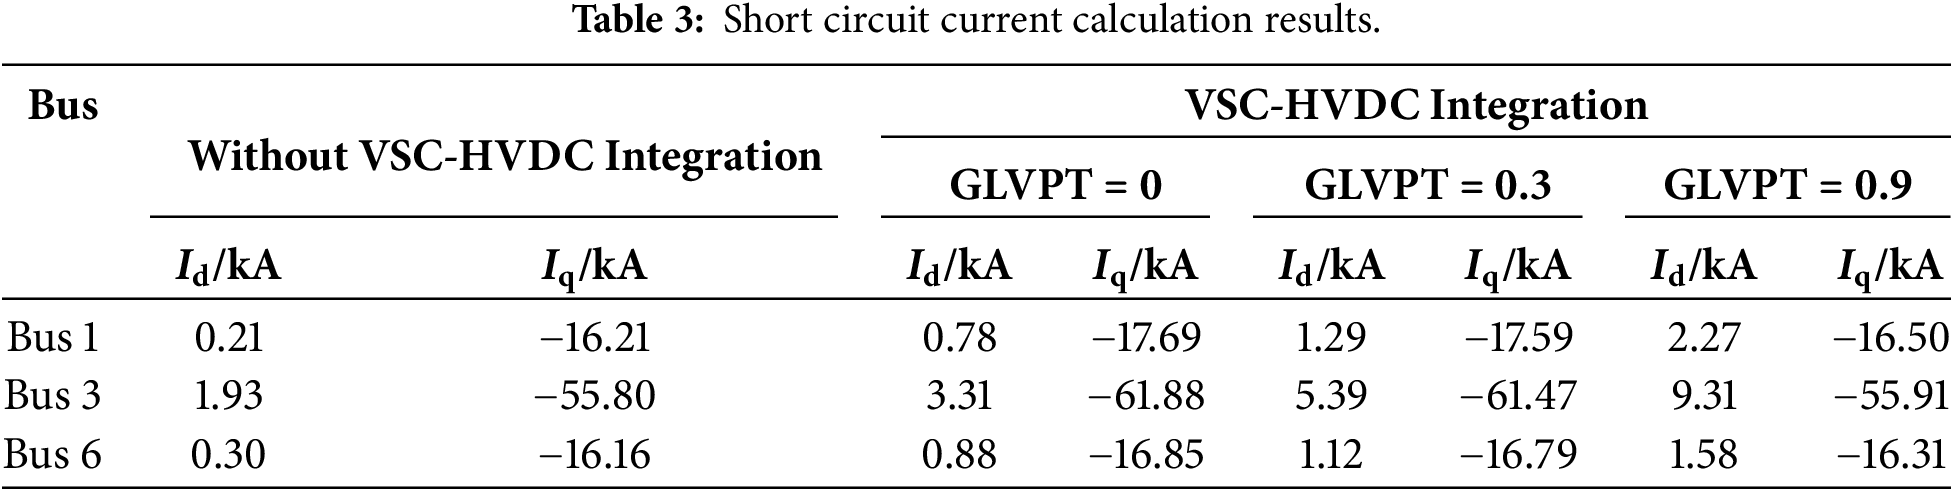
As the proportion of active current (Id) increases in the LVRT strategy, the active component of the short-circuit current rises correspondingly, while the reactive component (Iq) diminishes. This phenomenon is primarily due to the high X/R ratio of the transmission lines, which is a defining feature of high-voltage power systems. In such systems, the short-circuit current contributed by traditional synchronous generators is predominantly reactive. Consequently, the VSC-HVDC, when operating as a controlled current source during LVRT, directly influences the total short-circuit current profile. A reduction in the reactive current injected by the VSC-HVDC leads to a decrease in the overall reactive component of the system’s short-circuit current.
This analysis demonstrates that the LVRT strategy is not only crucial for converter security but also acts as a key factor in determining the system’s short-circuit current level, which has significant implications for protection coordination. The interrupting capacity of the 525 kV circuit breaker is 63 kA. All calculated results in the table satisfy the short-circuit current margin requirements.
5.2 Validation of VSC-HVDC LVRT Parameter Optimization
5.2.1 Baseline Case: Performance and Limitations of Existing Strategies
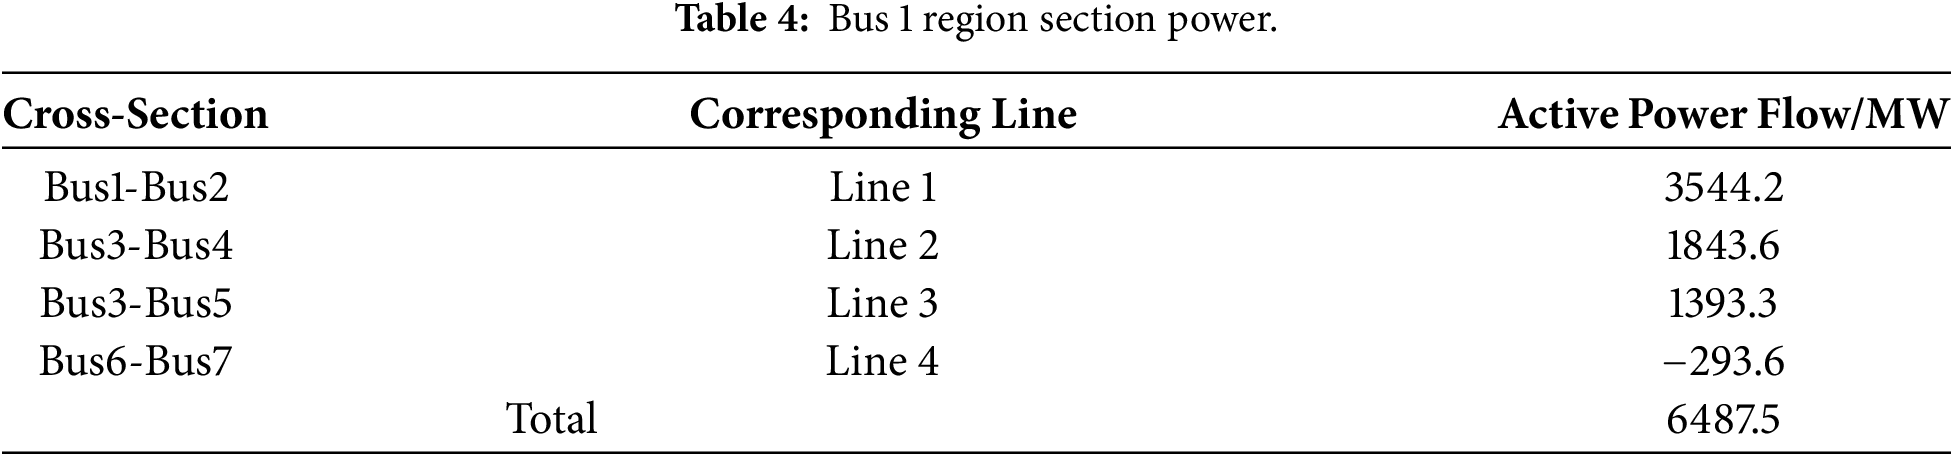
Under the scenario described in the previous section, the power flow of the sectional interface in the Bus 1 area is presented in Table 4.
Prior to the optimization of the LVRT parameters, the LVRT strategy presented in Table 1 is employed. The MMC enters LVRT mode when the bus voltage drops below 0.9 pu. During LVRT, it maintains 100% active current and restores power at maximum speed once the bus voltage recovers above 0.9 pu. Under this configuration, Line 1 experiences system instability during an N-2 contingency, with simulation results depicted in Fig. 6. The waveform in Fig. 6 indicates that the system voltage becomes transiently unstable under the initial LVRT strategy, necessitating strategy optimization to enhance voltage stability.
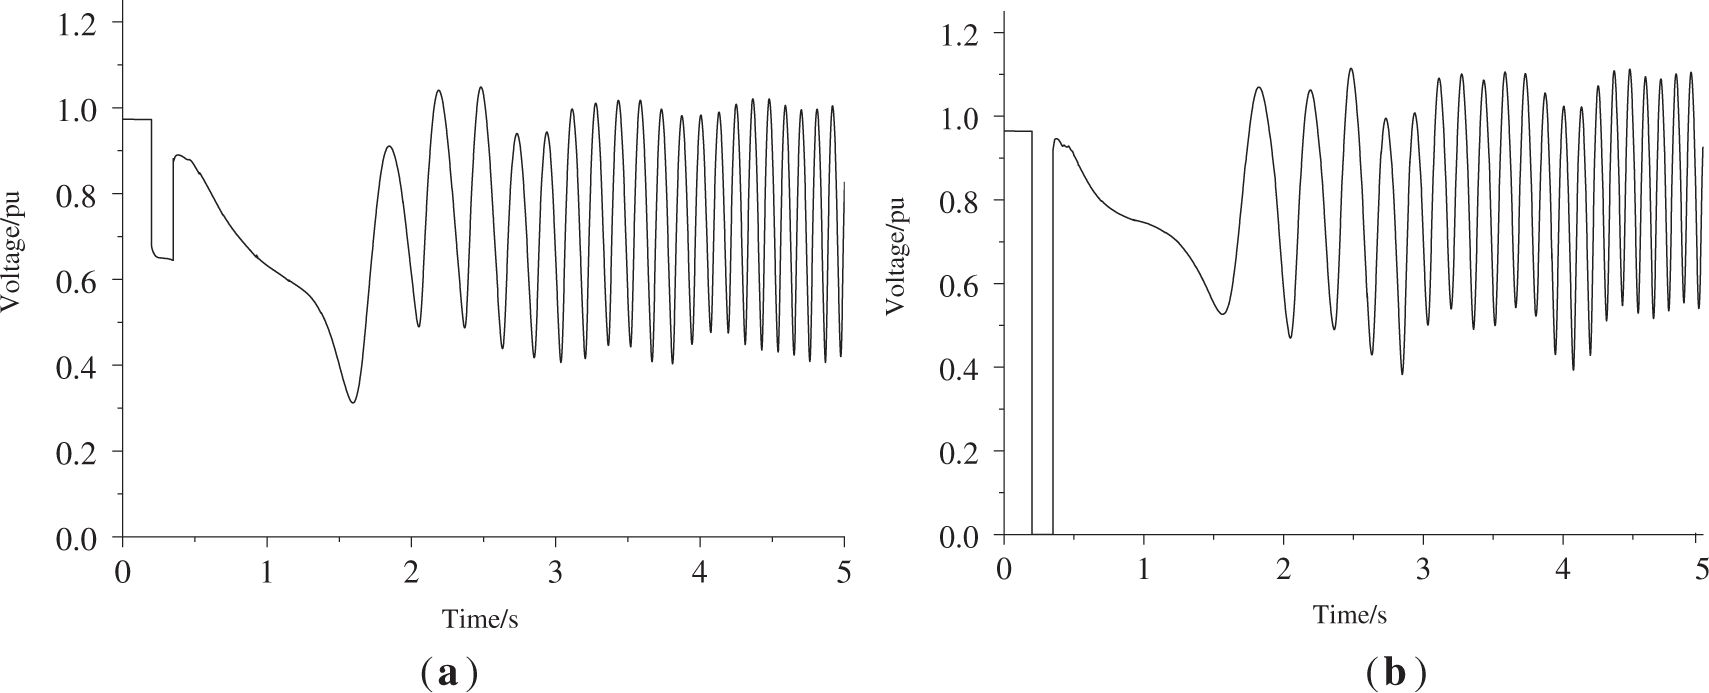
Figure 6: Bus voltage waveforms of line 1 under N-2 contingency before MMC LVRT parameter optimization. (a) Voltage waveform at Bus 1; (b) voltage waveform at Bus 3.
This case study demonstrates that while the initial LVRT strategy employs a 100% active power ratio to minimize active power loss during LVRT, the simulation results reveal subsequent voltage instability, necessitating coordinated multi-objective optimization.
5.2.2 Effectiveness of the Proposed Strategy and Mechanism Validation
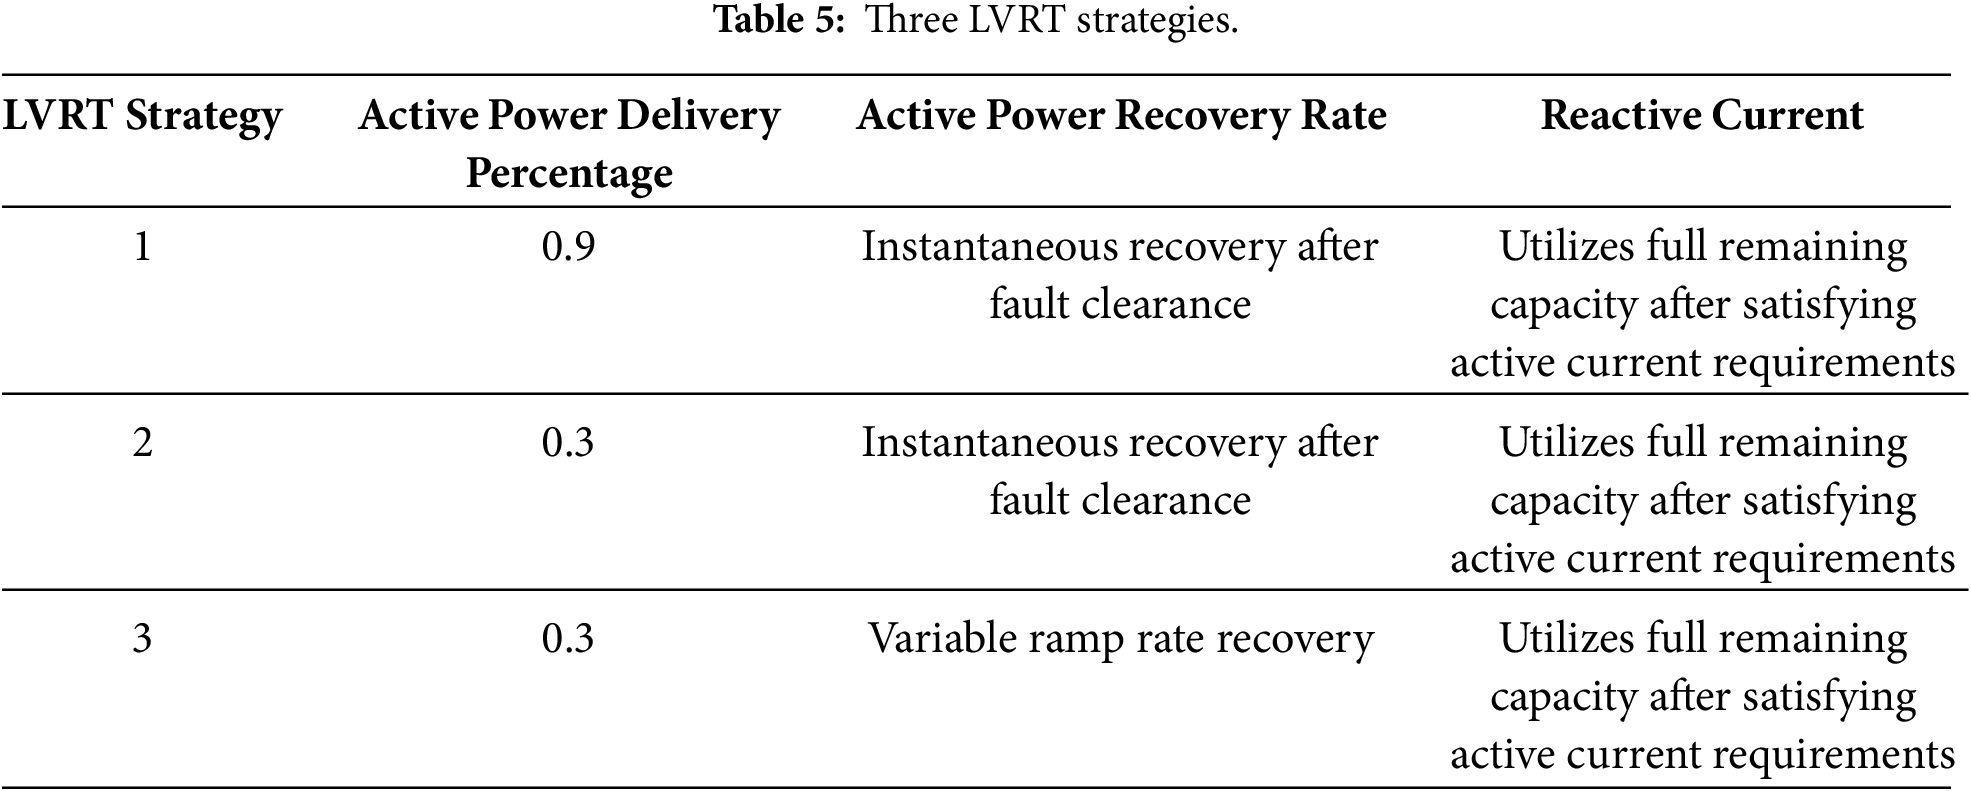
To demonstrate the feasibility of the optimization method proposed in this paper, the following three LVRT strategies are introduced, as summarized in Table 5. To enhance voltage stability, the optimization approach of the three proposed strategies involves reducing the active power ratio during the LVRT (Low Voltage Ride-Through) period and modifying the active power recovery rate. Strategy 1 reduces the active power delivery percentage to 0.9 based on the original typical control strategy. Strategy 2 further decreases the active power delivery percentage during the LVRT period to 0.3. The comparison between Strategy 1 and Strategy 2 primarily serves to illustrate the effect of optimizing the active power delivery percentage during the LVRT process. Strategy 3, building upon Strategy 2, incorporates an optimized active power recovery rate. The contrast between Strategy 2 and Strategy 3 is aimed at demonstrating the role of variable-rate recovery.
Subsequently, the same fault simulation analysis was conducted, and the voltage waveforms of Bus 1 and Bus 3 are shown in Fig. 7.
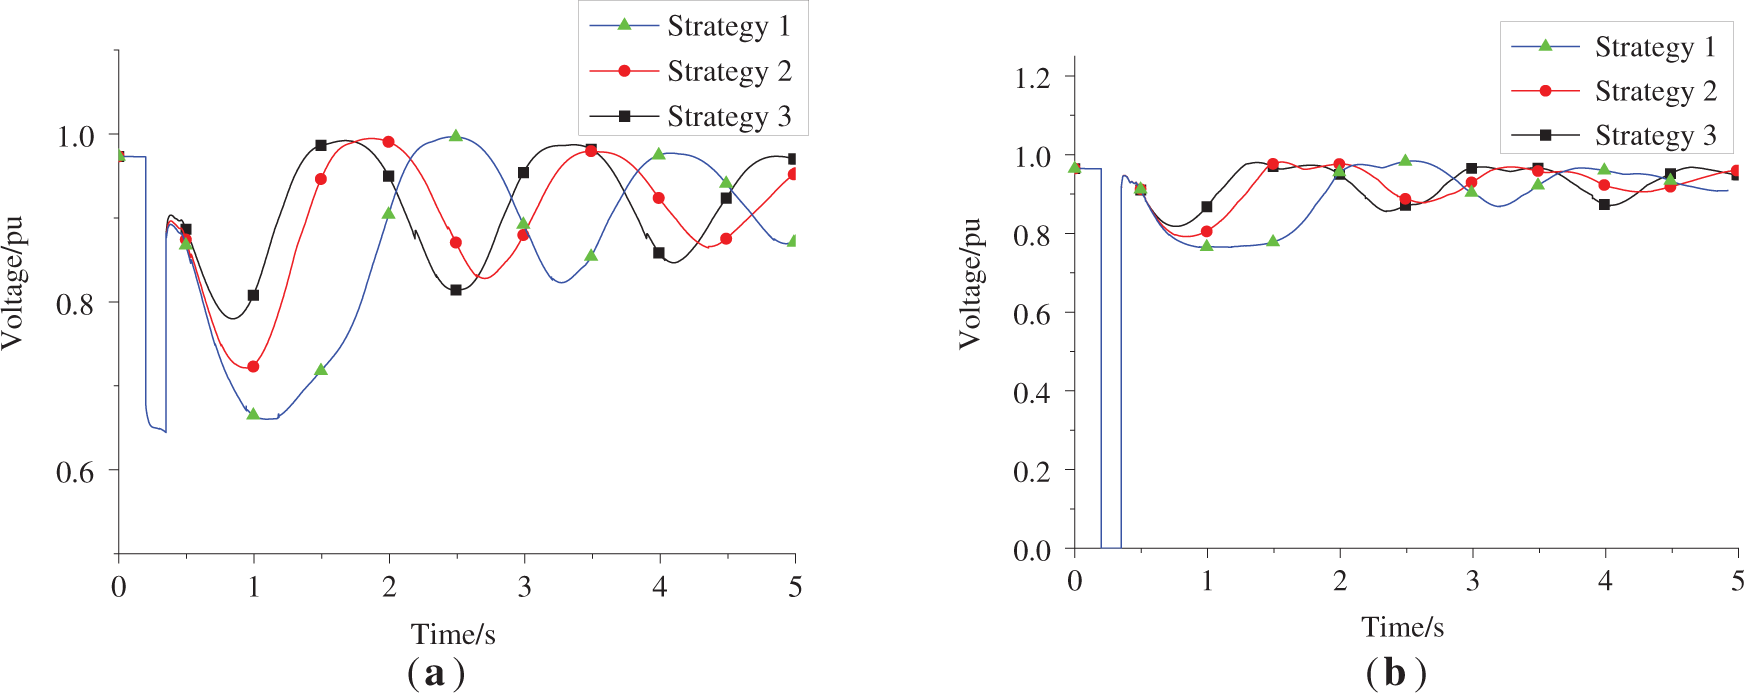
Figure 7: Bus voltage waveforms of line 1 under N-2 contingency after MMC LVRT parameter optimization. (a) Voltage waveform at Bus 1; (b) voltage waveform at Bus 3.
As observed from Fig. 7, the implementation of modified control strategies leads to significant enhancement in system voltage stability relative to the performance depicted in Fig. 6. As observed from the aforementioned waveforms, under different strategies, as the active power percentage decreases during the LVRT period, the voltage amplitudes at Bus 1 and Bus 3 reduce.
The rotor speed waveform of the local generating units at Bus 1 is presented below, as shown in Fig. 8. It can be observed from Fig. 8 that as the active power ratio of the MMC during the LVRT period decreases, the deceleration area of the synchronous machine increases, leading to improved synchronous stability. A higher active power ratio during the MMC’s LVRT period is detrimental to the power angle stability of the system.
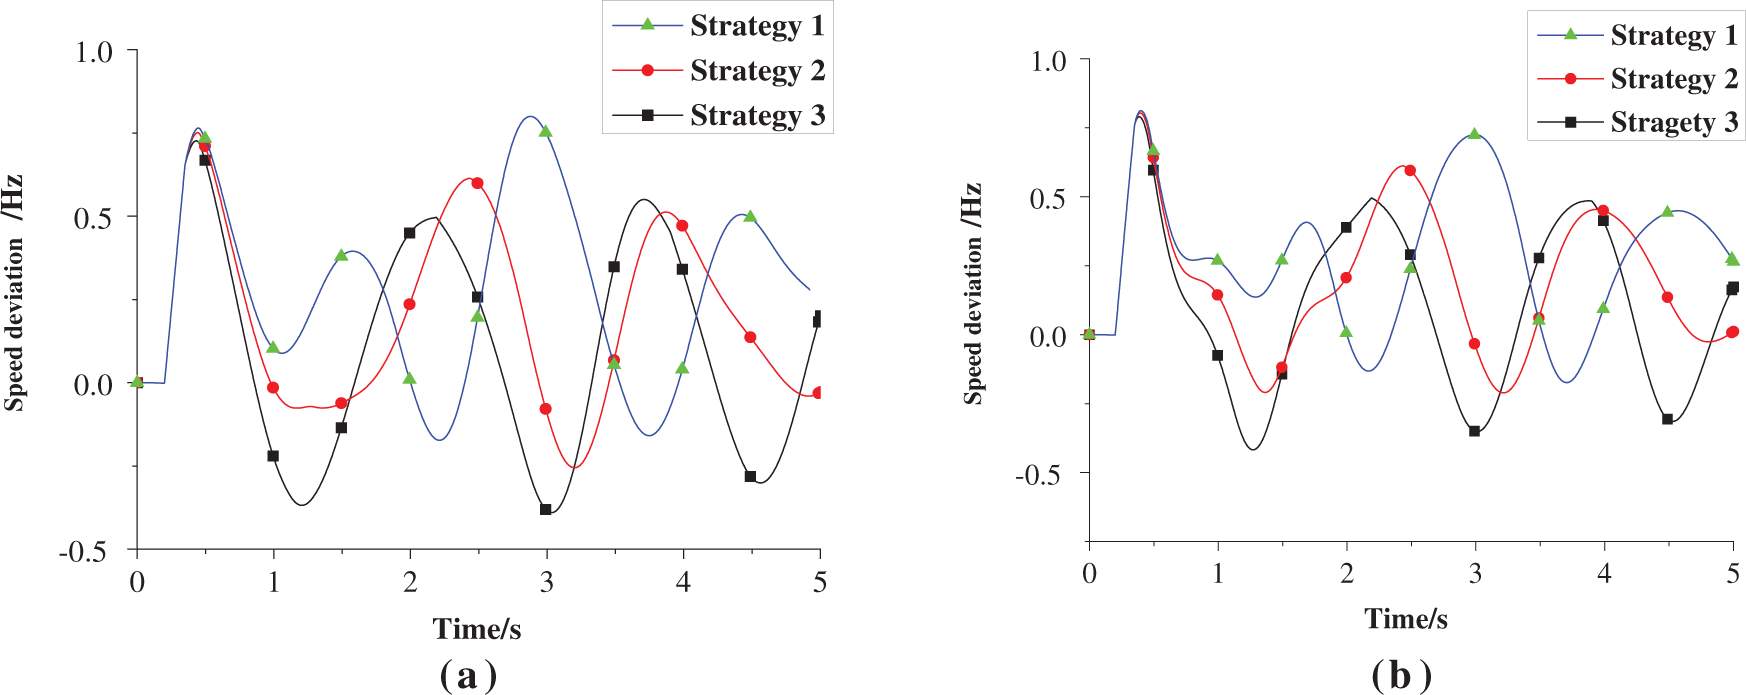
Figure 8: Rotor speed waveforms of units 1 and 2 in line 1 under N-2 contingency after MMC LVRT parameter optimization. (a) Rotor speed waveforms of units 1; (b) Rotor speed waveforms of units 2.
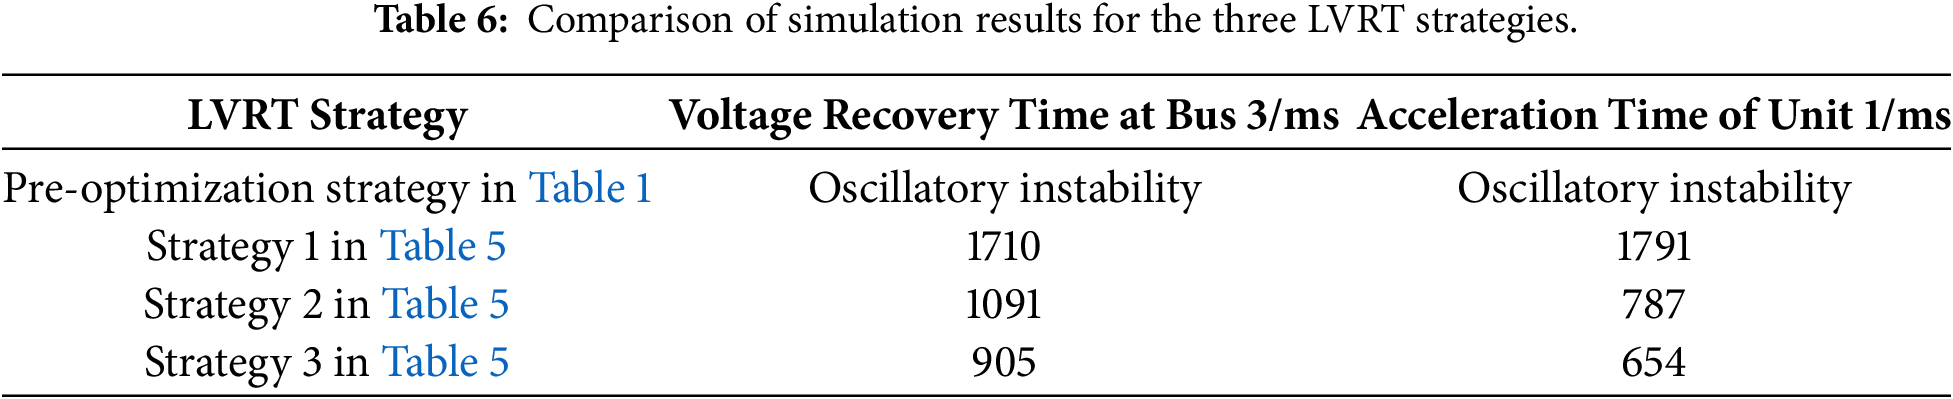
The simulation results presented above demonstrate that the proposed optimization strategy (Strategy 3) effectively enhances system stability during LVRT. The key distinction between the proposed method and conventional optimizations (Strategies 1 & 2) lies in the fundamental optimization objective. While conventional strategies primarily focus on a single objective—sacrificing active power for reactive support to improve voltage recovery—the proposed method introduces a systematic, multi-stability cooperative framework. This framework explicitly coordinates the requirements for voltage, frequency, and synchronization stability. The quantitative comparison in Table 6 conclusively validates the superiority of this holistic approach: the proposed strategy achieves the shortest voltage recovery time (905 ms) and the best synchronization stability (acceleration time of 654 ms) among all compared methods, demonstrating its ability to provide a more balanced and robust solution than the single-dimensional optimizations.
5.2.3 Multi-Objective Coordination Analysis and Strategy Feasibility Verification
However, reducing the active power ratio may adversely affect system frequency stability. This subsection aims to evaluate the potential risks that radical measures (such as setting the active power to 0) taken for voltage stability enhancement pose to frequency stability, and ultimately demonstrate the overall feasibility and safety margin of the proposed strategy in achieving multi-objective coordinated optimization. A detailed analysis is presented below.
As observed from the rotational speed waveforms of Unit 1 and Unit 2 in Fig. 8, the maximum frequency deviation caused by the short-circuit fault has exceeded 0.5 Hz. Since the LVRT behavior of the MMC introduces a local frequency issue on the timescale of power angle oscillations, it temporally coincides with frequency variations resulting from short-circuit faults or voltage dips. Moreover, the MMC’s LVRT does not cause a permanent power deficit, and the system frequency can return to its rated value without any intervention. During this stage, there are typically no strict requirements regarding frequency range. Generally, conventional generating units will not disconnect from the grid as long as the frequency remains above 47 Hz, while MMCs will not disconnect as long as the frequency remains above 49 Hz. As long as these thresholds are ensured, short-term excessive or insufficient frequency in individual units or local areas during the power angle oscillation stage is acceptable.
Therefore, it is necessary to verify whether generating units will disconnect from the grid under the maximum power deficit scenario caused during the LVRT period.
When the active power ratio of the MMC during LVRT is set to 0, the variations in bus voltage, generator power angle, and rotational speed resulting from an N-2 contingency on Line 1 are shown in Fig. 9. As can be observed from the figure, with the MMC’s active power ratio set to 0 during LVRT, the system’s recovery characteristics after the N-2 contingency on Line 1 are significantly improved. During the recovery process, the voltage magnitudes at Bus 1 and Bus 2 do not fall below 0.8 pu, and the generating units do not disconnect from the grid. The results indicate that even when the MMC utilizes its full capacity for reactive power injection during the LVRT period, no generator tripping occurs due to frequency limit violations. Therefore, the MMC can safely allocate more capacity to reactive power support.
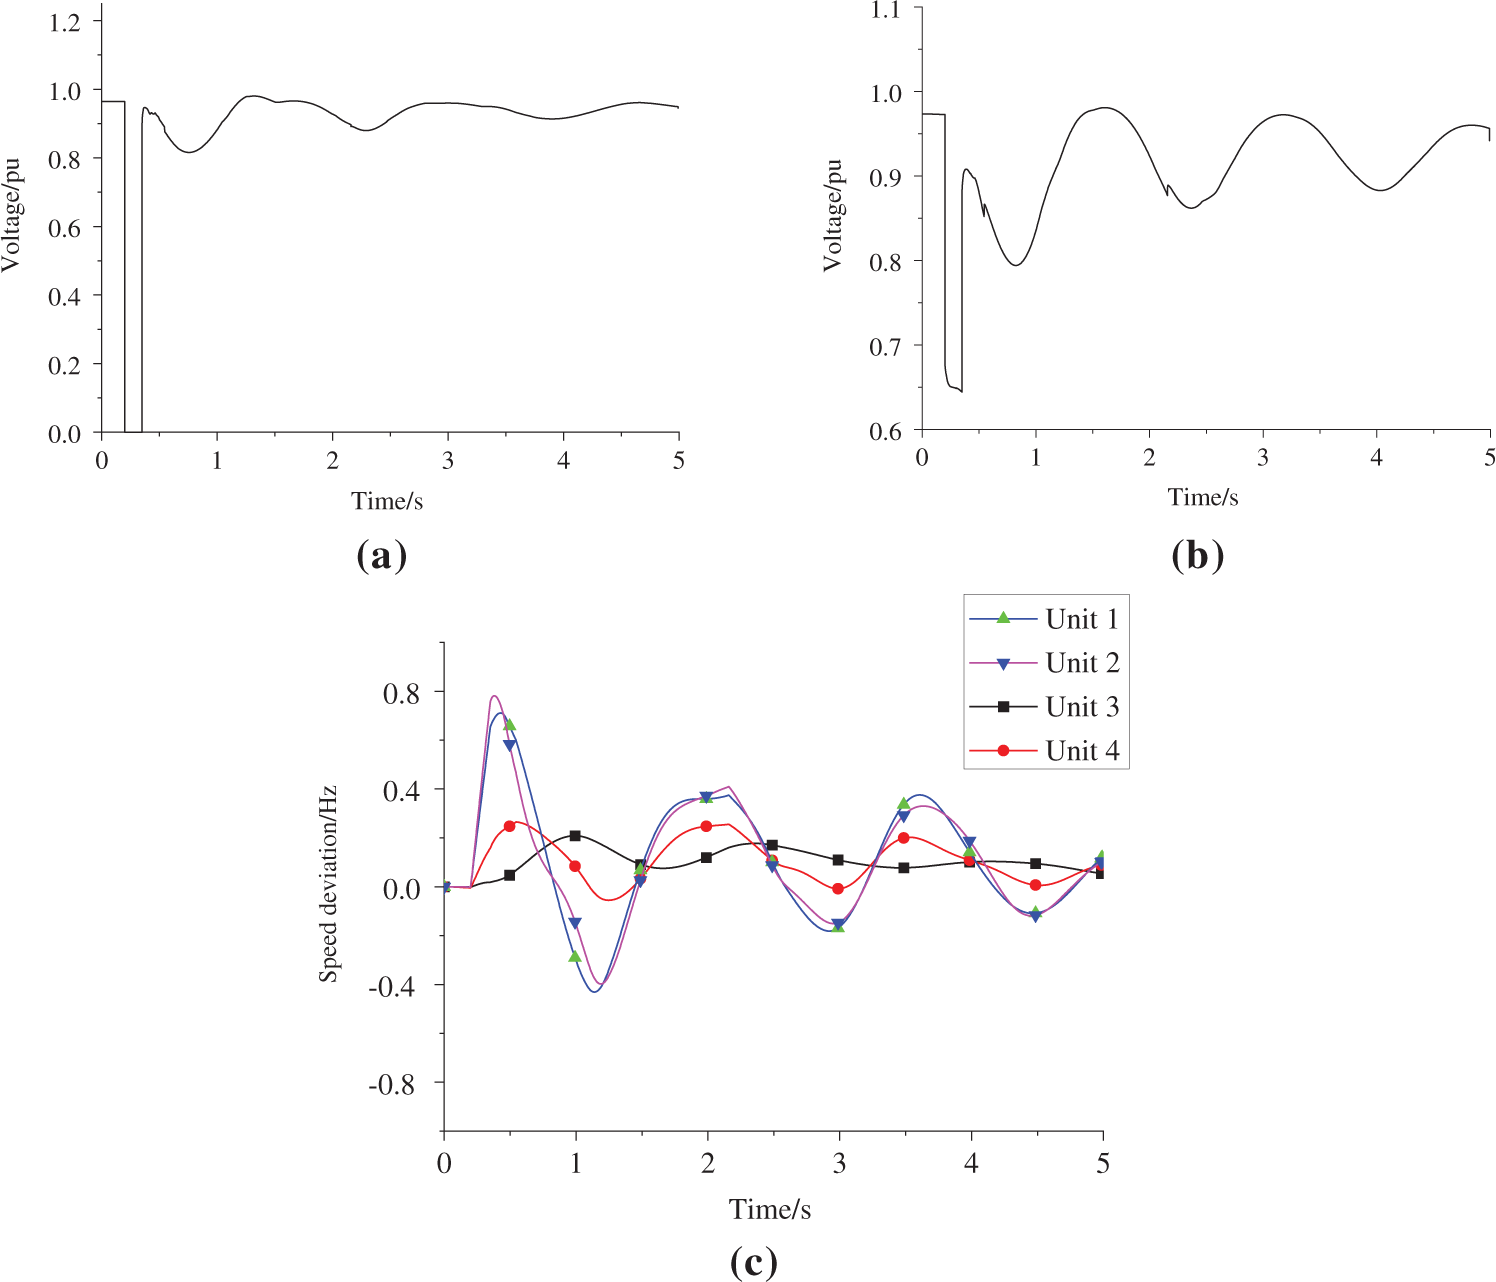
Figure 9: Simulation waveforms of line 1 under N-2 contingency when MMC LVRT active power ratio is 0. (a) Voltage waveform at Bus 1; (b) voltage waveform at Bus 2; (c) rotor speed waveforms of partial unit.
To validate the applicability of setting the LVRT active power percentage to 0% under other operating conditions, the scenario of an N-2 contingency on Line 1 occurring during the N-1 maintenance outage on Line 3 is considered. The simulation results f this case are presented in Fig. 10.
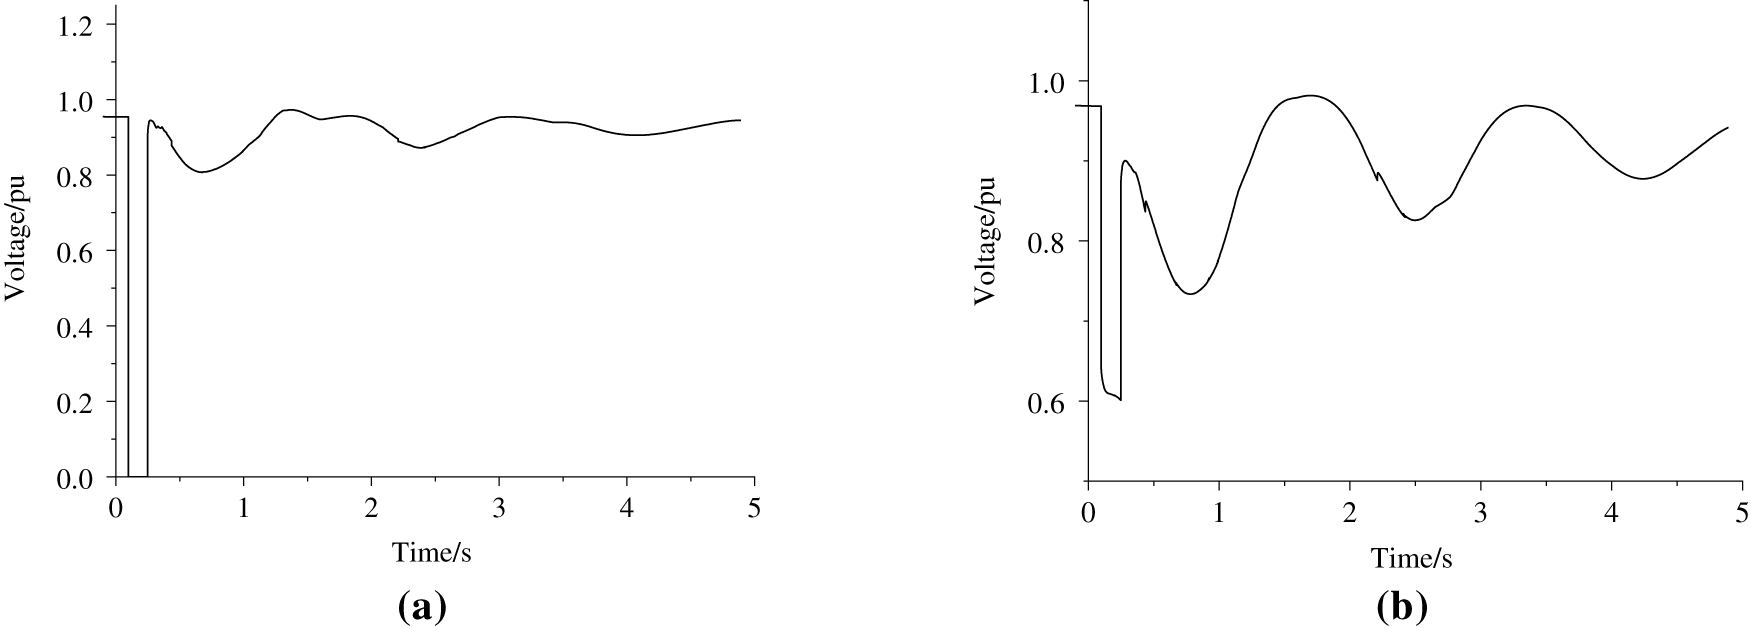
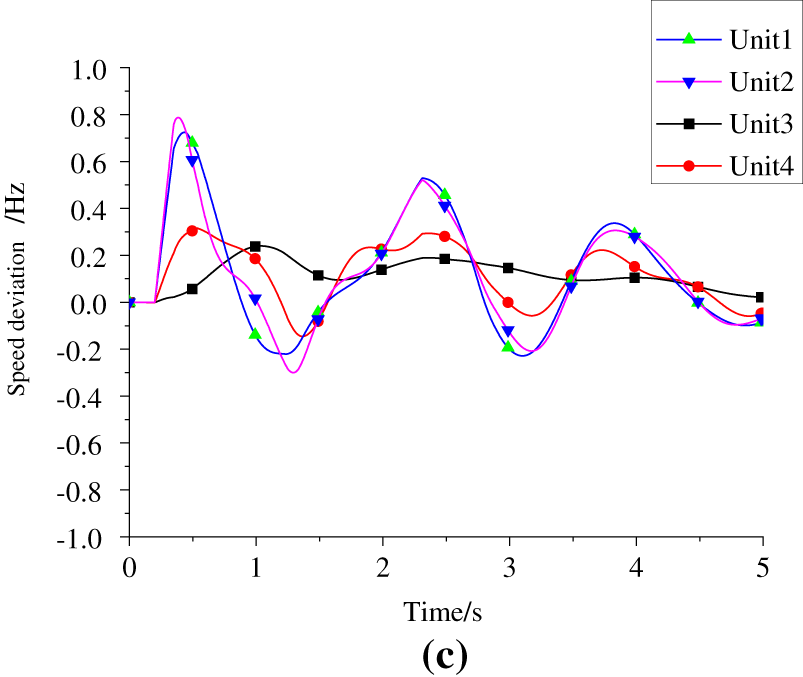
Figure 10: Simulation waveforms of Bus 1 under N-2 contingency during N-1 maintenance on Bus 3. (a) Voltage waveform at Bus 1; (b) voltage waveform at Bus 3; (c) rotor speed waveforms of partial unit.
As evident from the waveforms above, with the MMC maintaining zero active power output during the LVRT period, both under the fully connected topology and the N-1 maintenance outage condition on Line 3, the voltage and power-angle recovery characteristics of the system are significantly improved. The lowest generator rotational speed observed is approximately 49.5 Hz. However, this speed deviation occurs only locally within the vicinity of Bus 1 and Bus 3 and solely during the power-angle swing stage. Crucially, since the MMC power recovers subsequently, this event does not cause a permanent power deficit. Consequently, the system frequency naturally returns to its nominal value without requiring any corrective measures. Therefore, this optimization approach for MMC LVRT parameters is feasible.
In the case study in Section 5.1, since reactive current is the determining factor for the system short-circuit current, the short-circuit current of the strategies to be validated subsequently is first calculated to check whether the three strategies satisfy the short-circuit current constraints. Only after the constraints are satisfied can the subsequent validation proceed.
The simulation studies in this chapter first, through the cases in Sections 5.2.1 and 5.2.2, validate the coupling impact mechanism of active/reactive current on multiple stability aspects as revealed in Contribution 1. Furthermore, through the case in Section 5.2.3 and the overall strategy comparison, it is demonstrated that the comprehensively optimized strategy proposed in Contribution 2 can effectively perform dynamic trade-offs under practical system constraints, ensuring overall system stability, thereby overcoming the limitations of single-objective optimization.
This study addressed the optimization of VSC-HVDC LVRT strategies in complex power systems by introducing a generalizable framework for multi-stability cooperative optimization. The primary conclusions are:
(1) The VSC-HVDC’s short-circuit current contribution is predominantly reactive.
(2) During LVRT, a lower active power ratio benefits voltage and synchronous stability but is detrimental to frequency stability.
(3) Enhancing synchronous stability is achievable by reducing the active current ratio and adopting a variable-rate recovery strategy to mitigate the active power deficit in the power-angle swing stage.
The key contribution is a systematic framework that models LVRT coupling effects and enables the derivation of parameters that balance multiple stability objectives, contrasting with conventional single-dimensional approaches.
Nevertheless, this study has certain limitations that warrant further exploration in future work. Firstly, the validation in this study is based on a representative system with a 2500 MW MMC. Although this case is representative, the generalizability of its conclusions to power grids with different scales, network structures, and short-circuit capacity levels requires further verification. This is attributed to the significant influence of different system impedance characteristics and inertia distributions on the transient response. Secondly, the validation in this paper primarily focuses on three-phase symmetric faults; for asymmetric fault scenarios, the proposed coordinated LVRT optimization strategy may require additional considerations, such as negative-sequence current control. Furthermore, the specific simplifications adopted in the models for loads and renewable energy units might also influence the realism of the simulation results.
Based on the aforementioned limitations, future research will primarily include: First, validating the universality of the proposed optimization framework in more diverse standard test systems and actual large-scale power grids. Second, investigating more complex device models and load models to further enhance the authenticity of the simulation results and assess their impact on the optimization strategy. Third, extending the research to more complex fault scenarios such as asymmetric faults to refine the applicable boundaries of this coordinated optimization framework.
Acknowledgement: Not applicable.
Funding Statement: This research was funded by State Grid Corporation of China, grant number DQ30DK24001L.
Author Contributions: The authors confirm contribution to the paper as follows: Conceptualization, Zimin Zhu; methodology, Yu Duan; software, Jian Ma; validation, Xiaoyun Wang, Xiaoyu Deng and Xiaofang Wu. All authors reviewed and approved the final version of the manuscript.
Availability of Data and Materials: The authors confirm that the data supporting the findings of this study are available within the article.
Ethics Approval: Not applicable.
Conflicts of Interest: The authors declare no conflicts of interest.
References
1. Xiao H, Gan H, Yang P, Li L, Li D, Hao Q, et al. Robust submodule fault management in modular multilevel converters with nearest level modulation for uninterrupted power transmission. IEEE Trans Power Deliv. 2024;39(2):931–46. doi:10.1109/TPWRD.2024.10363663. [Google Scholar] [CrossRef]
2. Huang Y, Zhang J, Wang G, Xu Z. Transient stability analysis and improvement of isolated renewable energy bases with VSC-DC transmission. CSEE J Power Energy Syst. 2025:1–11. doi:10.17775/CSEEJPES.2024.02140. [Google Scholar] [CrossRef]
3. Ali JS, Qiblawey Y, Alassi A, Massoud AM, Muyeen SM, Abu-Rub H. Power system stability with high penetration of renewable energy sources: challenges, assessment, and mitigation strategies. IEEE Access. 2025;13:39912–34. doi:10.1109/ACCESS.2025.3546491. [Google Scholar] [CrossRef]
4. Zhang L, Li S, Xu S, Zhou X, Li S, Huang X, et al. LVRT control strategy for VSC-HVDC converter integrated with renewable energy collection system. In: Proceedings of the 2025 IEEE 3rd International Conference on Power Science and Technology (ICPST); 2025 May 16–18; Kunming, China. Piscataway, NJ, USA: IEEE; 2025. p. 1610–5. doi:10.1109/ICPST65050.2025.11088598. [Google Scholar] [CrossRef]
5. Liu Y, Huang M, Zha X, Lu HHC. Short-circuit current estimation of modular multilevel converter using discrete-time modeling. IEEE Trans Power Electron. 2019;34(1):40–5. doi:10.1109/TPEL.2018.2840100. [Google Scholar] [CrossRef]
6. Yang J, Mao S, Li X, Xu Z. Influence mechanism and suppression control of the MMC on short-circuit current under AC faults. IEEE Access. 2020;8:138307–17. doi:10.1109/ACCESS.2020.3012149. [Google Scholar] [CrossRef]
7. Li Y, Li YQ, Qin S, Sun Y. Study on the effect of VSC-HVDC on converter output short circuit current level. J Glob Energy Interconnect. 2019;2(6):581–8. (In Chinese). doi:10.19705/j.cnki.issn2096-5125.2019.06.008. [Google Scholar] [CrossRef]
8. Yi Y, Shen Y, Li ZL. Characteristics and analysis methods of AC short-circuit current contributed by VSC-HVDC. High Volt Eng. 2018;44(7):2150–8. (In Chinese). doi:10.13336/j.1003-6520.hve.20180628006. [Google Scholar] [CrossRef]
9. Bu G, Li Y, Wang S, Zhao B, Wang T, Yang Y. Analysis of the short-circuit current of MMC-HVDC. Proc CSEE. 2017;37(21):6303–12. (In Chinese). doi:10.13334/j.0258-8013.pcsee.170037. [Google Scholar] [CrossRef]
10. Liu X, Xu Z, Wang G, Li X. Accurate estimation on AC short-circuit current for grid-connected MMC-HVDC system considering FRT and various control modes. Int J Electr Power Energy Syst. 2022;136(3):107683. doi:10.1016/j.ijepes.2021.107683. [Google Scholar] [CrossRef]
11. Chen Y, Li C, Li Y, Guo X, Wang Y, Zhang Y, et al. Short-circuit current characteristics analysis and calculation methods of modular multilevel converter in double closed-loop voltage-frequency control. Electr Power Constr. 2024;45(10):90–9. (In Chinese). doi:10.12204/j.issn.1000-7229.2024.10.009. [Google Scholar] [CrossRef]
12. Sun R, Ma J, Yang W, Wang S, Liu T. Transient synchronization stability control for LVRT with power angle estimation. IEEE Trans Power Electron. 2021;36(10):10981–5. doi:10.1109/TPEL.2021.3070380. [Google Scholar] [CrossRef]
13. Vittle E, O’Malley M, Keane A. Rotor angle stability with high penetrations of wind generation. IEEE Trans Power Syst. 2012;27(1):353–62. doi:10.1109/TPWRS.2011.2161097. [Google Scholar] [CrossRef]
14. Munkhchuluun E, Meegahapola L, Vahidnia A. Impact of active power recovery rate of DFIG wind farms on first swing rotor angle stability. IET Gener Transm Distrib. 2020;14(25):6041–8. doi:10.1049/iet-gtd.2020.1072. [Google Scholar] [CrossRef]
15. Hu Q, Fu L, Ma F, Wang G, Liu C, Ma Y. Impact of LVRT control on transient synchronizing stability of PLL-based wind turbine converter connected to high impedance AC grid. IEEE Trans Power Syst. 2023;38(6):5445–58. doi:10.1109/TPWRS.2022.3223675. [Google Scholar] [CrossRef]
16. Kawabe K, Tanaka K. Impact of dynamic behavior of photovoltaic power generation systems on short-term voltage stability. In: Proceedings of the 2016 IEEE Power and Energy Society General Meeting (PESGM); 2016 Jul 17–21; Boston, MA, USA. Piscataway, NJ, USA: IEEE; 2016. p. 1. doi:10.1109/PESGM.2016.7741134. [Google Scholar] [CrossRef]
17. Lammert G, Premm D, Ospina LDP, Boemer JC, Braun M, Van Cutsem T. Control of photovoltaic systems for enhanced short-term voltage stability and recovery. IEEE Trans Energy Convers. 2019;34(1):243–54. doi:10.1109/TEC.2018.2875303. [Google Scholar] [CrossRef]
18. Weise B. Impact of K-factor and active current reduction during fault-ride-through of generating units connected via voltage-sourced converters on power system stability. IET Renew Power Gener. 2015;9(1):25–36. doi:10.1049/iet-rpg.2014.0116. [Google Scholar] [CrossRef]
19. Rather ZH, Flynn D. Impact of voltage dip induced delayed active power recovery on wind integrated power systems. Control Eng Pract. 2017;61(4):124–33. doi:10.1016/j.conengprac.2017.01.003. [Google Scholar] [CrossRef]
20. Qazi HW, Wall P, Val Escudero M, Carville C, Cunniffe N, O’Sullivan J. Impacts of fault ride through behavior of wind farms on a low inertia system. IEEE Trans Power Syst. 2022;37(4):3190–8. doi:10.1109/TPWRS.2020.3003470. [Google Scholar] [CrossRef]
21. Ömer B, Mehmet B, Mustafa I. Design and analysis of bidirectional cascaded buck-boost converter with average current mode control for vehicle-to-vehicle (V2V) charging. In: Proceedings of the 2025 19th Conference on Electrical Machines, Drives and Power Systems (ELMA); 2025 Jun 19–21; Sofia, Bulgaria. p. 1–6. doi:10.1109/ELMA65795.2025.11083430. [Google Scholar] [CrossRef]
22. Mustafa I, Necdet S. A novel predictive current sliding mode control for improving the performance efficiency of fuel cell vehicle-to-load (V2L) system with boost converter. Int J Hydrogen Energy. 2025;138(4):973–84. doi:10.1016/j.ijhydene.2025.05.203. [Google Scholar] [CrossRef]
23. GB/T 19963.1-2021. Technical specification for connecting wind farm to power system. Part 1: on shore wind power. Beijing, China: Standards Press of China; 2021. [Google Scholar]
24. Mei H, Jia C, Fu J, Luan X. Low voltage ride through control strategy for MMC photovoltaic system based on model predictive control. Int J Electr Power Energy Syst. 2021;125(1):106530. doi:10.1016/j.ijepes.2020.106530. [Google Scholar] [CrossRef]
25. Wu L, Zhao W, Xu M, Xu P, Li F, Yang Y, et al. Mechanism analysis and suppression of repeated voltage fluctuation considering fault ride through characteristics of the wind turbine. J Glob Energy Interconnect. 2022;5(3):290–7. (In Chinese). doi:10.19705/j.cnki.issn2096-5125.2022.03.011. [Google Scholar] [CrossRef]
26. Zhang W, Xu S, Qi W, Peng Z, Sun W. Impact of short-term power shortage from low voltage ride through and DC commutation failure on power grid frequency stability. Energy Eng. 2025;122(6):2371–87. doi:10.32604/ee.2025.064160. [Google Scholar] [CrossRef]
27. Li X, Tian Z, Zha Z, Sun P, Hu P, Huang M. Nonlinear modeling and stability analysis of grid-tied paralleled-converters systems based on the proposed dual-iterative equal area criterion. IEEE Trans Power Electron. 2023;38(6):7746–59. doi:10.1109/TPEL.2023.3246763. [Google Scholar] [CrossRef]
Cite This Article
 Copyright © 2026 The Author(s). Published by Tech Science Press.
This work is licensed under a Creative Commons Attribution 4.0 International License , which permits unrestricted use, distribution, and reproduction in any medium, provided the original work is properly cited.
 Downloads
 Citation Tools