
 Submit a Paper
 Propose a Special lssue
 Open Access
ARTICLE

Researches on Low-Carbon Development Pathways for Provincial Power Systems from the Perspective of Carbon Emission Factor
1 Guangdong Power Grid Co., Ltd., Guangzhou, 510000, China
2 Sichuan Energy Internet Research Institute, Tsinghua University, Chengdu, 610218, China
* Corresponding Author: Yi Lei. Email:
Energy Engineering 2026, 123(4), 17 https://doi.org/10.32604/ee.2025.072189
Received 21 August 2025; Accepted 10 October 2025; Issue published 27 March 2026
 View Full Text
 Download PDF
Abstract
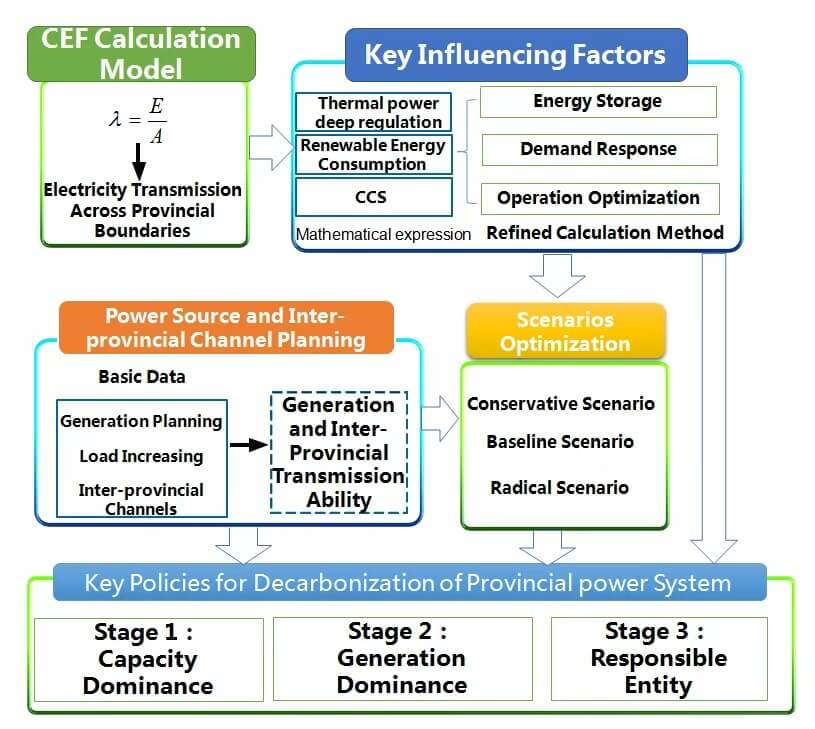
This paper develops an innovative computational model for assessing the Carbon Emission Factor (CEF) of provincial power systems that incorporates inter-provincial electricity transfers and hybrid generation portfolios combining conventional and renewable sources. A key contribution lies in evaluating how deep regulation of thermal power plants influence the carbon intensity of coal-fired generation and coal-fired generation together with high penetration renewables. Furthermore, the study quantitatively analyzes the role of renewable energy consumption and the prospective application of Carbon Capture and Storage (CCS) in reducing system-wide CEF. Based on this framework, the paper proposes phased carbon emission targets for Guangdong’s power system for key milestone years (2030, 2045, 2060), along with targeted implementation strategies. Results demonstrate that in renewable-dominant systems, deep regulation of thermal units, load peak-shaving, and deployment of flexible resources such as energy storage are effective in cutting carbon intensity. To achieve the defined targets—0.367 kg/kWh by 2030, 0.231 kg/kWh by 2045, and 0.032 kg/kWh by 2060—the following innovation-focused policy is recommended: in early stage, mainly on expansion of renewable capacity and inter-provincial transmission infrastructure along with energy storage deployment; in mid-term, mainly on enhancement of electricity market mechanisms to promote green power trading and demand-side flexibility; and in late-stage, mainly on systematic retirement of conventional coal assets coupled with large-scale CCS adoption and carbon sink mechanisms.Graphic Abstract
Keywords
The global imperative to mitigate climate change necessitates a fundamental transformation of energy systems, with the power sector standing out as a primary contributor to anthropogenic carbon dioxide (CO2) emissions, particularly in countries heavily reliant on fossil fuels like China [1]. Achieving ambitious carbon peak and neutrality goals requires a comprehensive strategy focused on decarbonizing electricity generation and consumption [2]. Within this context, the concept of the Carbon Emission Factor of the power system emerges as a crucial metric for assessing the carbon intensity of electricity supply and guiding low-carbon development efforts [3]. This factor, representing the amount of CO2 emitted per unit of electricity generated or consumed, provides a quantitative basis for evaluating the effectiveness of various decarbonization pathways and informing policy decisions at regional and provincial levels [4,5]. As power systems transition towards a higher penetration of renewable energy sources, such as solar and wind power, understanding and managing the Carbon Emission Factor becomes increasingly complex due to the intermittent nature of these resources and the evolving operational characteristics of conventional generation assets [6,7].
The accurate calculation and analysis of carbon emissions are fundamental to understanding the current state and tracking progress towards low-carbon goals in power systems. A key metric in this regard is the power grid Carbon Emission Factor, which quantifies the CO2 intensity of electricity. Traditional approaches often rely on average emission factors based on the generation mix over a period, but the increasing complexity and variability of renewable energy power systems necessitate more refined methods [8]. New methods that can support policy and market mechanisms like carbon trading or power system planning are being quite necessary [9]. Further advancements in carbon emission analysis focus on capturing the dynamic and spatiotemporal characteristics of emissions within the grid. In [10], researchers propose an improved dynamic Carbon Emission Factor for distribution networks; similarly, the spatiotemporal variability of the provincial power grid Carbon Emission Factor is investigated, using Sichuan as a case study [3]. These studies underscore the limitations of static, system-wide average carbon factors in the context of highly variable renewable generation and emphasize the need for dynamic, location-specific metrics to effectively guide low-carbon operations and planning. While researcher findings on the modeling and analysis of carbon emission factors based on accurate descriptions of inter provincial electricity flow are still limited.
Beyond calculation methods, researchers have also analyzed the driving factors behind carbon emission changes in the power sector. The LMDI model is employed to analyze the drivers of carbon emission changes in China’s power industry from 2000 to 2018 [11]. Their findings indicate that economic output was the primary factor increasing emissions, while improvements in conversion efficiency and changes in the power structure (specifically, the increasing share of non-fossil fuels after 2013) played significant roles in restraining emissions. Researchers also use the generalized Divisia index method, incorporating energy consumption and CO2 emission factors as main drivers contributing to CO2 emissions in China, and finds that the digital economy’s carbon intensity has a negative contribution [12]. Furthermore, Carbon Emission Factors are integrated into predictive or planning models. A carbon emission flow (CEF) model in a multi-objective planning process is applied to calculate carbon emissions from the demand side, assessing the efficacy of low-carbon transition strategies [13]. A carbon emission flow model is also utilized to allocate overall carbon emission caps among district energy systems and coordinate planning levels [14], demonstrating how carbon factors can be operationalized within complex multi-energy system planning frameworks. In summary, research on Carbon Emission Factors spans calculation methodology, spatiotemporal analysis, integration into decomposition models for driver analysis, and application within planning and forecasting frameworks [15,16].
Achieving a low Carbon Emission Factor in provincial power systems necessitates a multi-pronged approach involving significant changes in generation mix, operational strategies, and technological adoption. The transition towards a renewable energy power system, characterized by a high penetration of variable renewable energy sources like wind and solar, is identified as the primary driver for reducing carbon intensity [17,18]. A central theme in this transition is the increasing penetration of renewable energy sources and the strategies required for their effective integration and absorption into the grid [19]. To accommodate high proportions of renewable energy, power systems must become more flexible [20]. This flexibility can be derived from various sources [21,22]. One critical source is the flexible operation of conventional thermal power plants, particularly coal-fired units, which traditionally operate in a baseload manner [23,24]. Researchers have examined hydrogen co-firing as a potential method to decarbonize fossil-based generators and provide flexibility [23]. Also the empirical evidence from China’s provinces is provided, showing that clean energy development significantly reduces CO2 emissions from thermal power, confirming the direct link between renewable deployment and decarbonization [24].
Beyond thermal flexibility, energy storage systems and demand-side flexibility are indispensable for managing the variability of renewable energy sources [25–27]. Ma and Hu include energy storage in a low-carbon economic scheduling model for an integrated energy system, demonstrating its role alongside demand response and hydrogen utilization in promoting wind power consumption and reducing costs and emissions [28]. Dang and Wang integrate comprehensive demand response models into their integrated energy system scheduling strategies, highlighting the role of flexible electric and thermal loads in enhancing system responsiveness and promoting clean energy consumption [29]. Electrical Vehicles charging [30], decarbonized routing and scheduling [31], as well as P2G [32], P2H [33], Integrated Energy Systems (IES) [14], and their combination [34], are also helpful for demand-side flexibility and renewable energy consumption so as to achieve a low-carbon power system. Meanwhile, Carbon Capture and Storage (CCS) technologies offer a means to significantly reduce emissions from fossil fuel-based generation [35,36]. CCS can facilitate a transition phase, although ensuring a low-carbon hydrogen supply is critical to avoid increasing emissions [37]. Hertwich et al. and Berrill et al. have investigated carbon capture and storage for fossil power generation in their LCA studies of long-term, wide-scale implementation of low-carbon technologies, confirming its contribution to reducing climate change impacts compared to unabated fossil generation [38,39]. These studies collectively emphasize that storage and demand-side management are vital complements to renewable generation, enabling higher penetration levels and contributing to a lower system Carbon Emission Factor by reducing the need for carbon-intensive backup generation. While CCS adds complexity and cost, it is recognized as a necessary technology for achieving deep decarbonization targets with 15–30 years [35,40]. However, there is still limited research on the comprehensive impact of deep regulation of fossil fuel power generation units, load flexibility, as well as the scale and consumption capacity of renewable energy on Carbon Emission Factors.
These findings from these studies provide valuable insights for provincial governments and grid operators in designing targeted policies and investment plans to reduce their specific Carbon Emission Factors and contribute to national decarbonization goals. Underpinning the technological and operational strategies are the policy [41,42], as well as the designed market mechanisms [43,44], to incentivize low-carbon investments and behaviors. These provincial and regional studies collectively emphasize that while national targets provide overarching direction, the specific pathways and effective strategies for low-carbon development must be formulated based on local conditions [4,45]. The long-term, differentiated carbon neutral development path for a provincial power system and its related policy design still need to be studied.
This work focuses on refining provincial carbon accounting methods, optimizing the integrated planning and operation of diverse flexibility resources in high-renewable systems, evaluating the techno-economic feasibility and system integration of emerging technologies like the existing generation mix (especially reliance on coal), the availability of renewable resources, the potential for inter-provincial power trade, the structure of local demand, and the usage of CCS. The findings from will provide valuable insights for provincial governments and grid operators in designing targeted policies and investment plans to reduce their specific Carbon Emission Factors and contribute to national decarbonization goals.
2 Calculation Model for Provincial Power System Carbon Emission Factor
The Carbon Emission Factor per unit of electricity in a power system is a critical indicator. It not only characterizes the cleanliness and low-carbon level of the power system but also plays a vital role in carbon emission verification and accounting. Furthermore, it serves as valid evidence for relevant users to conduct green product certification and participate in carbon emission reduction tasks.
The Carbon Emission Factor is defined as the direct CO2 emissions per unit of electricity generated within a specific temporal and spatial scope. This indicator is calculated by summing the direct CO2 emissions from various types of fossil fuel-based power generation (thermal power, gas-fired power, oil-fired power, etc.) within the defined temporal and spatial boundaries, and then dividing this sum by the total grid-supplied electricity generation consumed for all types of electricity demand within the region. This estimates the average amount of carbon dioxide (CO2) emitted per kilowatt-hour (kWh) of electricity within the power system over that time and space, as shown in Eq. (1).
where A is the total grid-supplied electricity generation consumed for all types of electricity demand within the region; E is the carbon emissions amount corresponding to the total grid-supplied electricity generation consumed for all types of electricity demand within the region.
The average emission factor for a provincial power system refers to the carbon emissions generated per kWh of electricity consumed within the provincial administrative region. It is primarily calculated based on the province’s power source composition, inter-provincial power transmission, and electricity consumption data. Starting from the electricity exporting provinces, the emission factor for the target province is calculated according to the power flow direction, as illustrated in Fig. 1.
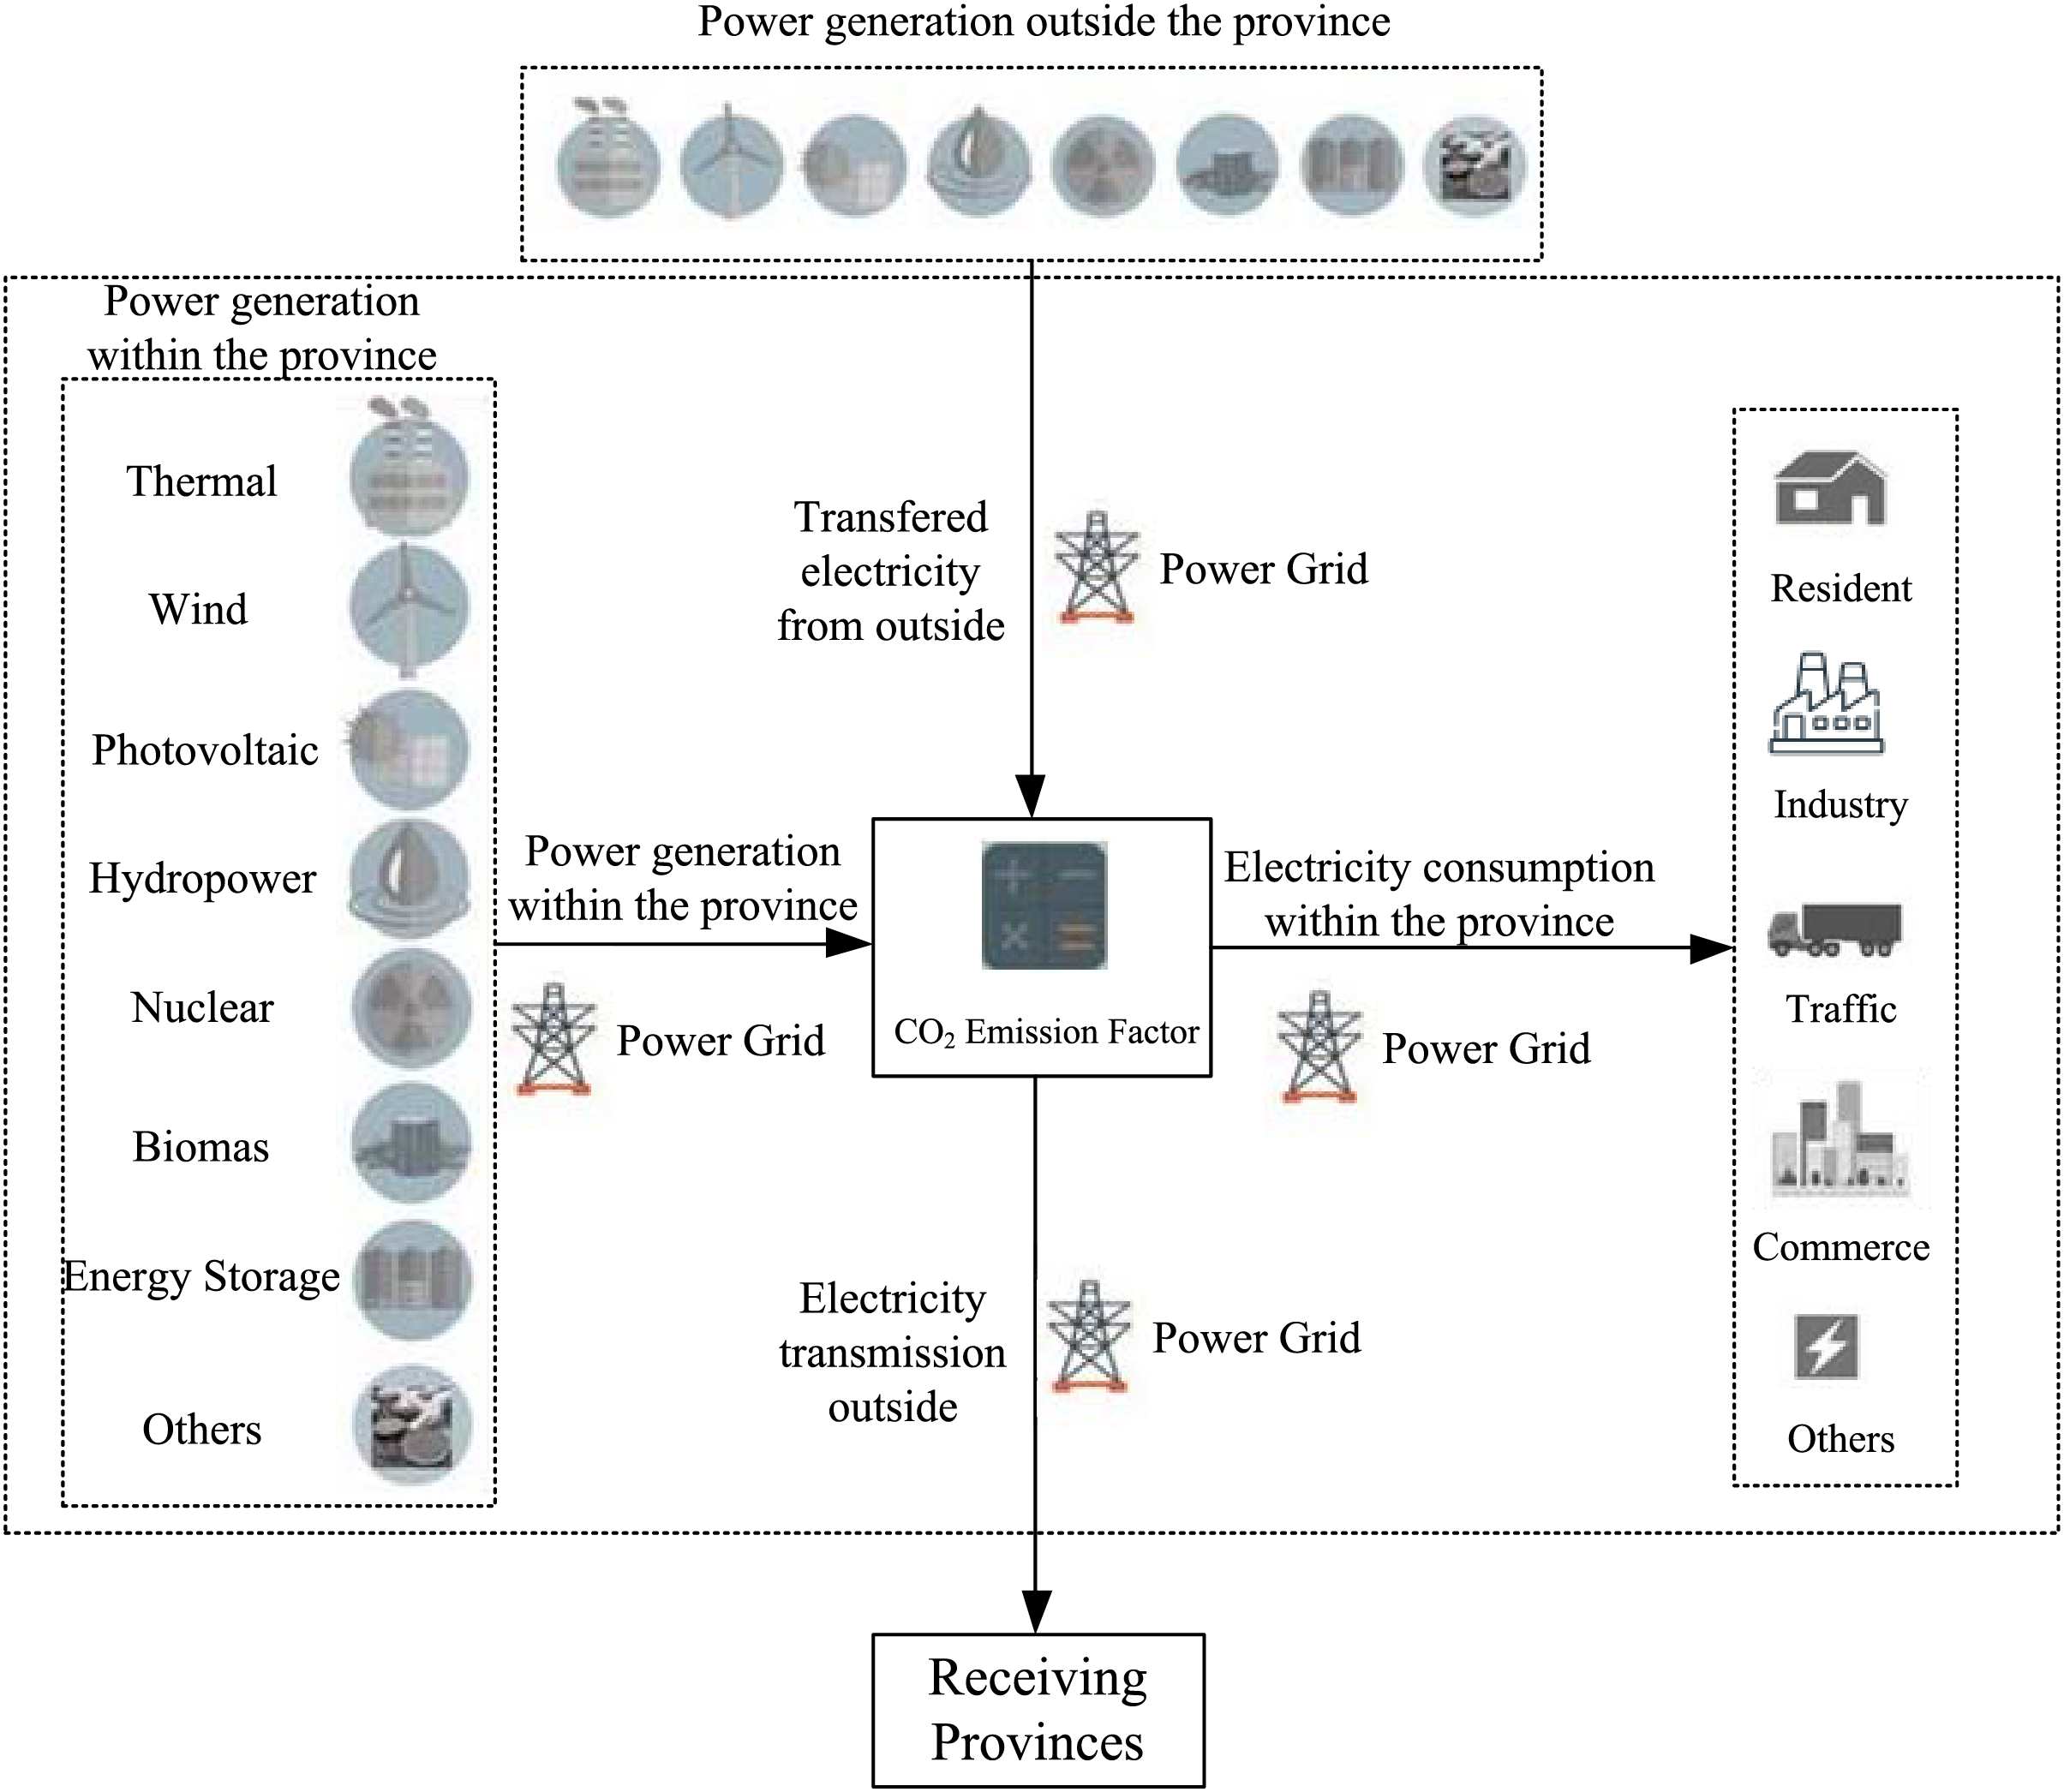
Figure 1: Calculation framework for the carbon emission intensity per unit of electricity in a provincial power system
According to Fig. 1, the calculation of the provincial power system’s average emission factor fully accounts for electricity imported from different provinces and electricity exported to other receiving provinces. It incorporates the province’s own power generation, electricity imported from other provinces, and electricity exported for consumption outside the province into the denominator of Eq. (1). Correspondingly, the carbon emissions from the province’s own power generation, the emissions associated with the imported electricity, and the emissions associated with the exported electricity are incorporated into the numerator, as shown in Eq. (2).
where A is the total grid-supplied electricity generation consumed for all types of electricity demand within the province, equals to the sum of the province’s own generation Agen and the electricity imported from other provinces (
Solving Eq. (2) yields:
Eq. (3) indicates that when the net electricity flow (imports minus exports) is considered, the exported electricity volume Ah does not affect the calculation of the average Carbon Emission Factor for the power system.
When calculating the total carbon emissions of the provincial power system, the exported electricity must be considered, as shown in Eq. (4).
Generally, the Carbon Emission Factor of a provincial power system is related to the actual electricity consumption within the province which can be derived from electricity generation within the province and inter provincial electricity flow. This model has laid the foundation for the analysis of different generation units in the following content.
3 Analysis of Key Influencing Factors
To analyze the impact of renewable energy consumption, carbon emissions from thermal power, demand-side response on the load side, and regulation from the energy storage side on the power system’s Carbon Emission Factor, the total carbon emissions from fossil fuel-based generation within the province Egen and the total provincial generation Agen in Eq. (3) are divided into fossil fuel-based (primarily coal and gas power) and non-fossil fuel-based (including hydro, nuclear, wind, solar PV, biomass, geothermal, tidal, and waste-to-energy power) components, as shown in Eq. (5).
where Efos,gen = Egen is the carbon emissions from fossil fuel-based power generation within the province; Afos,gen, Anon-fos,gen are the electricity generation from fossil fuel-based and non-fossil fuel-based units within the province, respectively; Efos,i is the annual carbon emissions from fossil fuel combustion for the i-th thermal power unit within the province (total I fossil fuel-based generating units); Afos,i, Anon-fos,k are the annual electricity generation from the i-th fossil fuel-based unit and the k-th non-fossil fuel-based unit within the province, respectively (total K non-fossil fuel-based generating units).
3.1 Impact of Thermal Power and Its Flexible Operation
Thermal power (including mainly coal and some gas-fired power) is the primary source of carbon emissions in power systems, originating mainly from the combustion of fossil fuels. The carbon emissions from fossil fuel-based generation within the province in Eq. (5) can be expressed as the product of generation and the average Carbon Emission Factor, i.e.:
where
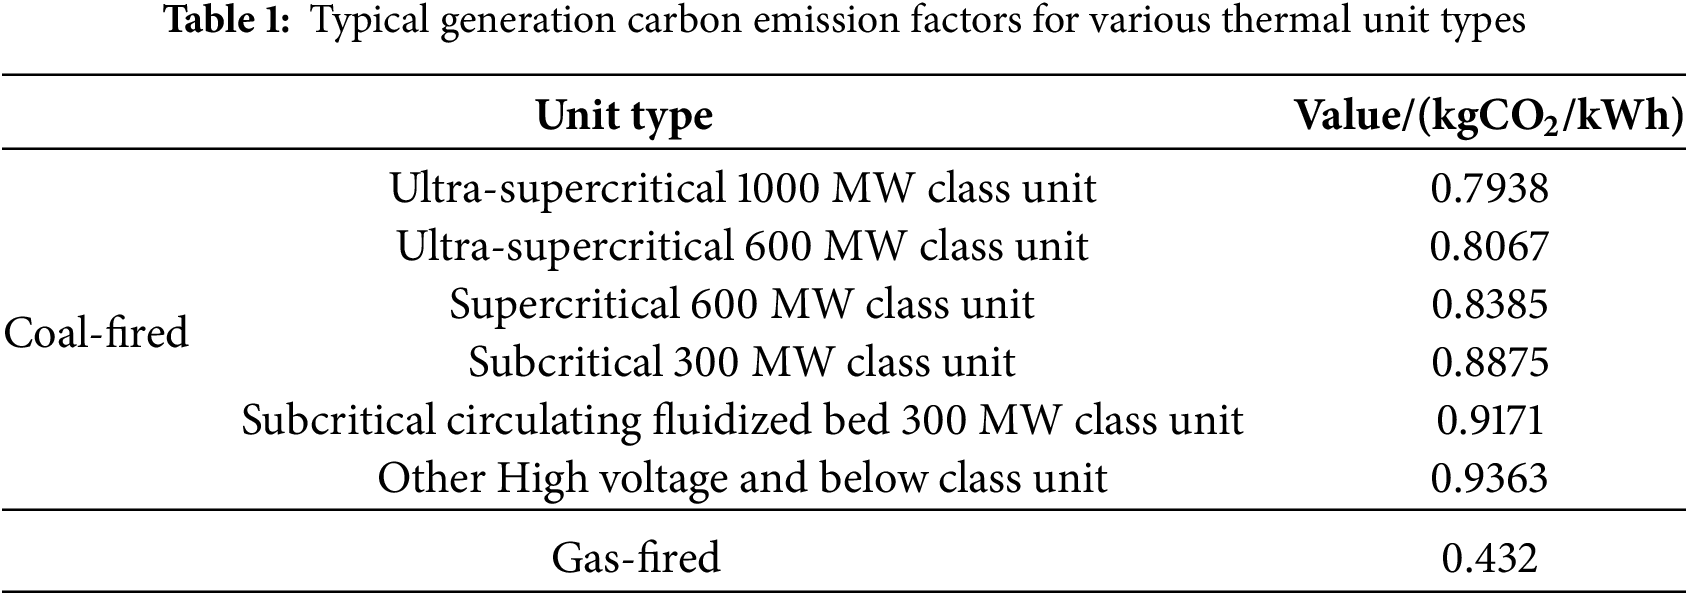
According to Eq. (6), both the generation volume of thermal power and its Carbon Emission Factor directly influence the power system’s Carbon Emission Factor. If the province’s total electricity generation is fixed, a larger share of thermal power generation or a higher thermal power Carbon Emission Factor will result in a larger provincial power system Carbon Emission Factor, and vice versa. Typical Carbon Emission Factors for various types of thermal power units can be calculated based on the values in Table 1.
The Carbon Emission Factor of thermal power plant generation is influenced by fuel type, combustion efficiency, and particularly operating conditions. To accommodate more renewable energy, coal-fired thermal power units operating in deep regulation stages experience not only reduced operational efficiency, leading to increased fuel costs, but also higher system losses and fuel consumption per kWh, significantly impacting their generation Carbon Emission Factor. Simultaneously, deep regulation of coal-fired thermal power units may cause incomplete fuel combustion, necessitating measures like oil injection for combustion support. This incurs additional costs from other fuels, thereby increasing the generation Carbon Emission Factor.
China is currently implementing flexibility retrofits on coal-fired thermal power units, enabling most units to reduce their output down to 40% of rated power, with some achieving 30%. This aims to enhance the units’ low-power operation capability, increase system flexibility through deep peak regulation, and thereby strengthen the ability to consume fluctuating wind and solar power.
Taking a condensing coal-fired thermal power unit as an example, its regulation is divided into the conventional regulation stage (Regular Peak Regulation, RPR), the deep regulation stage without oil injection for stable combustion (Deep Peak Regulation without oil, DPR), and the deep regulation stage with oil injection (Deep Peak Regulation with oil, DPRO), as shown in Fig. 2.
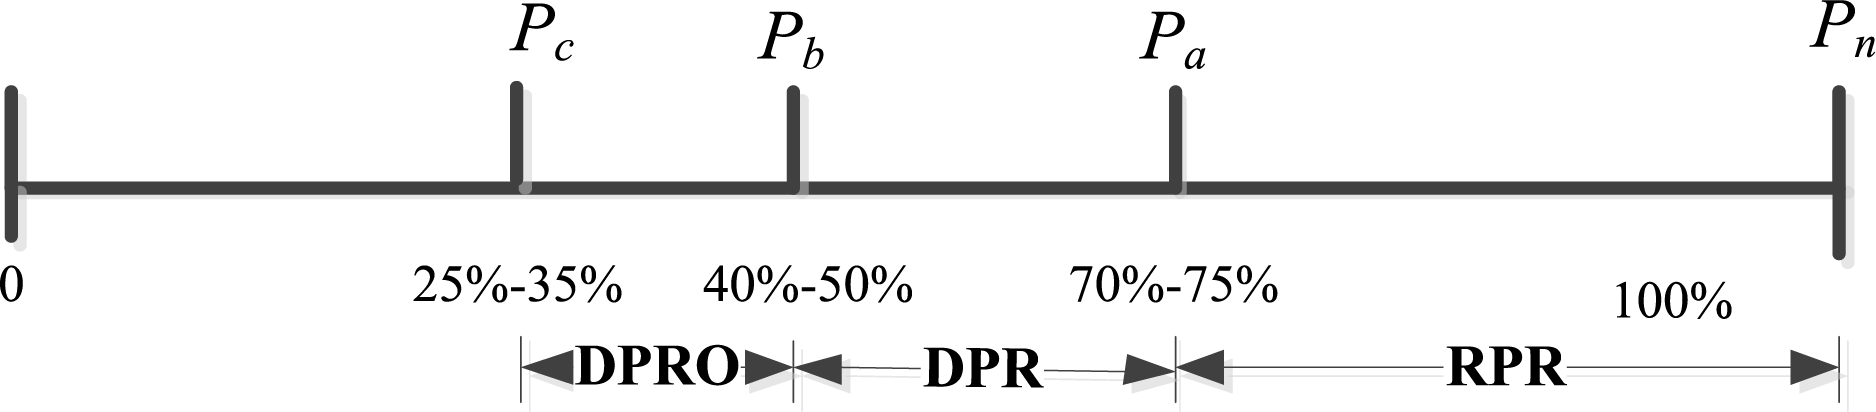
Figure 2: Schematic diagram of the thermal power unit output reduction regulation process, where Pn is the unit’s rated power, also its maximum long-term operating output; Pa is the minimum technical output in the RPR stage, typically 70%–75% of rated power; Pb is the minimum stable combustion output in the DPR stage, typically 40%–50% of rated power; Pc is the stable combustion limit output in the DPRO stage, typically 25%–35% of rated power
The output correction coefficient of a coal-fired thermal power unit, defined as the ratio of fuel consumption or Carbon Emission Factor per kWh under different deep peak regulation states to that under standard conditions, gradually increases as the output decreases. Based on the science and technology project “Flexibility Retrofit Technology for Thermal Power Plants” by North China Electric Power Design Institute, the output correction coefficients for a 1000 MW ultra-supercritical coal-fired condensing unit are shown in Table 2.
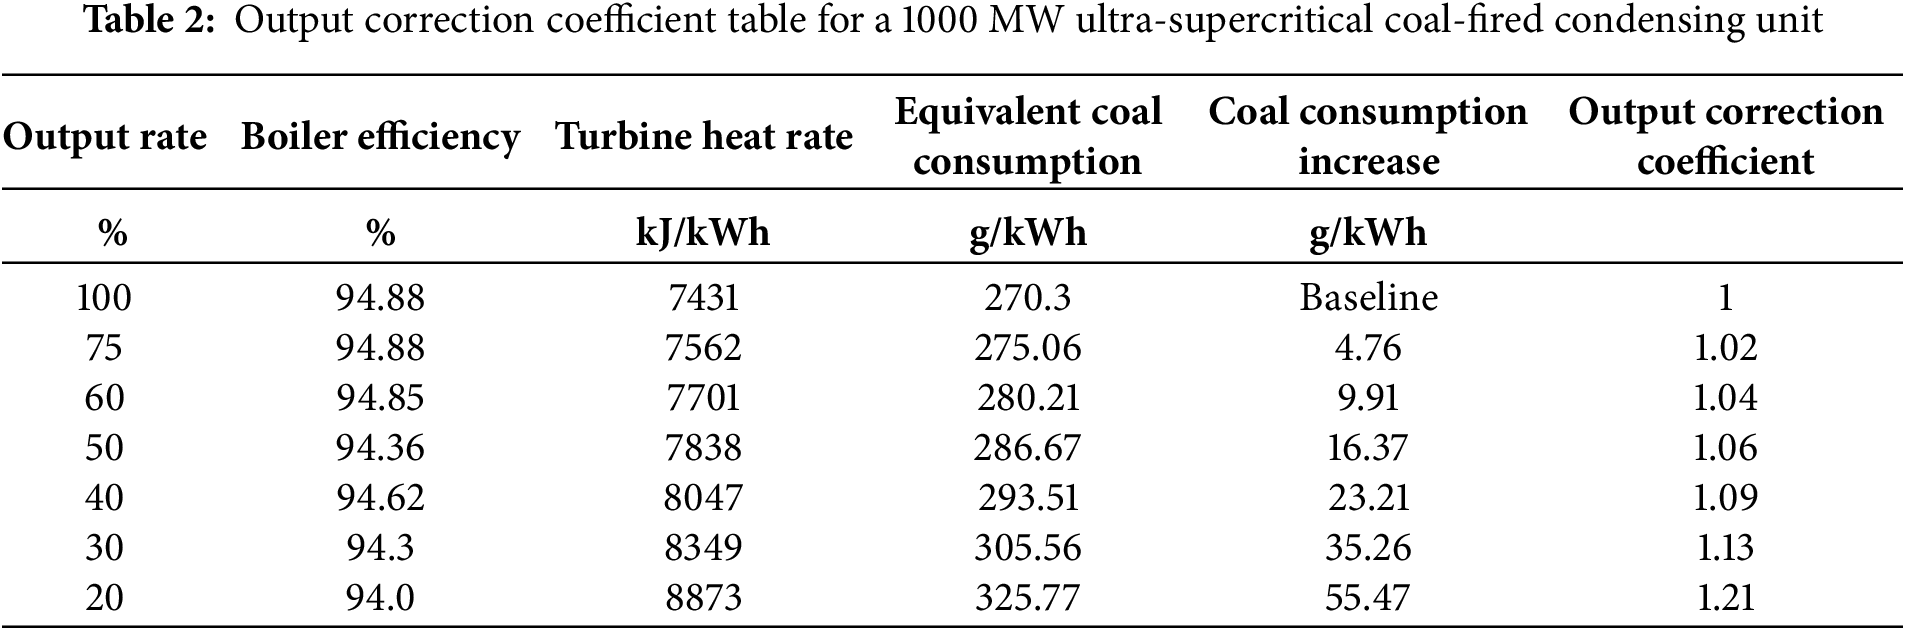
Assuming an ultra-supercritical coal-fired unit has a standard carbon emission coefficient of 0.84 kg/kWh using bituminous coal under standard conditions, and considering scenarios where this unit participates in deep peak regulation, the output correction coefficient and the unit’s generation Carbon Emission Factor under different peak regulation depths are calculated based on the mathematical relationship between them. The results for the aforementioned 1000 MW ultra-supercritical condensing water-cooled thermal unit are shown in Fig. 3. It is evident that a peak regulation depth below 70% is accompanied by a significant increase in the Carbon Emission Factor. When the depth reaches 40%, the Carbon Emission Factor increases by approximately 10% compared to the standard condition. When the peak regulation depth reaches 30%, the Carbon Emission Factor per kWh approaches 1 kg/kWh.
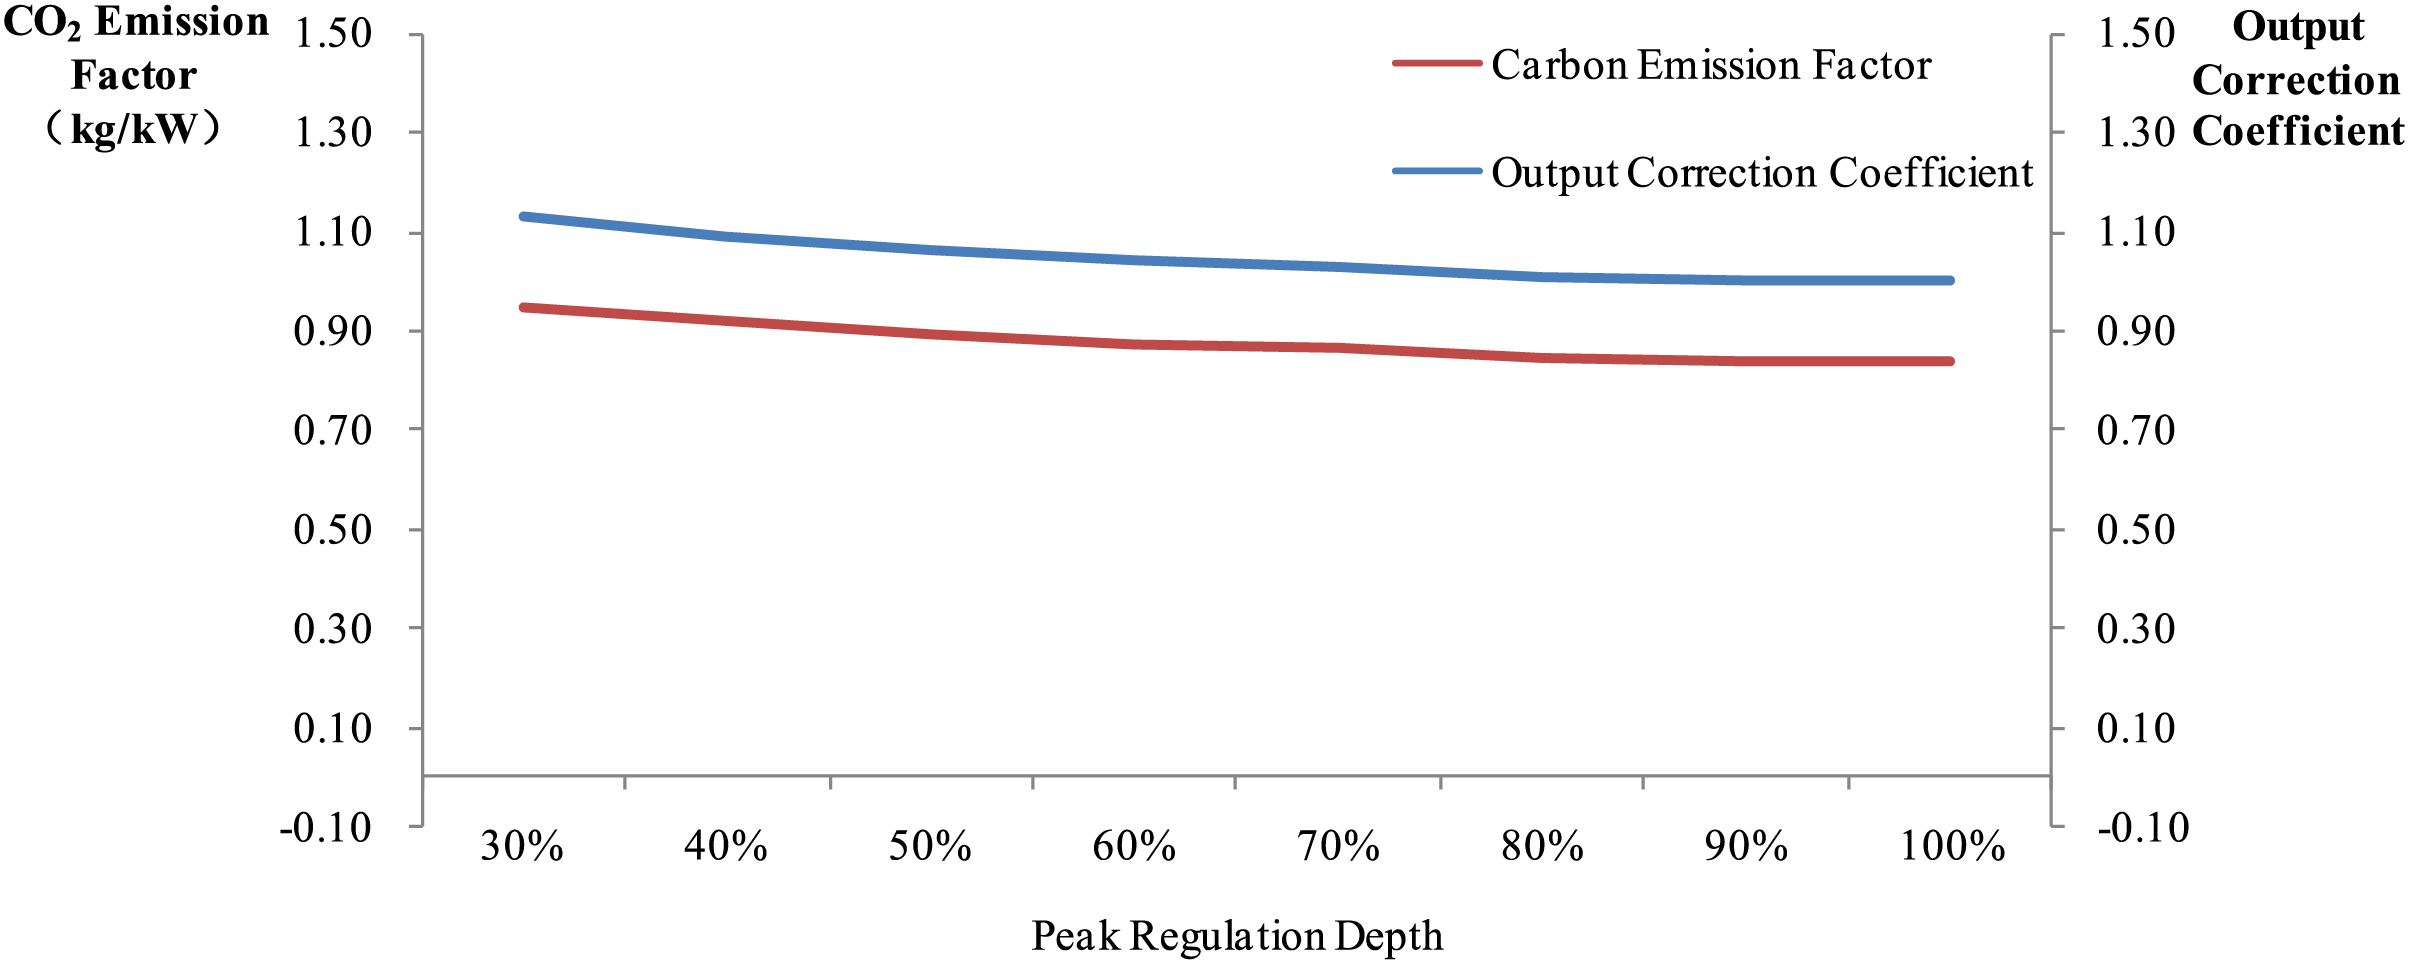
Figure 3: Carbon emission factor of coal-fired thermal power units under different peak regulation depths
Therefore, commonly maintaining coal-fired thermal power unit output above 70% is a necessary prerequisite for ensuring the stability of the thermal power’s Carbon Emission Factor. If lower thermal power output is required for peak regulation to accommodate more renewable energy generation, the combined impact of the increased thermal power Carbon Emission Factor and the carbon reduction effect from accommodating renewable energy should be comprehensively evaluated from a carbon reduction perspective. The unit’s operating mode should be set considering both this evaluation and the requirements for power system security and stability control.
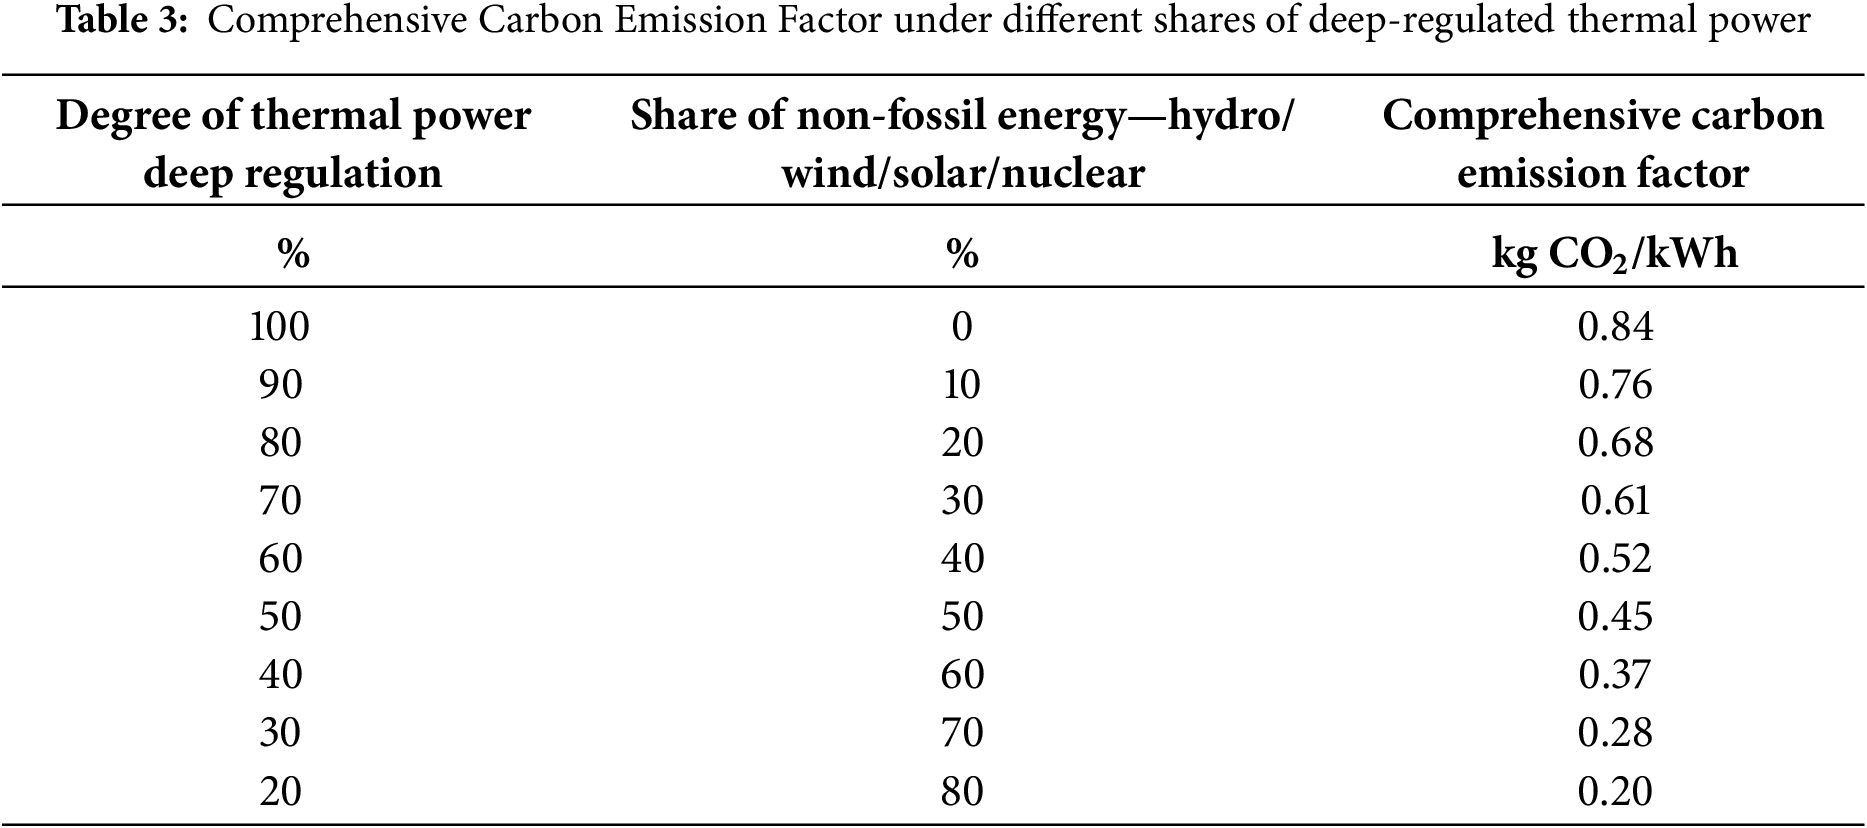
To further demonstrate the combined effect of the increased Carbon Emission Factor from coal-fired thermal power deep peak regulation and the low-carbon benefits from accommodating more non-fossil clean energy, the comprehensive Carbon Emission Factor under different shares of thermal power output (cooperating with clean energy) is calculated based on the coal-fired thermal power Carbon Emission Factors under the above operating conditions. Non-fossil clean energy primarily includes hydro, wind, solar, and nuclear power. As shown in Table 3, within the range of deep-regulated thermal power shares from 20% to 100%, the comprehensive Carbon Emission Factor still decreases as the share of non-fossil energy generation increases. In other words, although deep peak regulation increases the coal-fired thermal power unit’s own Carbon Emission Factor, the low-carbon effect from accommodating more non-fossil clean energy is more significant. The combined effect still results in a lower comprehensive Carbon Emission Factor as the share of non-fossil energy generation increases.
3.2 Renewable Energy Consumption
Expressing the generation output of fossil fuel and non-fossil fuel units within the province as the product of unit power rating and annual maximum utilization hours, Eq. (6) can be rewritten as:
where Pfos,i and hfos,i are the rated power and annual maximum utilization hours of the i-th fossil fuel unit within the province, respectively; Pnon-fos,k and hnon-fos,k are the rated power and annual maximum utilization hours of the k-th non-fossil fuel unit within the province, respectively.
For provincial power systems with unblocked internal transmission, renewable energy consumption requires satisfying only the dynamic power balance constraint and the lower limit of system regulation capability. The system regulation space between the “load plus transmitted power outside the province” curve and the lower limit of system regulation capability represents the theoretical maximum consumption potential for renewable energy, as illustrated in Fig. 4 [46]. It can be found that the intra-day variability of renewables might cause clean electricity abandonment in some time and enlarge the reserved capacity of traditional generation units. These operational challenges, including combined optimization of generators’ output, power balance regulation, and safety control, etc., should make use of energy storage, flexible loads, etc. to ensure the consumption of clean electricity.
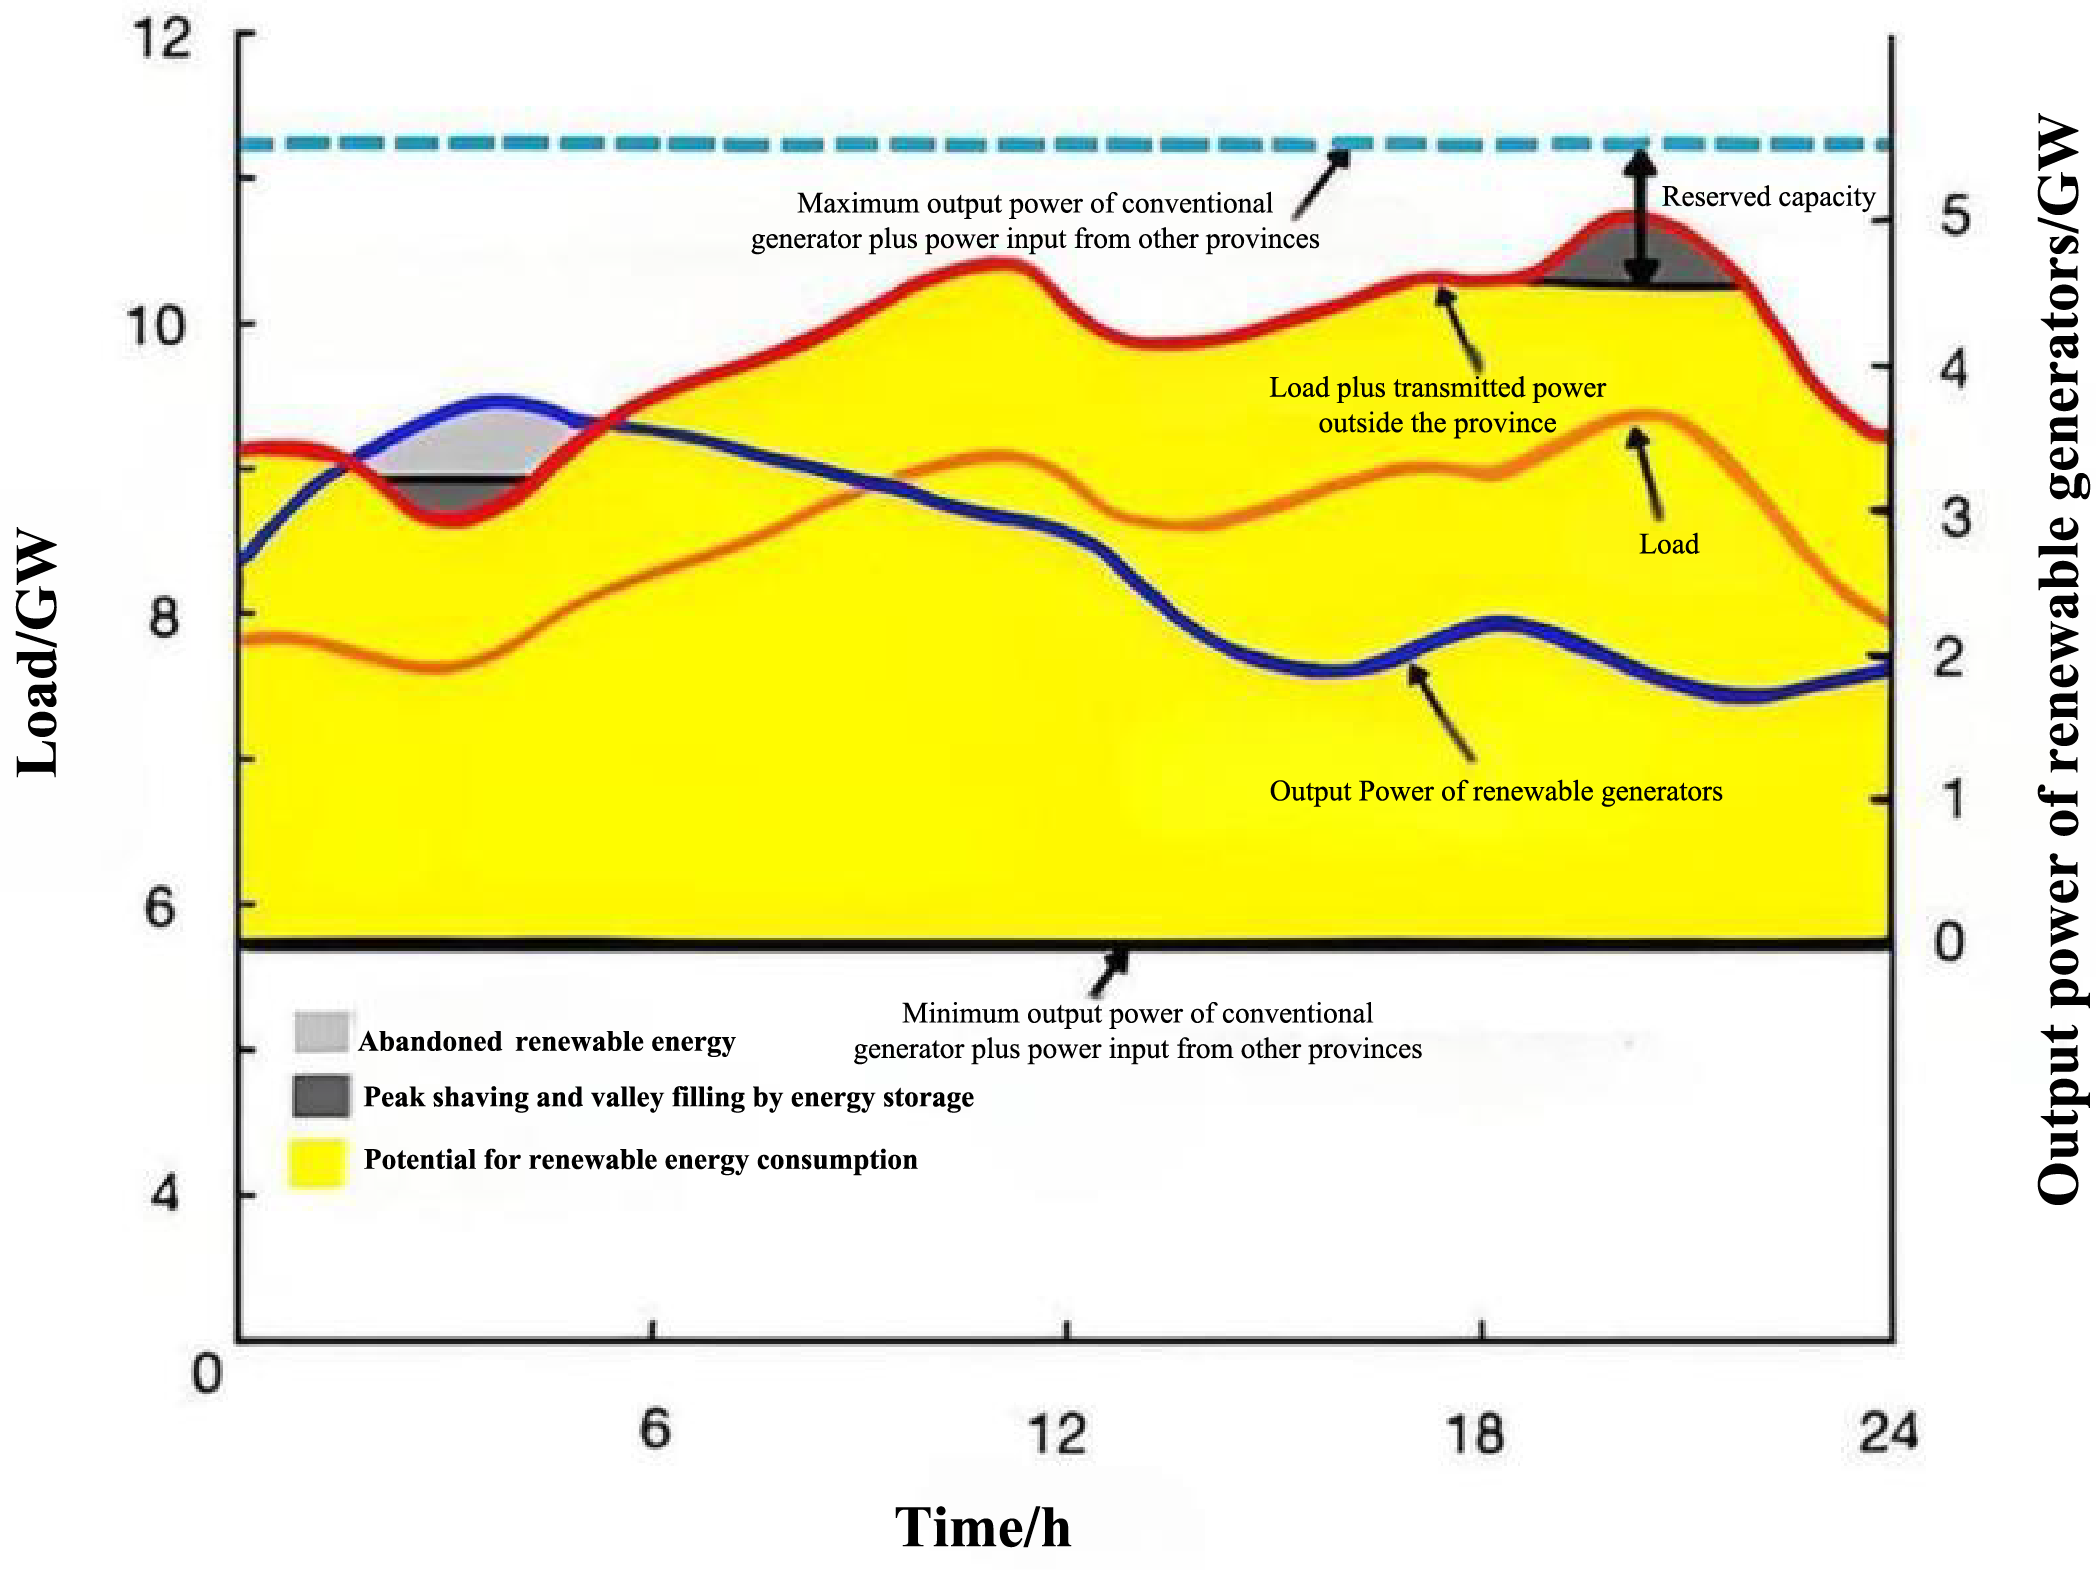
Figure 4: Schematic diagram of renewable energy consumption potential
The maximum renewable energy power that can be consumed by the provincial power system at time t, defined as Pa(t), satisfies Eq. (8):
where Pl(t) is the load power at time t; Pt(t) is the outgoing power on the tie-line at time t (positive for outbound); Pin(t) is the power fed into the province from other provinces at time t (positive for inbound); Pg,m,max is the maximum technical output of the m-th conventional unit within the system; Pg,m,min is the minimum technical output of the m-th conventional unit within the system; M is the total number of conventional units in the system;
The sum of the maximum technical outputs of all conventional units and the power imported from other provinces within this provincial system should exceed the peak value of the sum of the load and planned outgoing power, maintaining a certain positive spinning reserve capacity, as shown in Eq. (10):
where R+ is the positive reserve capacity considering renewable energy participation in balancing; and Pt,plan(t) is the planned outgoing power.
From Eqs. (8) and (10), to enhance renewable energy consumption while meeting reserve requirements, it is essential to minimize R+ (The arrangement of the positive reserve R+ is an operational control factor, generally optimized to its minimum based on relevant standards while ensuring security), reduce the total online capacity of conventional power sources, prioritize units with strong ramping capability, and thereby increase the downward regulation capability of the system.
The renewable energy consumption potential for this provincial power system is the integral of the maximum renewable energy power that can be accommodated:
Define the load factor
where Al is the load energy consumption including line losses.
Eq. (12) indicates a larger peak-valley load difference in the power system corresponds to a smaller load factor. Demand-side response can achieve peak shaving and valley filling, reducing the peak-valley difference and improving the load factor.
If the province does not export power to other provinces (Pt(t) = 0), the renewable energy consumption potential can be derived from Eq. (12) is:
From a systemic perspective, renewable energy consumption in this provincial power system is primarily determined by the overall regulation capability of the power sources, the load energy consumption, and the load factor. Better source regulation capability, higher load energy consumption, and a smaller peak-valley difference leads to a larger theoretical renewable energy consumption potential, consequently reducing the Carbon Emission Factor of the provincial power system.
Considering power export, the renewable energy consumption potential becomes:
where At,A is the additional renewable energy consumption potential enabled by power system interconnection, expressed as:
Therefore, reducing planned conventional power export and flexibly scheduling exports based on renewable energy output can maximize the utilization of transmission channel capacity and increase the renewable energy consumption potential. Power system interconnection provides the physical foundation for the overall allocation of regulation capability.
For scenarios where outgoing power strictly follows the plan, its effect is equivalent to increasing the load. The renewable energy consumption potential then satisfies:
where At,D is the planned outgoing energy; and
It is evident that key factors influencing renewable energy consumption include power source regulation capability (maximum/minimum technical output), power system interconnection (tie-line export capacity), load scale, and peak-valley difference.
Rewriting the denominator in the Carbon Emission Factor in Eq. (7) from the sum of in-province fossil fuel generation, in-province non-fossil fuel generation, and imported energy to the sum of in-province fossil fuel generation, in-province renewable energy generation, in-province other clean energy generation, and imported energy, substituting Eq. (16), setting the time period to the full year (8760 h), and considering imported energy
where Pclean&non-flu,n and hclean&non-flu,n are the rated power and annual effective hours of the n-th non-fluctuating non-fossil fuel generating unit (e.g., hydro, nuclear, biomass), respectively, with a total of N such units.
Accordingly, to increase renewable energy consumption, feasible measures include: reducing the Carbon Emission Factor of fossil fuels, enhancing the downward regulation capability of conventional units, increasing the ratio of average load to peak load through energy storage and demand-side response, enhancing consumption capacity via power export, and reducing positive reserve capacity.
3.3 Carbon Capture and Storage (CCS)
Considering the capture and storage of carbon emissions from fossil fuel units via CCS technology, the expression for the power system Carbon Emission Factor becomes:
where
Briefly, the deep regulation of thermal power will increase the carbon emissions of its own power generation, but it also brings a larger space for renewable energy consumption which will reduce the carbon emissions of the entire power system; In addition, expanding the scale of new energy, increasing flexible regulation resources, enhancing consumption capacity, enhancing external transmission capacity, and reducing load peak valley difference, and the application of CCS are all beneficial for decarbonization of a provincial power system.
4 Implementation Pathways for Provincial-Level Emerging Power Systems from a Carbon Emission Factor Perspective
4.1 Foundational Data and Prerequisites
Table 4 presents the forecasted installed capacity for various generator types in Guangdong Province in China originated from governmental plans for typical years from 2025 to 2060. As wind and solar PV installed capacity expands annually, particularly with the development of offshore wind power, the share of thermal power progressively decreases, evolving from the primary source of electricity to a regulating power source until eventual partly phase-out. Wind and solar power will transit from being capacity entities to generation entities, and ultimately to responsible entities. Hydropower capacity has stabilized due to natural constraints. Nuclear power, serving as baseload supply, experiences moderate growth aligned with increasing electricity demand.
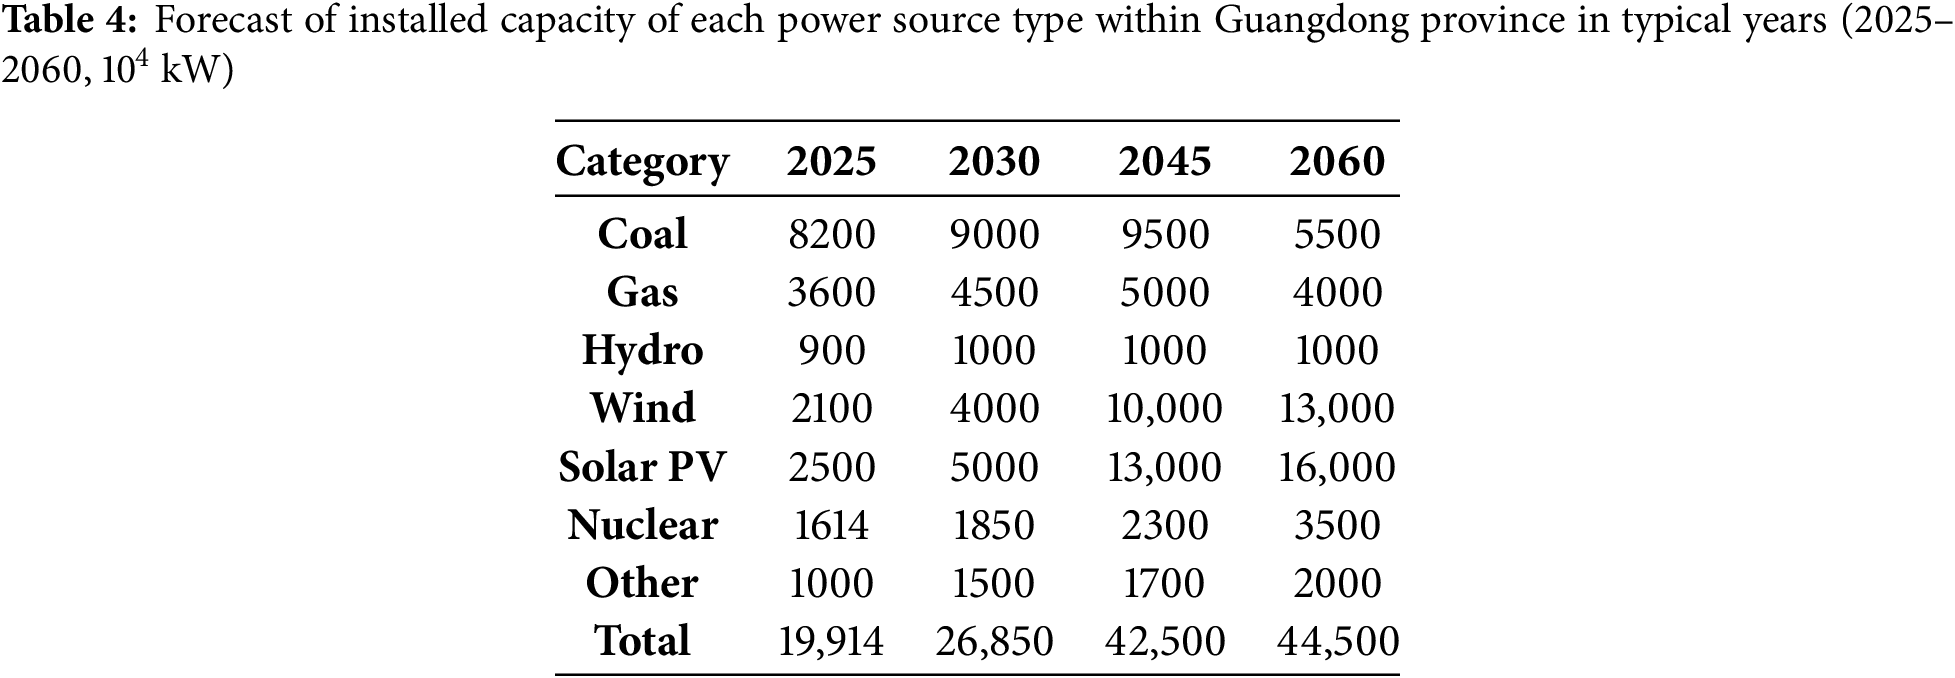
Table 5 forecasts the province’s inbound and outbound electricity transmission with other provinces for typical years (2025–2060). The province is a major recipient of clean energy imports, with substantial inflows of clean hydropower from the west and wind/solar power from neighboring and northern provinces projected over the next two decades. Thermal power imports initially increase but later decline as domestic coal units retire. Outbound electricity transmission exhibits modest growth.

4.2 Results Analysis and Development Pathway
Three future development scenarios are defined:
Conservative Scenario: Precede with planned renewable energy installations; deploy moderate-scale energy storage; implement CCS (Carbon Capture and Storage) and demand-side regulation in limited applications.
Baseline Scenario: Actively improve coal-fired power efficiency and flexibility; strategically deploy pumped hydro and battery storage; maximize load-side flexibility potential; adopt CCS for fossil-fuel generation based on technological maturity and cost-effectiveness.
Radical Scenario: Invest heavily, regardless of cost, in wind & solar generation and energy storage to ensure renewable integration; deeply exploit load-side power regulation capabilities; implement CCS for fossil-fuel generation earlier and at larger scale.
The average Carbon Emission Factor for coal power ranges from 0.82 to 0.86 kg/kWh depending on the proportion of deep peak regulation operation. The emission factor for gas power is 0.423 kg/kWh. In the Baseline Scenario, approximately 10% of emissions from fossil-fuel generation are captured and stored by 2045, compared with 15% in Radical Scenario and 5% in Conservative Scenario. By 2060, around 80% of emissions from non-retired coal units are captured and stored in the Baseline Scenario, compared with 65% in Radical Scenario and 82% in Conservative Scenario. The electricity consumption (including transmission losses) of this province is met by the on-grid electricity generation from various domestic power sources plus the net inbound electricity from other provinces (as shown in Table 5). The composition of electricity balance in typical years is illustrated in Fig. 5. Combined with the data in Table 4, it is evident that the inbound electricity (predominantly clean energy) will increase significantly in the near to medium term. Regarding the composition of domestic power generation: although coal-fired power capacity will still experience some growth in the near to medium term, its generation output and share exhibit a pronounced declining trend after 2030; wind and solar PV generation increases substantially with expanding capacity, gradually surpassing coal-fired generation to become the primary electricity source. In the Radical Scenario, renewable wind and solar energy achieves the greatest displacement of traditional coal-fired power, whereas in the Conservative Scenario, the consumption ability for wind and solar renewable electricity is relatively lower.
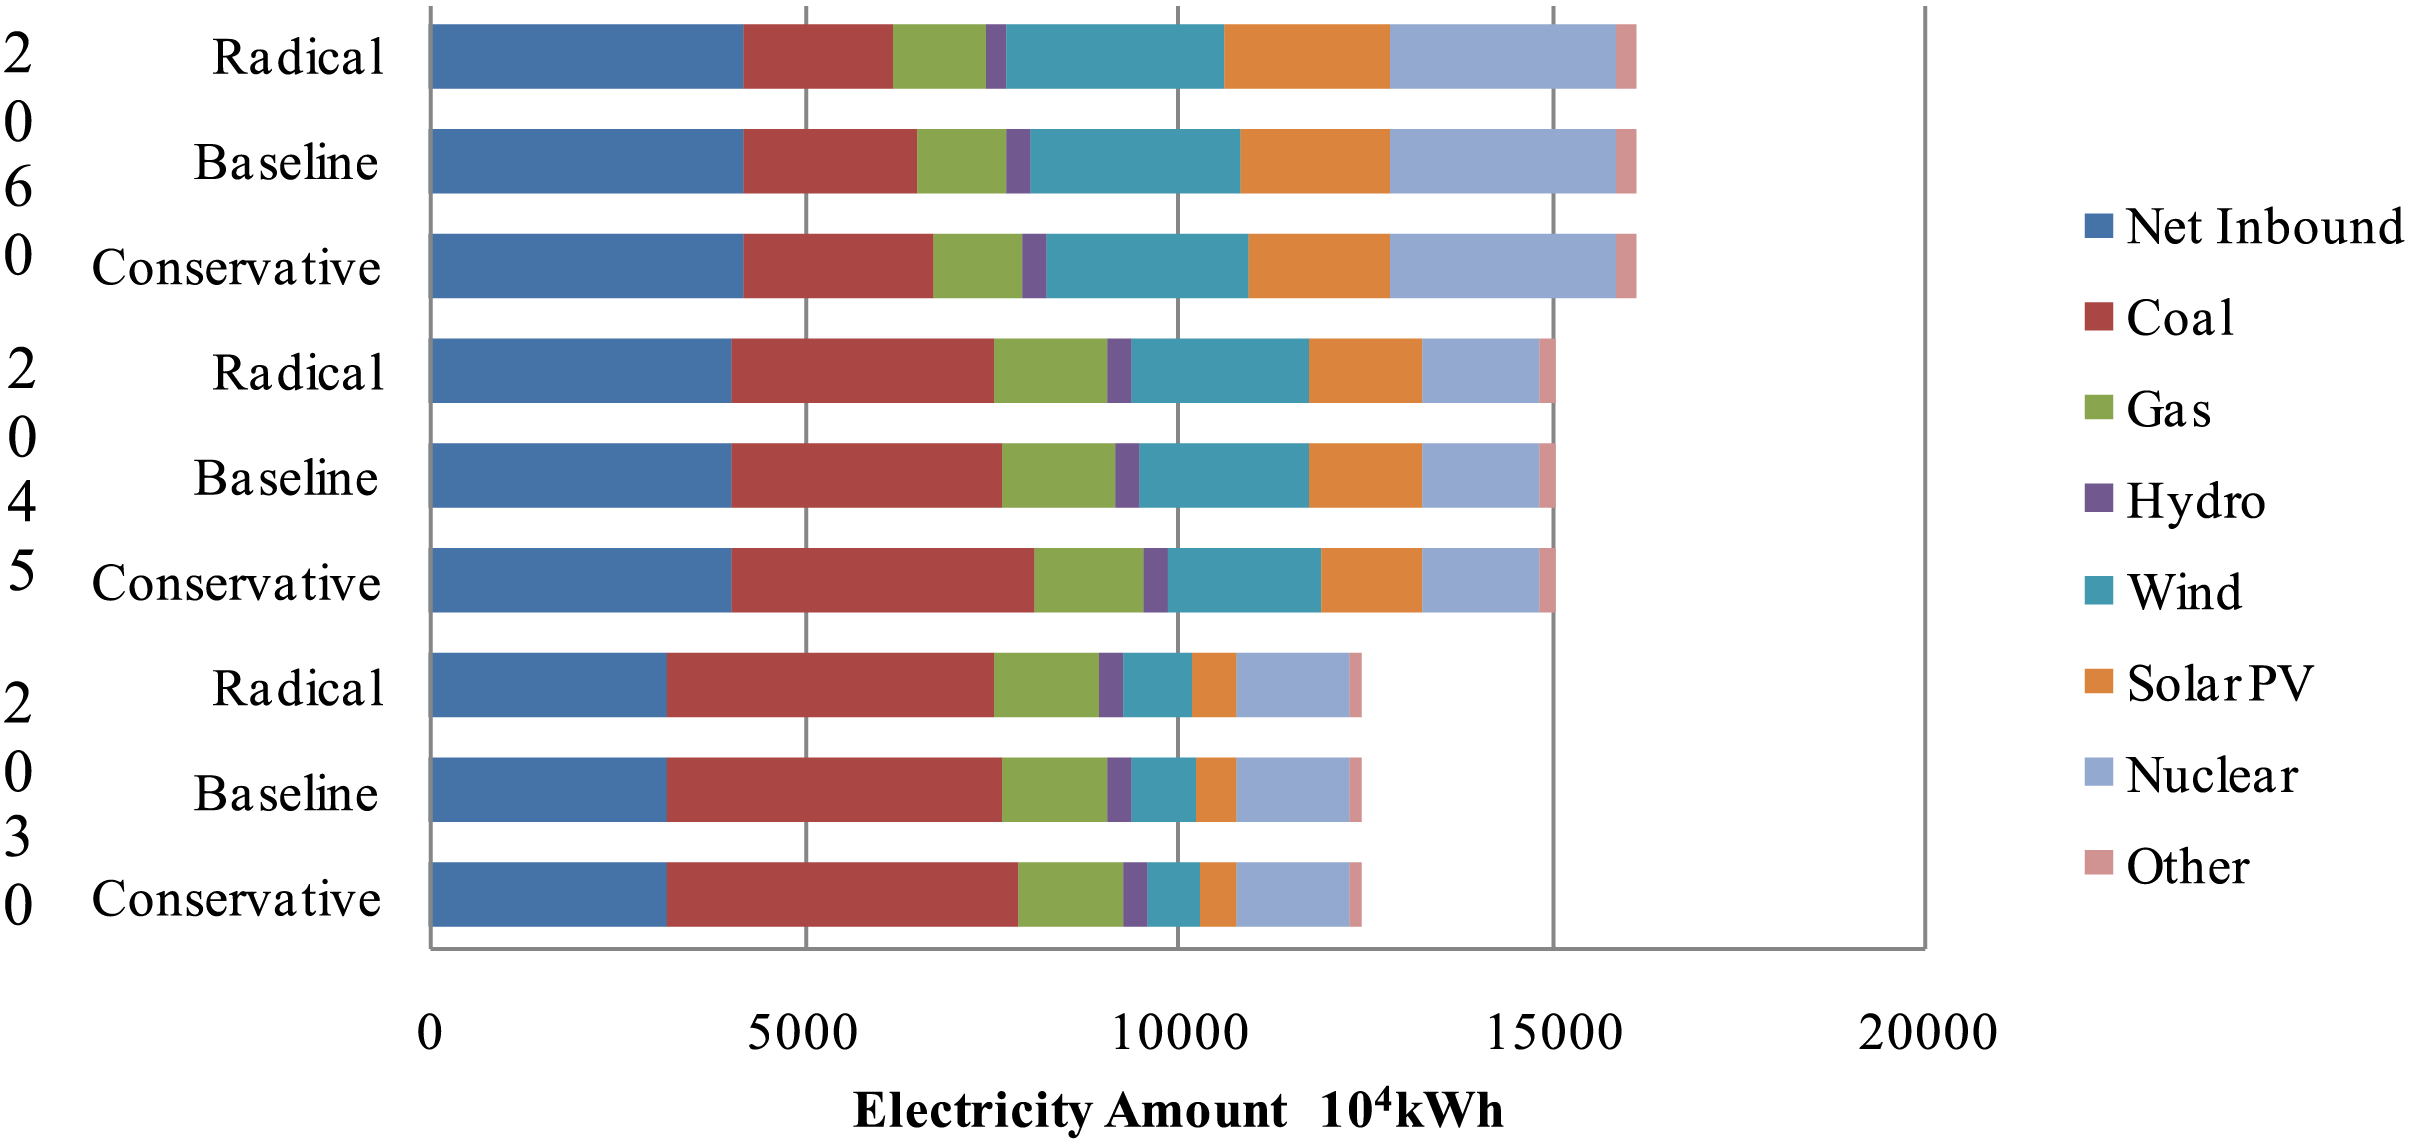
Figure 5: Composition of electricity balance in typical years for different scenarios
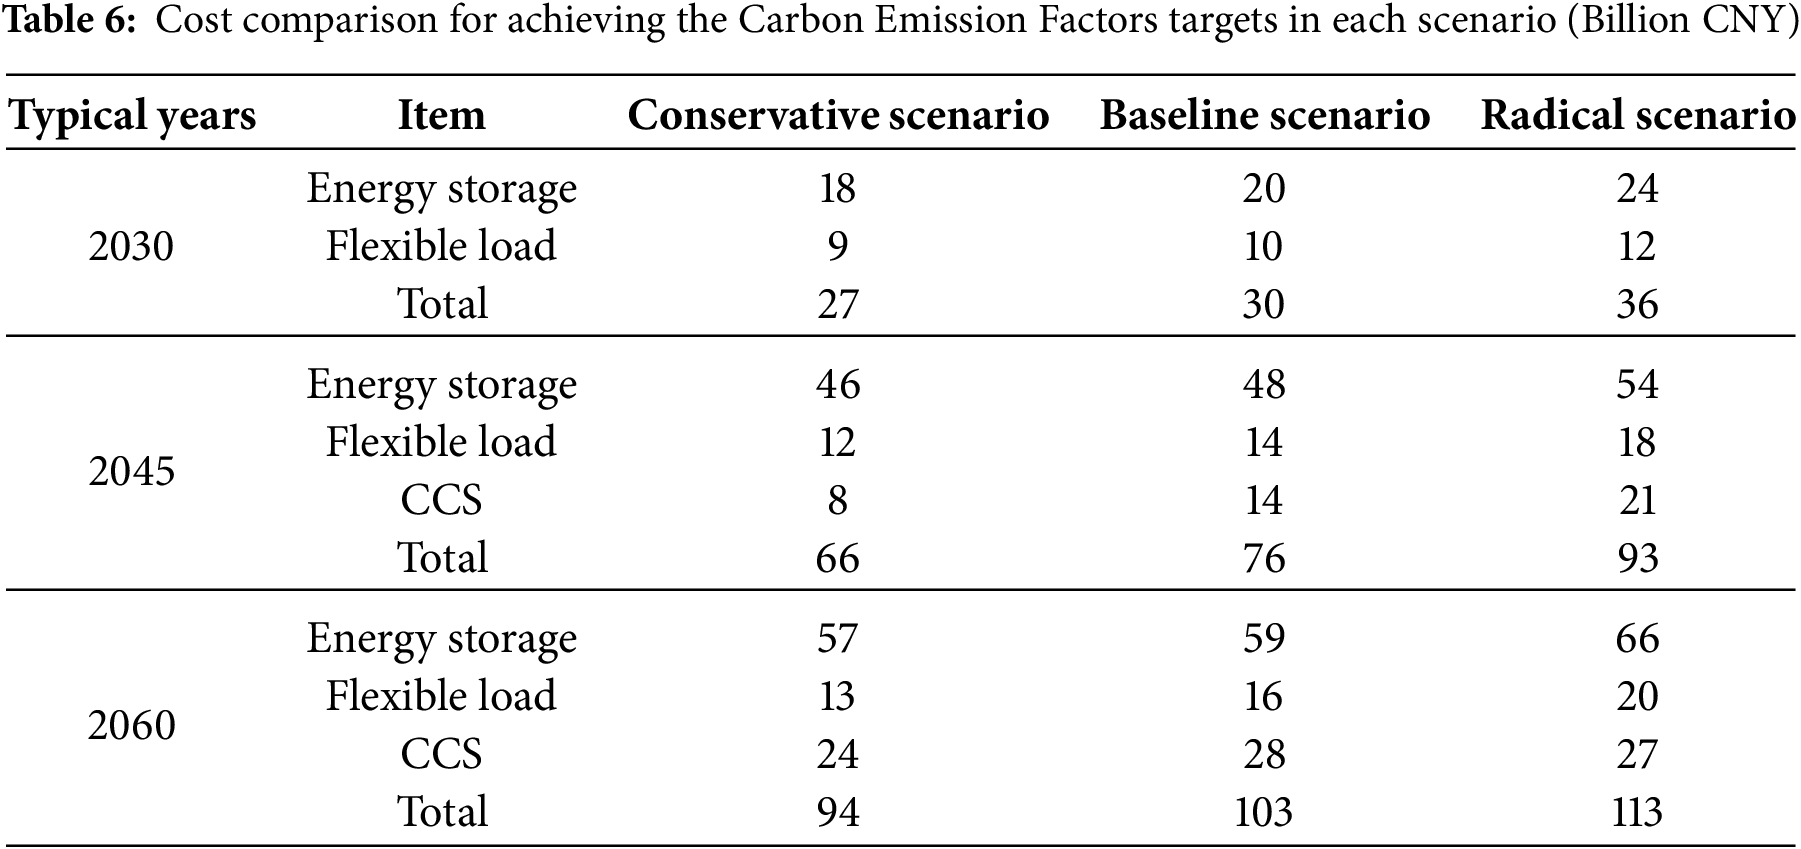
Fig. 6 illustrates the calculated Carbon Emission Factors for this provincial power system under different scenarios from 2025 to 2060. A brief cost comparison for achieving the Carbon Emission Factors targets in each scenario is given in Table 6. Driven by changes in installed capacity and imported clean electricity, this provincial power system exhibits an overall trend towards lower carbon intensity and greater cleanliness. However, the level of renewable energy consumption, mainly driven by the cost of energy storage and flexible loads, along with the CCS application, determines the system’s actual green and low-carbon status within this trend. Note that in Table 6, the cost of CCS in 2060 in Radical Scenario is even lower than Baseline Scenario. This is because more coal-fired thermal units will retire in Radical Scenario. Generally, the decarbonization pace in the Conservative Scenario is notably slower, while the Radical Scenario yields marginal additional decarbonization benefits at disproportionately high costs. Therefore, proactively leveraging flexibility resources, rationally deploying storage, and scientifically applying CCS technology—as outlined in the Baseline Scenario—represents a feasible pathway for power system decarbonization.
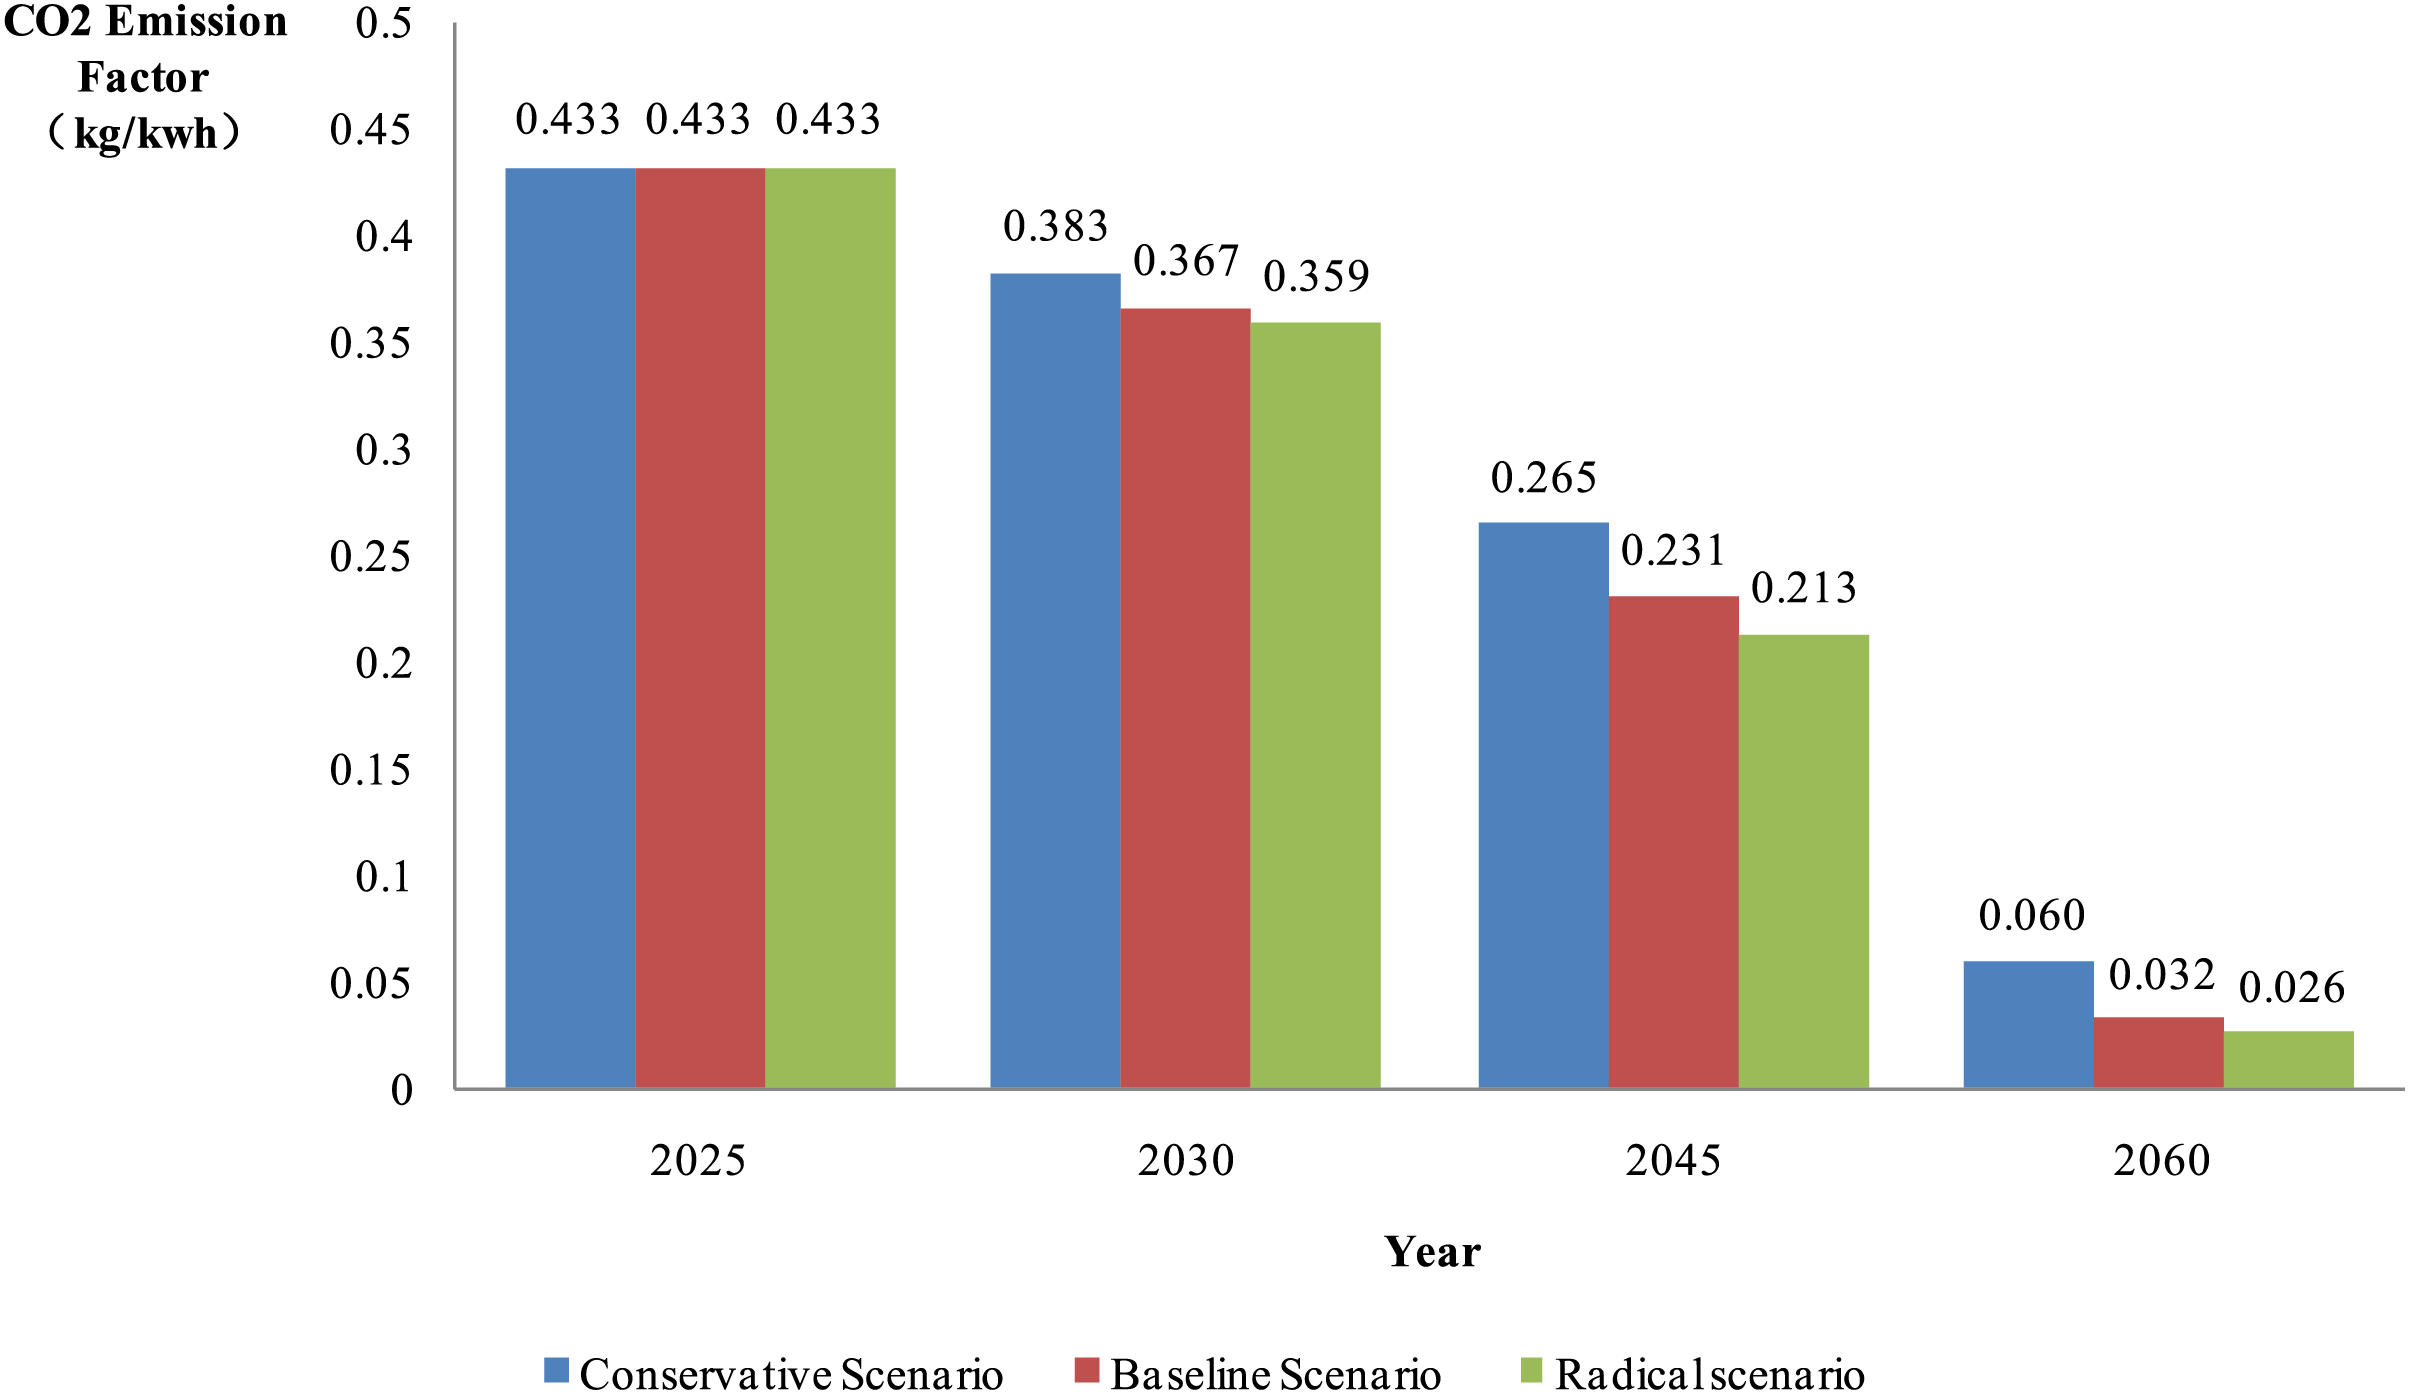
Figure 6: Forecast of power system Carbon Emission Factor (2025–2060)
4.3 Key Policy Suggeatiions for Different Stages
Within the framework of the Baseline Pathway, the province’s power system decarbonization can be divided into three stages:
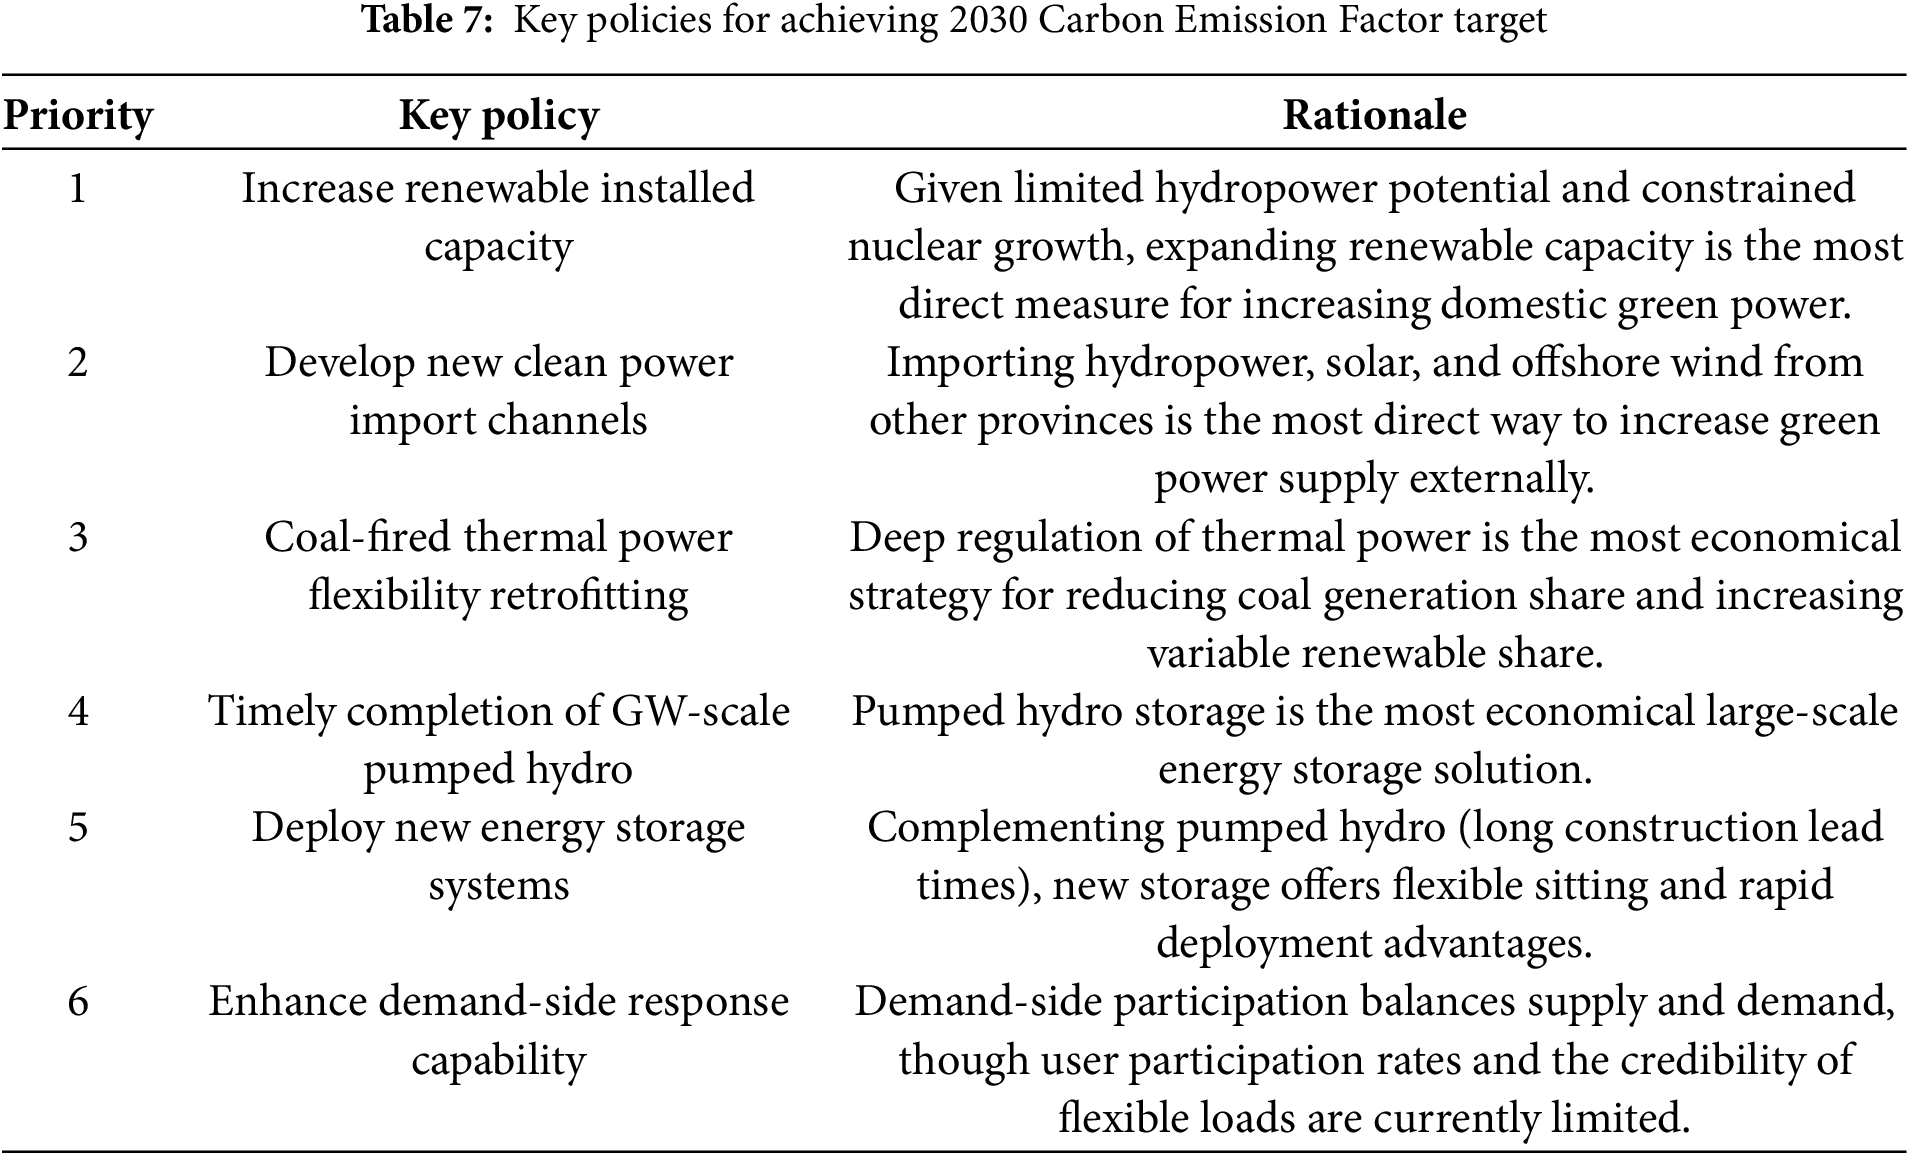
Stage 1: Wind & Solar Power Capacity Dominance (2025–2030). The following points should be focused on: Promote the dynamic optimization of traditional and new energy sources, steadily advancing the secure, reliable, and economical replacement of fossil fuels by renewables. Guided by the principle of “Coal Power for Security, Conventional Power for Supply Assurance, and Renewable Energy for Structural Adjustment”, optimize the integration of traditional and renewable energy sources. Enhance thermal power flexibility and renewable energy quality to lay the groundwork for high-quality renewable development. Scientifically delineate guaranteed consumption quotas and market-based consumption volumes, initiating renewable energy participation in electricity markets and gradually expanding market scale. Facilitate large-scale, high-quality, and leapfrog development of renewables. To achieve the Carbon Emission Factor target, ensuring the installed capacity and utilization hours of wind & solar and securing sources of imported green electricity are paramount. Key policies prioritized by economic and technical feasibility are listed in Table 7.
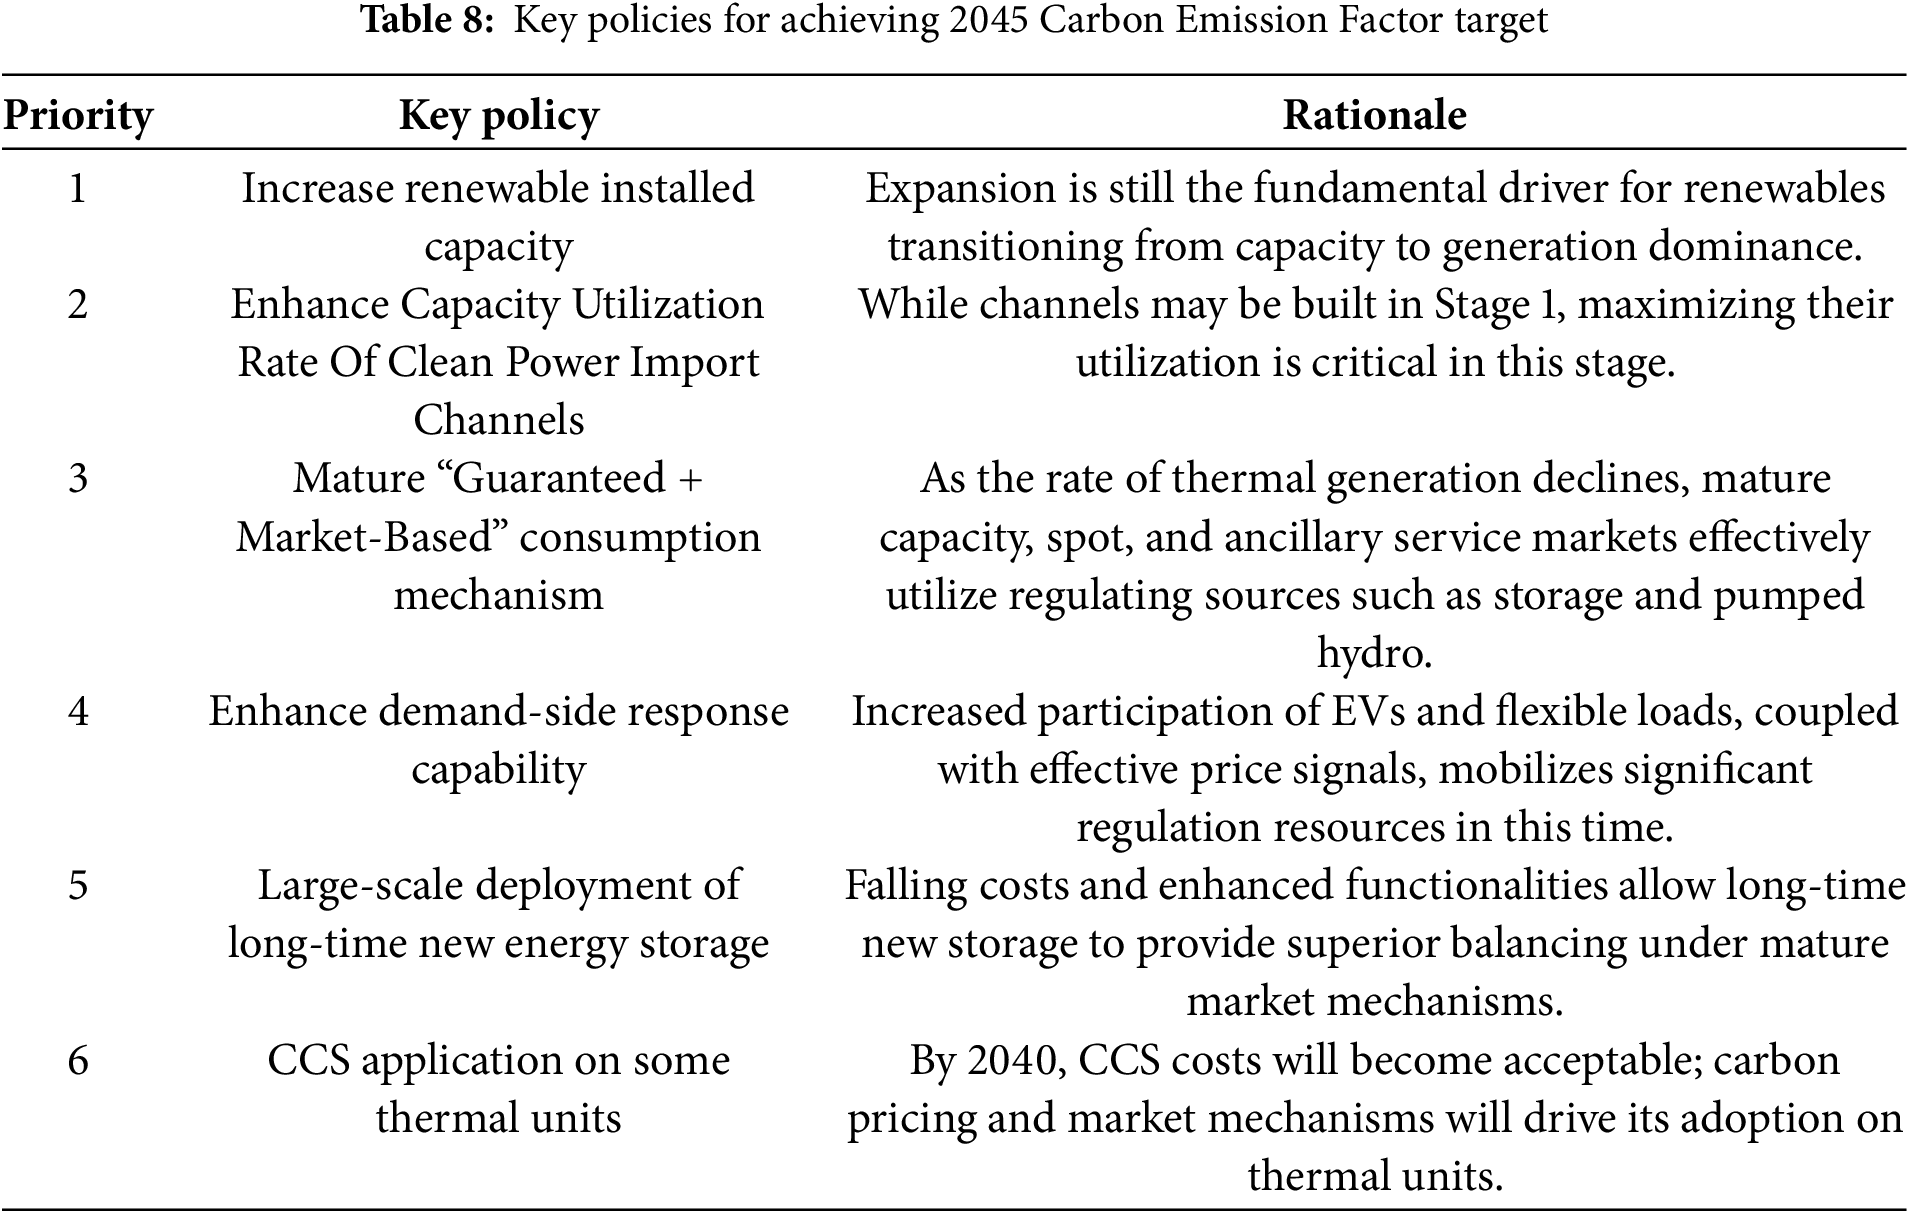
Stage 2: Wind & Solar Power Generation Dominance (2031–2045). The following points should be focused on: Stabilized capacity and declining generation of coal units (falling below 30% by 2035), large-scale development of far/deep-sea offshore wind, improved wind/Solar conversion efficiency (surpassing coal generation by 2045), and nuclear power growth maintaining base load. Thermal power units gradually become a regulating power sources. With renewables becoming the primary generation source, planning focuses on consumption targets and establishing a dual mechanism: guaranteed consumption and market-based consumption. Taking into comprehensive consideration of the layout, timing, and consumption of renewable energy installations, the guaranteed consumption scale and corresponding guaranteed consumption rate for renewable energy should be equitably clarified. The government and power system operators are solely responsible for guaranteed consumption, ensuring that the utilization rate of guaranteed renewable projects or guaranteed renewable electricity reaches over 95%. Maximize market-based consumption for non-guaranteed renewable electricity, excluding their curtailment from system statistics. Strengthen market mechanisms (e.g., profitability signals) to optimize renewable installation’s timing and location. Use capacity markets to incentivize peaking power and storage, complete thermal flexibility retrofits, and encourage large-scale, long-duration, dispatchable energy storage. Enhance forecasting accuracy through incentives. Develop demand-side markets, foster diverse participants (e.g., load aggregators, EV charging aggregators), and establish time-of-use pricing strongly linked to system peaks/valleys. Key policies for achieving the Carbon Emission Factor target involve perfecting the dual consumption mechanism, ensuring wind/solar capacity/utilization, and initiating CCS deployment, as shown in Table 8.
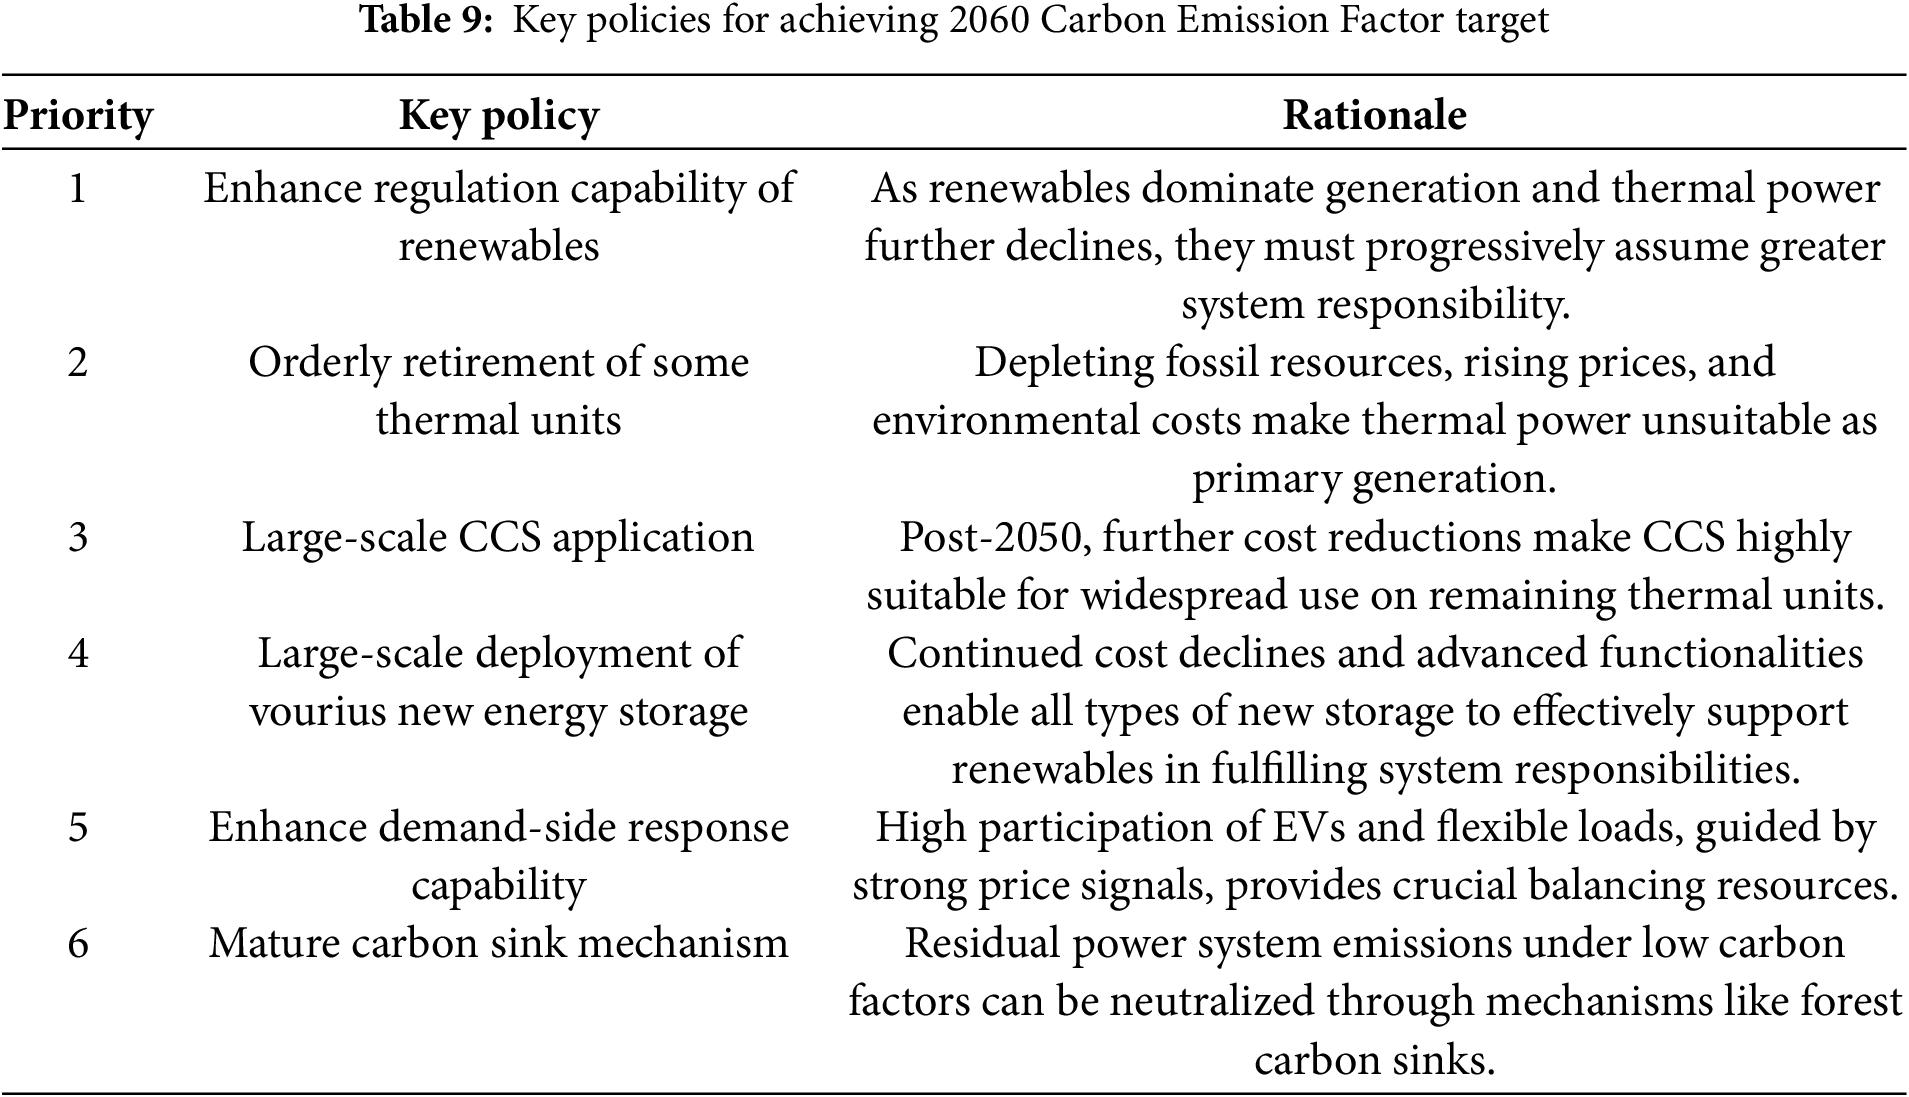
Stage 3: Wind & Solar Power Responsible Entity (2046–2060). The following points should be focused on: With slow growth in demand and generation, some thermal units will retire; the remaining units deploy mature, low-cost CCS for high-rate carbon capture. Advanced renewable technologies enable grid-forming capabilities, inertia provision, and frequency regulation, allowing renewables (with storage) to assume system responsibility (“Responsible Entity Stage”). This requires societal collaboration to build the emerging power system and share adjustment costs. Renewables (as the primary source) assume responsibilities (peak/frequency regulation, inertia) previously held by conventional sources. Society, benefiting from green power’s environmental gains, shares consumption costs or enhances demand elasticity to accommodate variability (“Cost Sharing, Benefit Sharing”). Power system emissions can be offset by consumers via carbon sinks, achieving the 2060 carbon neutrality goal. Key measures involve retiring thermal units, scaling CCS, establishing carbon sink mechanisms, and boosting renewable regulation capabilities, as shown in Table 9.
Summarily, as an energy receiving province, Guangdong has a low amount of external power transmission. It is necessary to build renewable units with the province, receive wind and solar power from the north and clean hydropower from the southwest of China, while reasonably optimizing the scale of thermal power and considering the cost changes of energy storage and CCS to allocate their scale reasonably.
This study presents a Carbon Emission Factor-driven analysis to explore feasible implementation pathways for building an emerging power system in Guangdong Province, China, towards achieving carbon neutrality by 2060. The main contribution is: a precise computational model of Carbon Emission Factor calculation considering the impact of thermal units’ deep regulation, renewable energy consumption, as well as flexible resources in power system; based on detailed installed capacity of generation, mix of traditional unites and renewables, as well as inter-provincial power exchange from 2025 to 2060, three distinct development scenarios and three stages with different develop priority were evaluated. The key findings and recommended pathway are summarized as follows:
The analysis demonstrates that while all scenarios show a declining trend in the power system’s Carbon Emission Factor, the Baseline Scenario emerges as the most practical and cost-effective pathway. The Conservative Scenario results in significantly delayed decarbonization, failing to leverage available technologies and resources proactively. Conversely, the Radical Scenario incurs disproportionately high costs for marginal additional decarbonization benefits, primarily driven by excessive spending on storage and premature, earlier and larger-scale CCS deployment.
The phased decarbonization strategy under the Baseline Scenario provides a structured and realistic approach:
Stage 1 (2025–2030)—Capacity Dominance: Focus on expanding renewable energy (RE) installed capacity (particularly wind and solar PV), establishing renewable clean power import channels, and enhancing thermal power flexibility. This stage prioritizes laying the foundation for RE growth through strategic infrastructure development (transmission, GW-scale pumped hydro) and initial market mechanisms for RE consumption.
Stage 2 (2031–2045)—Generation Dominance: Shift focus as RE transitions from a capacity entity to the dominant generation source. Key tasks include maturing the dual mechanism of “Guaranteed Consumption + Market-Based Consumption” for RE, maximizing the utilization of clean power import corridors, strategically deploying new energy storage technologies, and initiating the large-scale application of CCS on thermal units as costs become viable. Enhancing demand-side response capabilities becomes increasingly important.
Stage 3 (2046–2060)—Responsible Entity: Manage the transition where advanced RE (coupled with storage) assumes the Responsible Entity role, providing not only energy but also essential system services (inertia, frequency regulation). This requires the orderly retirement of thermal units, widespread application of cost-effective CCS on remaining fossil fuel plants, large-scale deployment of advanced storage, and fostering societal cost-sharing mechanisms. Mature carbon sink mechanisms are crucial for offsetting residual emissions.
The successful implementation of the Baseline pathway hinges on several interlinked factors:
Continuous RE Expansion: Sustained growth in domestic RE capacity and utilization hours, complemented by secure access to external clean power sources;
System Flexibility Enhancement: This includes completing thermal power flexibility retrofits, deploying large-scale and diversified storage solutions (pumped hydro, new technologies), and significantly improving demand-side response participation and capabilities.
Strategic CCS Deployment: Phased, cost-driven application of CCS on fossil fuel units, becoming significant in Stage 2 and widespread in Stage 3.
Market Mechanism Evolution: Developing mature and integrated electricity markets (capacity, energy, ancillary services) and carbon pricing mechanisms is essential to incentivize investment, optimize resource allocation, manage the dual RE consumption mechanism, and internalize carbon costs.
Societal Engagement: Achieving the Responsible Entity phase necessitates societal acceptance of shared costs (“Cost Sharing, Benefit Sharing”) for system flexibility and integration, alongside participation in demand response and utilization of carbon sinks.
By systematically following the Baseline pathway, Guangdong Province can achieve a substantial and continuous reduction in its power system Carbon Emission Factor. The phased approach ensures a secure and reliable energy transition, balancing decarbonization goals with economic feasibility and technological readiness. The culmination of this pathway positions the province’s power system for carbon neutrality by 2060, characterized by Renewable Energy as the dominant and responsible source, supported by flexibility resources, strategic CCS, and effective carbon offsetting mechanisms.
This study provides a concrete roadmap for Guangdong Province in China and offers valuable insights for other for similar regions globally to pursue deep decarbonization of their power systems within a carbon neutrality framework. Based on this work, future research directions should be focused on detailed techno-economic modeling of the proposed pathway, simulation of typical operation scenarios, further refinement of market design for the dual integration mechanism, the interaction between various key policies at different stages and exploring the societal and policy frameworks needed to support cost-sharing models in the Responsible Entity Stage. The evaluation index system that matches this development path is also a key focus that needs further research.
Acknowledgement: The authors would like to thank the Guangdong Power Grid Co., Ltd. for the support and assistance provided to this research.
Funding Statement: This work was supported by Science and Technology Project of China Southern Power Grid Co., Ltd. (GDKJXM20231259).
Author Contributions: Yang Li (Conceptualization [equal], Formal analysis [equal], Funding acquisition [equal], Project administration [equal], Supervision [equal], Writing—review & editing [equal]), Xianfu Gong (Conceptualization [equal], Data curation [equal], Formal analysis [equal], Investigation [equal], Methodology [equal], Resources [equal], Software [equal], Visualization [equal], Writing—original draft [equal]), Sifan Chen (Project administration [equal], Supervision [equal], Validation [equal], Writing—review & editing [equal]), Yi Lei (Conceptualization [equal], Data curation [equal], Formal analysis [equal], Investigation [equal], Methodology [equal], Resources [equal], Visualization [equal], Writing—review & editing [equal]), Donghui Zhang (Project administration [equal], Supervision [equal], Validation [equal], Writing—original draft [equal]), and Yue Xing (Data curation [equal], Formal analysis [equal], Writing—review & editing [equal]). All authors reviewed approved the final version of the manuscript.
Availability of Data and Materials: The data used to support the findings of this study are available from the corresponding author upon request.
Ethics Approval: Not applicable.
Conflicts of Interest: The authors declare no conflicts of interest.
References
1. Shu YB, Zhang LY, Zhang YZ, Wang YH, Lu G, Yuan B, et al. Carbon peak and carbon neutrality path for China’s power industry. Chin J Eng Sci. 2021;23(6):1–14. (In Chinese). doi:10.15302/j-sscae-2021.06.001. [Google Scholar] [CrossRef]
2. Yu W, Liu C, Chen W, Zhang H, Yu Y, Wang D, et al. Development status and technical challenges of new low-carbon technologies for power systems under the dual-carbon goal. In: Proceedings of the 2024 7th International Conference on Energy, Electrical and Power Engineering (CEEPE); 2024 Apr 26–28; Yangzhou, China. doi:10.1109/CEEPE62022.2024.10586503. [Google Scholar] [CrossRef]
3. Zhao J, Tang Y, Xi L, Yang X, Liu G, Fan H. Spatiotemporal variability analysis of provincial power grid carbon emission factor: a case study of dry and flood seasons. In: Proceedings of the 2025 8th International Conference on Energy, Electrical and Power Engineering (CEEPE); 2025 Apr 25–27; Wuxi, China. doi:10.1109/CEEPE64987.2025.11034305. [Google Scholar] [CrossRef]
4. Peng X, Tao X, Feng K, Hubacek K. Drivers toward a low-carbon electricity system in China’s provinces. Environ Sci Technol. 2020;54(9):5774–82. doi:10.1021/acs.est.0c00536. [Google Scholar] [PubMed] [CrossRef]
5. Liu C, Tang X, Yu F, Zhang D, Wang Y, Li J. Carbon emission measurement method of regional power system based on LSTM-attention model. Sci Tech Energ Transit. 2024;79(1):43. doi:10.2516/stet/2024035. [Google Scholar] [CrossRef]
6. Hauch A, Küngas R, Blennow P, Hansen AB, Hansen JB, Mathiesen BV, et al. Recent advances in solid oxide cell technology for electrolysis. Science. 2020;370(6513):eaba6118. doi:10.1126/science.aba6118. [Google Scholar] [PubMed] [CrossRef]
7. Tahir MF, Chen H, Mehmood K, Ali N, Bhutto JA. Integrated energy system modeling of China for 2020 by incorporating demand response, heat pump and thermal storage. IEEE Access. 2019;7:40095–108. doi:10.1109/ACCESS.2019.2905684. [Google Scholar] [CrossRef]
8. Chen Z, He GS, Shang N. Improved calculation method of power grid carbon emission factor for carbon peak and carbon neutrality goals. South Power Syst Technol. 2024;18(1):153–62. (In Chinese). doi:10.13648/j.cnki.issn1674-0629.2024.01.016. [Google Scholar] [CrossRef]
9. Xu S, Pan W, Wen D. Do carbon emission trading schemes promote the green transition of enterprises? Evidence from China. Sustainability. 2023;15(8):6333. doi:10.3390/su15086333. [Google Scholar] [CrossRef]
10. Ren X, Gao H, Zhang X, Gu J, Hong L. Multivariate low-carbon scheduling of distribution network based on improved dynamic carbon emission factor. Front Energy Res. 2024;12:1380260. doi:10.3389/fenrg.2024.1380260. [Google Scholar] [CrossRef]
11. Wu X, Xu C, Ma T, Xu J, Zhang C. Carbon emission of China’s power industry: driving factors and emission reduction path. Environ Sci Pollut Res. 2022;29(52):78345–60. doi:10.1007/s11356-022-21297-5. [Google Scholar] [PubMed] [CrossRef]
12. Wang Y, Li N, Zhao Z. Mechanisms of digital economy development driving CO2 emission evolution: empirical evidence from China. Clean Energy. 2025;9(3):35–45. doi:10.1093/ce/zkaf001. [Google Scholar] [CrossRef]
13. Shen W, Qiu J, Meng K, Chen X, Dong ZY. Low-carbon electricity network transition considering retirement of aging coal generators. IEEE Trans Power Syst. 2020;35(6):4193–205. doi:10.1109/TPWRS.2020.2995753. [Google Scholar] [CrossRef]
14. Cheng Y, Zhang N, Lu Z, Kang C. Planning multiple energy systems toward low-carbon society: a decentralized approach. IEEE Trans Smart Grid. 2019;10(5):4859–69. doi:10.1109/TSG.2018.2870323. [Google Scholar] [CrossRef]
15. Gong G, Qiang R, Yang J, Hou R, Lv Z, Xu M, et al. A new power system source-end low carbonization evaluation system considering carbon control model. Energies. 2023;16(1):464. doi:10.3390/en16010464. [Google Scholar] [CrossRef]
16. Liu T, Wu Z, Chen C, Chen H, Zhou H. Carbon emission accounting during the construction of typical 500 kV power transmissions and substations using the carbon emission factor approach. Buildings. 2024;14(1):145. doi:10.3390/buildings14010145. [Google Scholar] [CrossRef]
17. Liu T, Liu J, Li Y, Li Y. Balancing the water-carbon trade-off: development of a bi-level source-grid-load synergistic optimization model for multi-regional electric power system. Electronics. 2024;13(3):516. doi:10.3390/electronics13030516. [Google Scholar] [CrossRef]
18. Li B, Cong R, Matsumoto T, Li Y. Research on different energy transition pathway analysis and low-carbon electricity development: a case study of an energy system in Inner Mongolia. Energies. 2025;18(12):3129. doi:10.3390/en18123129. [Google Scholar] [CrossRef]
19. Mahapatra B, Jena D. Asymmetric impacts of renewable energy consumption on carbon emissions: new insights from seven South Asian countries. Clean Energy. 2025;9(3):62–73. doi:10.1093/ce/zkae120. [Google Scholar] [CrossRef]
20. Maximov SA, Harrison GP, Friedrich D. Long term impact of grid level energy storage on renewable energy penetration and emissions in the Chilean electric system. Energies. 2019;12(6):1070. doi:10.3390/en12061070. [Google Scholar] [CrossRef]
21. Yao M, Hu Z, Zhang N, Duan W, Zhang J. Low-carbon benefits analysis of energy-intensive industrial demand response resources for ancillary services. J Mod Power Syst Clean Energy. 2015;3(1):131–8. doi:10.1007/s40565-015-0102-6. [Google Scholar] [CrossRef]
22. Teng J, Yin H, Wang P. Study on the operation strategies and carbon emission of heating systems in the context of building energy conservation. Energy Sci Eng. 2023;11(7):2421–30. doi:10.1002/ese3.1463. [Google Scholar] [CrossRef]
23. Oshiro K, Fujimori S. Limited impact of hydrogen co-firing on prolonging fossil-based power generation under low emissions scenarios. Nat Commun. 2024;15(1):1778. doi:10.1038/s41467-024-46101-5. [Google Scholar] [PubMed] [CrossRef]
24. Cai Y, Loi EH, Tung CL, Wang H, Zheng J. Clean energy development and low-carbon transition in China’s power industry. Front Environ Sci. 2025;12:1525047. doi:10.3389/fenvs.2024.1525047. [Google Scholar] [CrossRef]
25. Fu C, Lan L, Chen S, Guo M. A coupling model for low-carbon power supply security and flexible resource demand. In: Proceedings of the 2024 Boao New Power System International Forum-Power System and New Energy Technology Innovation Forum (NPSIF); 2024 Dec 8–10; Qionghai, China. doi:10.1109/NPSIF64134.2024.10883221. [Google Scholar] [CrossRef]
26. Meng Q, Zu G, Ge L, Li S, Xu L, Wang R, et al. Dispatching strategy for low-carbon flexible operation of park-level integrated energy system. Appl Sci. 2022;12(23):12309. doi:10.3390/app122312309. [Google Scholar] [CrossRef]
27. Xue M. Low-carbon economic dispatch of regional microgrids with flexible loads. J Phys Conf Ser. 2025;2932(1):012003. doi:10.1088/1742-6596/2932/1/012003. [Google Scholar] [CrossRef]
28. Ma C, Hu Z. Low-carbon economic scheduling of integrated energy system considering flexible supply-demand response and diversified utilization of hydrogen. Sustainability. 2025;17(4):1749. doi:10.3390/su17041749. [Google Scholar] [CrossRef]
29. Dang Y, Wang W. Low-carbon economic scheduling of hydrogen-integrated energy systems with enhanced bilateral supply-demand response considering vehicle to grid under power-to-gas-carbon capture system coupling. Processes. 2025;13(3):636. doi:10.3390/pr13030636. [Google Scholar] [CrossRef]
30. Zhang C, Kuang Y. Low-carbon economy optimization of integrated energy system considering electric vehicles charging mode and multi-energy coupling. IEEE Trans Power Syst. 2024;39(2):3649–60. doi:10.1109/TPWRS.2023.3280067. [Google Scholar] [CrossRef]
31. Wang Y, Qiu D, He Y, Zhou Q, Strbac G. Multi-agent reinforcement learning for electric vehicle decarbonized routing and scheduling. Energy. 2023;284:129335. doi:10.1016/j.energy.2023.129335. [Google Scholar] [CrossRef]
32. Noble D, Wu D, Emerson B, Sheppard S, Lieuwen T, Angello L. Assessment of current capabilities and near-term availability of hydrogen-fired gas turbines considering a low-carbon future. J Eng Gas Turbines Power. 2021;143(4):041002. doi:10.1115/1.4049346. [Google Scholar] [CrossRef]
33. Su W, Zheng W, Li Q, Yu Z, Han Y, Bai Z. Capacity configuration optimization for green hydrogen generation driven by solar-wind hybrid power based on comprehensive performance criteria. Front Energy Res. 2023;11:1256463. doi:10.3389/fenrg.2023.1256463. [Google Scholar] [CrossRef]
34. Wu GL, Zheng W, He L, Wang L, Huang Y, Liu JY. Energy management strategy for smart commercial buildings considering electric vehicle charging patterns and building thermal inertia. Integr Intell Energy. 2025;47(7):12–22. (In Chinese). doi:10.3969/j.issn.2097-0706.2025.07.002. [Google Scholar] [CrossRef]
35. Obi D, Onyekuru S, Orga A. Minimizing carbon capture costs in power plants: a novel dimensional analysis framework for techno-economic evaluation of oxyfuel combustion, pre-combustion, and post-combustion capture systems. Energy Sci Eng. 2025;13(4):1749–70. doi:10.1002/ese3.2089. [Google Scholar] [CrossRef]
36. Baliga UB. The role of carbon capture and hydrogen in the energy transition. In: Proceedings of the Offshore Technology Conference; 2024 May 6–9; Houston, TX, USA. doi:10.4043/35414-ms. [Google Scholar] [CrossRef]
37. Peng L, Guo Y, Liu S, He G, Mauzerall DL. Subsidizing grid-based electrolytic hydrogen will increase greenhouse gas emissions in coal dominated power systems. Environ Sci Technol. 2024;58(12):5187–95. doi:10.1021/acs.est.3c03045. [Google Scholar] [PubMed] [CrossRef]
38. Hertwich EG, Gibon T, Bouman EA, Arvesen A, Suh S, Heath GA, et al. Integrated life-cycle assessment of electricity-supply scenarios confirms global environmental benefit of low-carbon technologies. Proc Natl Acad Sci U S A. 2015;112(20):6277–82. doi:10.1073/pnas.1312753111. [Google Scholar] [PubMed] [CrossRef]
39. Berrill P, Arvesen A, Scholz Y, Gils HC, Hertwich EG. Environmental impacts of high penetration renewable energy scenarios for Europe. Environ Res Lett. 2016;11(1):014012. doi:10.1088/1748-9326/11/1/014012. [Google Scholar] [CrossRef]
40. Wang Y, Tang B. A multi-timescale optimization method for integrated energy systems with carbon capture and accounting. J Comput Meth Sci Eng. 2024;24(1):69–86. doi:10.3233/jcm-247166. [Google Scholar] [CrossRef]
41. Zhu Z, Cheng L, Shen T. Spontaneous formation of evolutionary game strategies for long-term carbon emission reduction based on low-carbon trading mechanism. Mathematics. 2024;12(19):3109. doi:10.3390/math12193109. [Google Scholar] [CrossRef]
42. Sun Z. Hydrogen energy: development prospects, current obstacles and policy suggestions under China’s dual carbon goals. Chin J Urb Environ Stud. 2023;11:2350006. doi:10.1142/s2345748123500069. [Google Scholar] [CrossRef]
43. Ji B, Li YG, Chang L, Li LL, Tu SS, Qian J. Analysis of the logic and strategies for thermal power entities’ participation in electricity-carbon market decision making. Integr Intell Energy. 2025;47(5):51–61. (In Chinese). doi:10.3969/j.issn.2097-0706.2025.05.006. [Google Scholar] [CrossRef]
44. Li Y, Xiao D, Chen H, Cai W, Campos J. Analyzing the wind-dominant electricity market under coexistence of regulated and deregulated power trading. Energy Eng. 2024;121(8):2093–127. doi:10.32604/ee.2024.049232. [Google Scholar] [CrossRef]
45. Zhang Y, Xu X. Carbon emission efficiency measurement and influencing factor analysis of nine provinces in the Yellow River Basin: based on SBM-DDF model and tobit-CCD model. Environ Sci Pollut Res Int. 2022;29(22):33263–80. doi:10.1007/s11356-022-18566-8. [Google Scholar] [PubMed] [CrossRef]
46. Shu YB, Zhang ZG, Guo JB, Zhang ZL. Study on key factors and solution of renewable energy accommodation. Proc CSEE. 2017;37(1):1–9. (In Chinese). doi:10.13334/j.0258-8013.pcsee.162555. [Google Scholar] [CrossRef]
Cite This Article
 Copyright © 2026 The Author(s). Published by Tech Science Press.
This work is licensed under a Creative Commons Attribution 4.0 International License , which permits unrestricted use, distribution, and reproduction in any medium, provided the original work is properly cited.
 Downloads
 Citation Tools