
 Submit a Paper
 Propose a Special lssue
 Open Access
ARTICLE

The Evaluation of Re-Fracturing Potential for Horizontal Wells in Tight Oil Reservoirs Based on Coupled Flow and Geomechanical Modeling
1 Production Technology Research Institute, PetroChina Xinjiang Oilfield Company, Karamay, 834000, China
2 College of Petroleum Engineering, China University of Petroleum (Beijing), Beijing, 102249, China
* Corresponding Author: Shijie Shen. Email:
Energy Engineering 2026, 123(4), 24 https://doi.org/10.32604/ee.2025.072416
Received 26 August 2025; Accepted 28 October 2025; Issue published 27 March 2026
 View Full Text
 Download PDF
Abstract
Re-fracturing horizontal wells is a critical strategy for enhancing recovery from tight oil reservoirs, but its success depends on the evaluation of candidate wells and locations. This process is complicated by production-induced alterations in reservoir pressure and geomechanical responses. This study introduces a workflow to evaluate re-fracturing potential by integrating coupled fluid flow and geomechanical modeling for the production of initial hydraulic fractures. We developed a numerical model that simulates the poroelastic response of a tight oil reservoir to depletion from an initial set of hydraulic fractures. To quantify the re-fracturing potential along the horizontal wellbore, a novel composite re-fracturing potential index is proposed where fracture shape, stress, and pressure are considered. This index considers four key physical factors: current reservoir pressure, fracture initiation ease, fracture geometry favorability, and fracture propagation efficiency considering tortuosity. Numerical simulations were conducted for scenarios with both uniform and non-uniform initial hydraulic fractures. The results consistently demonstrate that the optimal locations for re-fracturing are the midpoints between existing fractures, where a favorable balance of high reservoir pressure and altered stress conditions exists. The analysis reveals that the overall re-fracturing potential tends to increase with production time, suggesting that a period of depletion can enhance the geomechanical conditions for subsequent stimulation. Furthermore, a sensitivity analysis on the index weighting factors shows that the optimum re-fracturing strategy is highly dependent on the primary field objective, whether it is maximizing resource contact, ensuring geomechanical feasibility, or avoiding operational complexity. The study concludes that heterogeneity in the initial fracture network creates complex and asymmetric potential profiles, which implies the necessity of case-specific and integrated analysis over simplified assumptions. The proposed methodology provides a framework for optimizing re-fracturing designs in tight oil reservoirs.Keywords
The use of multi-stage hydraulic fracturing in horizontal wells helps to produce tight oil resources. However, based on field observations, high initial production rates are often followed by rapid declines [1]. The rapid decline indicates rather limited productivity in tight oil reservoirs developed by hydraulically fractured wells. In response, re-fracturing has evolved from a remedial action for underperforming wells into a proactive reservoir management strategy. It offers a cost-effective method to enhance recovery by producing tight oil not depleted by the first round of fracturing. Field studies from major North American tight oil plays provide evidence that re-fracturing is a highly profitable option with proper candidate selection and design. A comprehensive analysis of re-fractured wells in the Bakken and Eagle Ford shales revealed substantial increases in EUR (Estimated Ultimate Recovery) [2,3]. Therefore, re-fracturing is a viable method in unconventional reservoirs when the initial production performance is limited.
The quality of re-fracturing is affected by multiple factors. The process is technically complex due to significant alterations in reservoir stress and pressure induced by initial stimulation and production [4,5]. Therefore, a rigorous evaluation of re-fracturing potential and quality is critical. This evaluation must extend beyond simple production metrics to include an integrated analysis of geomechanics, reservoir properties, and completion engineering. An effective re-fracturing treatment should be characterized by an engineering intervention designed to create new fracture networks in previously bypassed rock, governed by the new production-altered stress field. A successful re-stimulation design is fundamentally based on reservoir geomechanics. The mechanical state of the reservoir, specifically the in-situ stress field, is the dominant factor controlling hydraulic fracture geometry [6,7]. In re-fracturing, the stress field is not static but has been dynamically altered by legacy production and couple flow-geomechanical effects [8]. Understanding these changes is the key to creating new, productive fracture networks. Producing hydrocarbons depletes pore pressure in the stimulated reservoir volume, and this localized depletion causes the rock matrix to deform, which can significantly reorient the principal stress directions in the near-fracture region. Specifically, the horizontal stress component parallel to the primary fracture can even decrease to the point where it becomes the new minimum horizontal stress, indicating local stress reversal [9]. This stress reorientation is the primary mechanism that makes re-fracturing effective, as it allows nonplanar and transverse fractures to propagate into the undrained rock between the initial fracture stages. This process is complicated by the stress shadow effect, which represents a zone of enhanced compressive stress created by the opening of the original fractures [10]. These stress shadows can inhibit the propagation of new hydraulic fractures passing through. The quality of a re-fracturing treatment depends on the interplay between this stress shadow and the depletion-driven stress reorientation. An optimal time window for re-fracturing opens when production-induced depletion has sufficiently overcome the initial stress shadows to allow for the creation of new fracture networks. Selecting the right candidate wells is the most critical step in a re-fracturing program [11]. Methodologies have evolved from simple screening to more sophisticated frameworks that integrate geology, engineering, and data science. The fundamental approach begins with analyzing reservoir quality and historical well performance, and a key factor is the presence of sufficient remaining oil in place to target. Wells in areas with favorable properties such as significant net pay thickness and porosity are prioritized. From a performance perspective, wells with high initial production followed by a steep decline are often considered prime candidates, as this profile suggests good reservoir quality but an inefficient or degraded initial completion [3]. Identifying or predicting this potential depends on a complex interplay of factors, and researchers have developed systematic and multi-criteria decision-making frameworks. An approach is the analytic hierarchy process, which structures the decision into a hierarchy of major criteria, such as reserve capacity and initial completion efficiency. These criteria are then broken down into specific measurable parameters like net pay thickness, porosity, horizontal section length, and initial proppant volume. Grey relation analysis and fuzzy logic are often used with analytic hierarchy process to objectively weigh the importance of each parameter and account for uncertainty, resulting in a comprehensive evaluation score for ranking candidate wells [11]. The availability of field datasets has enabled the use of data-driven and machine learning techniques [12,13]. Algorithms are trained on comprehensive databases of past re-fracturing jobs [14]. These models are used to correlate non-linear relationships between geological, completion, and production parameters and the re-fracturing outcome. Once established, these models can predict the potential success for new candidate wells, representing a shift towards empirical and data-centric decision-making [15].
Predictive modeling is essential for quantitative forecasts of fracture geometry and production [16,17]. Advanced numerical simulators are used to capture the coupled geomechanical and fluid flow physics that govern fracture propagation in an altered stress field [18]. These models can simulate the creation of new transverse fractures and their interaction with natural fracture systems and stress shadows from original fractures [10]. These models can help to provide critical physical insights with relatively high accuracies, while they can be computationally expensive. Analytical and semi-analytical models can play a crucial role as well. These models use simplified mathematical solutions to provide rapid production forecasts [19]. Semi-analytical models based on the volumetric source method offer a reasonable compromise by representing complex fracture geometries efficiently, making them well-suited for history matching and forecasting [20]. To improve the efficacy, a robust workflow can be used to leverage both approaches: numerical simulation is used to predict the physical evolutions based on geomechanics, and these evolutions are then used as an input for a semi-analytical model to rapidly forecast production and optimize the treatment design for maximum economic return [21]. These methods are also associated with validation. Far-field techniques like microseismic monitoring can map the geometry and extent of the newly created fracture network, confirming whether the treatment accessed untapped reservoir volumes [22]. Near-wellbore diagnostics have become useful: distributed temperature sensing and distributed acoustic sensing can identify perforation clusters accepting fluid in real-time, evaluating the effectiveness of diversion techniques [23]. The integration of these diagnostic tools can confirm successful diversion, while microseismic mapping visualizes the resulting far-field fracture geometry. Although earlier research has concentrated on specific elements influencing re-fracturing, a thorough index that incorporates a number of physical parameters is still missing.
The evaluation of re-fracturing potential can be based on a workflow that integrates geomechanics, data analytics, and predictive modeling. This has transformed re-fracturing from a tactical intervention into a strategic component of unconventional field development. This study presents a numerical study to evaluate re-fracturing potential for horizontal wells with initial hydraulic fractures in a tight oil reservoir. Coupled flow and geomechanical modeling and data analyses are carried out to understand the candidate locations for re-fracturing operations. The study can be used as a reference for re-fracturing optimization in tight oil reservoirs similar to the study area discussed in this work.
2.1 Coupled Flow and Geomechanical Model
This work utilizes a numerical model to simulate the coupled flow-geomechanical behavior of a porous medium representative of a typical tight oil reservoir. The formulation couples single-phase fluid flow with the geomechanical response of the solid matrix. This is achieved by solving the governing equations for fluid flow and solid mechanics in a fully coupled manner, which accounts for the interactions between pore pressure changes and rock deformation. The model is developed under the assumptions of isothermal conditions, linear elasticity, and small deformations, which are considered valid for many reservoir engineering applications.
The mechanical behavior of the reservoir rock is described by linear poroelasticity. The geomechanical equilibrium is governed by the conservation of momentum. Assuming quasi-static conditions, where inertial forces are negligible compared to the stress gradients, the equilibrium equation is expressed as:
where
The strain tensor
where
The constitutive relationship between stress and strain is defined by the effective stress principle. The elastic component of the total stress as the elastic stress tensor
where
The transport of a single-phase and slightly compressible fluid in the porous medium is described by the continuity equation based on the conservation of fluid mass. The governing equation is:
where κ is the absolute permeability in m2; μ is the dynamic viscosity in Pa·s; p is the pore fluid pressure in Pa.
To simulate hydrocarbon production, a well mode is incorporated into the model. The wellbore pressure is treated as a boundary condition and is defined as the average pressure over the surface area of the wellbore within the computational domain. This is expressed as:
here, it states that the bottom-hole pressure
2.2 Quantification of Re-Fracturing Potential
To identify the promising locations for re-stimulation along the horizontal wellbore, a composite re-fracturing potential index is proposed. This index integrates relevant hydraulic and mechanical parameters obtained from coupled simulation results into a quantitative metric. The index is designed to evaluate the potential of a given wellbore segment based on four factors: the remaining fluid resource (pressure), the ease of fracture initiation (minimum stress), the favorability of fracture geometry (differential stress), and the expected fracture propagation efficiency (stress reorientation). The index is calculated as a weighted mean of four normalized sub-indices, each representing one of the physical factors mentioned above. A geometric mean is employed as a low score in any single critical factor can significantly lower the overall potential, which can improve the comprehensiveness of the evaluation quantity.
The general form of the index is shown as:
where
The index
where a value approaching 1 indicates minimal depletion, while a value approaching the abandonment pressure ratio indicates a depleted zone with low potential.
The index
where a higher value is the location with the lower stress (easiest to fracture).
Another index is
The index
The last index
This yields a value of 1 for zero reorientation and trends towards 0 as the reorientation approaches 90 degrees representing the highest potential for tortuosity.
In the numerical analysis, two sets of investigations are carried out: the first study is focused on a symmetric problem with uniform initial fractures, and the second study is focused on a case where uneven initial hydraulic fractures are considered. In each case, the effect of depletion in the initial fractures is simulated and the subsequent re-fracturing potential is evaluated.
3.1 Re-Fracturing Potential Evaluation with Uniform Initial Hydraulic Fractures
In the first analysis, a horizontal wellbore with uniform and evenly distributed initial hydraulic fractures is studied. Depletion effects based on the coupled flow and geomechanical model are simulated and the subsequent re-fracturing potential is discussed. The parameters used in the simulation are shown in Table 1.
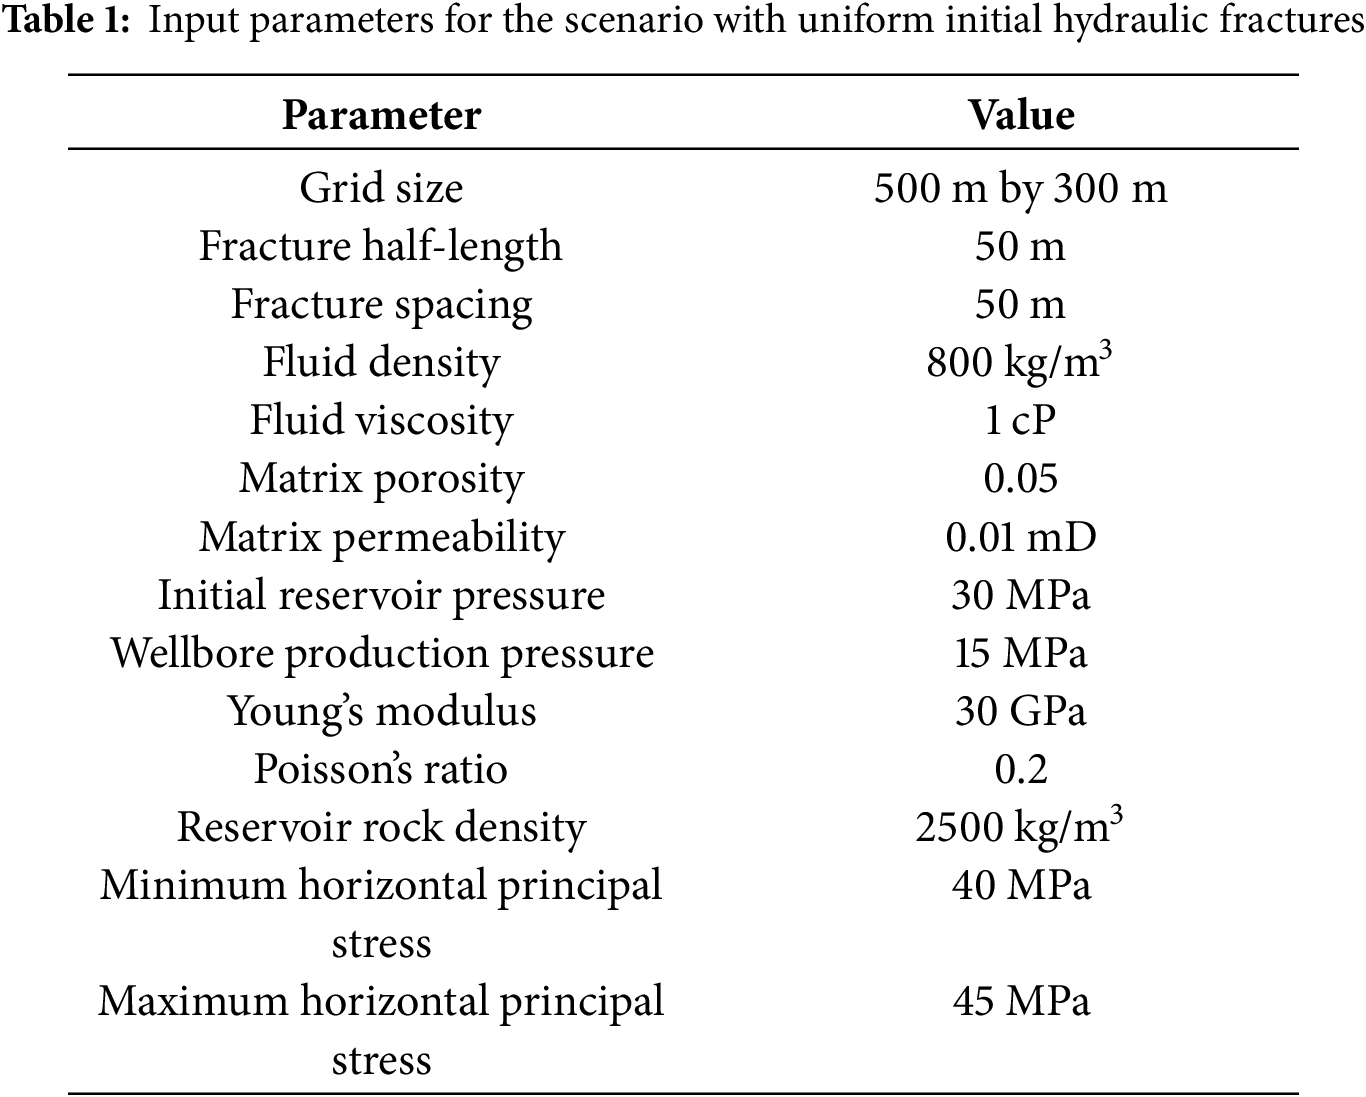
Based on the parameters in Table 1 and the simulation, re-fracturing potential evaluation is carried out. Here, the weights of the four subindices are all 0.25 in Eq. (7). Fig. 1 shows the spatial distribution of relevant properties after 300 days of depletion, where the distribution of (a) pressure, (b) Sx, (c) Sy, and (d) reorientation angle of
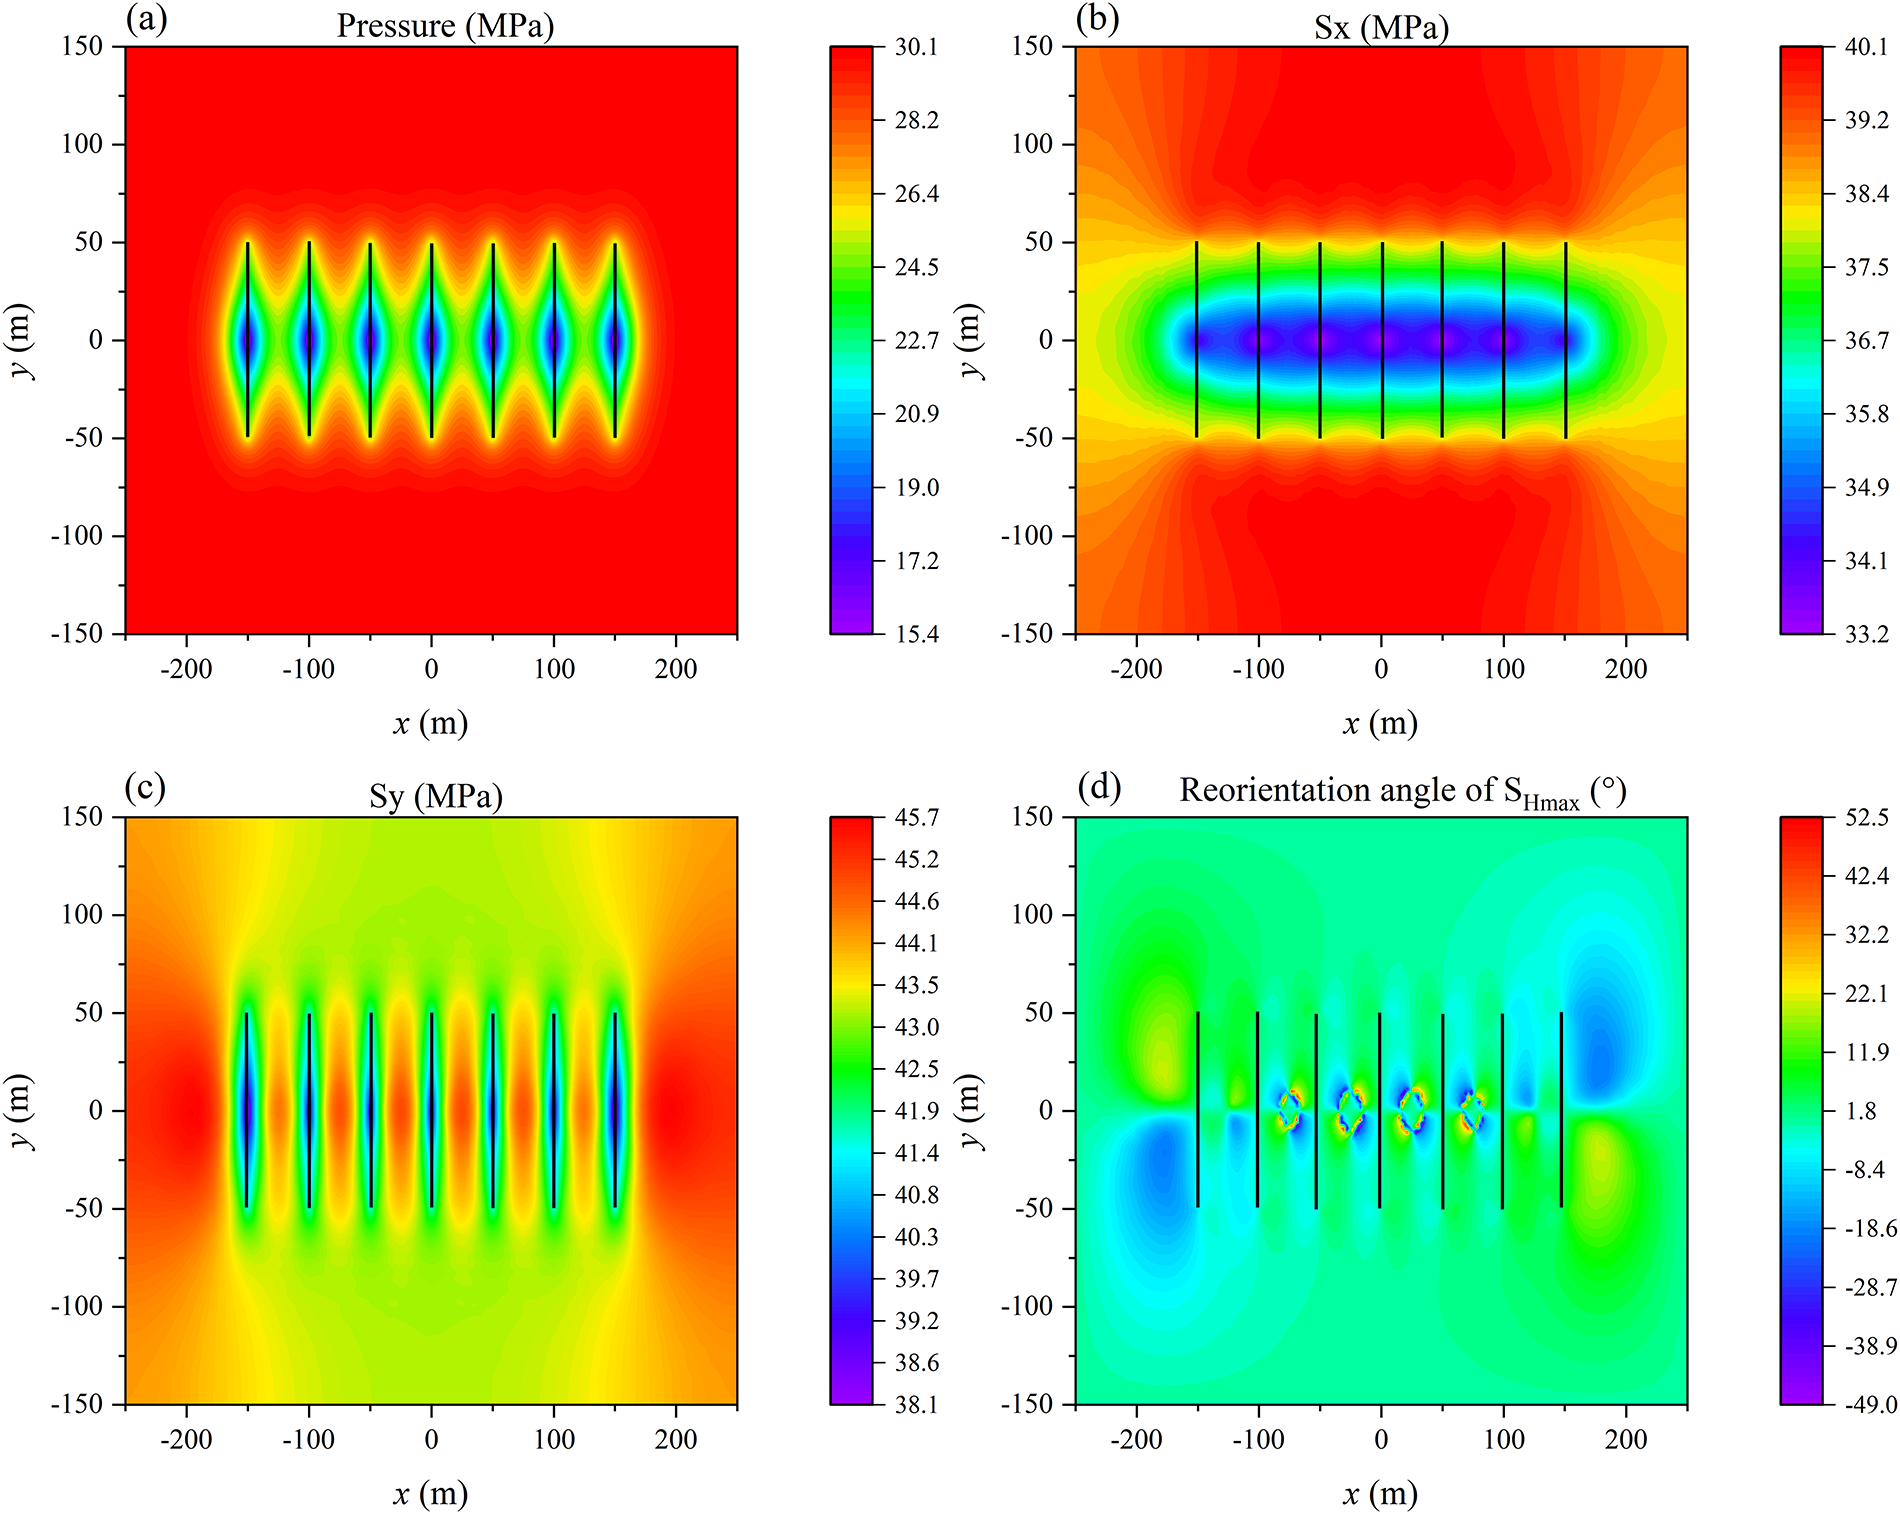
Figure 1: Spatial distribution of relevant properties of (a) pressure, (b) Sx, (c) Sy, and (d) reorientation angle of
Sx and Sy respond heterogeneously to this depletion. Sx experiences a significant drop in the areas between the fractures to approximately 33 MPa. In contrast, Sy decreases in the region directly adjacent to the fractures but increases in the inter-fracture regions to slightly over 45 MPa. This phenomenon is attributed to induced stress shadowing and stress arching. It is directly attributed to the geomechanical equilibrium equation, where the load from the depleted and compacted rock is transferred to the surrounding rock mass. The outcome of these anisotropic stress changes is the reorientation of the principal stress direction. The initial
The one-dimensional distributions of the re-fracturing subindices and the final re-fracturing potential index along the horizontal wellbore provide insights into how candidate locations for re-stimulation evolve over time. The analysis focuses on the segments between existing hydraulic fractures, located at x = 0, 50, 100, and 150 m. Due to symmetry, the other half is not included. The subindices are
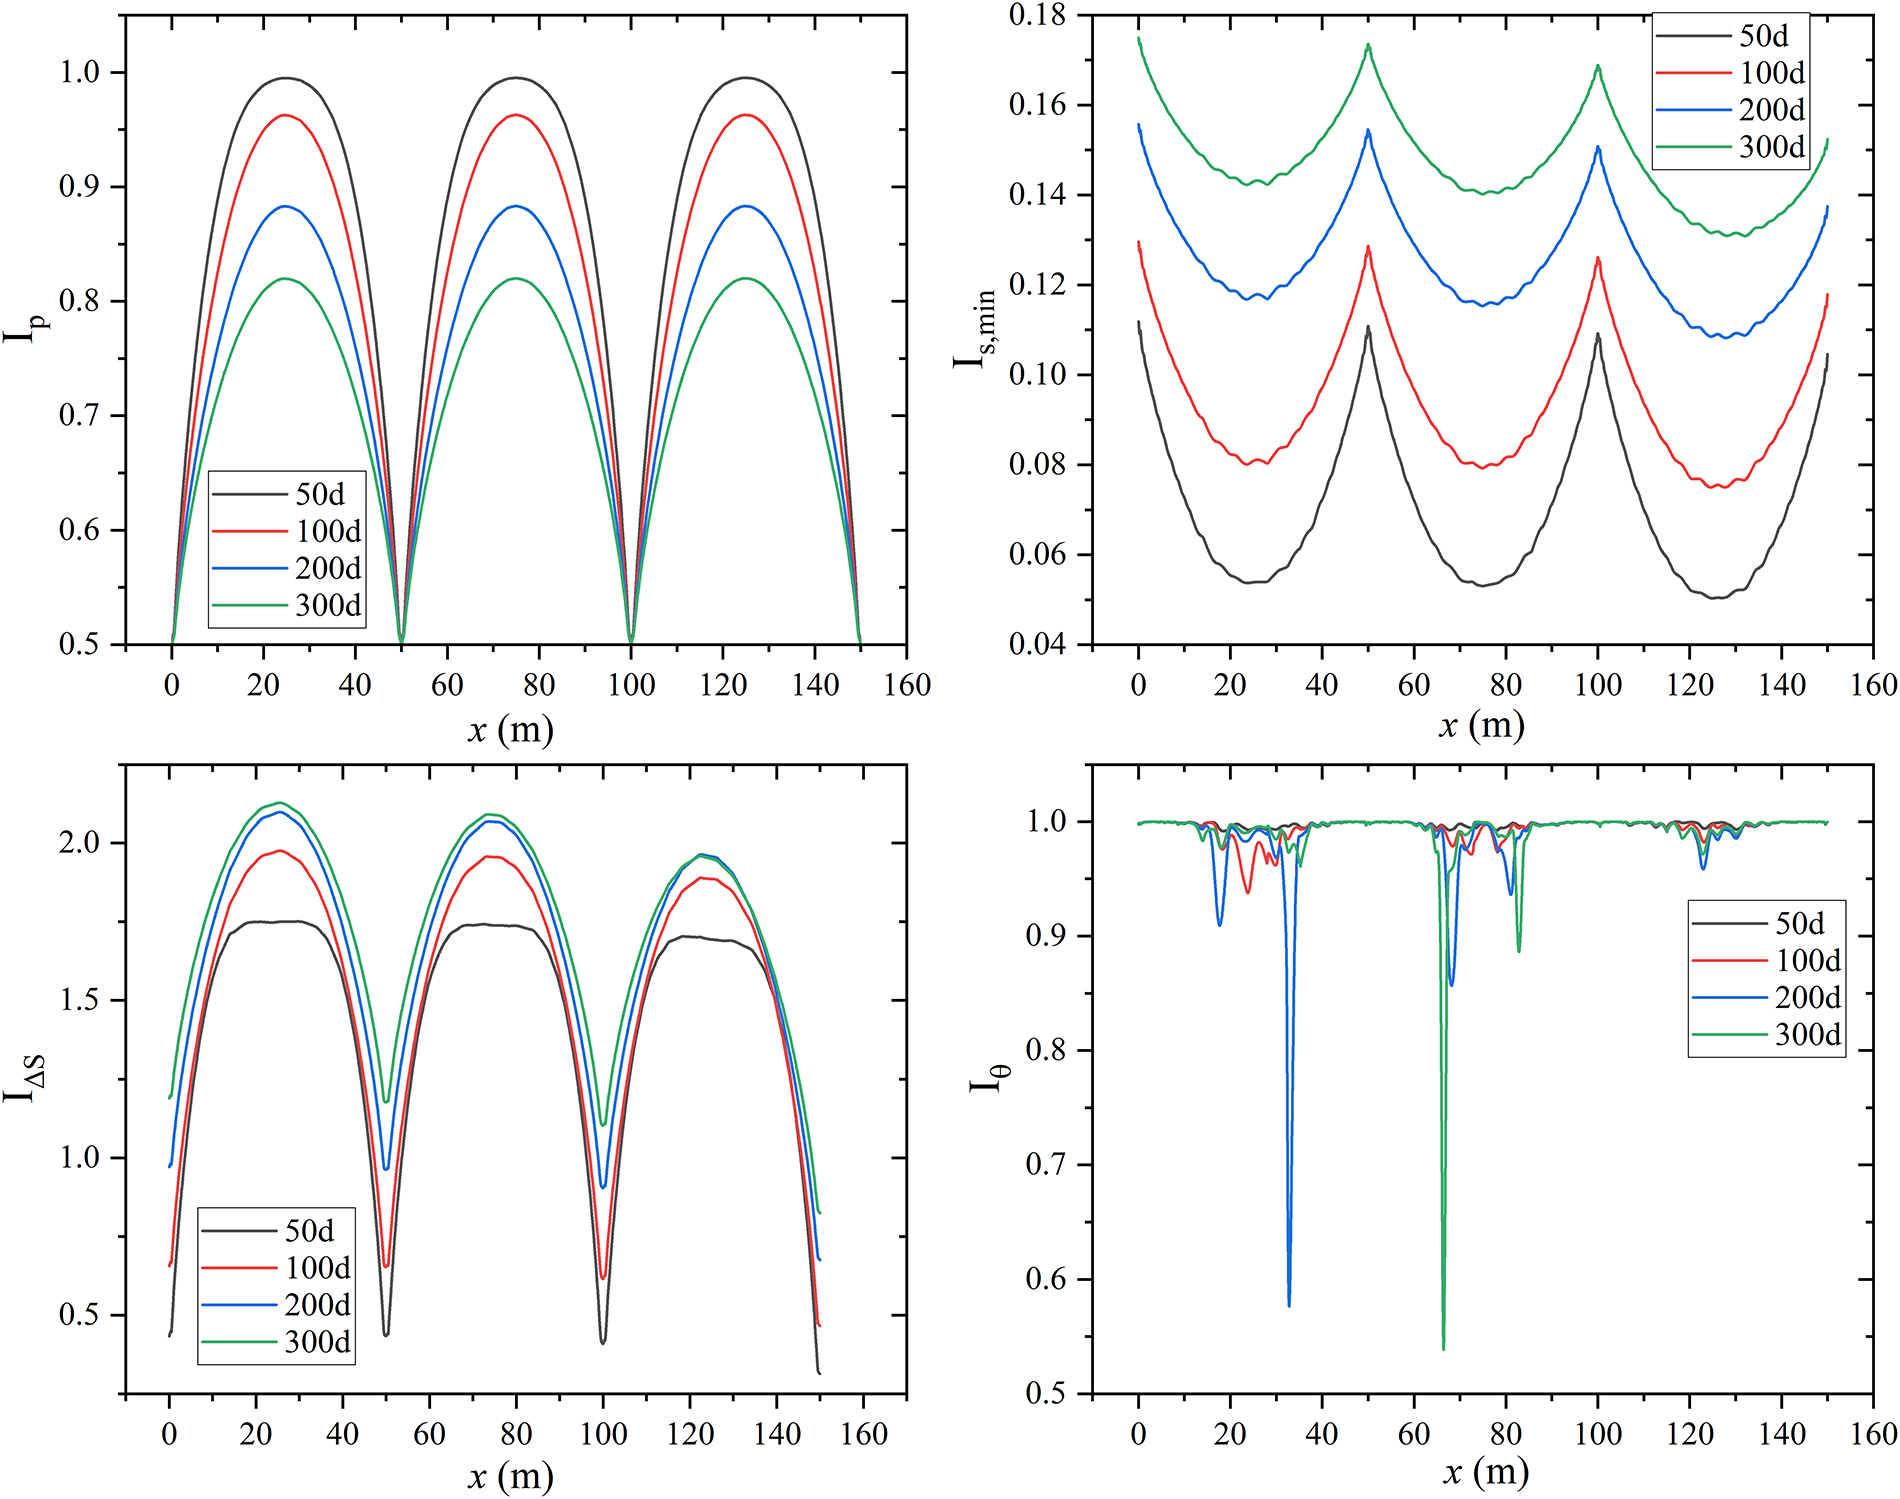
Figure 2: Distribution of subindices along the horizontal wellbore from x = 0 m to x = 150 m after 50, 100, 200, and 300 days of production
In contrast to the pressure index,
The potential for fracture tortuosity quantifies the resistance during fracture growth due to nonplanar geometries. For most of the wellbore length,
The comprehensive analysis of these four indices reveals that the optimal candidate for re-fracturing is not solely dependent on remaining reserves but is a complex trade-off between high reservoir pressure, low minimum stress, manageable stress anisotropy, and low potential for fracture tortuosity. The inter-fracture midpoints emerge as primary candidates due to favorable pressure and minimum stress conditions, though the increasing stress anisotropy and localized tortuosity potential must be carefully considered in the design of a re-stimulation treatment.
Then, the general re-fracturing potential index along the horizontal wellbore from x = 0 m to x = 150 m after 50, 100, 200, and 300 days of production is quantified. The index provides a more comprehensive evaluation of re-fracturing potential by integrating the multiple physical phenomena previously analyzed. Fig. 3 presents the spatial distribution and temporal evolution of the RPI calculated along the horizontal wellbore using the geometric average method. The results clearly show that the index is consistently maximized at the midpoints between the existing hydraulic fractures (x = 0, 25, 75, and 125 m) and minimized at the locations of the initial hydraulic fractures. This spatial pattern is the integrated outcome of the competing factors captured by the subindices. The dominant contributions to the high index at the midpoints are the substantial remaining oil (reservoir pressure) and the lower minimum principal stress. These factors combine to make the less-depleted inter-fracture regions the most promising re-fracturing targets. The sharp drops observed on the index curves particularly on the 200-day and 300-day profiles are directly caused by the fracture tortuosity subindex. They effectively penalize localized zones with a higher risk of unwanted nonplanar fracture growth.
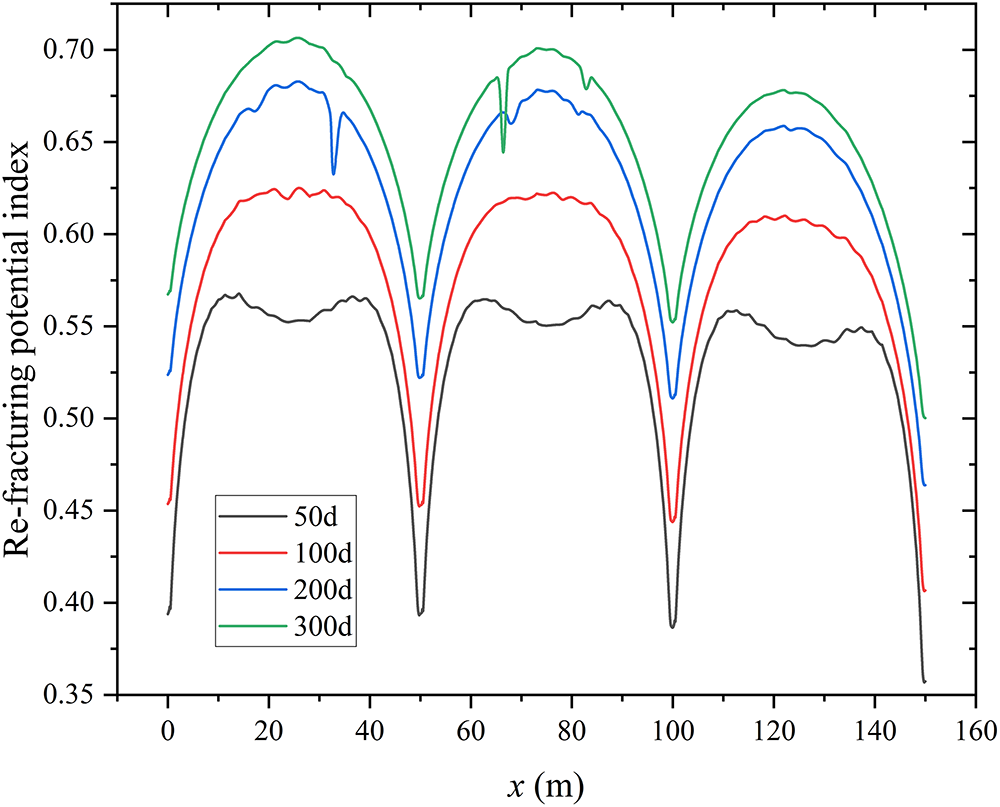
Figure 3: Distribution of re-fracturing potential index (geometric mean) along the horizontal wellbore from x = 0 m to x = 150 m after 50, 100, 200, and 300 days of production
Another observation from this analysis is the temporal evolution of the index. As production time increases from 50 to 300 days, the overall magnitude increases across the entire horizontal wellbore segment. This trend suggests that the reservoir becomes more amenable to successful re-fracturing over time. The combined effects of the evolving stress field and sustained pressure differentials tend to create increasingly favorable conditions that outweigh potentially detrimental factors like increased stress anisotropy. From a practical perspective, this analysis not only shows the inter-fracture midpoints as the optimal geometric locations for re-fracturing but also suggests that a period of extended production can enhance the geomechanical and reservoir conditions for a subsequent re-fracturing treatment, potentially leading to a higher likelihood of success.
Fig. 4 presents the spatial distribution and temporal evolution of RPI calculated along the horizontal wellbore using the arithmetic average method. Similarly to the geometric mean method, the arithmetic mean method also confirms this spatial distribution pattern of the index, with maxima at the midpoints between existing hydraulic fractures (x = 0, 25, 75, 125 m) and minima at the locations of the initial fractures. Both methods calculate a RPI that exhibits significant spatial heterogeneity. As the production time increases from 50 to 300 days, the contrast between the high and low values on the index curve becomes more pronounced. This indicates that production operations exacerbate the heterogeneity of reservoir properties around the wellbore, thereby making the optimal re-fracturing targets more distinct.
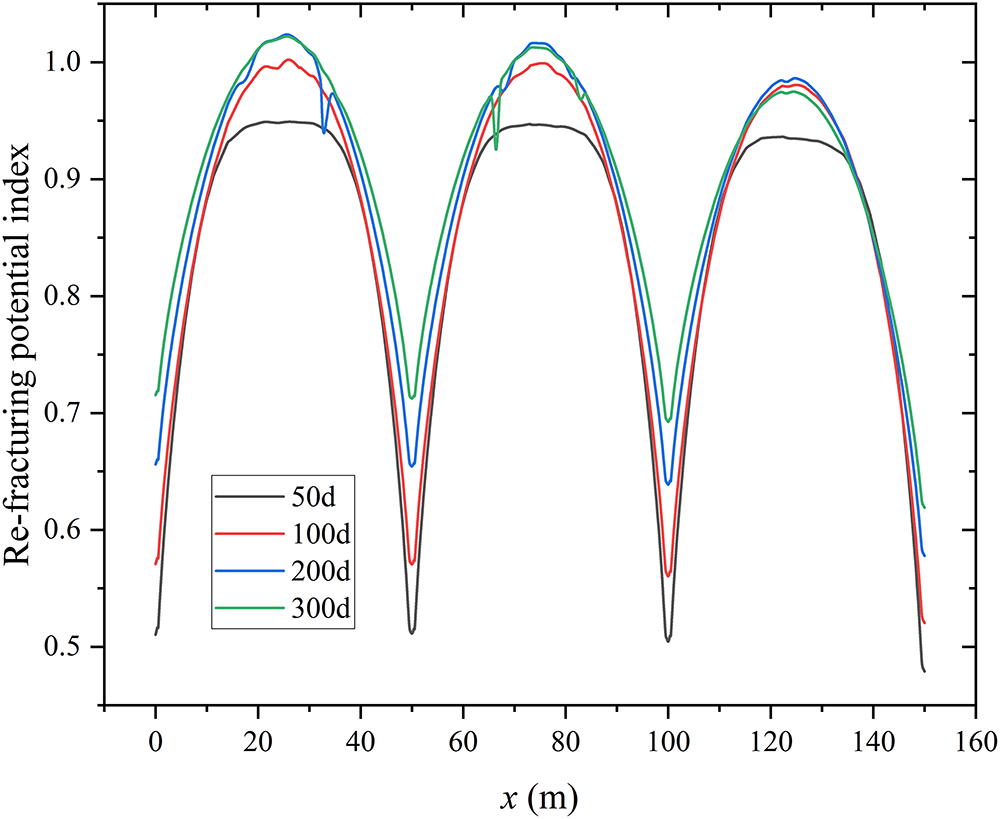
Figure 4: Distribution of re-fracturing potential index (arithmetic mean) along the horizontal wellbore from x = 0 m to x = 150 m after 50, 100, 200, and 300 days of production
In summary, for the evaluation of re-fracturing potential, the geometric mean method is more effective and conservative in identifying high-quality targets where all sub-indices are relatively balanced without significant weaknesses, owing to its high sensitivity to low-value indicators. The resulting index distribution (as shown in Fig. 3) exhibits a more pronounced contrast between peaks and troughs, enabling a clearer distinction between high-potential sweet spots and risky zones. Consequently, it provides a decision-making basis with lower associated risk for fracture design. Therefore, the geometric mean method is a more scientific and appropriate choice than the arithmetic mean method in this application context.
3.1.2 Effects of Weighting Factors
In the previous analysis, the weighting factors for the four subindices are equally 0.25, summing up to 1. This is based on the assumption that each index contributes equally to re-fracturing potential. However, in practical field applications, the re-fracturing strategy can be modified to specific objectives. If the field objective is to maximize contact with remaining oil, the weighting factor for the pressure index should be more important; if the objective is to minimize fracture tortuosity and to lower breakdown pressure for better fracturing operation, the weighting factors for
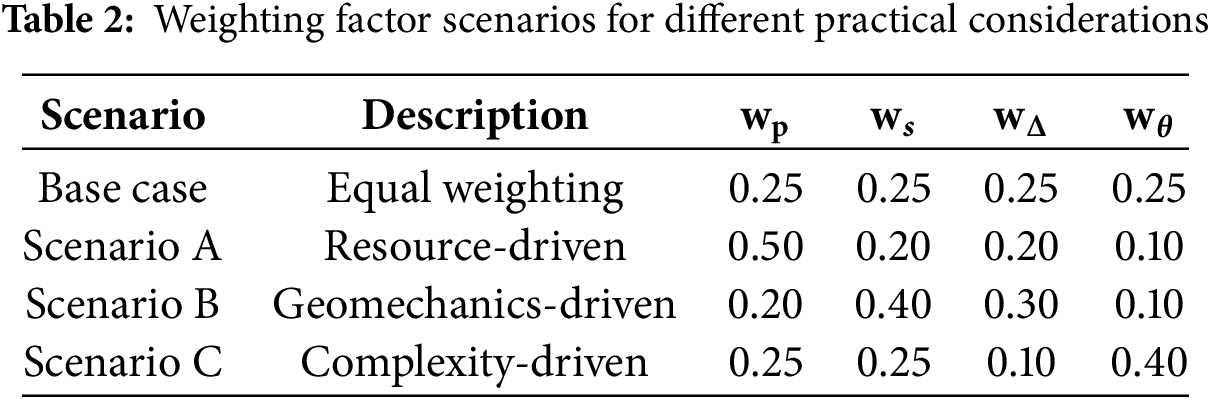
Results are shown in Fig. 5. Based on the defined weighting scenarios, the resulting index was calculated, and the spatial and temporal distributions are presented. The analysis reveals that the strategic priority reflected by the weighting factors alters both the optimum location and the re-stimulation treatment timing.
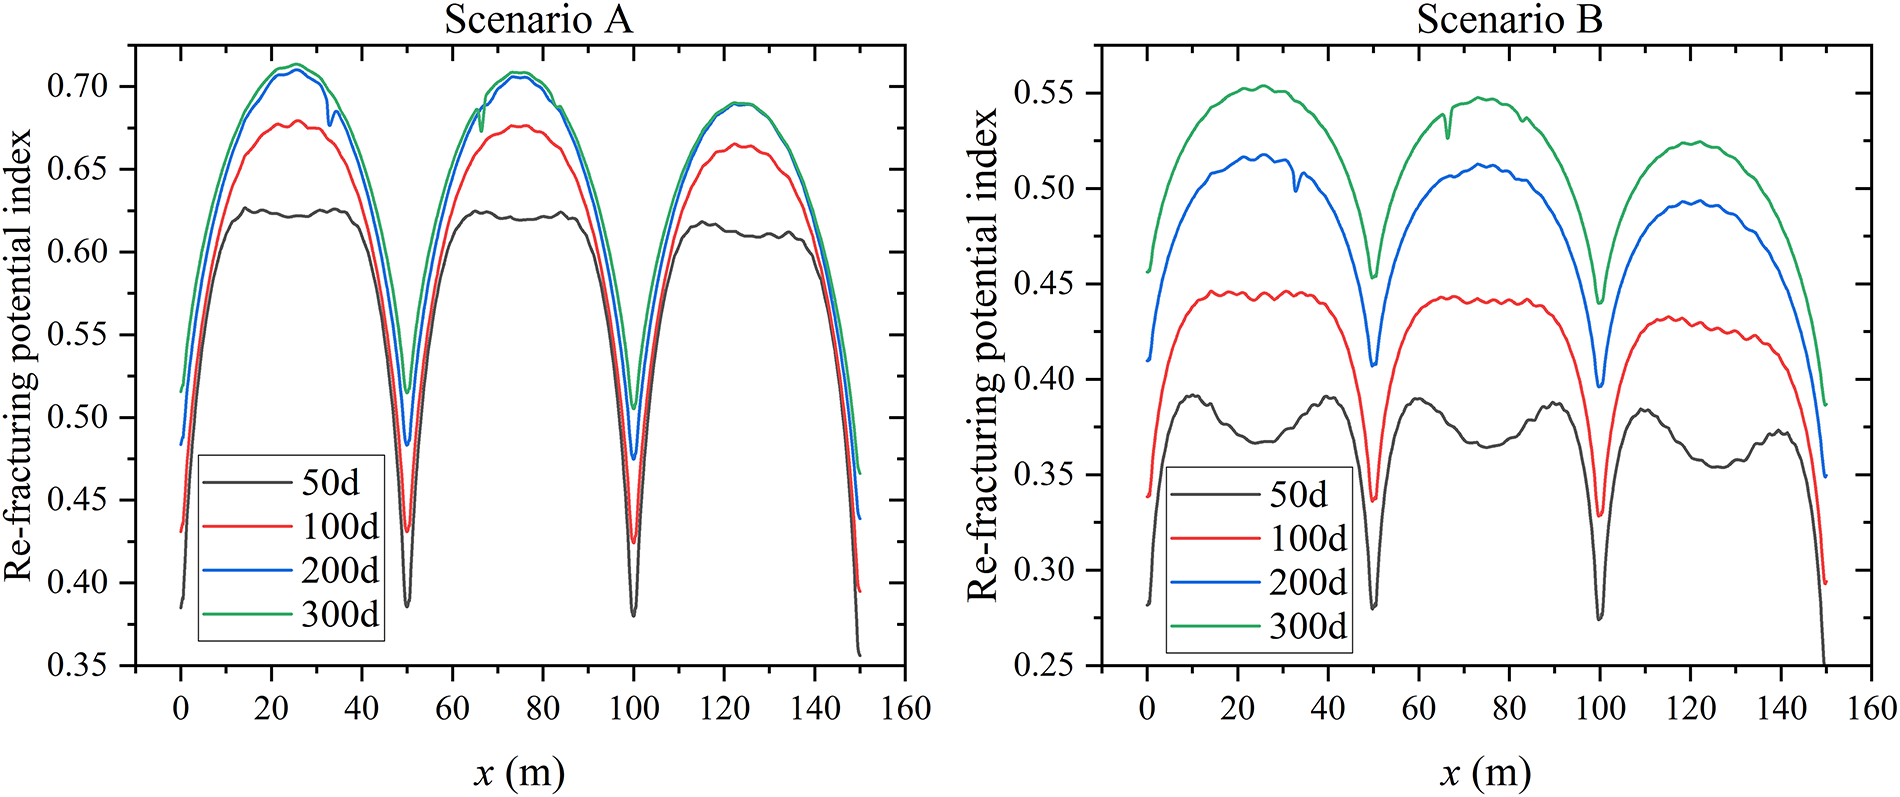
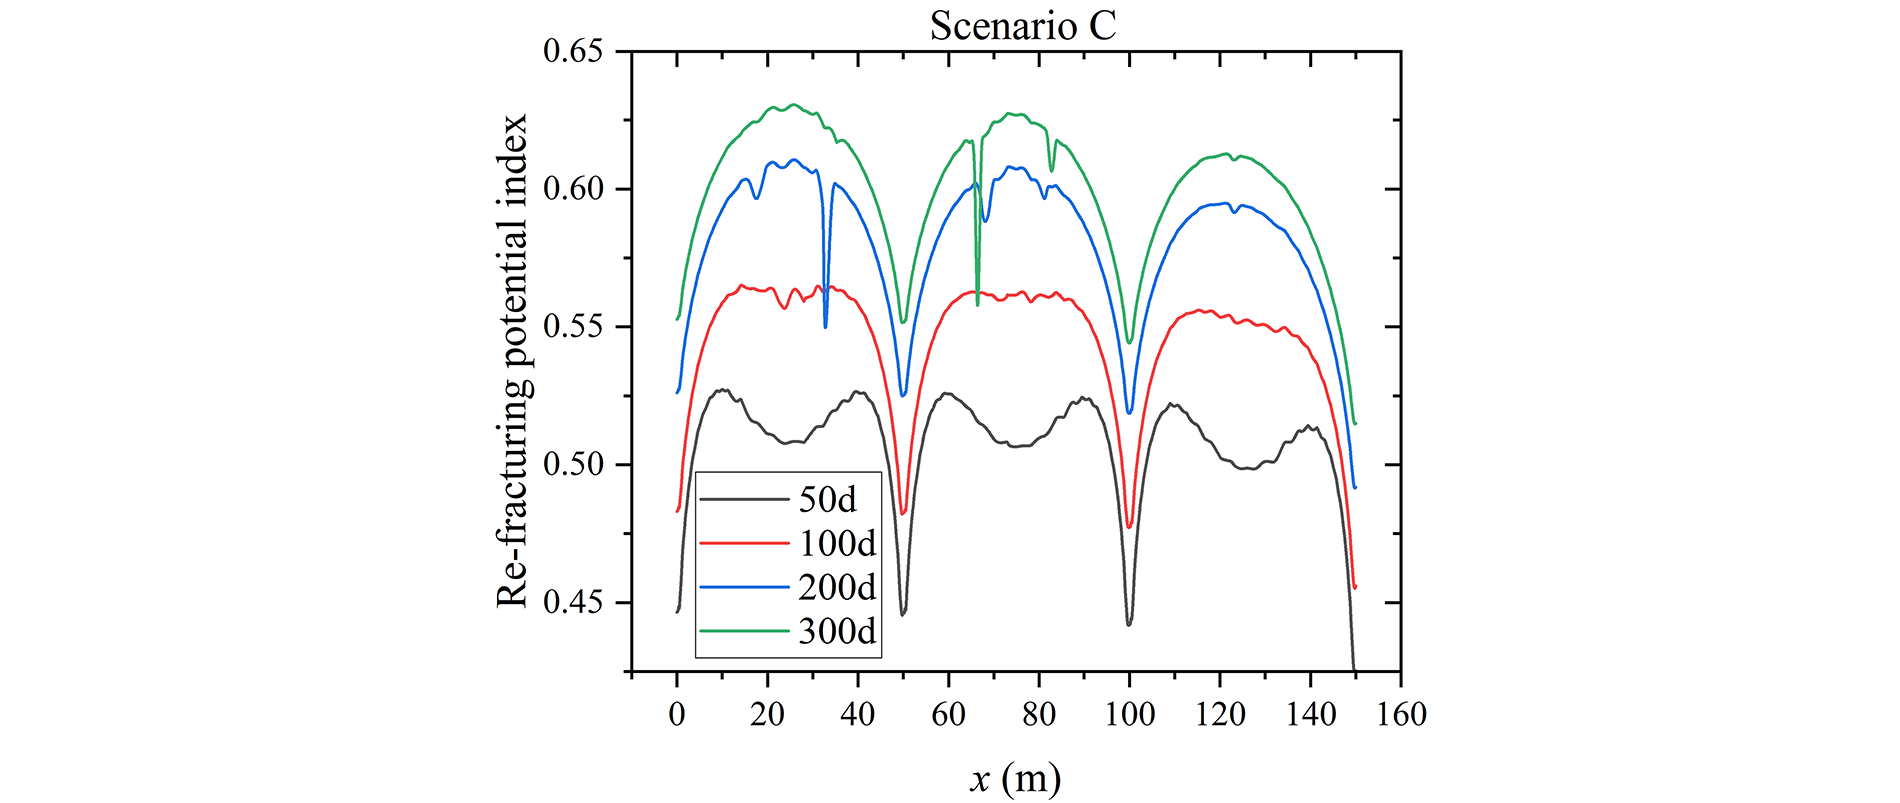
Figure 5: Distribution of re-fracturing potential index along the horizontal wellbore from x = 0 m to x = 150 m after 50, 100, 200, and 300 days of production in different weighting factor scenarios
The spatial profiles of the index across the three scenarios exhibit distinct characteristics. In Scenario, the profiles are distinguished by sharp and high peaks located precisely at the inter-fracture midpoints. With maximum index values exceeding 0.7, this scenario yields the most optimistic potential, as it is heavily influenced by the reservoir pressure index. It is also the maximal in these un-depleted regions. This represents a strategy focused on maximizing contact with remaining reserves. In contrast, Scenario B produces index profiles with significantly lower magnitudes and broader and flatter peaks. This occurs because the heavy weighting on stress-related indices penalizes the high stress anisotropy that exists with the high pressure at the midpoints. This scenario is focused on a more balanced location range that ensures favorable stress conditions for fracture propagation even if it corresponds to a slightly lower pressure. Scenario C presents a unique profile. While its overall shape resembles the base case, it is characterized by severe and localized sudden drops in the index profiles. These sharp drops correspond directly to zones with a high potential for fracture tortuosity, which demonstrates that a strategy focused on fracture geometry complexity mitigation can render otherwise attractive locations as unsuitable. The temporal evolution of the profiles also varies significantly between the scenarios, which can be referred to when determining the optimum timing of re-fracturing operations. Scenario A shows the most substantial increase in index values over the 300-day production period. This large temporal gradient suggests that when the objective is primarily resource capture, delaying the re-fracturing operation allows for the development of significantly more favorable conditions, which can amplify the potential for better overall production performance. Conversely, the temporal evolution in Scenario B is more restricted, with only a modest increase in index profile values over time. This implies that if geomechanical consideration is the principal concern, the timing of the re-fracture is less critical than its spatial placement and the marginal benefit of delaying is considerably smaller. Scenario C displays an intermediate rate of increase in its baseline. It also shows that the risk associated with specific locations (especially at and near the tortuosity-induced dips) can become more elevated with continued production.
In general, the sensitivity analysis demonstrates the adaptability of the re-fracturing potential evaluation framework. The selection of weighting factors is a critical step that calibrate the model to specific operational goals. A resource-focused strategy (Scenario A) identifies high-potential locations that become more attractive over time. A geomechanics-focused strategy (Scenario B) is less sensitive to operational timing. The third strategy (Scenario C) effectively uses the index to disqualify problematic zones, whose associated risks can evolve dynamically.
3.2 Re-Fracturing Potential Evaluation with Uneven Initial Hydraulic Fractures
In the previous analysis, uniform initial fractures are considered. In field analyses, nonuniform initial hydraulic fractures and heterogeneous geometries are usually encountered. Therefore, another re-fracturing potential evaluation is carried out where initial hydraulic fractures along the horizontal wellbore are more realistic and uneven. In the study, the number of initial hydraulic fractures remains the same, while fractures at x = −150, −50, 50, and 150 m are superior fractures and fractures at x = −100, 0, and 100 m are inferior fractures. Superior fractures have a half-length of 50 m and inferior fractures have a half-length of 25 m. The conductivity of superior fractures is 20 times of inferior fractures. This setup is used to denote the uneven fractures typically obtained in a hydraulic fracturing job.
Fig. 6 shows the spatial distribution of relevant properties (pressure, Sx, Sy, and reorientation of
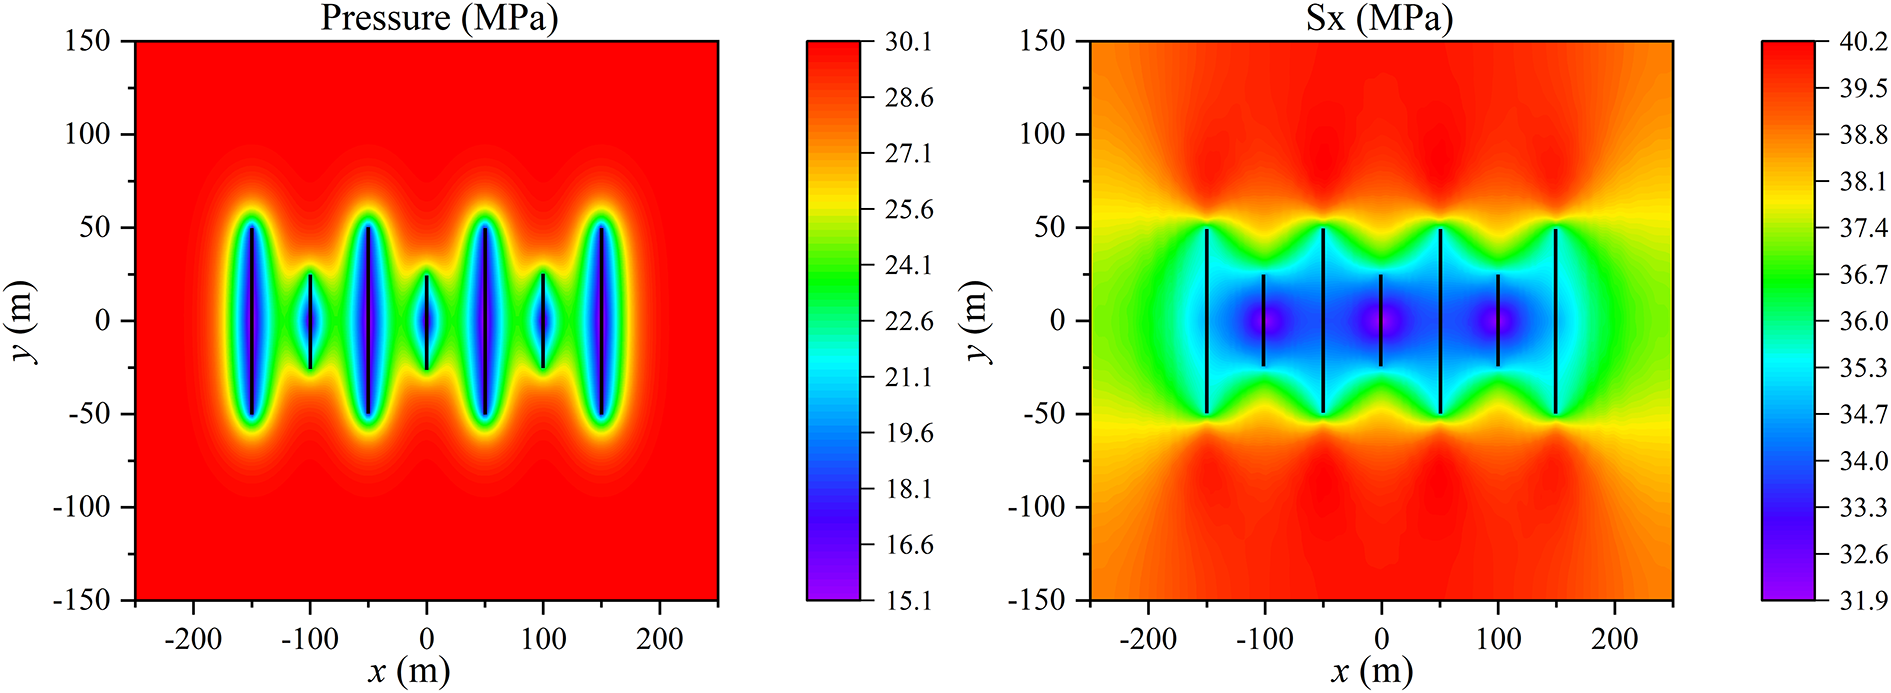
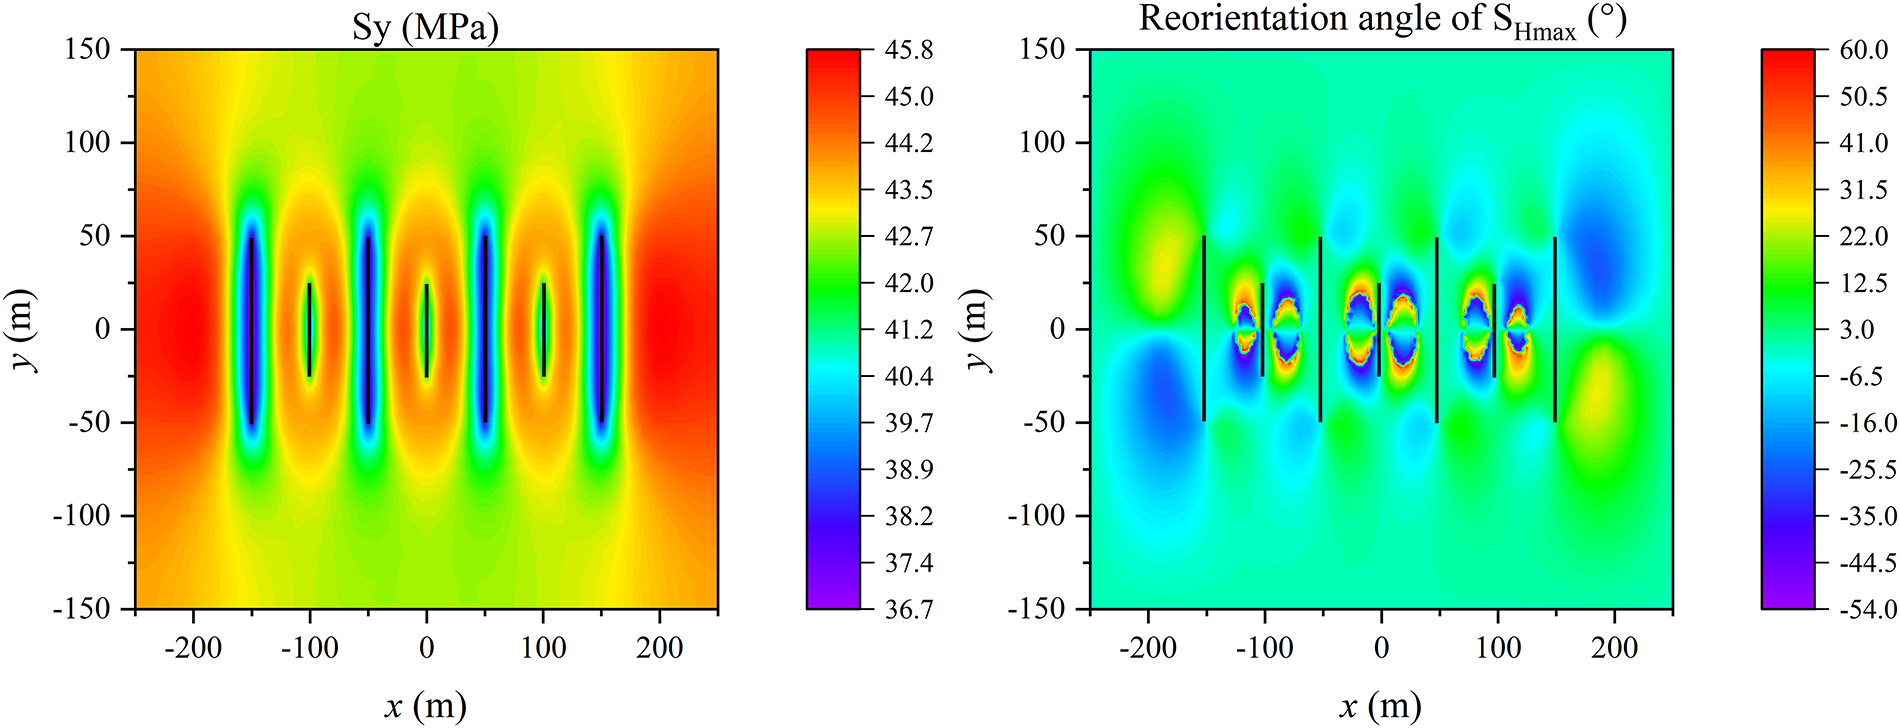
Figure 6: Spatial distribution of relevant properties (pressure, Sx, Sy, and reorientation angle of
The subindices for re-fracturing potential are discussed based on Fig. 7. It shows how production heterogeneity impacts re-fracturing potential along the horizontal wellbore. The one-dimensional distributions of the subindices along the wellbore are presented, where inferior fractures are located at x = 0 and 100 m, and superior fractures are at x = 50 and 150 m. The results quantifies a complex interplay between resource depletion and geomechanical stress changes that is different from the uniform case. The individual index profiles are more asymmetric, which is driven by the dominant drainage from the superior fractures. The pressure index
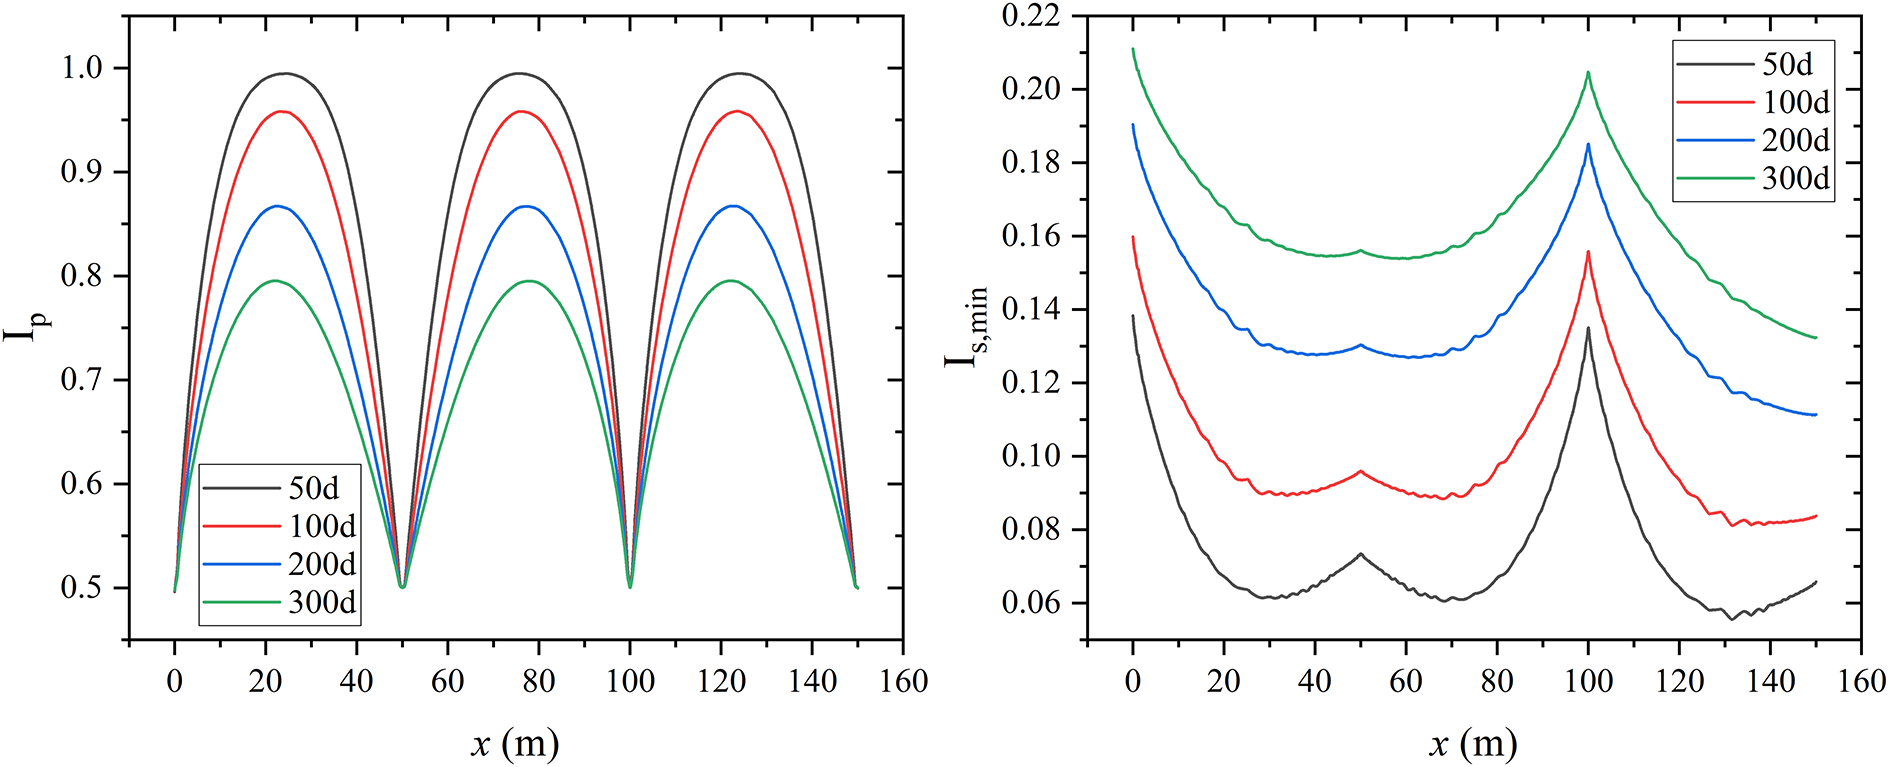
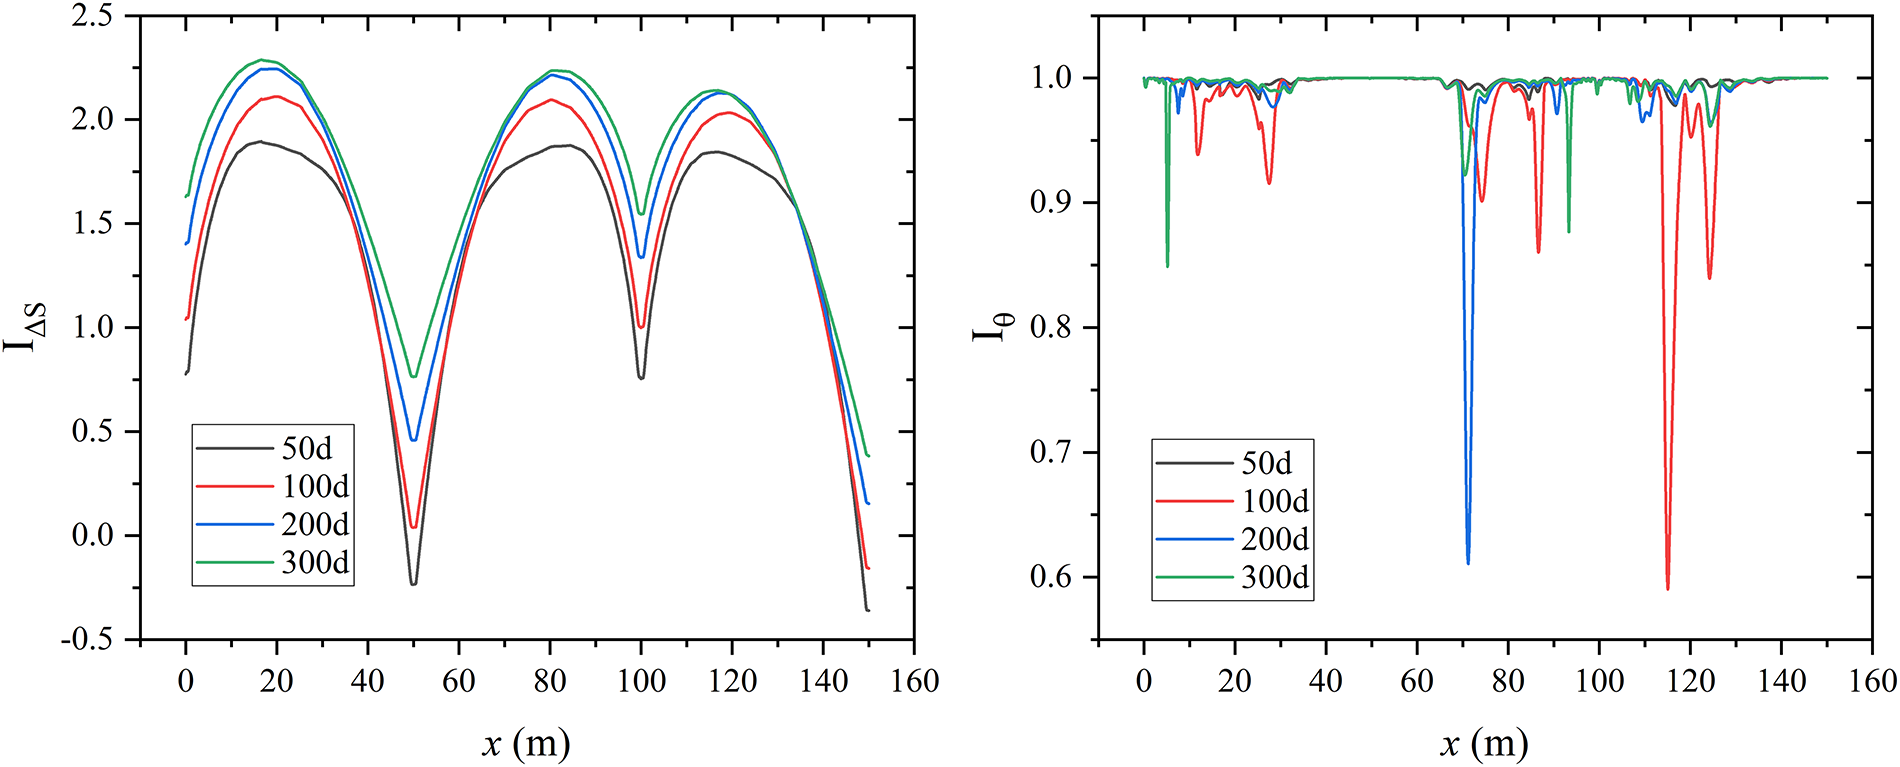
Figure 7: Distribution of subindices along the horizontal wellbore from x = 0 m to x = 150 m after 50, 100, 200, and 300 days of production
Fig. 8 has the general re-fracturing potential index profiles at these time steps after production. The index value progressively increases with production time across the 300-day simulation period, which can become a holistic measure for identifying optimal re-stimulation opportunities. Spatially, the index peaks consistently form in the inter-fracture regions, identifying them as the most promising candidates for re-fracturing. These are the zones where the balance of geomechanical and hydraulic factors is most favorable. Temporally, the plots show that the peak index values are lowest at 50 days and continuously increase through 100, 200, and 300 days. This monotonically increasing trend indicates that within the simulated timeframe, the positive effects of depletion-induced pressure and stress changes continue to outweigh the negative effects of fracture tortuosity. Specifically, the ongoing stress reduction and increased stress anisotropy are the dominant factors increasing the index profiles.
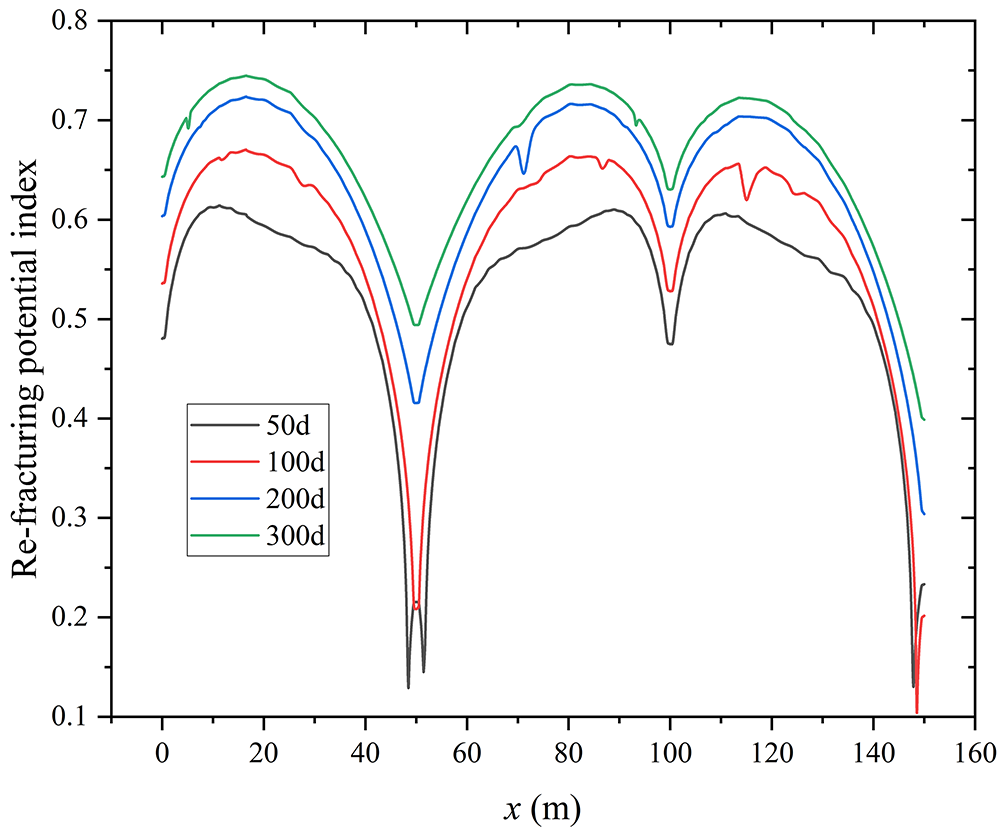
Figure 8: Distribution of re-fracturing potential index along the horizontal wellbore from x = 0 m to x = 150 m after 50, 100, 200, and 300 days of production
This study quantifies that low quality initial fracture geometries and conductivities are in favor of higher re-fracturing potential in uneven initial fracturing scenarios, while even initial fractures tend to result in more homogeneous distribution of re-fracturing potential indices along the wellbore. It is also worth noting that the re-fracturing potential evaluation method discussed in this work is highly dependent on the quality of the characterization of realistic initial hydraulic fractures in the reservoir. Since the accuracy and certainty of hydraulic fracture geometry characterization are usually limited, the reliability of the RPI is limited. Thus, in possible field applications, it is critical to improve the quality of hydraulic fracture characterization. The use of net pressure matching for hydraulic fracturing simulation and history matching for production data is suggested to improve the reliability of initial fracture geometry identification. The use of microseismic data to improve fracture geometry characterization is also meaningful if such data are available.
Based on the coupled flow and geomechanical modeling and the subsequent evaluation of re-fracturing potential presented in this study, the following conclusions are drawn:
(1) The integrated workflow combining a coupled numerical model with the proposed re-fracturing potential index provides a quantitative method for identifying optimum candidate locations for re-stimulation along a horizontal wellbore. The analysis consistently shows that the midpoints between existing hydraulic fractures represent the most promising targets, as these locations offer the best compromise between high remaining reservoir pressure and favorable geomechanically-altered stress states for initiating new fractures.
(2) Re-fracturing potential is a dynamic quantity that evolves with continued production. The simulations indicate that the index generally increases over time for the inter-fracture regions. This trend suggests that the reservoir becomes more suitable for successful re-fracturing after a period of depletion, as the positive effects of stress reduction and anisotropy changes progressively outweigh potential negative factors.
(3) The optimum re-fracturing strategy is highly dependent on the specific operational objectives. By adjusting the weighting factors of the subindices within the index, the evaluation framework can be modified to prioritize different goals. A resource-driven strategy strongly favors later-time operations in high-pressure zones, whereas a geomechanics or complexity-driven strategy may identify different optimal locations and timings to ensure fracture propagation efficiency and mitigate operational risks like screen-outs.
(4) The initial hydraulic fracture completion heterogeneity is a critical factor influencing re-fracturing potential. The presence of uneven initial hydraulic fractures leads to asymmetric depletion patterns and non-uniform stress fields. This significantly alters the spatial distribution of the RPI compared to idealized fracture scenarios. It indicates the importance of accurately characterizing the initial completion and using realistic and heterogeneous models to guide re-fracturing decisions in the field.
To validate the effectiveness of the proposed refracturing potential index presented in this study, subsequent research will employ field-measured data for empirical validation of the index.
Acknowledgement: The authors would like to thank the China University of Petroleum (Beijing) for providing the computing platform.
Funding Statement: This research received funding from the National Natural Science Foundation of China (No. U24B6001) and the CNPC Innovation Fund (No. 2021DQ02-0502).
Author Contributions: The authors confirm their contribution to the paper as follows: Huiyong Yu: Writing—original draft, methodology, conceptualization. Haifu Li: Writing—original draft, software, methodology, formal analysis. Liwei Zhang: Software, formal analysis. Yong Chen: Data curation, investigation. Rui Wang: Methodology, conceptualization. Qiyong Xiong: Methodology, conceptualization. Xuyang Guo: Methodology, validation, formal analysis, conceptualization. Shijie Shen: Writing—review & editing, methodology, conceptualization. All authors reviewed the results and approved the final version of the manuscript.
Availability of Data and Materials: The authors ensure the authenticity and validity of the materials and data in the article.
Ethics Approval: Not applicable.
Conflicts of Interest: The authors declare no conflicts of interest to report regarding the present study.
References
1. Temizel C, Canbaz CH, Palabiyik Y, Hosgor FB, Atayev H, Ozyurtkan MH, et al. A review of hydraulic fracturing and latest developments in unconventional reservoirs. In: Proceedings of the Offshore Technology Conference; 2022 May 2–5; Houston, TX, USA. doi:10.4043/31942-ms. [Google Scholar] [CrossRef]
2. Jacobs T. Changing the equation: refracturing shale oil wells. J Petrol Technol. 2015;67(4):44–9. doi:10.2118/0415-0044-jpt. [Google Scholar] [CrossRef]
3. Barba RE, Allison J, Villarreal M. A comparison of latest generation frac new well and refrac results with evidence of refrac reorientation. In: Proceedings of the 10th Unconventional Resources Technology Conference; 2022 Jun 20–22; Houston, TX, USA. [Google Scholar]
4. Liu Y, Dai F. A damage constitutive model for intermittent jointed rocks under cyclic uniaxial compression. Int J Rock Mech Min Sci. 2018;103:289–301. doi:10.1016/j.ijrmms.2018.01.046. [Google Scholar] [CrossRef]
5. Yoon HC, Guo X, Kim J, Killough J. Flexible and practical parallel implementation for coupled elastoplastic geomechanics and non-isothermal flow. Int J Rock Mech Min Sci. 2019;120(76):96–107. doi:10.1016/j.ijrmms.2019.05.003. [Google Scholar] [CrossRef]
6. Zoback MD, Kohli AH. Unconventional reservoir geomechanics. Cambridge, UK: Cambridge University Press; 2019. [Google Scholar]
7. Feng G, Zhu C, Wang X, Tang S. Thermal effects on prediction accuracy of dense granite mechanical behaviors using modified maximum tangential stress criterion. J Rock Mech Geotech Eng. 2023;15(7):1734–48. doi:10.1016/j.jrmge.2022.12.003. [Google Scholar] [CrossRef]
8. Chen XL, Zhang YF, Luo WJ, Cai ZL, Yu WJ. Prediction method and prevention measures for casing deformation of horizontal well in volume fracturing. Xinjiang Oil Gas. 2025;21(1):61–8. (In Chinese). doi:10.12388/j.issn.1673-2677.2025.01.007. [Google Scholar] [CrossRef]
9. Huang L, Jiang P, Zhao X, Yang L, Lin J, Guo X. A modeling study of the productivity of horizontal wells in hydrocarbon-bearing reservoirs: effects of fracturing interference. Geofluids. 2021;2021(1):1–13. doi:10.1155/2021/2168622. [Google Scholar] [CrossRef]
10. Luo J, Wang K, Liu H, Chen Z. Coupled geomechanics and fluid flow modeling in naturally fractured reservoirs. In: Proceedings of the SPE Low Perm Symposium; 2016 May 5–6; Denver, CO, USA. Richardson, TX, USA: Society of Petroleum Engineers; 2016. [Google Scholar]
11. Guo J, Tao L, Liu Y, He N, Zhou X. A new refracturing candidate selection method for multi-fractured horizontal wells in tight oil reservoirs. J Geophys Eng. 2019;16(4):789–800. doi:10.1093/jge/gxz049. [Google Scholar] [CrossRef]
12. Zhu Z, Hsu M, Kun D, Wang T, He X, Tian S. A data-driven workflow for prediction of fracturing parameters with machine learning. Therm Sci. 2024;28(2A):1085–90. doi:10.2298/tsci230718029z. [Google Scholar] [CrossRef]
13. Chen J, Yang X, Zhang X, Wang Y, Huo X, Jiang F, et al. Application of machine learning in the study of shale mechanical properties: current situation, challenges and prospects. Pet Sci Bull. 2025;10(5):1–43. (In Chinese). [Google Scholar]
14. Feng Q, Ren J, Zhang X, Wang X, Wang S, Li Y. Study on well selection method for refracturing horizontal wells in tight reservoirs. Energies. 2020;13(16):4202. doi:10.3390/en13164202. [Google Scholar] [CrossRef]
15. Morozov AD, Popkov DO, Duplyakov VM, Mutalova RF, Osiptsov AA, Vainshtein AL, et al. Data-driven model for hydraulic fracturing design optimization: focus on building digital database and production forecast. J Petrol Sci Eng. 2020;194(6):107504. doi:10.1016/j.petrol.2020.107504. [Google Scholar] [CrossRef]
16. Wang L, Li Y, Xu D, Gao Y, Zhang J, He J, et al. Evolution of near-well damage caused by fluid injection through perforations in wellbores in low-permeability reservoirs: a case study in a shale oil reservoir. Lithosphere. 2022;2022(Special 12):1–14. doi:10.2113/2022/3824011. [Google Scholar] [CrossRef]
17. He XD, Li JM, Wang JC, Cheng LM, Chen X, Lv Z. Theoretical understanding, key technologies, and field practice of high-efficiency reservoir stimulation for shale oil in Jimsar Sag. Xinjiang Oil Gas. 2021;17(4):28–35. (In Chinese). doi:10.3969/j.issn.1673-2677.2021.04.006. [Google Scholar] [CrossRef]
18. Wang Z, Guo X, Zheng G, Yu P, Wang W, Jin Y, et al. Effects of parent well spacing on the poroelastic behaviors in the infill zone in shale oil reservoirs: a case study in Jimsar Shale Oil, China. Energy Sci Eng. 2022;10(4):1043–54. doi:10.1002/ese3.1059. [Google Scholar] [CrossRef]
19. Clarkson CR, Qanbari F. A semianalytical forecasting method for unconventional gas and light oil wells: a hybrid approach for addressing the limitations of existing empirical and analytical methods. SPE Reserv Eval Eng. 2015;18(1):94–110. doi:10.2118/170767-pa. [Google Scholar] [CrossRef]
20. Valko P, Amini S. The method of distributed volumetric sources for calculating the transient and pseudosteady-state productivity of complex well-fracture configurations. In: Proceedings of SPE Hydraulic Fracturing Technology Conference; 2007 Jan 29–31; College Station, TX, USA. Richardson, TX, USA: Society of Petroleum Engineers; 2007. [Google Scholar]
21. Ibrahim AF. Integrated workflow to investigate the fracture interference effect on shale well performance. J Petrol Explor Prod Technol. 2022;12(12):3201–11. doi:10.1007/s13202-022-01515-z. [Google Scholar] [CrossRef]
22. Warpinski N. Understanding hydraulic fracture growth, effectiveness, and safety through microseismic monitoring. In: Proceedings of the ISRM International Conference for Effective and Sustainable Hydraulic Fracturing; 2013 May 20–22; Brisbane, Australia. Lisboa, Portugal: ISRM; 2013. [Google Scholar]
23. Li Y, Liu J. Distributed FiberOptic sensing for hydraulic-fracturing monitoring and diagnostics. E3S Web Conf. 2019;118(2):1–4. doi:10.1051/e3sconf/201911802046. [Google Scholar] [CrossRef]
Cite This Article
 Copyright © 2026 The Author(s). Published by Tech Science Press.
This work is licensed under a Creative Commons Attribution 4.0 International License , which permits unrestricted use, distribution, and reproduction in any medium, provided the original work is properly cited.
 Downloads
 Citation Tools