
 Submit a Paper
 Propose a Special lssue
 Open Access
ARTICLE

Adaptive Load Control Model for Wind Turbines under Cold Front Conditions
1 School of Electrical Engineering, Shanghai Jiao Tong University, Shanghai, 200240, China
2 Electric Power Research Institute, China Southern Power Grid, Guangzhou, 510663, China
* Corresponding Author: Chen Zhang. Email:
(This article belongs to the Special Issue: Trends of Offshore Wind Technologies: Support Structure Design, Health monitoring, HVDC transmission, Control and Optimization)
Energy Engineering 2026, 123(4), 19 https://doi.org/10.32604/ee.2025.072678
Received 01 September 2025; Accepted 27 October 2025; Issue published 27 March 2026
 View Full Text
 Download PDF
Abstract
Fatigue loads on wind turbines are critical factors that significantly influence operational lifespan and reliability. The passive yaw control of wind turbines often fails to capture the dynamic gradient changes of wind speed and direction in the wind field, leading to an increased risk of load overload, severely affecting operational lifespan and reducing power generation efficiency. This impact is even more pronounced during the passage of a cold front. To address this issue, this paper proposes an independent variable-pitch control method that optimizes predictions by utilizing the spatiotemporal relationship between pre-observed cold front patterns and their dynamic propagation. First, a cold front and cold front propagation model suitable for engineering applications was derived. And a non-uniform inflow load model of turbine is established, which, combined with tower vibration response and rotor dynamic loads, accurately simulates the force distribution under complex inflow conditions. Subsequently, a pre-observation-based active cyclic pitch control method is presented, dynamically computing optimal pitch angle sequences by predicting wind field trends. This method eliminates the need for iterative optimization algorithms and reduces control latency to achieve proactive load management. Simulation verification shows that the proposed control strategy can effectively reduce key structural loads and increase power generation without relying on complex optimization algorithms. This method provides a practical solution for improving the economic benefits and operational reliability of wind farms under special wind conditions.Keywords
Highlights
• Introduces a predictive framework integrating cold front pre-observation with adaptive individual pitch control (IPC).
• Eliminates iterative optimization, reduces control latency, and enables proactive load management.
• Significantly reduces rotor loads and tower vibrations, enhancing structural integrity and safety.
• Improves power output and mitigates power dips from gusts, strengthening grid stability and reliability.
Glossary
| IPC | Individual pitch control |
| PSO | Particle swarm optimization |
| AOA | Angle-of-attack |
| CIA | Comprehensive inflow angle |
| FA | Fore-aft |
| SS | Side-to-side |
| The time at which an abrupt change is detected at the | |
| The temporal duration of the pre cold front mixing zone | |
| The time at which the cold front begins to affect the wind turbine | |
| The time elapsed since the start of mixing zone influence | |
| Error term | |
| The projections of the distance between the coordinates of this measurement point and the first measurement point where an abrupt change occurs onto the | |
| The projections of the distance between the coordinates of this measurement point and the first measurement point where an abrupt change occurs onto the | |
| Matrix which each row is formed as | |
| Matrix which each row is formed as | |
| The propagation velocity of the cold front | |
| The current wind speed at the turbine | |
| The wind speed prior to the cold front’s influence | |
| The acceleration of wind speed across altitude planes | |
| The propagation direction of the cold front | |
| The difference between the cold front propagation direction and the ambient wind direction | |
| The current wind direction at the turbine | |
| The wind direction prior to the cold front’s influence | |
| The wind direction change rate | |
| The wind speed behind the cold front | |
| The parameter indicating the relationship between parameters | |
| The current passed ratio of the mixing zone | |
| The stiffness | |
| The stiffness matrix | |
| The distance between the turbine | |
| The axial force on the blade element | |
| The tangential force on the blade element | |
| The torque on the blade element | |
| The blade root load on the blade | |
| The mass matrix | |
| The total torque | |
| The shear stress on the blade element | |
| The radius corresponding to the | |
| The blade root radius | |
| The radius of the selected point | |
| The rotor radius | |
| The total force at the selected spanwise location | |
| The total axial force | |
| The total lateral force | |
| The time-varying excitation force vector | |
| The cross-sectional area at the selected point | |
| The inflow angle | |
| The corresponding blade rotation angle | |
| the CIA of sector | |
| The damping matrix | |
| The fore-aft displacements | |
| The side-to-side displacements | |
| The fundamental frequency | |
| The mass | |
| The torque on the blade | |
| The comprehensive evaluation value | |
| The cold front structure correction parameter | |
| The total load of FA on nacelle | |
| The total load of SS on nacelle | |
| The yaw orientation of the wind turbine | |
| The cognitive coefficient | |
| The social coefficient | |
| The chord length of the corresponding blade element | |
| The inertial weight | |
| The optimal AOA of blade | |
| The pitch angle | |
| The actual inflow angle of the corresponding blade element | |
| The corresponding optimal pitch angle |
Offshore wind power is a key component of the large-scale utilization of wind energy [1]. In recent years, the installed capacity of offshore wind power has developed rapidly, and the capacity of individual wind turbines has been continuously increasing. However, under marine meteorological conditions, intense air-sea interactions can cause frequent and drastic changes in wind speed, which not only lead to significant power fluctuations and threaten grid stability, but also increase the fatigue loads on turbines under passive yaw control strategies due to rapid and spatially uneven changes in wind speed and direction. Therefore, the operation of large offshore wind turbines faces unique challenges, and targeted control methods need to be studied to ensure the safe, reliable, and efficient operation.
Offshore wind turbines with large rotors are highly sensitive to wind shear and cold front disturbances. A cold front constitutes a coherent meteorological structure with a well-defined spatial organization. This system is characterized by a wedge-shaped frontal surface, where cold air intrudes beneath warm air to form a mixing transition zone [2,3]. It is within this zone that wind speed and direction undergo drastic changes, directly exposing wind farms to short-term extreme loads and dynamic inflow effects [4]. Current control-oriented research predominantly relies on uniform wind fields with superimposed turbulence, while gusts induced by cold fronts are often oversimplified as instantaneous step changes in wind speed. Reference [5] reviewed that many control strategies are designed based on planar or horizontally homogeneous inflow assumptions derived from studies on yaw-based wake steering, thereby overlooking the complex vertical wind profiles induced by frontal passages. Given these fundamental limitations in representing frontal systems, conventional control strategies often fall back on simplistic models like the wind shear power law for vertical wind profiles. Consequently, this reliance on inadequate models during cold fronts leads to control failure, posing a risk of catastrophic structural damage. Reference [6] investigated the impact of various strong winds on the loads and oscillation effects of wind turbine tower foundation structures, and its findings on multi-hazard coupling underscore the risk of relying on standard wind models for poorly represented phenomena such as cold fronts. Reference [7] proposed a data-driven multi-time-scale predictive control framework that coordinates yaw and thrust control to maximize farm power, reduce mechanical loads, and provide grid support. However, this framework mainly depends on horizontal wind data and historical patterns, lacking the capability to represent the complex three-dimensional structures of cold fronts. Consequently, control performance deteriorates under sudden frontal wind changes. Moreover, references [8,9] have shown that under yaw or complex wind conditions, turbine blades experience significantly asymmetric and uneven load distributions, which collective pitch control cannot adequately address, further exacerbating structural fatigue and control challenges. These manifest as rapid yaw misalignments and sharp torque imbalances, which significantly increase structural loads [10] and often trigger safety protection mechanisms, resulting in a rapid power decrease with fatigue issues. In power grids with high renewable penetration, such steep active power drops can cause frequency fluctuations and power deficits, adversely affecting system stability.
To address these asymmetric loads and dynamic inflows, advanced control strategies are essential, but current predictive or sensing methods often rely on overly complex systems that introduce practical barriers. For instance, lidar-assisted model predictive control with online rain flow counting has been proposed [11], enabling real-time fatigue assessment and active load suppression. However, this method requires additional nacelle-mounted lidar systems, increasing overall wiring complexity and maintenance efforts. Another approach utilizes aerodynamic state perception and a deep neural network to construct a fast blade load model, allowing rapid computation and optimized control [12]. Nevertheless, the inherent delay in aerodynamic response sensing results in an extremely narrow control optimization window or even missed opportunities. Additionally, active flow control strategies such as those employing high-voltage plasma actuators have been introduced to alleviate extreme loads [13]. While effective, the integration of such high-voltage systems not only raises maintenance risks but may also introduce new sources of fatigue loading. These methods typically involve trade-offs between cost, computational latency, and measurement range, necessitating complex pre-observation schemes for individual turbines. This underscores that current predictive or sensing techniques are too cumbersome for real-time application, highlighting the need for a simpler and more effective solution.
In this context, Doppler wind lidar technology emerges as a promising pathway to provide high-fidelity inflow data without the burden of equipping every turbine. As demonstrated in reference [14], high-resolution Doppler lidar can directly observe the complex dynamics of frontal systems, effectively capturing their wedge-shaped structure and detailed vertical evolution within the atmospheric boundary layer. Furthermore, lidar-based systems have proven capable of real-time detection of gust fronts and other hazardous wind phenomena in operational settings [15]. These capabilities enable lidar data to form the basis of a predictive system for cold fronts, forecasting time-series inflow data at different turbine heights. By deploying lidar at the wind farm level rather than on individual turbines, this approach reduces equipment costs and complexity while delivering the essential input for advanced control models. The resulting high-fidelity data can thus support the development of tailored control strategies to mitigate the asymmetric loads highlighted earlier.
Building on these tailored control strategies, IPC represents a particularly promising approach due to its direct mechanism for counteracting asymmetric loads [16]. IPC’s ability to independently adjust blade pitches allows it to counteract the spatially non-uniform inflow, thereby reducing fatigue damage in critical structural areas such as tower and platform connections, as evidenced in structural stress analyses of offshore turbine support systems [17]. However, the practical application of existing IPC strategies is hampered by several limitations. First, their performance is heavily dependent on computationally complex optimization algorithms, which are often implemented indirectly through pre-computed lookup tables, introducing inevitable control latency. Second, many strategies prioritize load reduction at the expense of power stability, often resulting in fluctuations or a slight decrease in power output, thereby failing to balance power generation efficiency with structural safety [18]. Additionally, tower vibrations exacerbated by gust-induced dynamic loads can lead to further fatigue issues, necessitating careful management as highlighted in lifetime extension strategies [19,20]. In summary, current IPC strategies face several persistent challenges: computational inefficiency, trade-offs between load mitigation and power consistency, and inadequate handling of dynamic vibrations. These limitations collectively underscore the necessity of developing a new IPC strategy that integrates rapid response, low computational overhead, and an optimal balance between load reduction and power generation to enhance turbine resilience under extreme wind conditions.
In response to these challenges, this paper proposes an adaptive IPC strategy based on predictive cold front observation to effectively mitigate the complex dynamic loads on wind turbines during cold front transits. The strategy integrates predictive observation with sequential control commands: First, the pre-observation module acquires incoming temporal inflow information associated with the cold front in advance, providing anticipatory input to the control system; then, an adaptive control law that acquires pitch angle reference utilizes this pre-observed information for generating optimal pitch angle commands. This approach enables effective load suppression while simultaneously increasing power output, achieving an optimal balance between operational safety and efficiency. Furthermore, the proposed method addresses the latency issues inherent in passive feedback control, optimization algorithms, and lookup table methods. The effectiveness of this adaptive control strategy in enhancing load management and boosting power output is comprehensively validated through SCADA data analysis and comparative studies with conventional strategies.
2 Adaptive Angle-of-Attack (AOA) Difference IPC Architecture Based on Predictive Observation
This paper presents an adaptive AOA difference IPC architecture based on predictive observations, as illustrated in Fig. 1, which is designed to enhance the operational efficiency and structural safety of wind turbines under cold front conditions. The proposed architecture utilizes lidar devices within the wind farm to enable early detection of the cold front and measurement of inflow fields. The collected observation data is then input into a cold front propagation model, that integrates numerical computation and wind speed propagation principles to forecast temporal variations in wind speed and direction at various height levels for each turbine over a future time horizon. Leveraging real-time rotational speed and azimuth angle measurements, the system partitions each turbine into sectors and computes the comprehensive inflow angle (CIA) for each sector at discrete time instances. Subsequently, by incorporating airfoil sectional AOA data, the system generates time-sequenced optimal pitch commands for each sector, thereby achieving adaptive AOA difference control through predictive sensing. This approach not only mitigates fatigue damage induced by abrupt wind loads but also improves wind energy capture efficiency, while avoiding computational delays associated with iterative optimization algorithms such as particle swarm optimization (PSO).
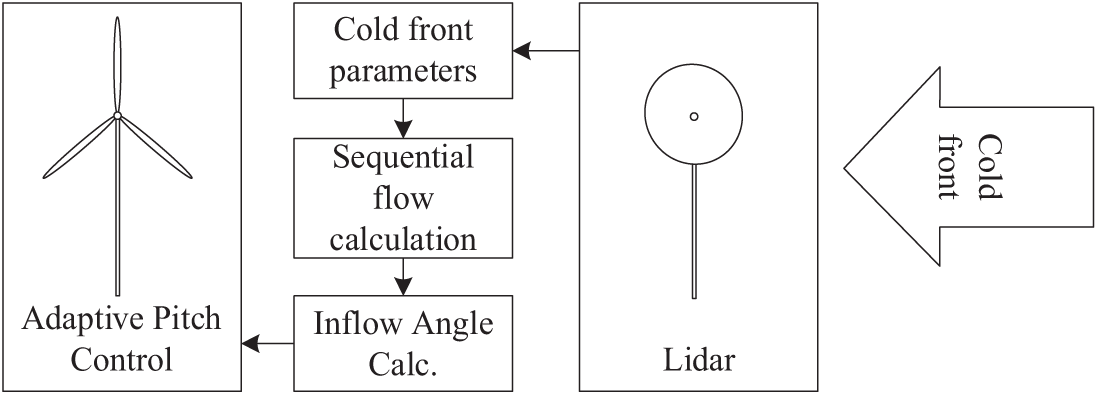
Figure 1: Adaptive AOA difference IPC architecture based on predictive observation
3 Wind Farm Cold Front Model and Turbine Rotor Load Model
The cold front propagation model is structured into two primary components: pre-observation and the propagation model. In the pre-observation phase, multi-point monitoring employing Kalman filtering processes wind speed and direction data to extract gust core parameters. Subsequently, the propagation model then computes the temporal sequence of gust impacts on the turbine for each inflow layer, utilizing these core parameters.
3.1.1 Cold Front Pre-Observation Model
In the pre-observation phase, distributed lidar data collected from the four corners of a wind farm are employed. Kalman filtering is applied to monitor the rate of change of vertical wind speed (along the Z-axis), enabling detection of sustained abrupt changes in observed acceleration; this confirms the presence of updrafts ahead of the cold front [3]. By timing similar variations across multiple monitoring points, core gust parameters can be derived. A Cartesian coordinate system is defined with the
where
Design an
Furthermore, the two core parameters of the cold front: wind speed and direction, can be calculated from the fitting parameters
where
Additionally, a region ahead of the cold front interacts with the gradient wind, known as the mixing zone. Within this zone, wind speed and direction progressively align with the propagation velocity of the cold front as the distance to the front decreases [3]. By applying Kalman filtering to monitor the rate of wind speed variation across vertical planes and comparing it with
where
3.1.2 Cold Front Propagation Model
As described in reference [3], the passage of a cold front is characterized by a cold air mass propagating at a stable velocity. The wind speed behind the front correlates with the parameter
where
For the wind turbine, the temporal sequence of effects it will experience can be derived based on the observed wind speed and direction,
where
Based on the wind direction change rate
Fig. 2 presents lidar-derived wind direction data from a wind farm in northern China during a cold front event, clearly showing three distinct regions: the pre-cold-front wind field (blue background), the mixing zone (yellow background), and the cold pool (red background). These regions illustrate the structural evolution of the cold front, with the mixing zone exhibiting a transitional wind direction between the pre-frontal field and the cold pool. Such features align with global studies indicating that cold pools maintain coherent structures during propagation, functioning as air masses with defined temporal thickness [22,23]. Additionally, they corroborate references [2,3], which report that wind speed and direction progressively align with the frontal system in the mixing zone as distance decreases. High-resolution analyses of cold pool collisions further confirm that the mixing zone displays a gradual shift in wind vectors, where closer proximity to the cold pool enhances alignment with its outflow [21]. These observations provide a foundation for subsequent analyses of wind behavior across height layers, as detailed in Fig. 3 and Table 1.
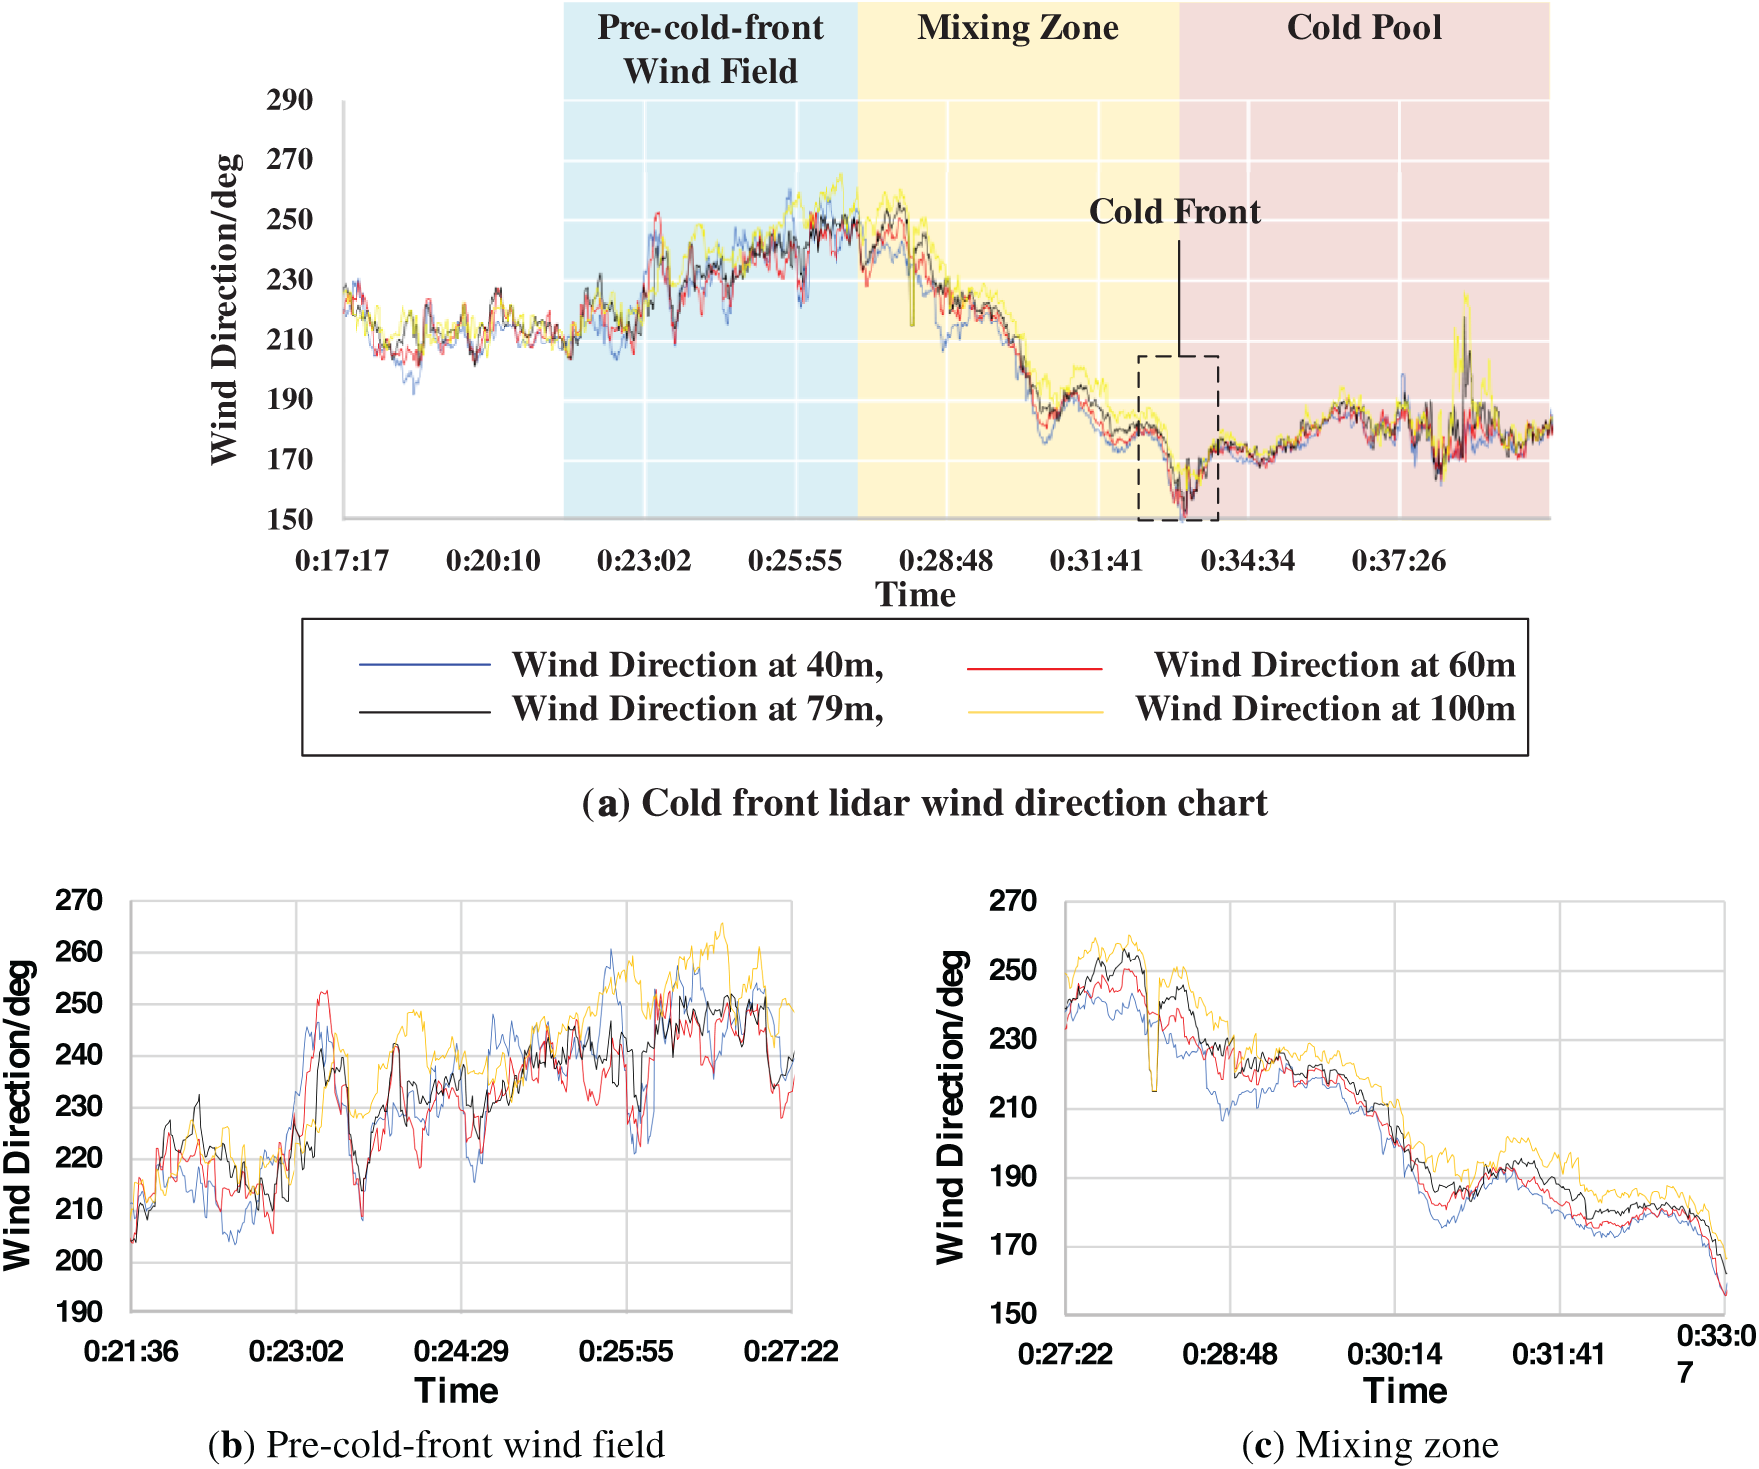
Figure 2: Lidar-derived wind direction data from a wind farm in northern China during a cold front event
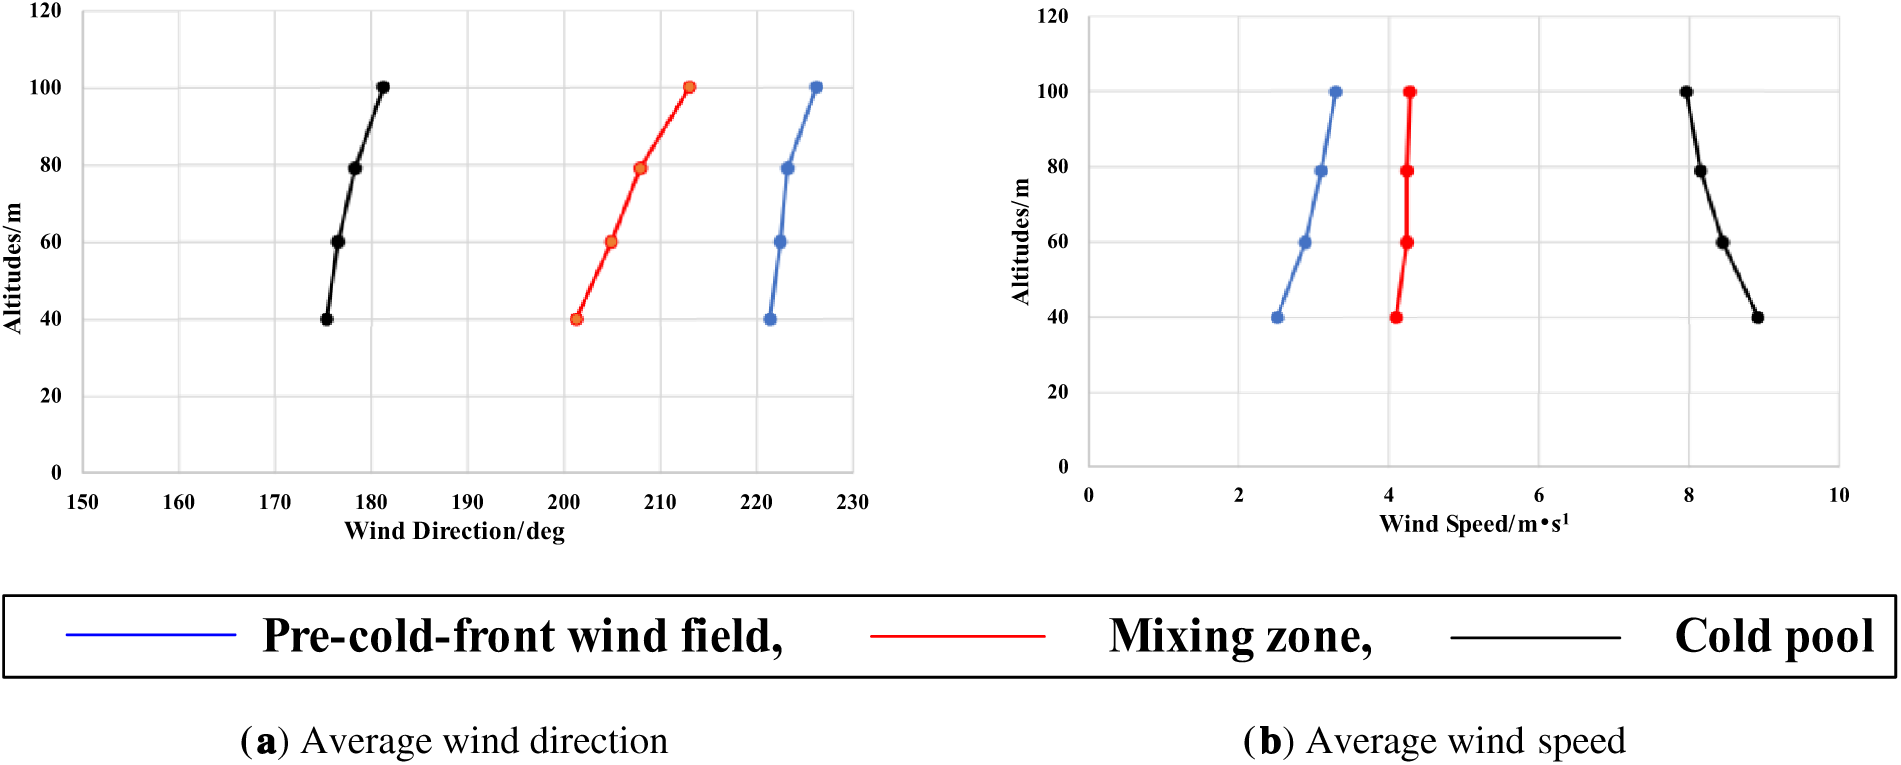
Figure 3: Lidar-derived wind direction data from a wind farm in northern China during a cold front event
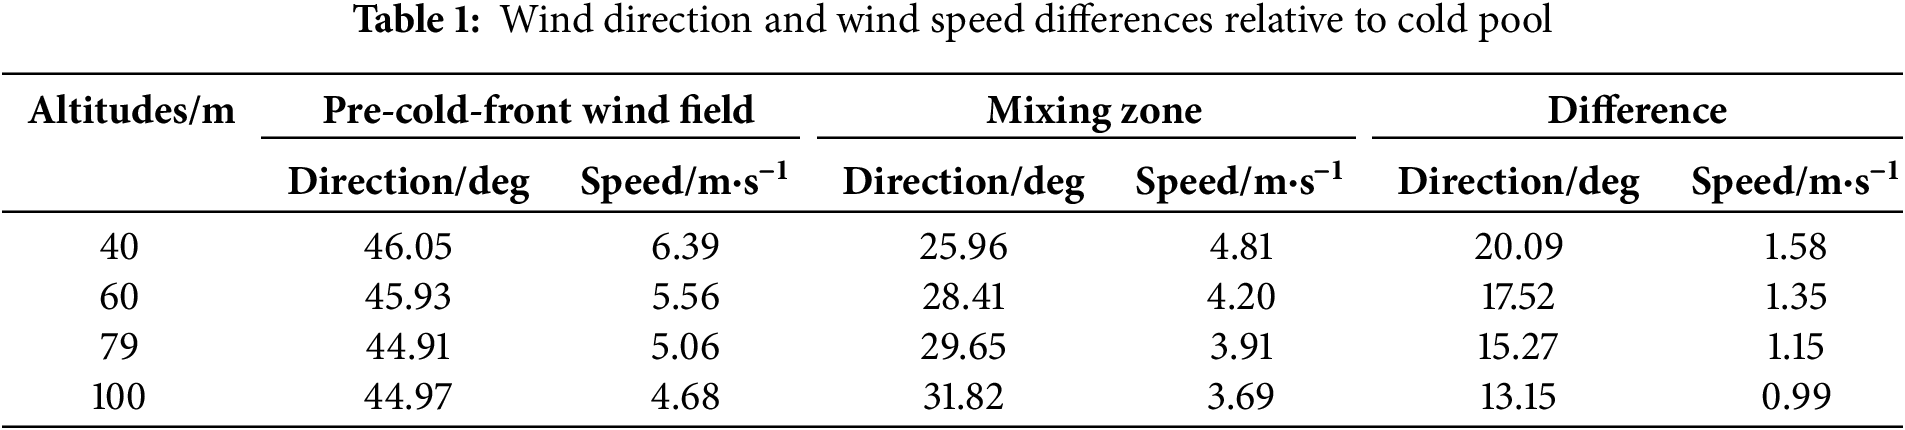
As illustrated in Fig. 3, the diagrams depict the average wind direction and speed across different height layers for three distinct stages. In Fig. 3a, the wind direction reveals that the cold pool’s orientation aligns broadly with both the trend and magnitude of the pre-cold-front wind field zone. This consistency may be attributed to the wind direction gradient induced by surface friction and geostrophic forces, suggesting that even in the absence of a cold front, practical scenarios must account for directional variability. Conversely, the mixing zone exhibits a markedly steeper slope in average wind direction, resulting from the wedge-shaped structure of the cold front, where lower altitudes experience earlier and more prolonged frontal influence. In Fig. 3b, the wind speed distribution within the pre-cold-front wind field zone adheres to the power-law hypothesis for wind shear, while the cold pool demonstrates an inverse relationship due to its unique generation and driving mechanisms.
Using the average wind speed and direction of the cold pool across various height layers as a baseline, the differences between the pre-cold-front wind field and mixing zone relative to the cold pool were computed to derive the additional increment in the mixing zone. As presented in Table 1, this increment variable corresponds to the difference in influence duration attributable to the wedge-shaped structure of the cold front, thereby providing evidence for its existence. Furthermore, in accordance with the reference [2], which indicates that the pre-frontal wind field gradually adjusts toward the cold pool’s wind direction while the cold front maintains stable propagation characteristics, the temporal variations in wind speed and direction at different heights can be calculated using the ratio of the mixing zone’s duration to the current time.
Based on the above assumptions, a model for wind speed and direction across the height layers within the mixing zone can be established,
where
By integrating the cold front pre-observation model with the propagation model, the time-series inflow wind speed and direction for the corresponding wind turbine can be obtained.
3.2 Wind Turbine Rotor Load Model
The Blade Element Momentum (BEM) theory is commonly employed to calculate the rotor loads of wind turbines subjected to non-uniform inflow conditions, such as those generated by cold fronts [24]. In this approach, each blade is discretized radially into multiple independent segments, termed blade elements. For each element the lift forces
where
Building upon the previous description, the calculations for the key parameters are detailed as follows. The torque exerted on the rotor is generated by the tangential forces acting on the blade elements. Therefore, the torque
where
The blade root load (bending moment)
where
Finally, the maximum shear stress
where
3.3 Two-Degree-Freedom Tower Structure Model
The total axial force
where
The tower is simplified as a two-degree-of-freedom system with a lumped mass at the top, which represents the fore-aft (FA) and side-to-side (SS) motions. The mass matrix
where
The fundamental frequency
Finally, the solution is derived from the state-space equations, and the time-domain response is transformed to the frequency domain using the Fast Fourier Transform to identify the dominant frequency components of the vibration.
4.1 Wind Turbine IPC Optimization Objectives
In the non-uniform inflow environment induced by cold fronts, unlike yaw-controlled turbines under uniform inflow conditions, the wind speed and direction experienced by the rotor vary with height in a gradient manner. This non-uniform inflow introduces both wind speed gradients and wind direction gradients. Consequently, in addition to conventional blade root load optimization, it is essential to optimize the maximum shear force on the blades to reduce the ultimate stress on the materials.
Furthermore, cold fronts accompanied by gusts can cause rapid changes in wind direction. As a result, the yaw servo system of wind turbines often fails to respond in real time, leading to a passive yaw state. This state, in turn, causes in a sharp decline in active power. Therefore, increasing the average rotor torque has become a key optimization objectives to mitigate the rate of power decrease.
Currently, optimization processes in this field commonly employ algorithms such as PSO. For multi-objective optimization problems, multiple objectives are typically integrated into a single comprehensive objective function by assigning weights to each target. In this study, based on the expert scoring method, weights
where
Optimization is performed using the PSO algorithm with the following parameters: Cognitive coefficient
4.2 Adaptive AOA Difference IPC
IPC optimizes performance by independently adjusting the pitch angle of each blade to maintain the AOA at its aerodynamically optimal design position. However, under non-uniform inflow induced by cold fronts or during yaw misalignment, significant variations occur in the actual inflow angles of different blade elements along the span. In such scenarios, a comprehensive blade AOA for each sector can be calculated based on the contribution ratio of each blade element to the blade root bending moment and its actual inflow angle,
where
The optimization results of the PSO algorithm for the wind turbine under a yaw orientation of 30° and a gust condition of 60° are compared with the CIA, as shown in Fig. 4.
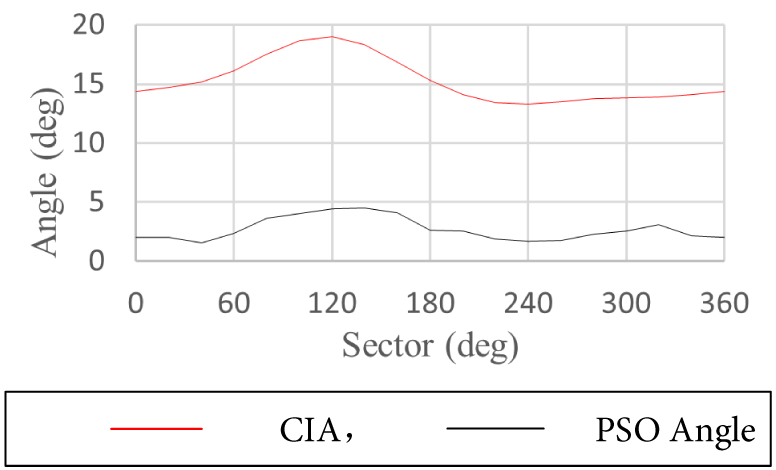
Figure 4: Comparison between CIA and PSO optimized pitch angle
Fig. 4 shows that the CIA and the PSO-optimized pitch angle exhibit a generally consistent overall trend, indicating that the CIA influences the variation of the optimized AOA.
As shown in Fig. 5, which presents the torque data
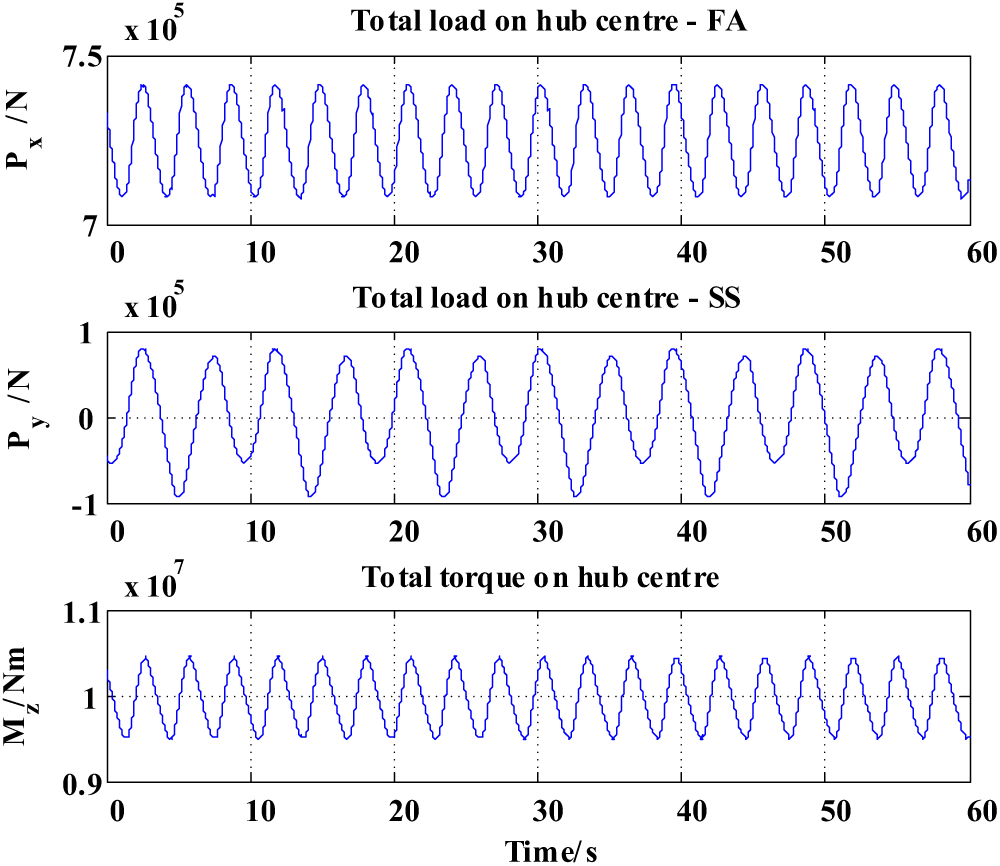
Figure 5: Time-domain diagrams of total loads and torque without control
Using the CIA as a reference, the required pitch adjustment can be determined by calculating the difference between the CIA within a sector and the optimal AOA. Adopting a method similar to Eq. (16), the optimal AOA
As shown in Fig. 6, although the variation trend of the optimized angle exhibits a certain correlation with the CIA, differences in the final optimized angle and corresponding results arise due to the need for independent optimization across sectors, each with different sensitivities to the three optimization objectives. These discrepancies primarily stem from the algorithm settings: within a search range of 20° and a maximum of 200 iterations, it cannot be guaranteed that particles in all sectors converge uniformly. Additionally, constraints such as the pitch rate limit and the torque-dominant weighting of the optimization objectives collectively contribute to deviations in peak regions. In the 180° to 360° interval, however, the amplitude of the AOA varies less, leading to closer alignment between the two angles and demonstrating better consistency. It should be noted that the optimization process was conducted in sectors spaced at 20° intervals from 0° to 340°. Since 0° is equivalent to 360°, the decline observed between 340° and 360° in the figure is not directly caused by the optimization process.
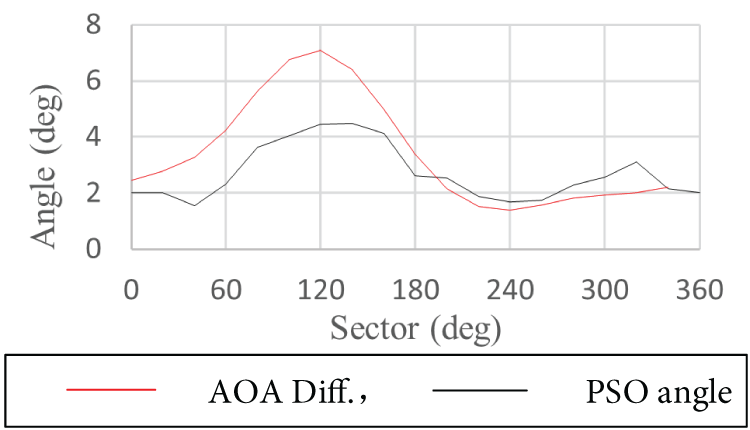
Figure 6: Comparison between adaptive AOA difference optimized angle and PSO-optimized pitch angle
5 Validation of Adaptive AOA Difference IPC Strategy for Wind Turbines Based on Cold Front Pre-Observation
To validate the effectiveness of the adaptive AOA difference IPC strategy described in this paper, simulations were conducted using parameters of the NREL 5-MW wind turbine model [25] and wind model, as detailed in Table 2.
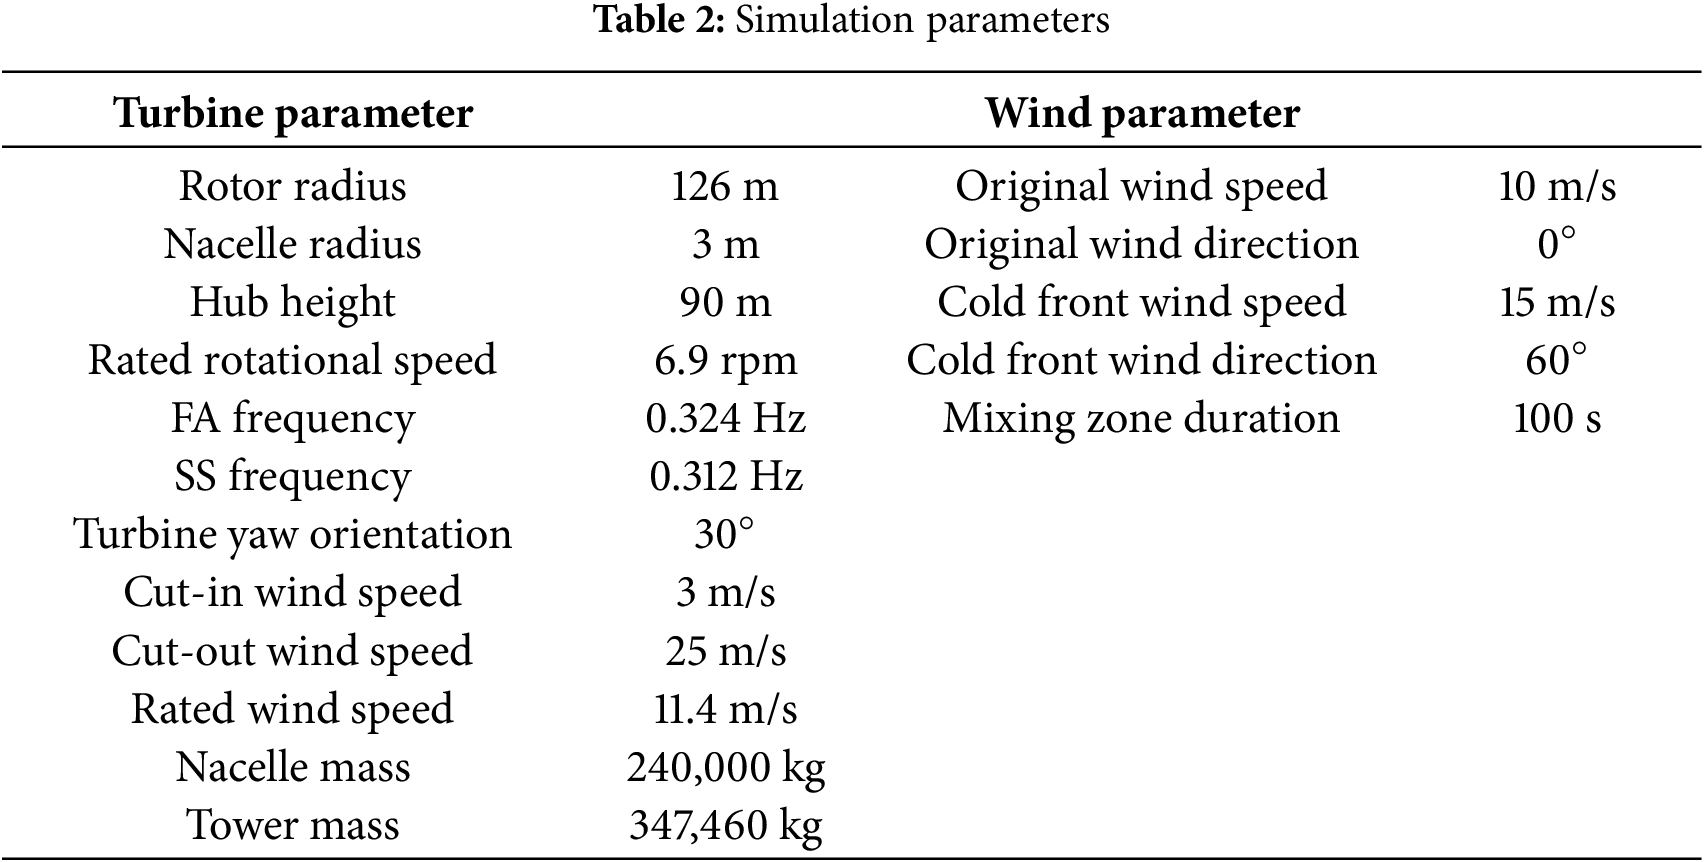
Owing to the sectional structure of a cold front, the gust front at different heights of the wind turbine rotor can be approximated as straight lines. Consequently, for a turbine subjected to a cold front, multiple coverage states are defined based on the percentage of rotor height affected by the cold front.
As illustrated in Fig. 7, the rotor is divided into four equal segments, yielding seven distinct coverage states. In Fig. 7, blue represents the pre-cold-front wind field, yellow denotes the mixing zone, and red indicates the cold pool region.
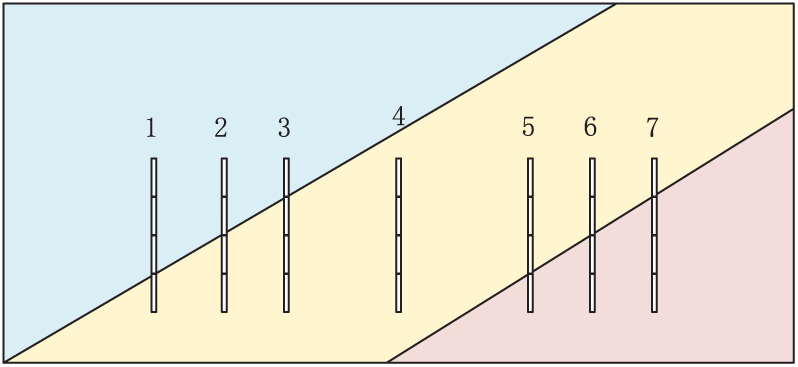
Figure 7: Seven rotor coverage states
5.2 Adaptive AOA Difference IPC Comparison
First, the effectiveness of the optimization results and the adaptive AOA difference IPC strategy is compared. Evaluations are conducted across all seven coverage states, with results benchmarked against the baseline case without pitch control, as summarized below:
As shown in Table 3, the results of optimizing the three objectives with corresponding weights using PSO are presented. Among these, the Type 4 (full coverage) state achieves the optimal load optimization performance. This outcome arises because, under full coverage, the wind speed and direction gradients across the rotor are smooth and continuous without abrupt changes. In contrast, other coverage states consist of a mixture of the mixing zone, gradient wind, and gust components, resulting in uneven wind speed and direction gradients along the height axis, which diminishes the optimization effect. Under the same conditions, using pitch data derived directly from the CIA and the optimal AOA as input yields the results shown in Table 4.
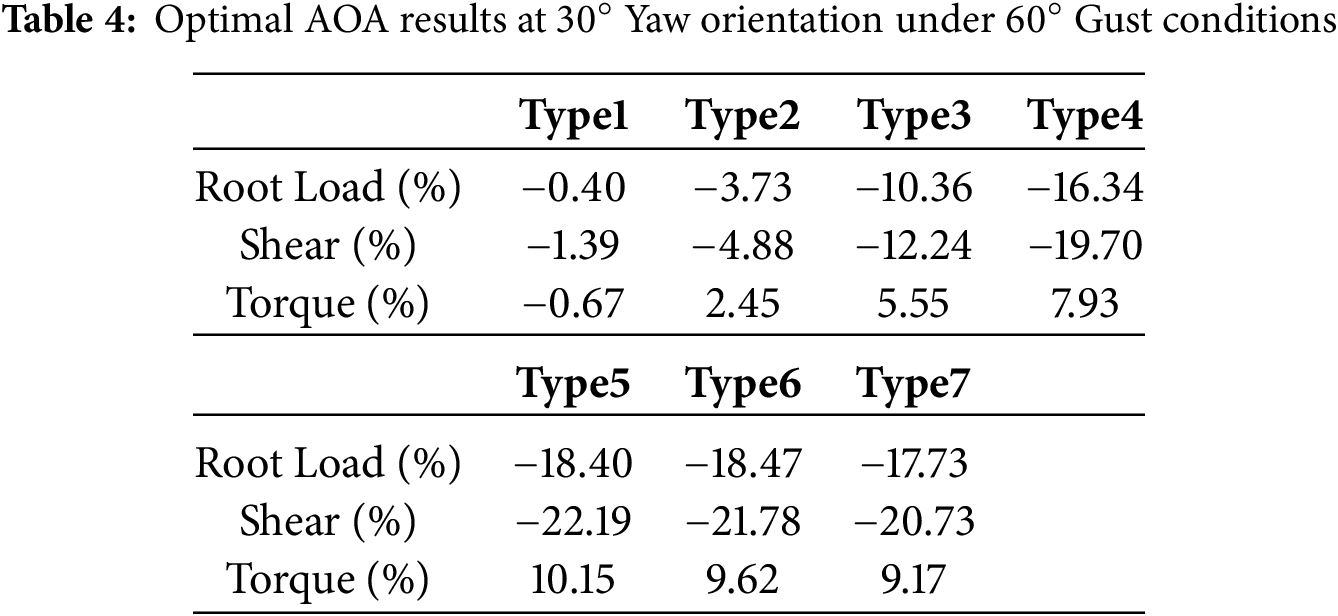
The results optimized using the AOA difference approach place greater emphasis on improving load performance. As shown in Table 4, compared to the PSO optimization results, the blade root load optimization improved by an average of 64.84%, and the shear stress optimization improved by an average of 66.35%. However, the torque optimization results decreased by an average of 43.37%. This phenomenon occurs because the PSO optimization method, based on a weighted multi-objective function, optimizes each target to varying degrees according to the assigned weights. Overall, the adaptive AOA difference control strategy achieves strong comprehensive optimization performance and demonstrates superior effectiveness in load optimization.
5.3 Tower Vibration Comparison
To further compare and validate the adaptive AOA difference control strategy, a two-degree-of-freedom nacelle dynamic model for FA and SS motions was developed, incorporating tower vibration characteristics. The vibration responses under three control schemes were analyzed: fixed 0° pitch angle, PSO-optimized pitch angle, and AOA difference-based pitch angle.
Fig. 8a,b displays the vibration response without pitch angle control in FA and SS, where the red and green dashed lines denote the rotor rotational frequency and its third harmonic, respectively. The vibration energy in the FA direction concentrates at the third harmonic, a phenomenon attributed to the excitation of fundamental tower vibration caused by the coupling between non-uniform inflow and wind turbine blades. In contrast, the SS vibration is dominated by the second harmonic, resulting from inflow imbalance between upper and lower sectors due to wind speed and its gradient.
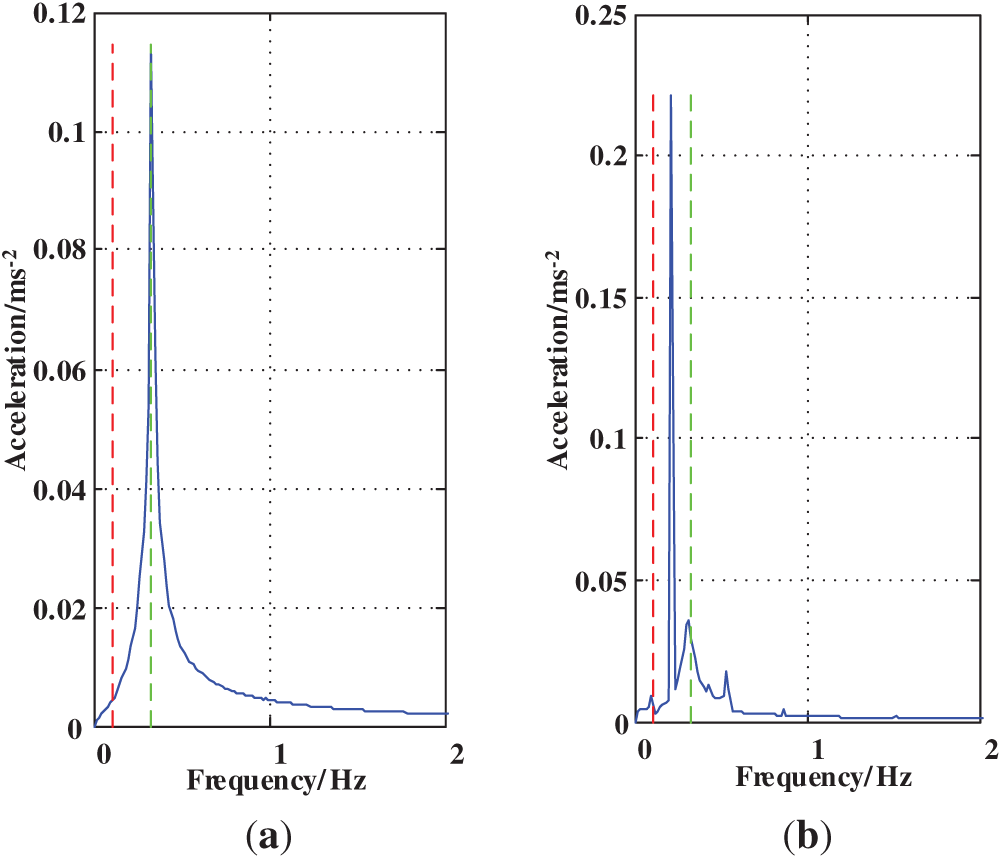
Figure 8: Frequency-domain diagrams of vibration without control. (a) FA acceleration spectrum (b) SS acceleration spectrum
Fig. 9 illustrates the vibration response under PSO-optimized control. Compared to the uncontrolled case, the non-smooth pitch angle transitions in the PSO strategy (as shown in Fig. 4) induce significant fluctuations in the load curves (Fig. 9a). Consequently, the FA and SS accelerations in Fig. 9b exhibit higher amplitudes at both the third and second harmonics relative to the uncontrolled scenario. Additionally, amplitudes from the third to the eighth harmonic in the SS frequency domain generally increase. These findings underscore a critical drawback of PSO-based control: while it reduces rotor fatigue loads, its abrupt control actions exacerbate tower vibrations, potentially compromising structural integrity in practical applications. This limitation highlights the need for smoother control transitions to minimize adverse effects on tower fatigue performance.
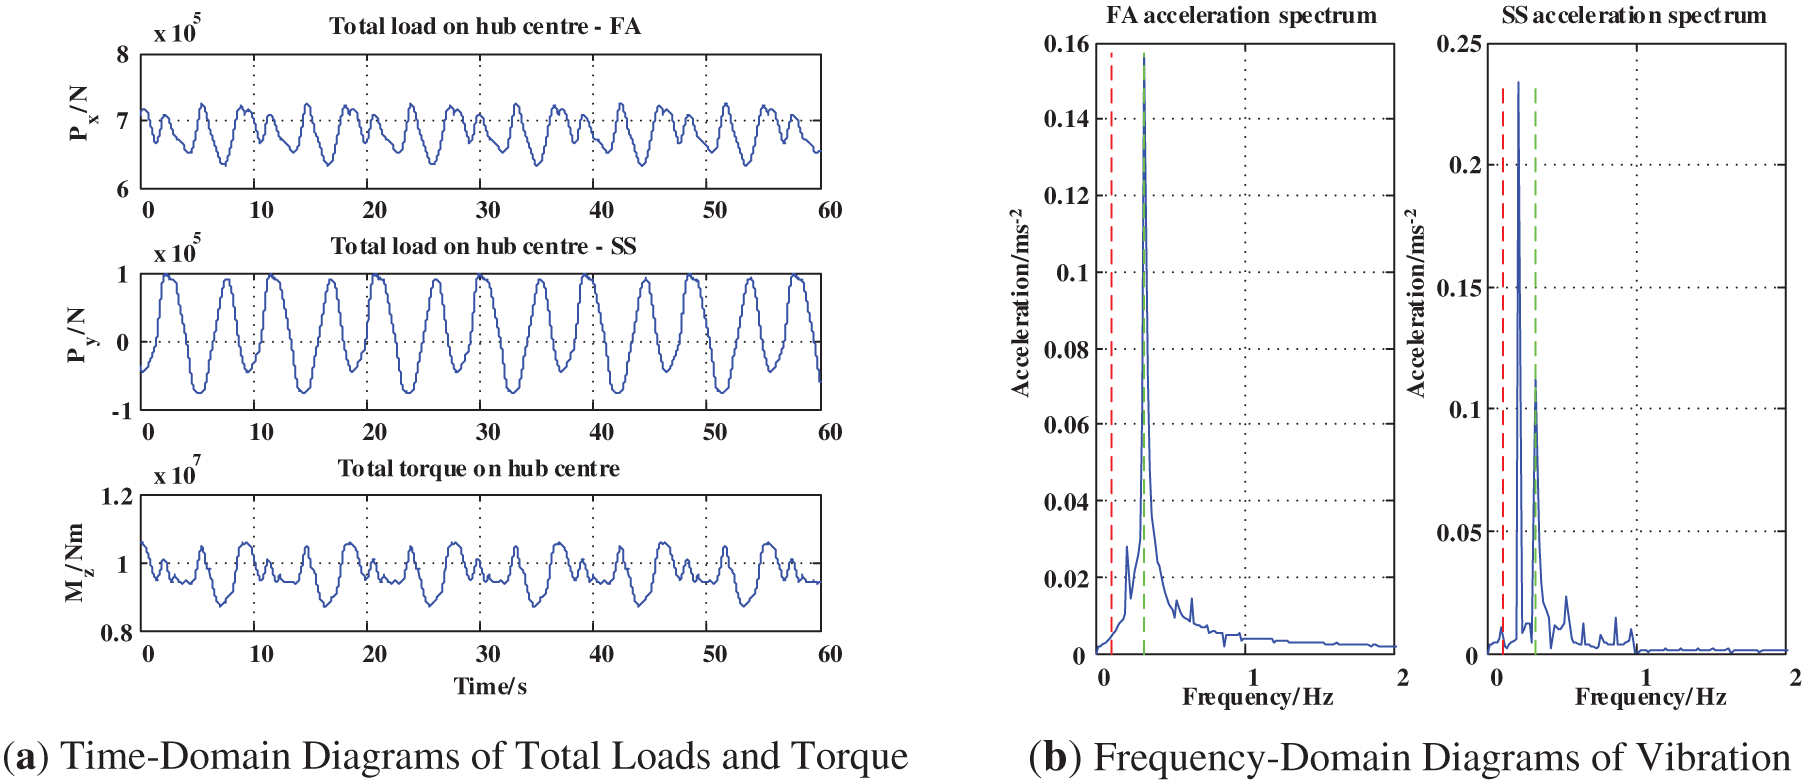
Figure 9: PSO-optimized control vibration analysis
Fig. 10 presents the vibration response under the AOA difference control strategy. Although this method also causes fluctuations in the load curves (Fig. 10a), its variations are smoother compared to PSO control. In the frequency domain (Fig. 10b), the amplitude of the third harmonic in the FA direction is lower than under PSO control, with only a minor peak at the second harmonic; responses in other frequency bands closely resemble the uncontrolled case. For SS vibration, the peak at the second harmonic is reduced relative to the uncontrolled scenario, and the amplitude at the third harmonic is also lower than in PSO control. A slight increase occurs at the fourth harmonic compared to PSO control, while components at the fifth harmonic and above are nearly eliminated. This smoother response demonstrates the superior adaptability of AOA difference control, as it effectively mitigates vibration magnitudes and attenuates high-frequency components without introducing excessive fluctuations. Such characteristics are vital for real-world wind turbines, where dynamic environmental conditions demand robust and stable control strategies.
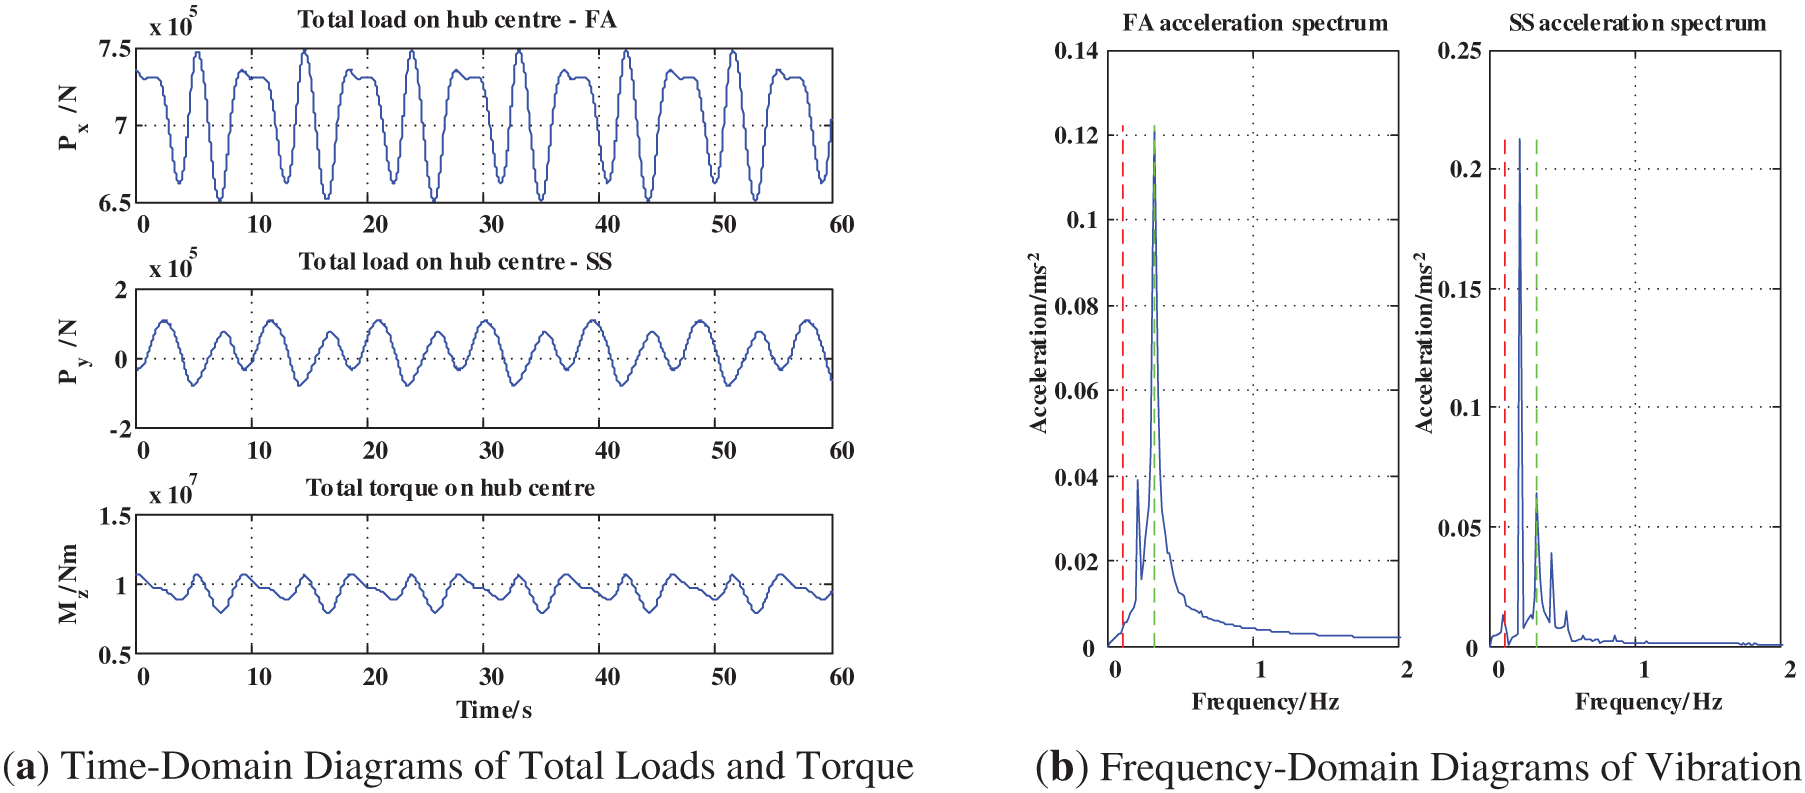
Figure 10: AOA difference IPC vibration analysis
To quantitatively assess the control strategies, Table 5 summarizes the maximum and harmonic acceleration responses extracted from the frequency domain analyses in Figs. 7–9. The data reveal that the PSO-optimized control, which aims to balance multiple objectives such as reducing fatigue loads and enhancing torque, leads to a 37.17% increase in FA acceleration and a dramatic 211.63% rise in third harmonic SS acceleration compared to the normal case. This vibration amplification stems from the inclusion of torque in the weighting setup of the PSO optimization. To enhance torque, the PSO strategy increases energy extraction from the wind. However, due to the sector-by-sector optimization process, the control actions become non-smooth, resulting in fluctuating energy absorption and consequently elevated vibrations. In practice, adjusting these weights for different scenarios would require repeated optimizations and corrections based on evolving baseline data, significantly increasing operational complexity, although this aspect is not directly reflected in the presented figures. Moreover, incorporating vibration metrics into PSO optimization introduces significant computational challenges. Since vibration analysis relies on time-domain simulations that require iterative computational steps, adding this as an objective expands dimensionality and drastically slows optimization speed, whereas other objectives like torque or load calculations can be resolved more efficiently in several steps.
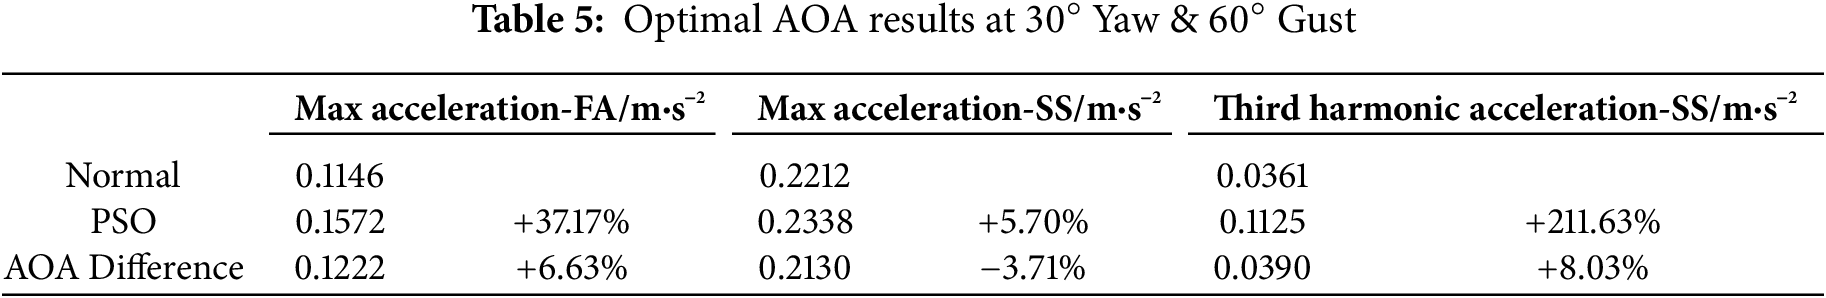
In contrast, the AOA difference control shows only a 6.63% increase in FA acceleration and a 3.71% reduction in SS acceleration, with a minimal 8.03% increase in third harmonic component, demonstrating a more balanced performance that effectively suppresses vibrations without imposing excessive computational burdens. This highlights that while PSO control may achieve data-level trade-offs, its practical utility is limited by vibration penalties and optimization inefficiencies, whereas the AOA strategy offers a more adaptable and scalable solution for real-world wind turbine deployments.
In summary, during cold front transit, dual gradients in wind speed and direction create non-uniform inflow across the rotor, exciting not only the third harmonic (related to the blade count) but also the second and fourth harmonics due to inflow imbalance. Direct application of PSO-optimized control may amplify vibration amplitudes from the first to the fifth harmonics, whereas the AOA difference control achieves comparable performance while suppressing vibration magnitudes and attenuating high-frequency components, demonstrating enhanced adaptability. From a practical perspective, the AOA difference control strategy offers significant benefits for wind turbine operations, including potential extensions in component lifespan and reductions in maintenance costs through minimized structural vibrations. However, critical challenges remain, such as the need for accurate sensor data and computational efficiency in real-time implementation. Future work should focus on integrating this strategy with other adaptive controls to further enhance reliability and scalability in diverse wind conditions.
This study has developed an adaptive AOA difference IPC strategy for wind turbines, grounded in cold front pre-observation. By dynamically computing pitch angles through comprehensive inflow analysis, the approach effectively addresses the limitations of traditional methods that rely on intelligent algorithms like PSO, enabling real-time responsiveness to complex wind dynamics during cold front transits. The key findings and contributions of this work are summarized as follows:
⮚ The proposed strategy introduces a predictive framework that integrates cold front pre-observation with adaptive IPC, eliminating the need for iterative optimization algorithms and reducing control latency. This represents a shift from reactive to proactive load management.
⮚ Significant reduction in rotor loads and mitigation of tower vibrations, enhancing structural integrity and operational safety.
⮚ Improved power generation output and alleviation of power dips caused by gusts, thereby strengthening grid integration stability and reliability.
The study provides a validated model-based approach for IPC, offering both a theoretical foundation and practical guidelines for engineering applications in wind farms, particularly under extreme weather conditions.
In summary, this research demonstrates that the AOA difference IPC strategy not only optimizes load control but also balances efficiency and safety, contributing to the advancement of intelligent wind power systems.
Future research will focus on improving the accuracy of cold front pre-observation and the fidelity of the propagation model. Data-driven models could be developed using historical wind field data and lidar measurements to better capture the complex, non-linear dynamics of cold fronts. Such models would enable more precise real-time prediction of propagation speed and intensity gradients. Then, an adaptive pitch control strategy will be further improved to lay a foundation for practical engineering applications.
Acknowledgement: Not applicable.
Funding Statement: This project was supported by the National Key Research and Development Program of China, grant number 2023YFB4203200.
Author Contributions: The authors confirm contribution to the paper as follows: Conceptualization, Chao Luo and Zhixiang Zhang; methodology, Zhixiang Zhang; software, Zhixiang Zhang and Chen Zhang; validation, Zheng Li, Yihua Zhu and Xu Cai; formal analysis, Zhixiang Zhang and Chao Luo; investigation, Zhixiang Zhang; resources, Chen Zhang; writing—review and editing, Zhixiang Zhang; visualization, Zhixiang Zhang; supervision, Zheng Li and Yihua Zhu; project administration, Yihua Zhu and Xu Cai; funding acquisition, Chen Zhang. All authors reviewed the results and approved the final version of the manuscript.
Availability of Data and Materials: Due to the nature of this research, participants of this study did not agree for their data to be shared publicly, so supporting data is not available.
Ethics Approval: Not applicable.
Conflicts of Interest: The authors declare no conflicts of interest to report regarding the present study.
References
1. Koondhar MA, Albsha L, Mahmoud SA, Amin LG, Mahariq I. Comparative analysis of onshore, offshore, and floating wind turbines for renewable energy systems: a review. Ocean Eng. 2026;343(part 1):123243. [Google Scholar]
2. Zheng J, Abulikemu A, Wang Y, Kong M, Liu Y. Convection initiation associated with the merger of an immature sea-breeze front and a gust front in Bohai Bay Region, North China: a case study. Atmosphere. 2022;13(5):750. doi:10.3390/atmos13050750. [Google Scholar] [CrossRef]
3. Devesse K, Lanzilao L, Jamaer S, van Lipzig N, Meyers J. Including realistic upper atmospheres in a wind-farm gravity-wave model. Wind Energy Sci. 2022;7(4):1367–82. doi:10.5194/wes-7-1367-2022. [Google Scholar] [CrossRef]
4. Li J, Dou J, Lenschow DH, Zhou M, Meng L, Qiu X, et al. Analysis of boundary layer structure, turbulence, and flux variations before and after the passage of a sea breeze front using meteorological tower data. J Meteor Res. 2023;37(6):855–77. doi:10.1007/s13351-023-3057-y. [Google Scholar] [CrossRef]
5. Lucas Frutuoso TR, Castro R, Santos Pereira RB, Moutinho A. Advancements in wind farm control: modelling and multi-objective optimization through yaw-based wake steering. Energies. 2025;18(9):2247. doi:10.3390/en18092247. [Google Scholar] [CrossRef]
6. Asgari A, Ahmadtabar Sorkhi SF. Wind turbine performance under multi-hazard loads: wave, wind, and earthquake effects on liquefiable soil. Results Eng. 2025;26:104647. doi:10.1016/j.rineng.2025.104647. [Google Scholar] [CrossRef]
7. Wang B, Ding L, Xiao T, Chen Y. An integrated multi-timescale MPC framework for coordinated wind farm power maximization, load management, and grid support. Renew Energy. 2026;256:123903. doi:10.1016/j.renene.2025.123903. [Google Scholar] [CrossRef]
8. Liu S, Gao Z, Su R, Yan M, Wang J. Impact of blade-flapping vibration on aerodynamic characteristics of wind turbines under yaw conditions. Energy Eng. 2024;121(8):2213–29. doi:10.32604/ee.2024.049616. [Google Scholar] [CrossRef]
9. Ao J, Li Y, Hu S, Gao S, Yao Q. Data-driven modeling for wind turbine blade loads based on deep neural network. Energy Eng. 2024;121(12):3825–41. doi:10.32604/ee.2024.055250. [Google Scholar] [CrossRef]
10. Zareian M, Rasam A, Hashemi Tari P. A detached-eddy simulation study on assessing the impact of extreme wind conditions on load and wake characteristics of a horizontal-axis wind turbine. Energy. 2024;299:131438. doi:10.1016/j.energy.2024.131438. [Google Scholar] [CrossRef]
11. Loew S, Bottasso CL. Lidar-assisted model predictive control of wind turbine fatigue via online rainflow counting considering stress history. Wind Energy Sci. 2022;7(4):1605–25. doi:10.5194/wes-7-1605-2022. [Google Scholar] [CrossRef]
12. Safaeinejad A, Rahimi M, Zhou D, Blaabjerg F. Pitch control scheme considering entire dynamics and full-load region in PMSG-based wind turbines. IEEE Trans Sustain Energy. 2025;16(2):955–69. doi:10.1109/TSTE.2024.3493961. [Google Scholar] [CrossRef]
13. Liu C, Gupta A, Rotea MA. Wind turbine gust load alleviation with active flow control. Energies. 2022;15(17):6474. doi:10.3390/en15176474. [Google Scholar] [CrossRef]
14. Steinheuer J, Beyrich F, Löhnert U. Exploiting the full potential of Doppler lidars: high-resolution wind-gust profiling in significant weather. Q J R Meteor Soc. 2025;151(769):e4961. doi:10.1002/qj.4961. [Google Scholar] [CrossRef]
15. Yuan J, Su L, Xia H, Li Y, Zhang M, Zhen G, et al. Microburst, windshear, gust front, and vortex detection in mega airport using a single coherent Doppler wind lidar. Remote Sens. 2022;14(7):1626. doi:10.3390/rs14071626. [Google Scholar] [CrossRef]
16. Gambier A. Pitch control of three bladed large wind energy converters—a review. Energies. 2021;14(23):8083. doi:10.3390/en14238083. [Google Scholar] [CrossRef]
17. Zavvar E, Abdelwahab HS, Uzunoglu E, Chen BQ, Guedes Soares C. Stress distribution on the preliminary structural design of the CENTEC-TLP under still water and wave-induced loads. J Mar Sci Eng. 2023;11(5):951. doi:10.3390/jmse11050951. [Google Scholar] [CrossRef]
18. Hassan A, Ahmad G, Shafiullah M, Islam A, Shafiul Alam M. Review of the intelligent frameworks for pitch angle control in wind turbines. IEEE Access. 2025;13:29864–85. doi:10.1109/ACCESS.2025.3540367. [Google Scholar] [CrossRef]
19. Zhang Y, Song C, Li Z. Influence of wind turbine structural parameters on wind shear and tower shadow effect. Energy Eng. 2022;120(2):501–10. doi:10.32604/ee.2023.021423. [Google Scholar] [CrossRef]
20. Zavvar E, Rosa-Santos P, Taveira-Pinto F, Ghafoori E. Lifetime extension of offshore support structures of wind turbines: a review. Renew Sustain Energy Rev. 2025;217:115788. doi:10.1016/j.rser.2025.115788. [Google Scholar] [CrossRef]
21. Xu C, Xiao X. Comparison of cold pool characteristics of two distinct gust fronts over Bohai Sea Bay in China. Atmosphere. 2024;15(3):247. doi:10.3390/atmos15030247. [Google Scholar] [CrossRef]
22. Hoeller J, Haerter JO, Da Silva NA. Characteristics of station-derived convective cold pools over equatorial Africa. Geophys Res Lett. 2024;51(6):e2023GL107308. doi:10.1029/2023GL107308. [Google Scholar] [CrossRef]
23. Casallas A, Tompkins AM, Muller C, Thompson G. Sensitivity of self-aggregation and the key role of the free convection distance. J Adv Model Earth Syst. 2025;17(3):e2024MS004791. doi:10.1029/2024MS004791. [Google Scholar] [CrossRef]
24. Abdelkhalig A, Elgendi M, Selim MYE. Review on validation techniques of blade element momentum method implemented in wind turbines. IOP Conf Ser Earth Environ Sci. 2022;1074(1):012008. doi:10.1088/1755-1315/1074/1/012008. [Google Scholar] [CrossRef]
25. National Renewable Energy Laboratory. Definition of a 5-MW reference wind turbine for offshore system development. 2009. Report No.: NREL/TP-500-38060. [cited 2025 Oct 1]. Available from: https://docs.nrel.gov/docs/fy09osti/38060.pdf. [Google Scholar]
Cite This Article
 Copyright © 2026 The Author(s). Published by Tech Science Press.
This work is licensed under a Creative Commons Attribution 4.0 International License , which permits unrestricted use, distribution, and reproduction in any medium, provided the original work is properly cited.
 Downloads
 Citation Tools