
 Submit a Paper
 Propose a Special lssue
 Open Access
ARTICLE

Research on Ultra-Short-Term Photovoltaic Power Forecasting Based on Parallel Architecture TCN-BiLSTM with Temporal-Spatial Attention Mechanism
1 School of Electrical Engineering, Shenyang Institute of Engineering, Shenyang, 110136, China
2 State Grid Liaoning Electric Power Co., Ltd., Electric Power Research Institute, Shenyang, 110006, China
3 School of Automation and Electrical Engineering, Lanzhou Jiaotong University, Lanzhou, 730070, China
* Corresponding Author: Xingyu Jiang. Email:
(This article belongs to the Special Issue: Advances in Renewable Energy Systems: Integrating Machine Learning for Enhanced Efficiency and Optimization)
Energy Engineering 2026, 123(4), 13 https://doi.org/10.32604/ee.2025.073012
Received 09 September 2025; Accepted 06 November 2025; Issue published 27 March 2026
 View Full Text
 Download PDF
Abstract
The accuracy of photovoltaic (PV) power prediction is significantly influenced by meteorological and environmental factors. To enhance ultra-short-term forecasting precision, this paper proposes an interpretable feedback prediction method based on a parallel dual-stream Temporal Convolutional Network-Bidirectional Long Short-Term Memory (TCN-BiLSTM) architecture incorporating a spatiotemporal attention mechanism. Firstly, during data preprocessing, the optimal historical time window is determined through autocorrelation analysis while highly correlated features are selected as model inputs using Pearson correlation coefficients. Subsequently, a parallel dual-stream TCN-BiLSTM model is constructed where the TCN branch extracts localized transient features and the BiLSTM branch captures long-term periodic patterns, with spatiotemporal attention dynamically weighting spatiotemporal dependencies. Finally, Shapley Additive explanations (SHAP) additive analysis quantifies feature contribution rates and provides optimization feedback to the model. Validation using operational data from a PV power station in Northeast China demonstrates that compared to conventional deep learning models, the proposed method achieves a 17.6% reduction in root mean square error (RMSE), a 5.4% decrease in training time consumption, and a 4.78% improvement in continuous ranked probability score (CRPS), exhibiting significant advantages in both prediction accuracy and generalization capability. This approach enhances the application effectiveness of ultra-short-term PV power forecasting while simultaneously improving prediction accuracy and computational efficiency.Keywords
Under the “Dual Carbon” strategy, the application of renewable energy is a critical pathway toward low-carbon emission reduction. The development and utilization of solar energy have led to a growing share of photovoltaic power generation. However, due to varying meteorological conditions, PV power generation exhibits significant volatility and uncertainty, substantially impacting the stable operation and optimal dispatch of power systems [1,2]. Therefore, constructing high-precision prediction models to accurately forecast power generation under different seasonal and weather conditions is crucial [3]. PV power forecasting can be systematically categorized into ultra-short-term, short-term, and medium-to-long-term forecasting [4]. Ultra-short-term forecasting models can better capture the dynamic characteristics of real-time PV power output, providing precise decision-making support for daily grid dispatch and optimization, thereby playing a key role in enhancing the flexibility and reliability of power system operations [5].
The accuracy of PV power forecasting is primarily constrained by meteorological randomness and the complexity of time series [6]. To address the volatility challenges caused by the coupling of meteorological factors and temporal dependencies in ultra-short-term forecasting, current research innovations mainly focus on simplifying data processing, selecting key features, optimizing model structures, and improving algorithm interpretability [7]. While these approaches enhance forecasting accuracy to some extent, they still suffer from respective limitations.
The CEEMDAN-TCN-BiLSTM-ESN model proposed in Ref. [8] effectively suppresses mode mixing through adaptive noise-assisted ensemble decomposition and enhances nonlinear fitting capabilities with an echo state network (ESN). However, the ESN reservoir parameters are highly sensitive, and computational complexity remains high. The ECA-MTGNN model in Ref. [9] employs graph attention mechanisms to model plant topology relationships, significantly reducing errors, but it heavily relies on geographical information and exhibits poor generalization. The black-winged kite algorithm used in Ref. [10] optimizes VMD parameters, greatly improving decomposition accuracy, but excessive iterations compromise real-time performance. The fractal theory-based feature extraction method in Ref. [11] significantly reduces mean absolute error, yet it exhibits lagged responses to sudden weather changes. The LGGWO-TCN-MHSA model in Ref. [12] utilizes Spearman correlation coefficients for feature selection, achieving substantial dimensionality reduction, and an improved grey wolf algorithm significantly lowers RMSE. However, its high-dimensional parameter search space imposes considerable computational burdens while failing to adequately account for temporal dependencies. The DTCN-BiLSTM-TSA framework in Ref. [13] extracts trend and detail features separately via dual-channel temporal convolutional networks, improving forecasting accuracy, but its serial structure significantly prolongs training time. The group-cross-gated GCN model in Ref. [14] clearly illustrates feature interactions, yet its performance heavily depends on graph structure quality. The SHAP-TCN-BiLSTM framework in Ref. [15] quantifies irradiation contributions via additive feature attribution, but increasing feature counts elevate computational complexity. Although the KOA optimization method in Ref. [16] improves parameter search efficiency, it still suffers from premature convergence. The empirical mode decomposition method in Ref. [17] is prone to endpoint effects, while the multi-scale convolutional structure in Ref. [18] enhances adaptability to abrupt weather changes but exhibits limited long-term dependency capture.
The above deep learning models mainly suffer from issues of insufficient prediction accuracy and precision due to factors related to time series and meteorological conditions. The DTCN-BiLSTM-TSA framework and the SHAP-TCN-BiLSTM framework can effectively address the impact of spatiotemporal factors on prediction accuracy. However, both frameworks have the problems of high computational complexity and longer training times. To address these challenges, this paper proposes an interpretable feedback-based PV power forecasting method that integrates a parallel TCN-BiLSTM structure [19] with a spatiotemporal attention mechanism: First, Pearson correlation coefficients [20] are used to screen strongly correlated features (e.g., irradiance), and autocorrelation analysis determines the optimal historical window, reducing input dimensionality and noise interference while avoiding decomposition-induced cumulative errors. Second, a parallel TCN-BiLSTM core architecture is constructed—the TCN branch extracts irradiance trends via dilated causal convolutions, while the BiLSTM branch captures periodic meteorological patterns using bidirectional gating mechanisms. A spatiotemporal attention module dynamically weights feature interactions, addressing TCN’s future information loss and the rigidity of traditional parallel feature fusion, thereby streamlining network architecture and accelerating computation. Finally, SHAP additive explanations quantify feature contributions [21], resolving the “black-box” issue and providing physically interpretable insights for dispatch decision-making.
2.1 TCN-BiLSTM Parallel Dual-Stream Architecture
Photovoltaic power generation exhibits distinct diurnal periodicity and weather dependence, requiring the capture of characteristic patterns over extended time spans. The Temporal Convolutional Network (TCN) addresses this need through stacked dilated causal convolutional layers that expand the receptive field to effectively capture multi-timescale temporal patterns [22]. TCN can process longer input sequences, which helps simplify the model architecture while preventing gradient explosion, and enables the construction of larger receptive fields without requiring excessive network depth.
By employing TCN, the convolutional operations can extract correlation patterns between different features at concurrent timesteps from the input time-series data. Fig. 1 illustrates the TCN convolutional architecture, where adjusting network parameters such as the dilation coefficient in the Dilated Causal Convolution (DCC) network can effectively expand the input receptive field. The conclusions from the DCC operation are as follows:
where, DCC(T) is the output computation of DCC at time step T.
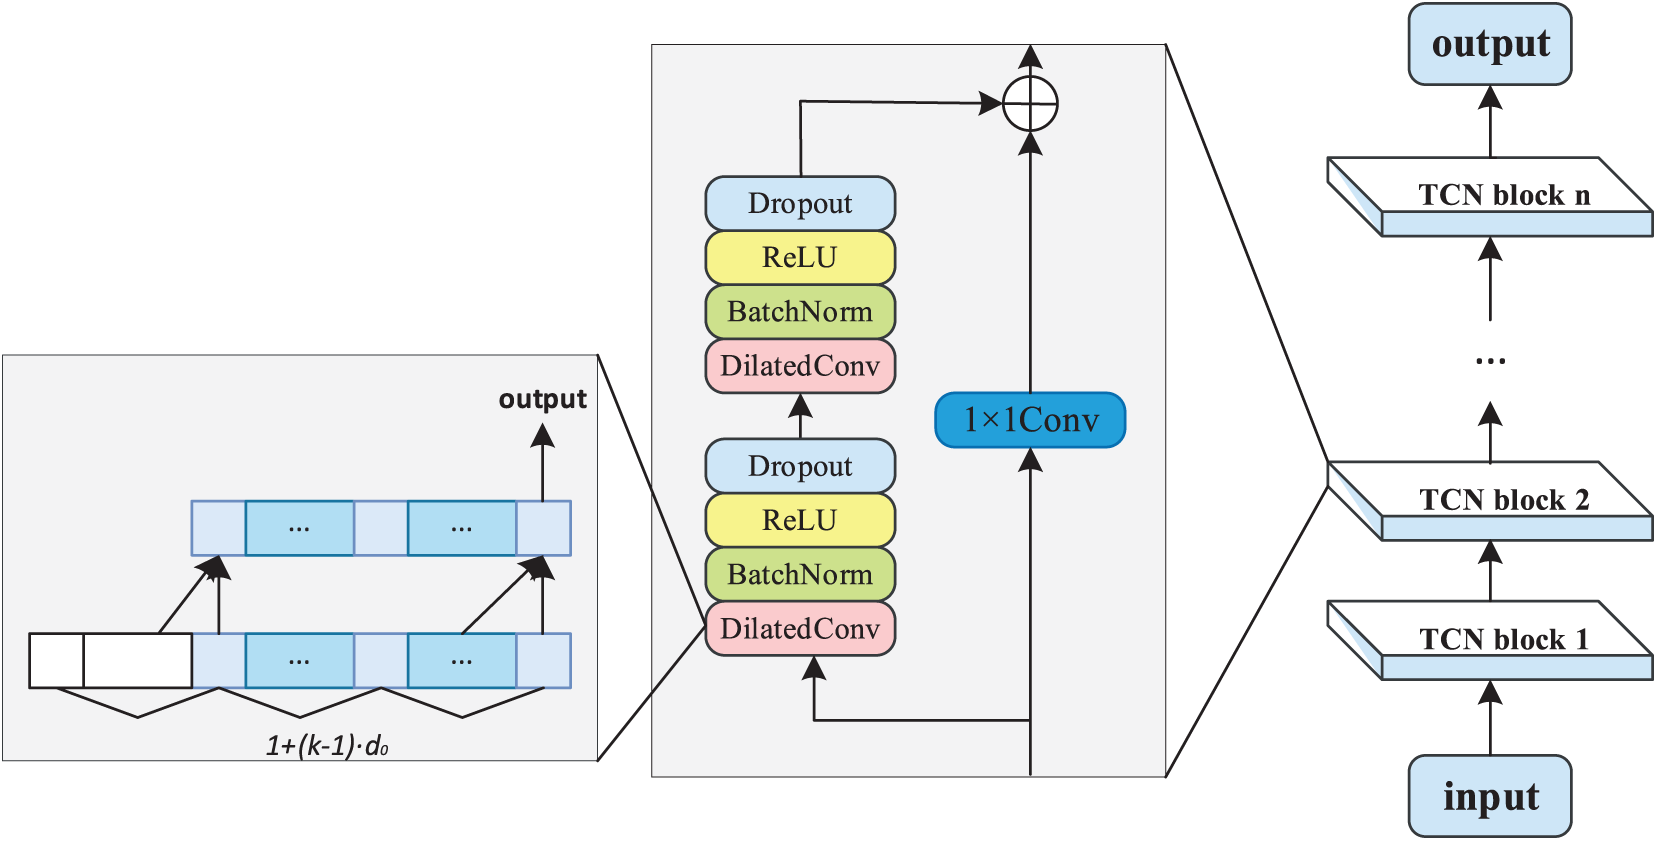
Figure 1: Schematic illustration of TCN
The residual block is computed as follows:
where, L represents the input data before residual connection. G denotes the operations of DCC and normalization. Conv1(·) indicates the convolution operation. δ stands for the activation function.
To effectively capture both short-term fluctuations and long-term trends in photovoltaic power forecasting, a time-series model capable of learning bidirectional temporal dependencies is required. The Bidirectional Long Short-Term Memory network (Bi-LSTM) incorporates gated units comprising three control mechanisms: input gate, output gate, and forget gate, which collectively determine the hidden state transmission between timesteps. By implementing a bidirectional architecture that adds reverse-direction hidden layer propagation [23], Bi-LSTM performs both forward and backward state transmissions during hidden state updates. This unique operational mechanism enhances the model’s nonlinear fitting capability and improves prediction accuracy for photovoltaic power generation cycles, with its detailed structure illustrated in Fig. 2.
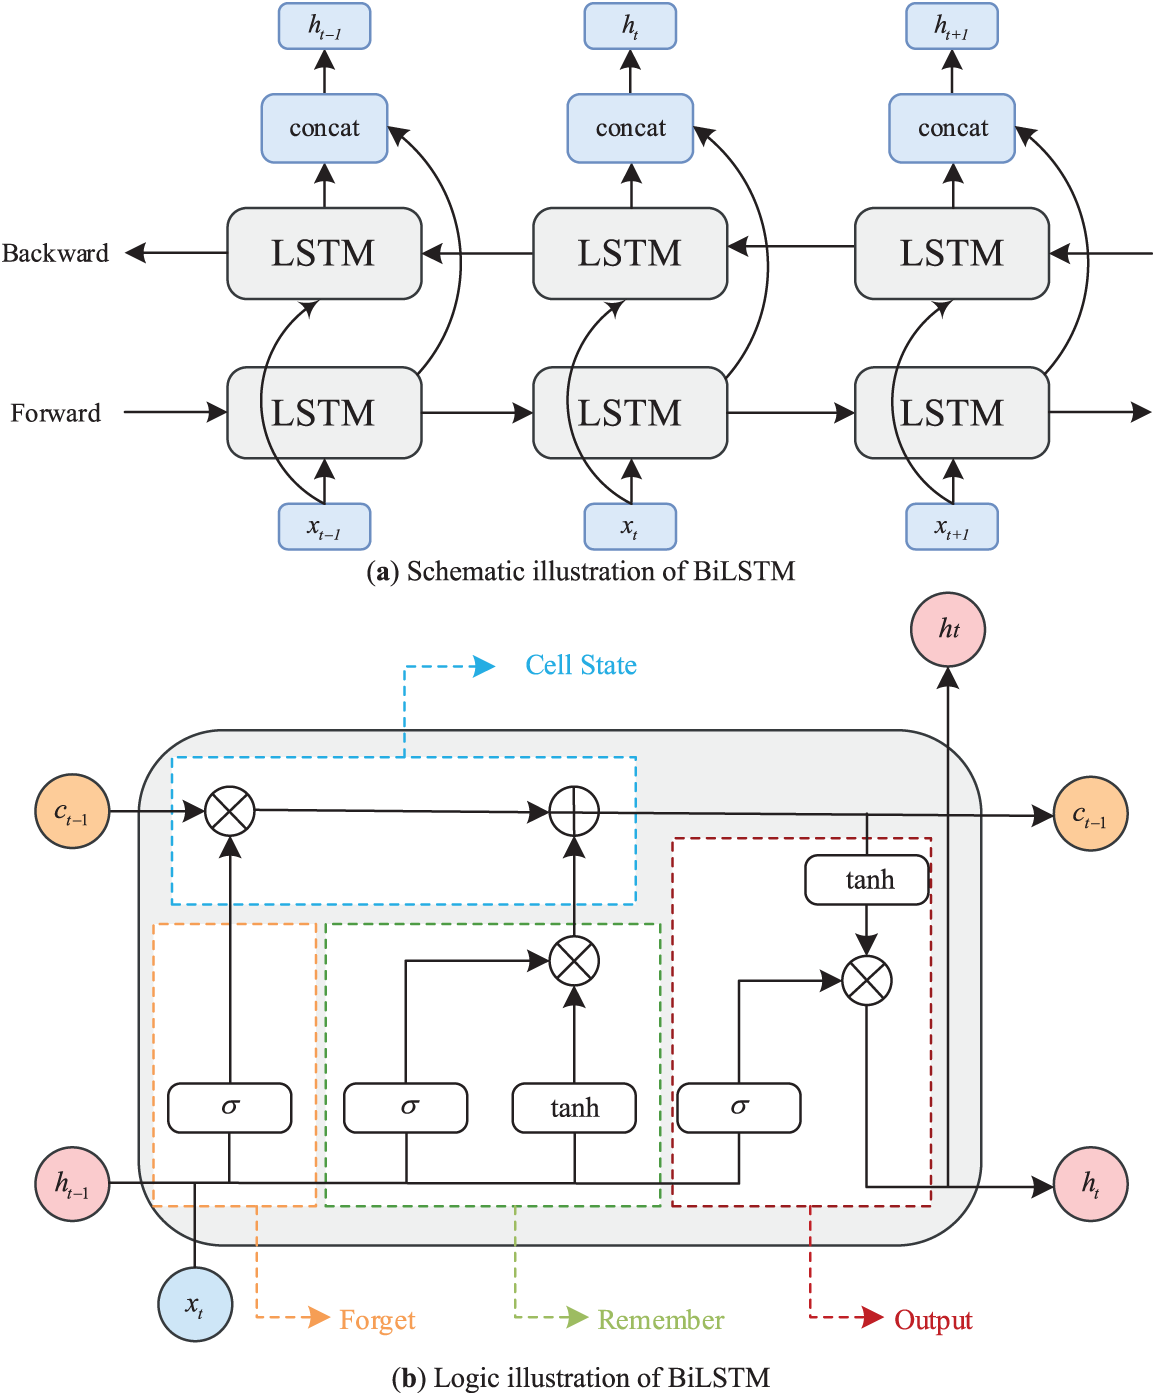
Figure 2: Bidirectional long short-term memory network architecture diagram
Let
where,
where,
TCN and BiLSTM each have advantages in perceiving local features and long-term temporal dependencies. Traditional model architectures employ serial concatenation structures to capture both local and global temporal patterns, but overly complex models require more computational memory and time, significantly increasing training costs. This adversely affects the timeliness of ultra-short-term predictions, leading to increased computational costs and substantially reduced efficiency during training.
The parallel dual-stream prediction model utilizes a tensor pooling concatenation module to merge the output matrices of both models along the feature dimension, achieving feature information fusion, and generates target values through output neurons. By adopting a parallel structure, all individual models within the hybrid model can be trained independently side by side, learning feature information from the original time series before the tensor concatenation module. Thus, the depth of the hybrid model is not increased by stacking network layers. Furthermore, the tensor concatenation module combines the feature information learned by each individual model, fully preserving their respective perceptual capabilities. Consequently, this parallel dual-stream structure maintains feature learning and perceptual ability while significantly improving learning efficiency and drastically reducing training time costs due to reduced model depth. A schematic diagram of the parallel structure is shown in Fig. 3.
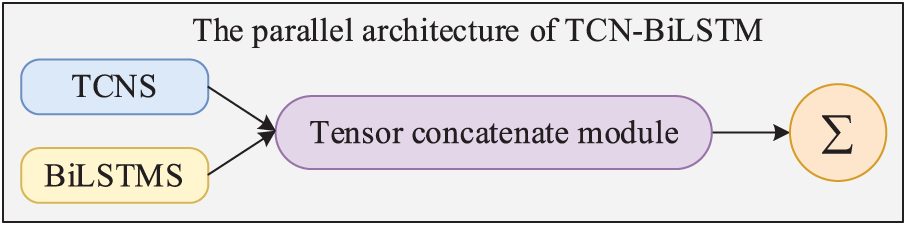
Figure 3: TCN-BiLSTM parallel dual-stream architecture schematic diagram
2.2 Temporal-Spatial Attention
Photovoltaic power generation is simultaneously influenced by local meteorological factors and temporal periodicity, exhibiting continuous fluctuation characteristics. However, conventional TCN and Bi-LSTM prediction models equally process all temporal and spatial features in photovoltaic power forecasting, failing to adapt to scenarios like abrupt weather changes. By integrating a Temporal-Spatial Attention (TSA) mechanism with the parallel TCN-BiLSTM architecture, dynamic adjustment of spatial features from TCN outputs and temporal features from Bi-LSTM outputs can be achieved. The multi-head mechanism enables parallel learning of spatiotemporal relationships across different subspaces, followed by lightweight feature fusion through tensor pooling concatenation. This approach significantly enhances the performance of photovoltaic power prediction models under complex weather conditions.
The calculation formula of Temporal-Spatial Attention is as follows:
where, s and t represent spatial and temporal features, respectively, Q is the query vector, K is the key vector, V is the value vector,
The multi-head attention extension calculation formula is as follows, where h = 4 represents minute fluctuations, hourly trends, spatial coupling, and anomaly detection, respectively.
where,
Feature fusion decision enables complementary information enhancement of spatiotemporal features while reducing output dimensionality. The fusion incorporates RELU activation functions to model the irradiance-power exponential relationship and introduce nonlinear transformation capabilities. The calculation formula is as follows:
where,
3 Photovoltaic Power Generation Forecasting Model Based on Parallel TCN-BiLSTM-TSA
This paper proposes a photovoltaic power forecasting model framework based on a parallel TCN-BiLSTM architecture for spatiotemporal feature analysis, comprising three components: data preprocessing, model operation analysis, and post-model decision processing, forming a closed-loop optimization system.
First, in the data preprocessing stage, Pearson correlation analysis and autocorrelation analysis are conducted to examine the key influencing factors of photovoltaic power generation and the temporal dependencies within the time series, identifying data that significantly impacts the current forecast. Based on statistical analysis of the raw data, a fixed-length historical window is determined and set as the model’s input time step, primarily considering the correlation between historical values of the target variable (photovoltaic power) while optimizing the sequence length. The determined historical window is then fed as input into the parallel dual-stream TCN and Bi-LSTM structure. The TCN extracts spatial local feature patterns through dilated convolutions, while the Bi-LSTM captures temporal dependencies via bidirectional memory units, achieving the goal of spatiotemporal feature decoupling. Subsequently, a spatiotemporal feature attention mechanism dynamically optimizes feature representations, followed by lightweight feature fusion through tensor pooling concatenation. Finally, the output results undergo SHAP additive explanation analysis and feedback optimization to form an interpretable closed-loop model.
Through model training and optimization, as well as comparative analysis with other models and real-world data, the model’s advantages and reliability are validated. The overall forecasting architecture is illustrated in Fig. 4.
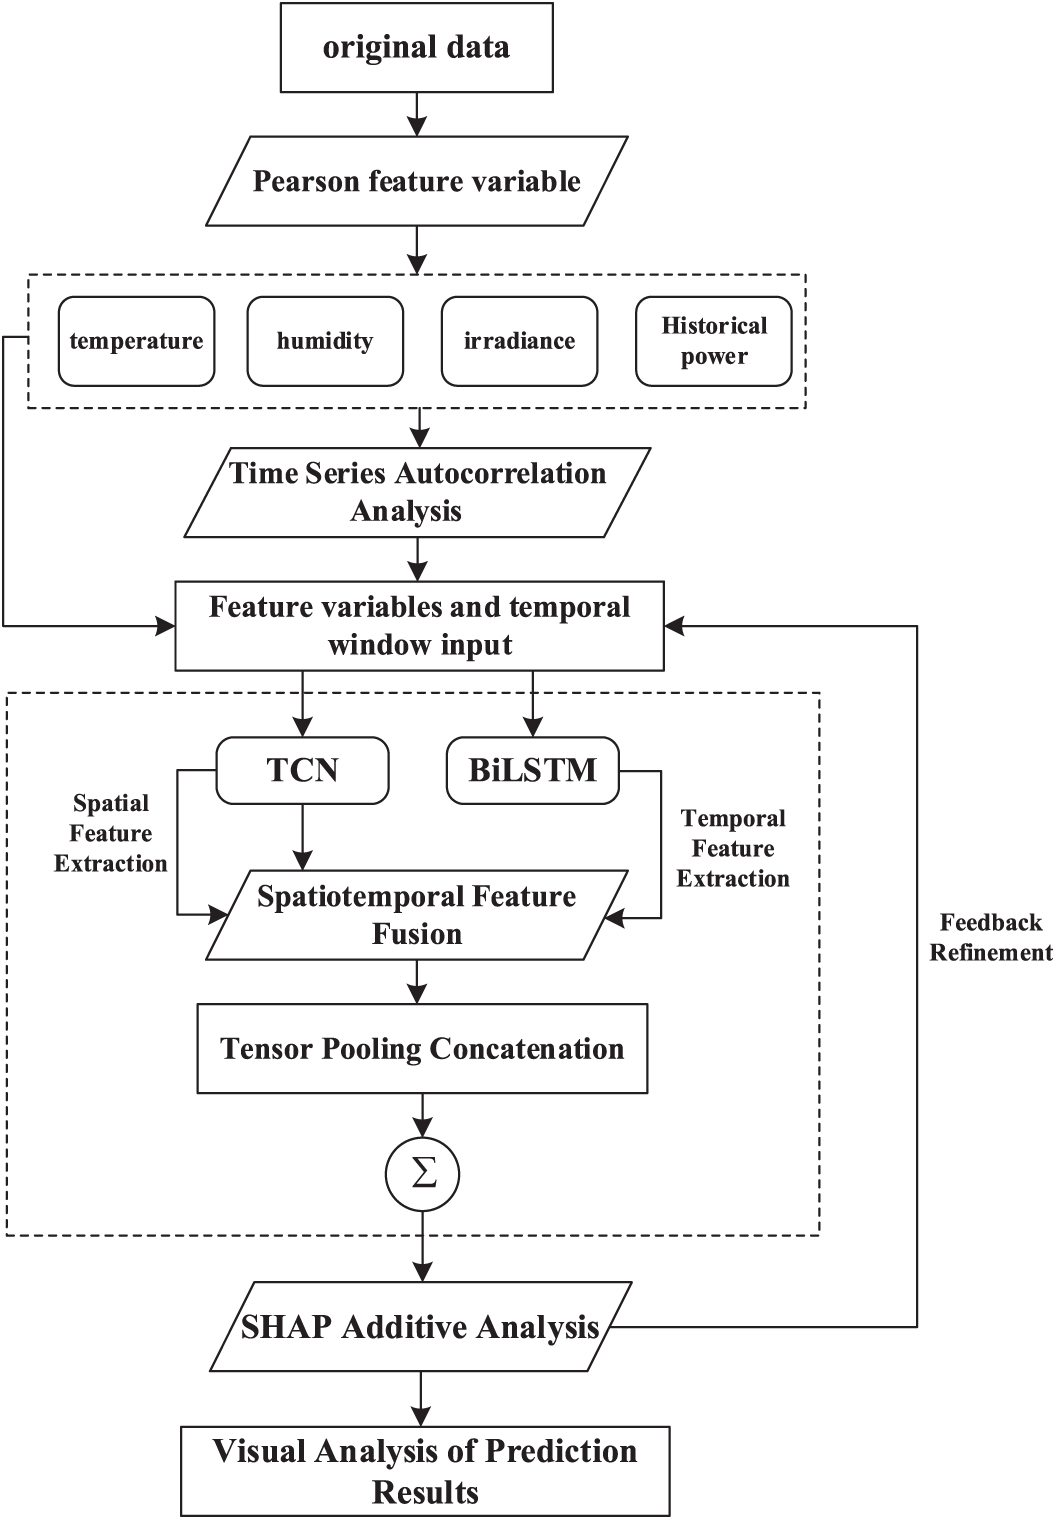
Figure 4: Framework diagram of photovoltaic power forecasting
3.1 Pearson Correlation Input Analysis
The actual power generation output of photovoltaic systems, known as active power output, is influenced by various factors. The active power output formula is as follows:
where,
In the actual process of photovoltaic power generation, the effect of solar irradiance is influenced by factors such as solar incidence angle, cloud cover, and dust shading. The module conversion efficiency ηmodule of the system is primarily affected by temperature. Accurate photovoltaic power prediction requires considering these correlated factors, but each factor impacts PV output to varying degrees. Insufficient consideration of these factors will significantly reduce prediction accuracy, while incorporating all factors will drastically increase the system’s input dimensions, affecting the model’s computation and learning efficiency and negatively impacting the timeliness of short-term forecasting. Therefore, we process the input variables by combining Pearson correlation analysis. As shown in the Fig. 5.
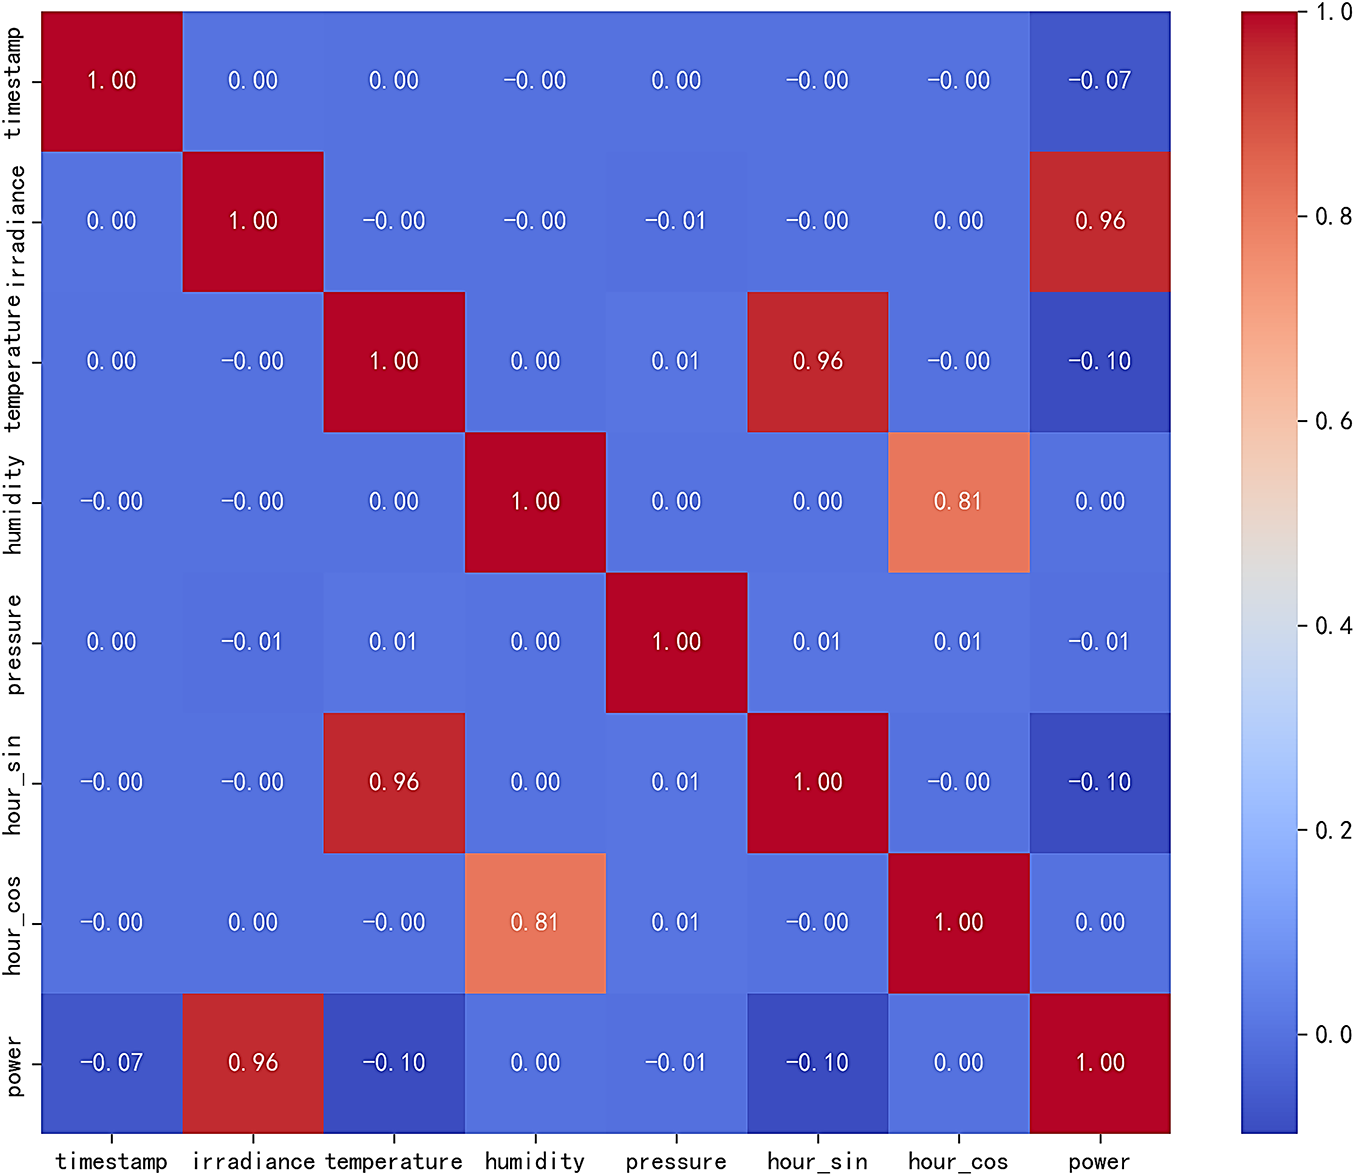
Figure 5: Pearson correlation coefficient matrix plot
As evident from the heatmap, irradiance exhibits the highest correlation 0.96, making it the most critical influencing factor. The hourly sine value (hour_sin) also shows a correlation of 0.96, indirectly reflecting the temporal distribution of irradiance throughout the day, thus serving as another key predictive feature for power output. Temperature demonstrates a correlation of 0.81, indicating its significance as both excessive heat and cold can reduce solar cell conversion efficiency. In contrast, humidity and air pressure display lower correlations, suggesting their minimal impact on PV output. Consequently, the primary input variables for PV power forecasting can be identified as irradiance, temperature, and time-periodic factors.
3.2 Autocorrelation Function Analysis
Based on the Pearson analysis results, it can be concluded that temporal periodicity is one of the important influencing factors affecting photovoltaic output. Therefore, autocorrelation analysis [24] must be performed on the photovoltaic power generation sequence to determine historical windows based on statistical patterns, analyze the temporal dependencies within the time series, identify historically significant time-point data that substantially influence current predictions, and reveal temporal correlations between power generation outputs at different time steps. The autocorrelation function is calculated as follows:
where,
The resolution of the photovoltaic power generation dataset is 15 min, and its autocorrelation analysis results are shown in Fig. 6.
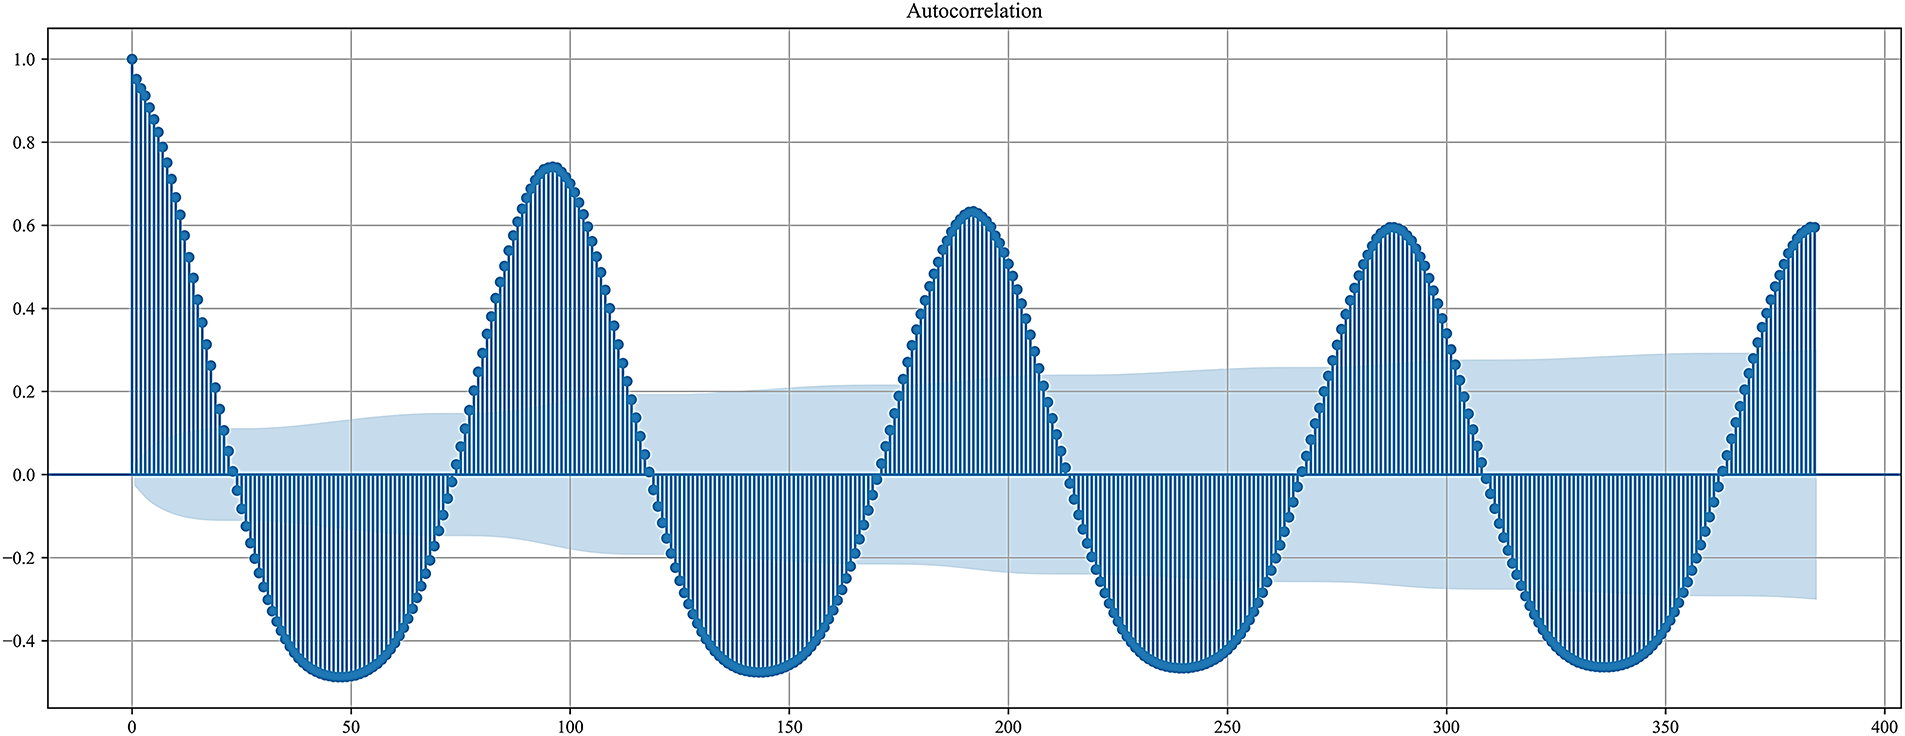
Figure 6: Autocorrelation variation of PV power sequence
Fig. 6 shows that the photovoltaic power output exhibits an autocorrelation coefficient greater than 0.4 at a 3-h lag, indicating significant correlation between current power generation and that from three hours prior. Moreover, the autocorrelation coefficient exceeds 0.6 for corresponding periods within a two-day lag, demonstrating distinct daily periodicity in PV power generation. Therefore, historical load data from the preceding 3 h and corresponding time periods from the previous two days were selected as input features for the model, validating the scientific rationale behind the chosen historical data time window and confirming pronounced intraday periodicity and 72-h persistence in PV power output.
3.3 SHAP Additive Contribution Analysis
The Shapley additive explanation technique [25] is employed to analyze the contribution of input features to the model, enhancing the interpretability of prediction results by quantifying how different features influence the output, thereby facilitating better understanding of model decisions. The expression is as follows:
where,
SHAP values are used for visual analysis and model interpretation, with 128 samples randomly selected from the training set to calculate the feature contributions within a specific time frame. SHAP conducts numerical analysis for prediction days in summer and winter, determining the specific contributions of each input feature, as shown in Fig. 7.
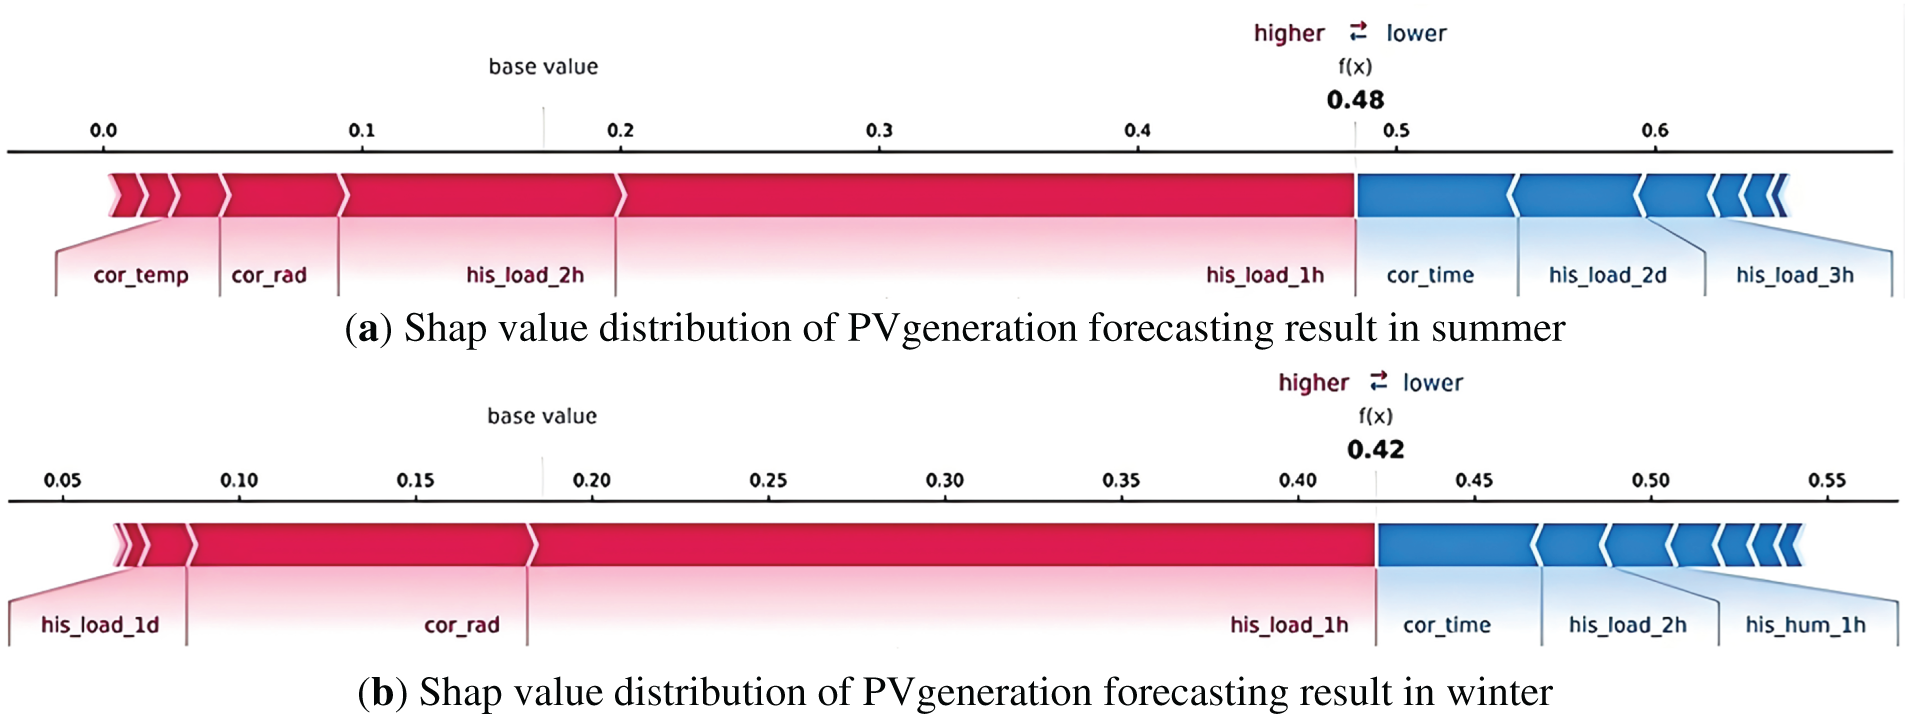
Figure 7: Shapley additive explanations analysis
The SHAP analysis results indicate that the contribution of irradiance reaches up to 62.3% in winter and 58.7% in summer, validating its role as a core variable in photovoltaic power prediction. It also confirms the conclusion from Pearson analysis that irradiance intensity exhibits a strong positive correlation with the output power of photovoltaic modules. Additionally, the analysis suggests that high summer temperatures may lead to a decrease in component efficiency, reflected by negative SHAP values, while low winter temperatures combined with high irradiance result in positive SHAP values, potentially linked to enhanced snow reflection. The autocorrelation analysis of model inputs and Pearson analysis form a closed-loop feedback optimization, identifying strongly correlated factors for input.
The probabilistic forecasting model for photovoltaic power requires selecting an appropriate loss function to guide the training process, which should effectively reflect the proximity between the predicted probability distribution and the true distribution. Root mean square error (RMSE), mean absolute percentage error (MAPE), mean absolute error (MAE), and continuous ranked probability score (CRPS) are chosen as evaluation metrics for the forecasting model. RMSE, MAPE, and MAE can respectively reflect large errors, average errors, and relative errors of the forecasting model, all of which belong to point forecasting methods. A comprehensive evaluation of the model’s prediction accuracy also requires combining continuous ranked probability score (CRPS), for interval probabilistic forecasting.
CRPS is one of the most widely used comprehensive evaluation metrics in probabilistic forecasting, capable of assessing the global performance of predictive distributions across the entire domain. Therefore, it is selected in this paper as the loss function for combined probabilistic forecasting of photovoltaic power. Its definition formula is:
where,
4 Experimental Results and Analysis
To validate the correctness and effectiveness of the model and methodology proposed in this study, simulation experiments were conducted using photovoltaic power output and meteorological data provided by a solar power plant in Northeast China covering the period from 01 January 2024 to 31 December 2024. The power plant is located primarily on flat terrain with an average elevation near sea level, featuring a total installed capacity of 750 kW and a sampling interval of 15 min (yielding 96 data points per day). As photovoltaic systems generate zero output during nighttime hours, this experiment exclusively utilized data collected between 05:30 and 19:30 daily. Furthermore, prediction performance was demonstrated across five characteristic weather conditions: sunny, cloudy, overcast, rainy, and snowy days.
4.1 Prediction Results of Different Models for Short-Term Photovoltaic Power Forecasting
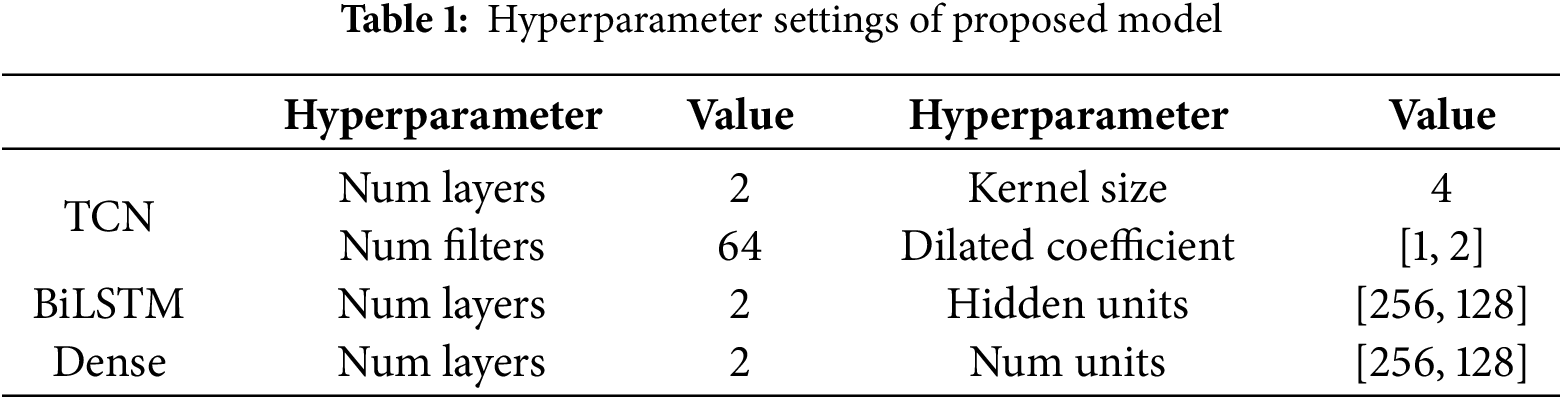
Following data preprocessing and correlation analysis, parameter configuration for the parallel TCN-BiLSTM-TSA model architecture was performed, with detailed model parameters specified in Table 1.
Through Pearson correlation analysis and SHAP additive explanations applied to the input data, we completed data cleaning and selected highly representative samples. Based on the temporal periodicity results from autocorrelation analysis, the experiment employed four consecutive days as the test set to validate the model’s superior performance, with prediction outcomes illustrated in Fig. 8.
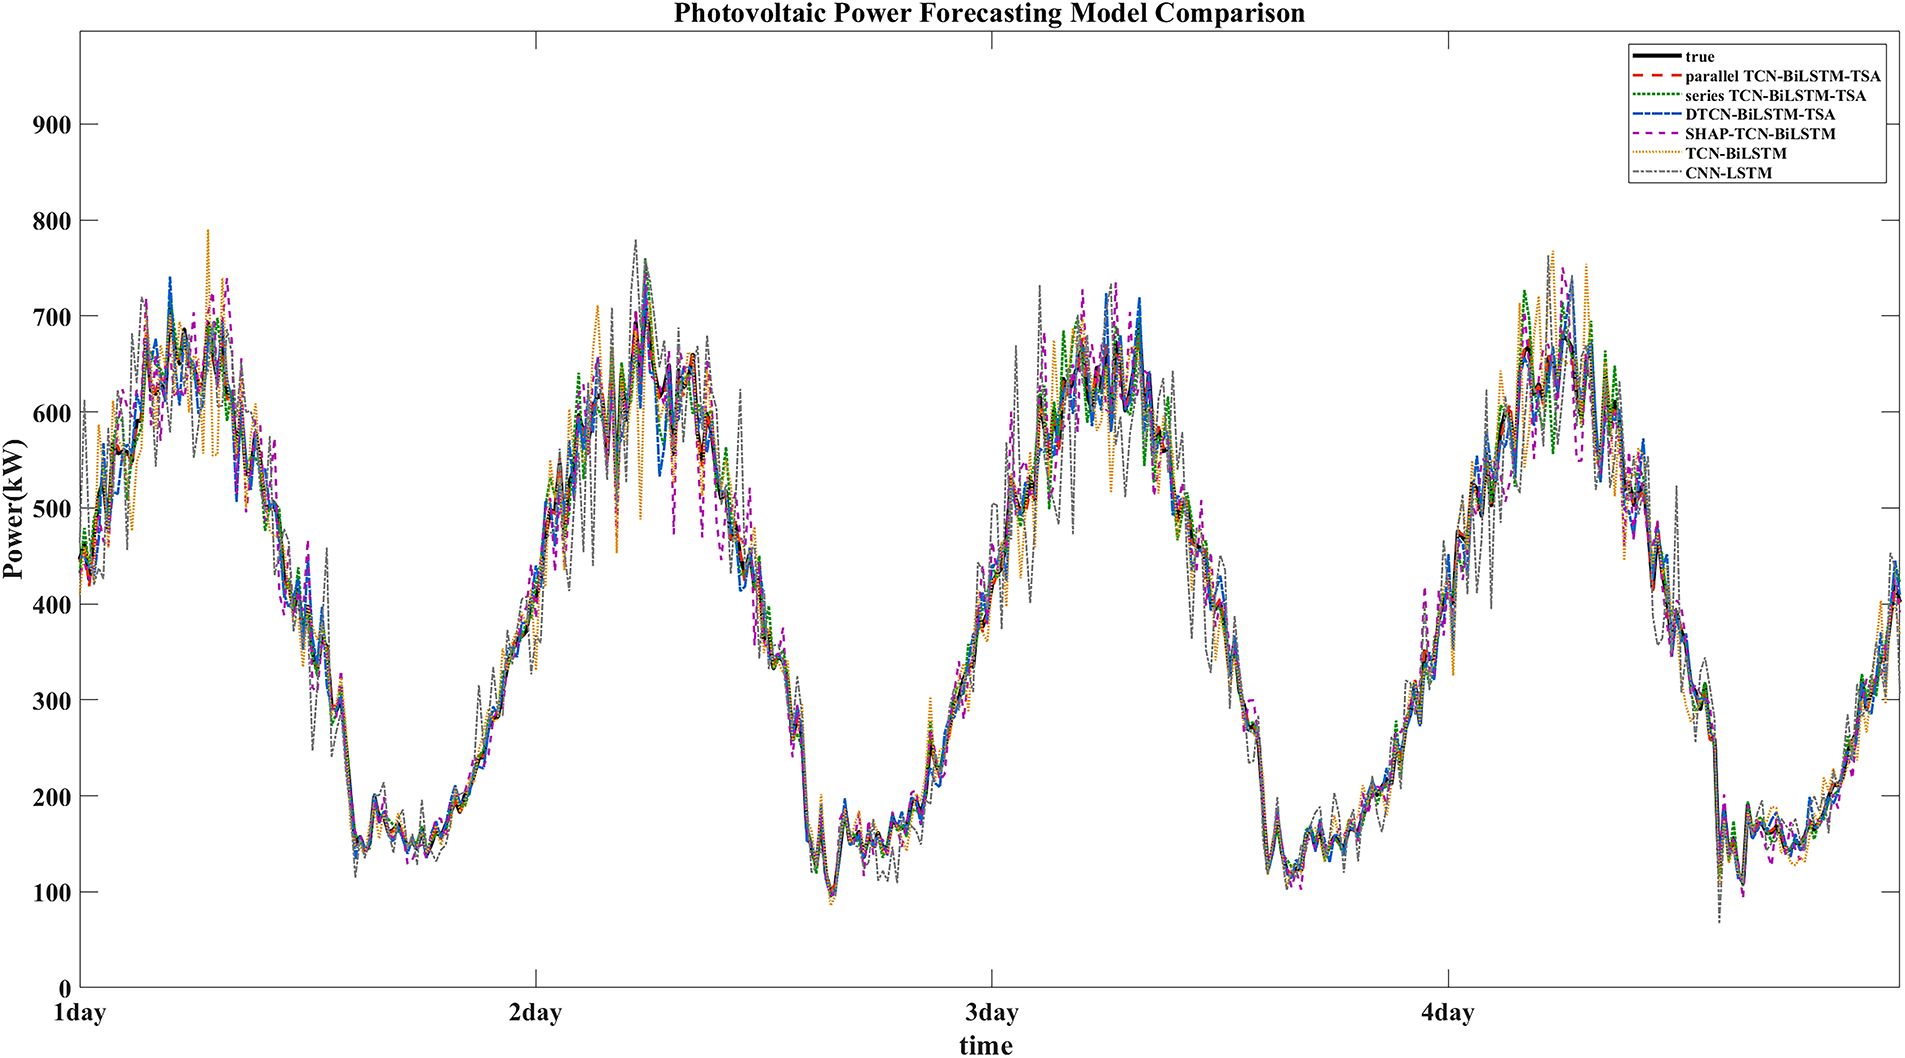
Figure 8: Photovoltaic power forecasting model comparison
The Fig. 8 demonstrates the predictive performance of different models, while Table 2 and Fig. 9 visually illustrate the accuracy of the proposed TCN-BiLSTM-TSA model across evaluation metrics including MAE, RMSE, MAPE, and CRPS.
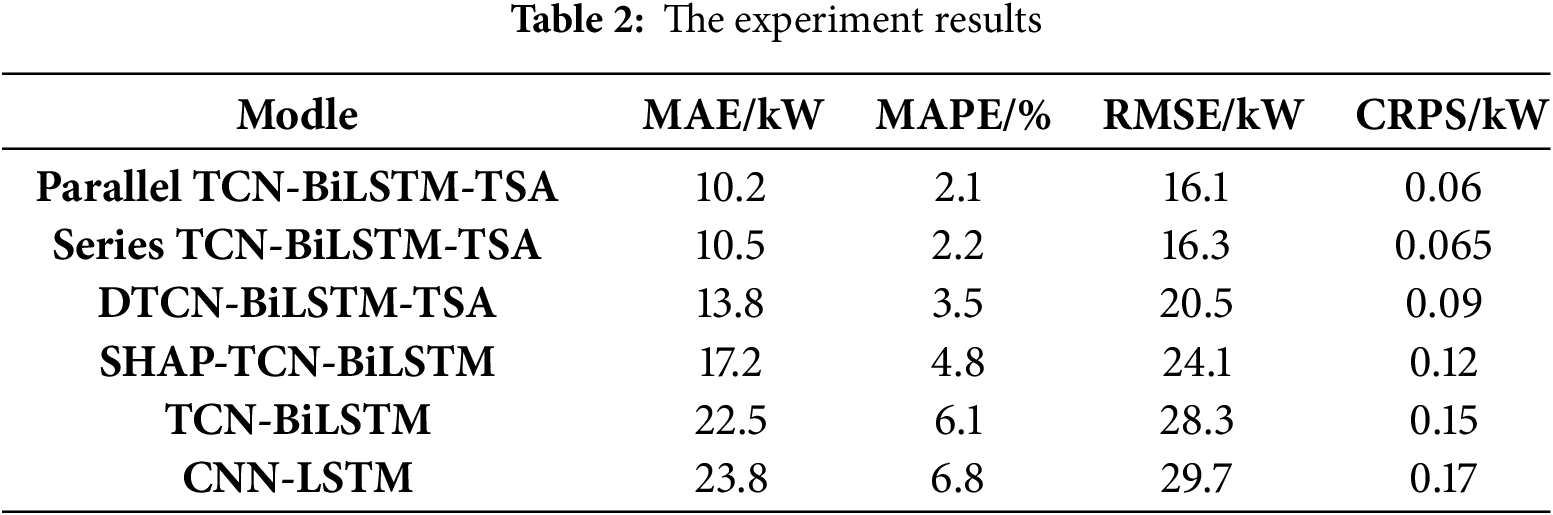
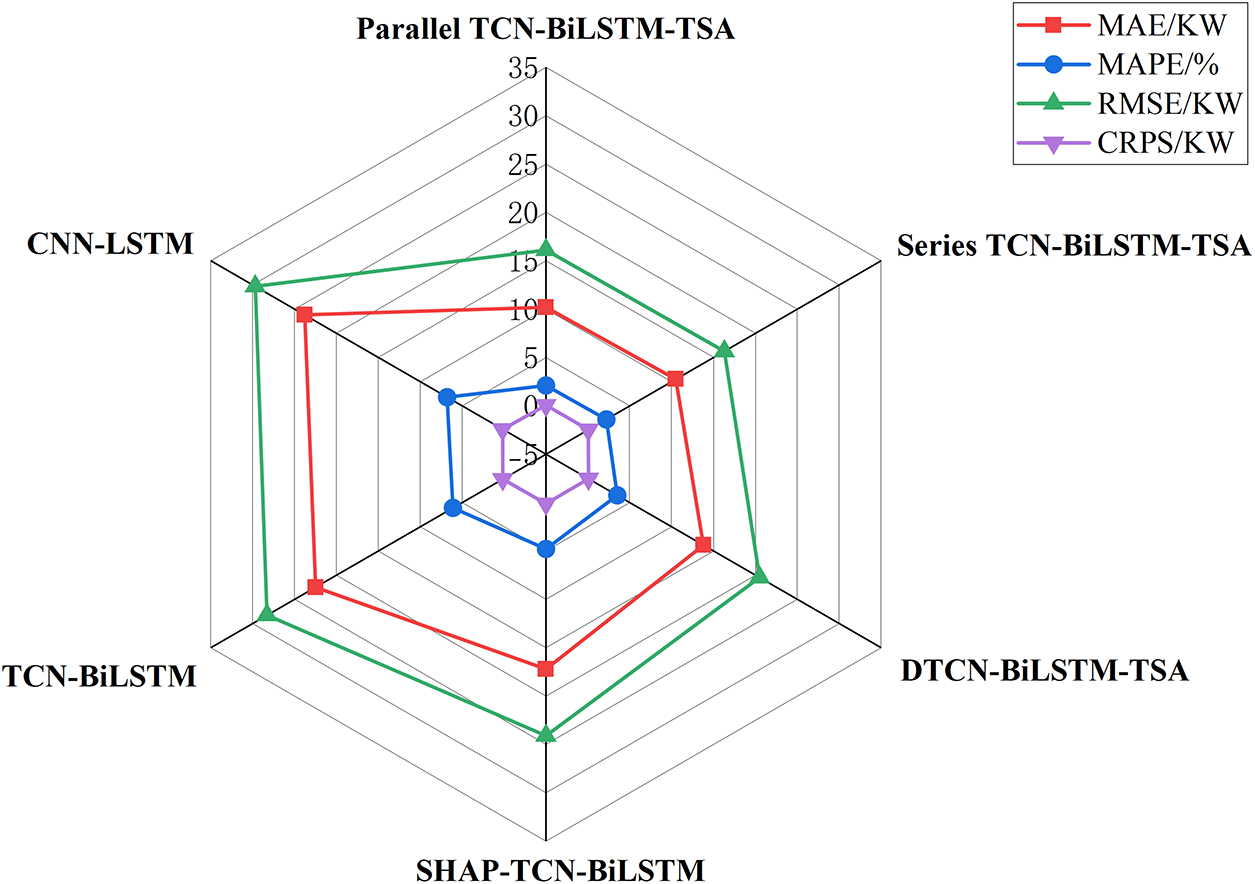
Figure 9: Radar chart comparison of photovoltaic prediction models
Fig. 10 compares the training times of four models: parallel TCN-BiLSTM-TSA, series TCN-BiLSTM-TSA, DTCN-BiLSTM-TSA, and SHAP-TCN-BiLSTM, using error metric as the evaluation criterion. The analysis demonstrates that while the parallel and series TCN-BiLSTM-TSA models achieve comparable prediction accuracy, and the DTCN-BiLSTM-TSA and SHAP-TCN-BiLSTM models show slightly inferior performance, Fig. 10 reveals that when the training times of series TCN-BiLSTM-TSA, DTCN-BiLSTM-TSA, and SHAP-TCN-BiLSTM models exceed 1600 s, their error metric reaches approximately 0.06. In contrast, the parallel TCN-BiLSTM-TSA model achieves the same 0.06 error metric with merely 200 s of training time. This clearly indicates that under comparable prediction errors, the parallel TCN-BiLSTM-TSA model requires significantly less training time.
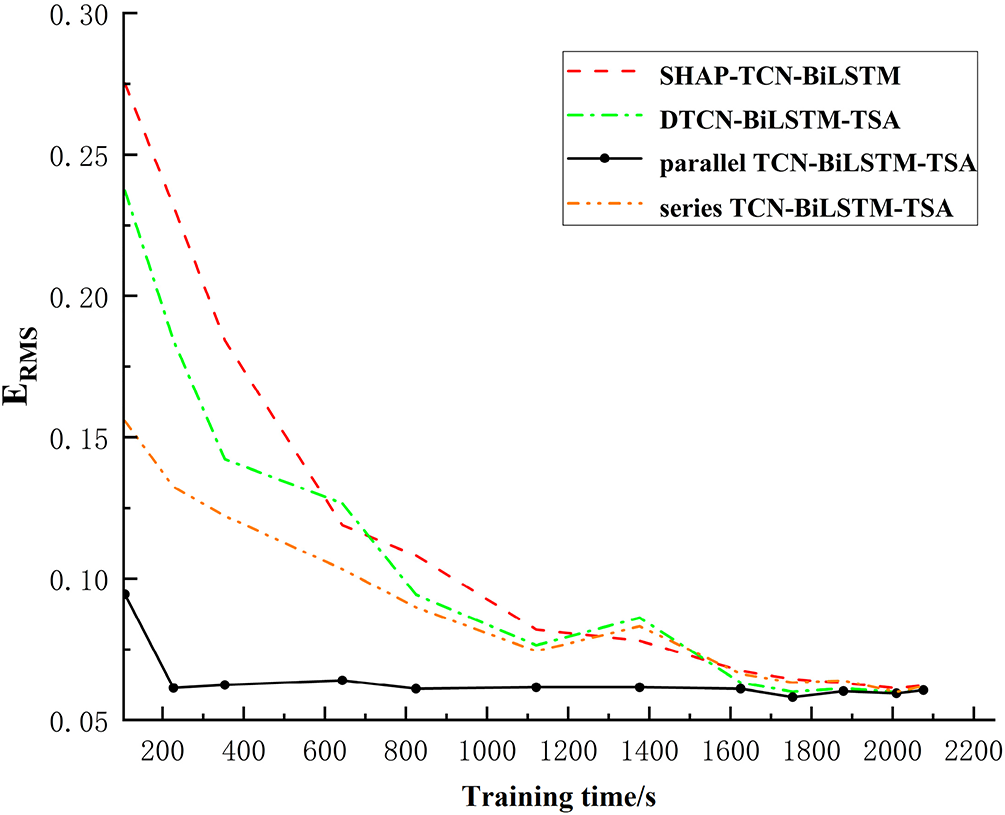
Figure 10: Comparison of training time efficiency between similar models
4.2 Response Characteristics of Prediction Models under Different Weather Conditions
To more comprehensively evaluate the prediction performance of the TCN-BiLSTM-TSA model and verify its superiority, simulations were conducted under consistent conditions using the TCN-BiLSTM-TSA, SHAP-TCN-BiLSTM, and DTCN-BiLSTM-TSA models to predict PV power output under “rainy” and “overcast” weather conditions. The prediction results and evaluation metrics for each model are shown in Fig. 11 and Table 3.
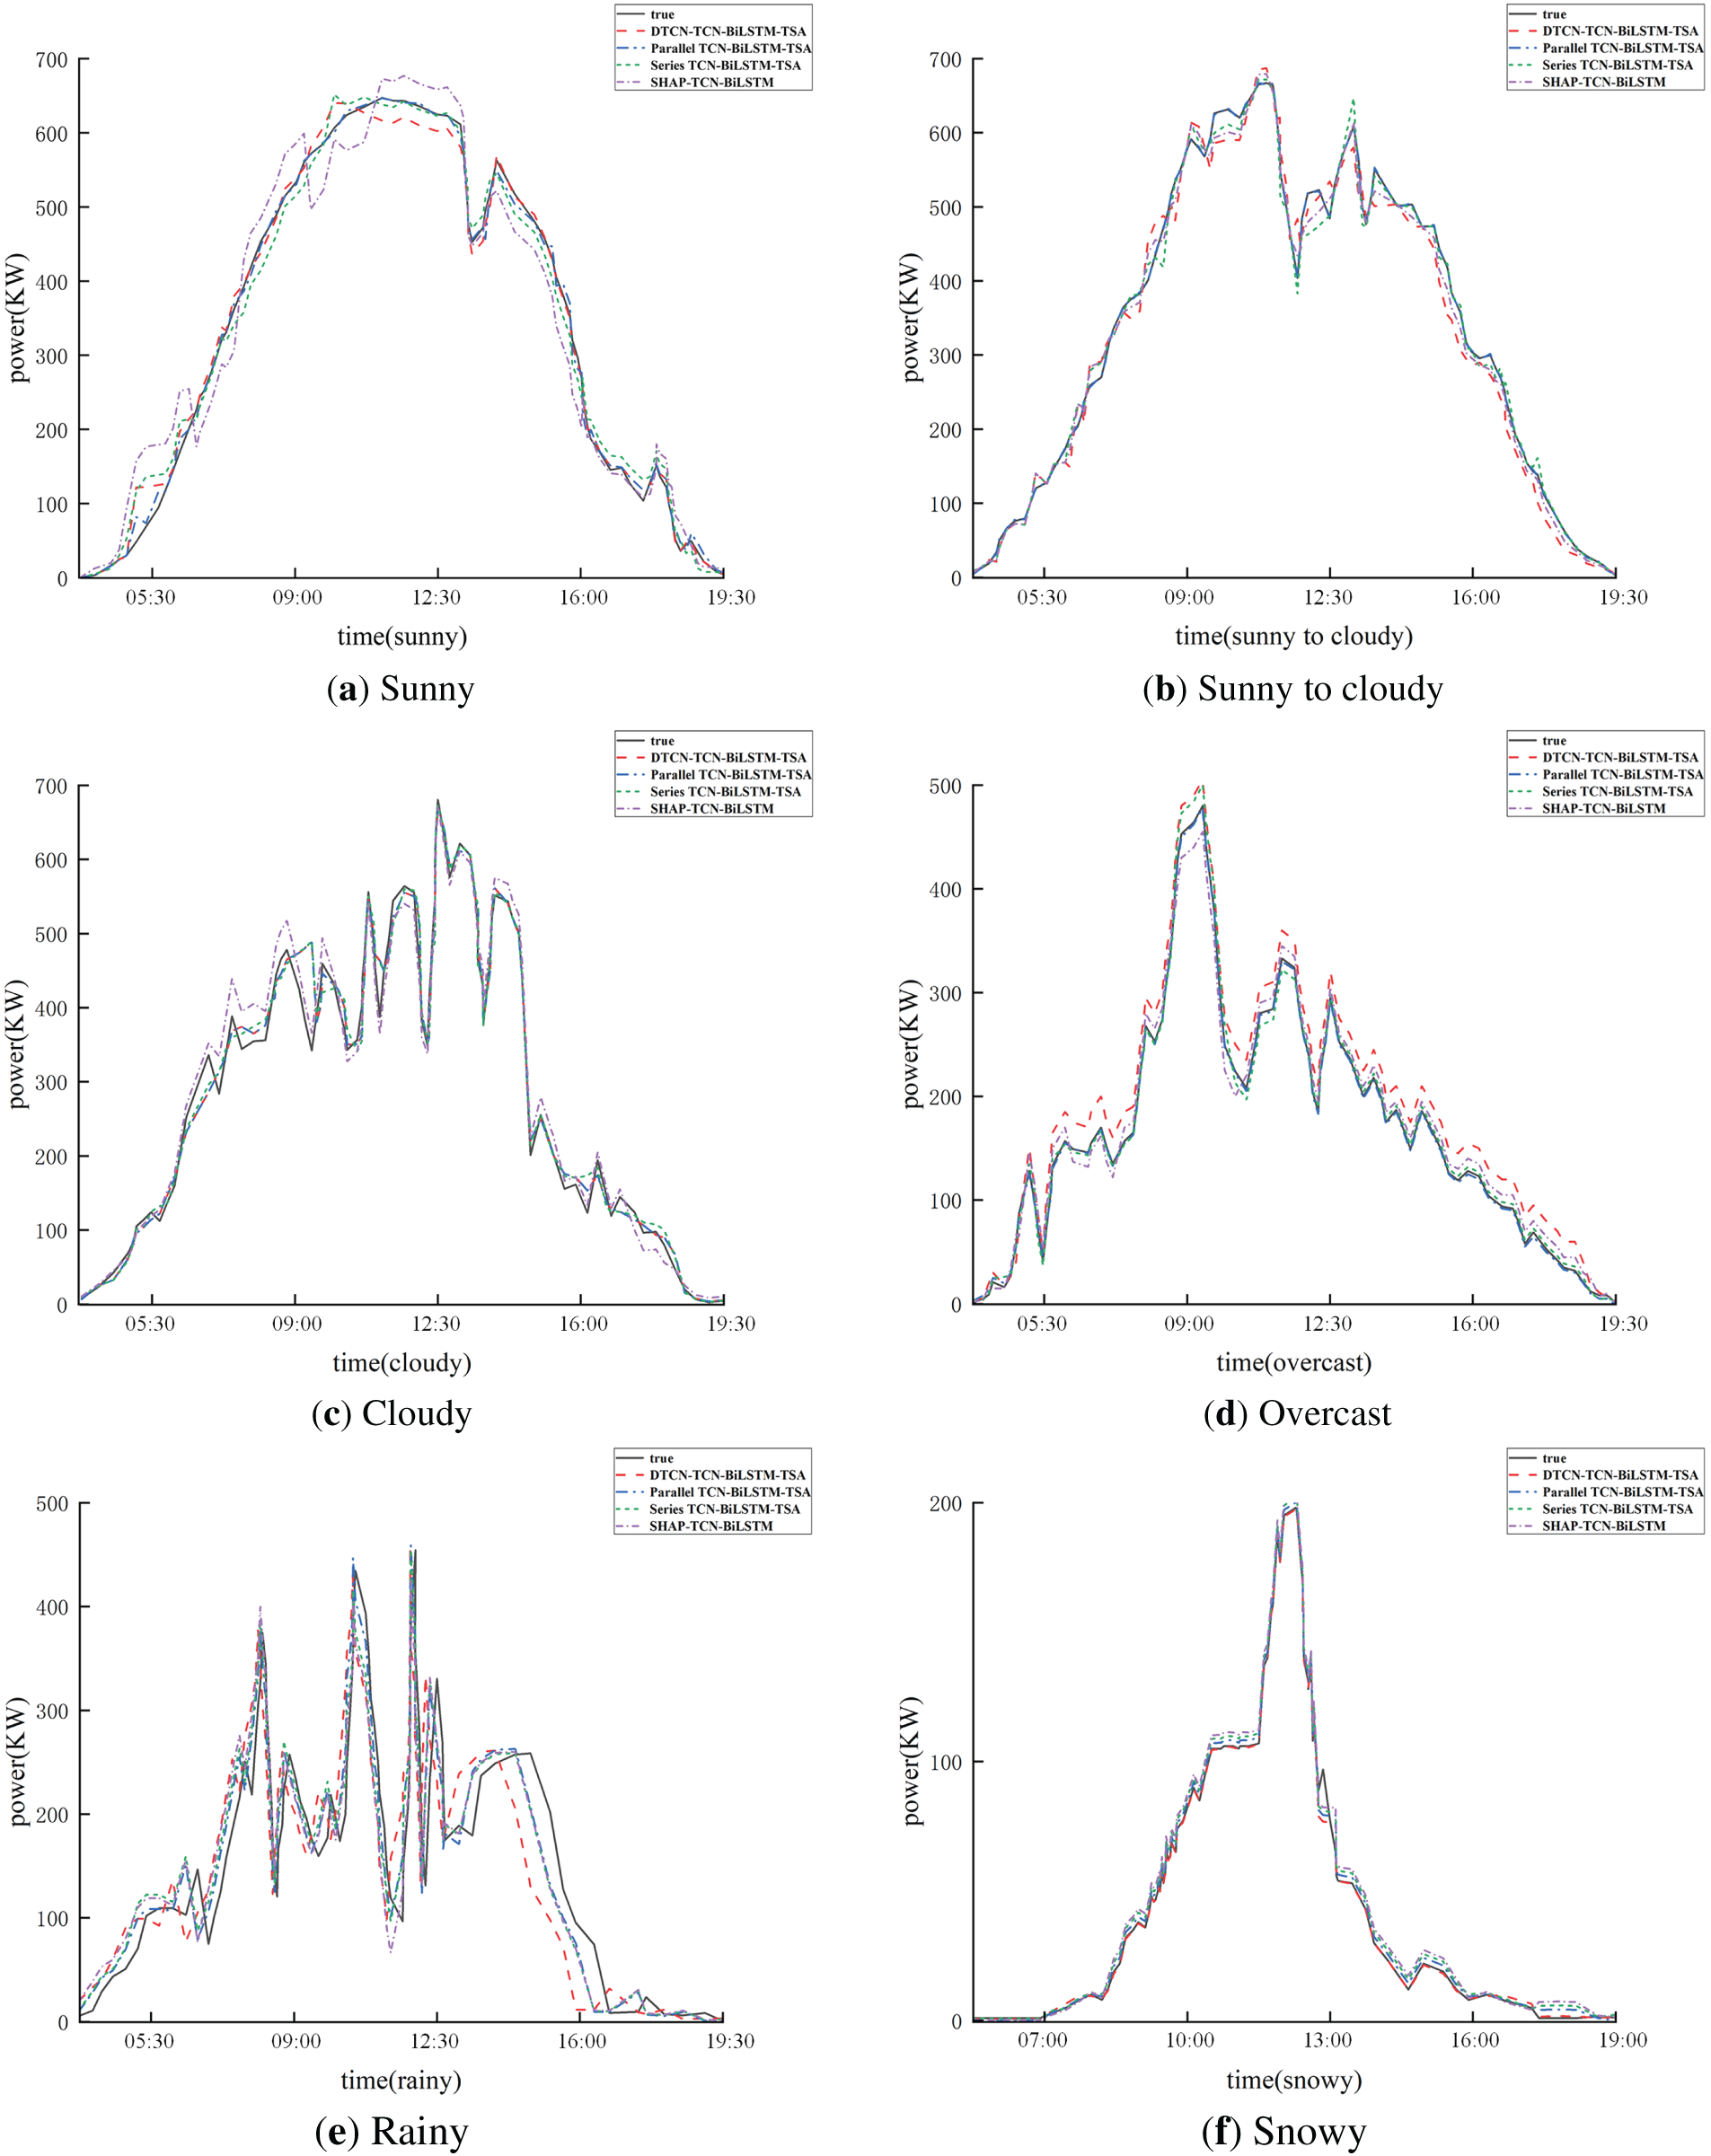
Figure 11: Comparative analysis of prediction models under different weather conditions
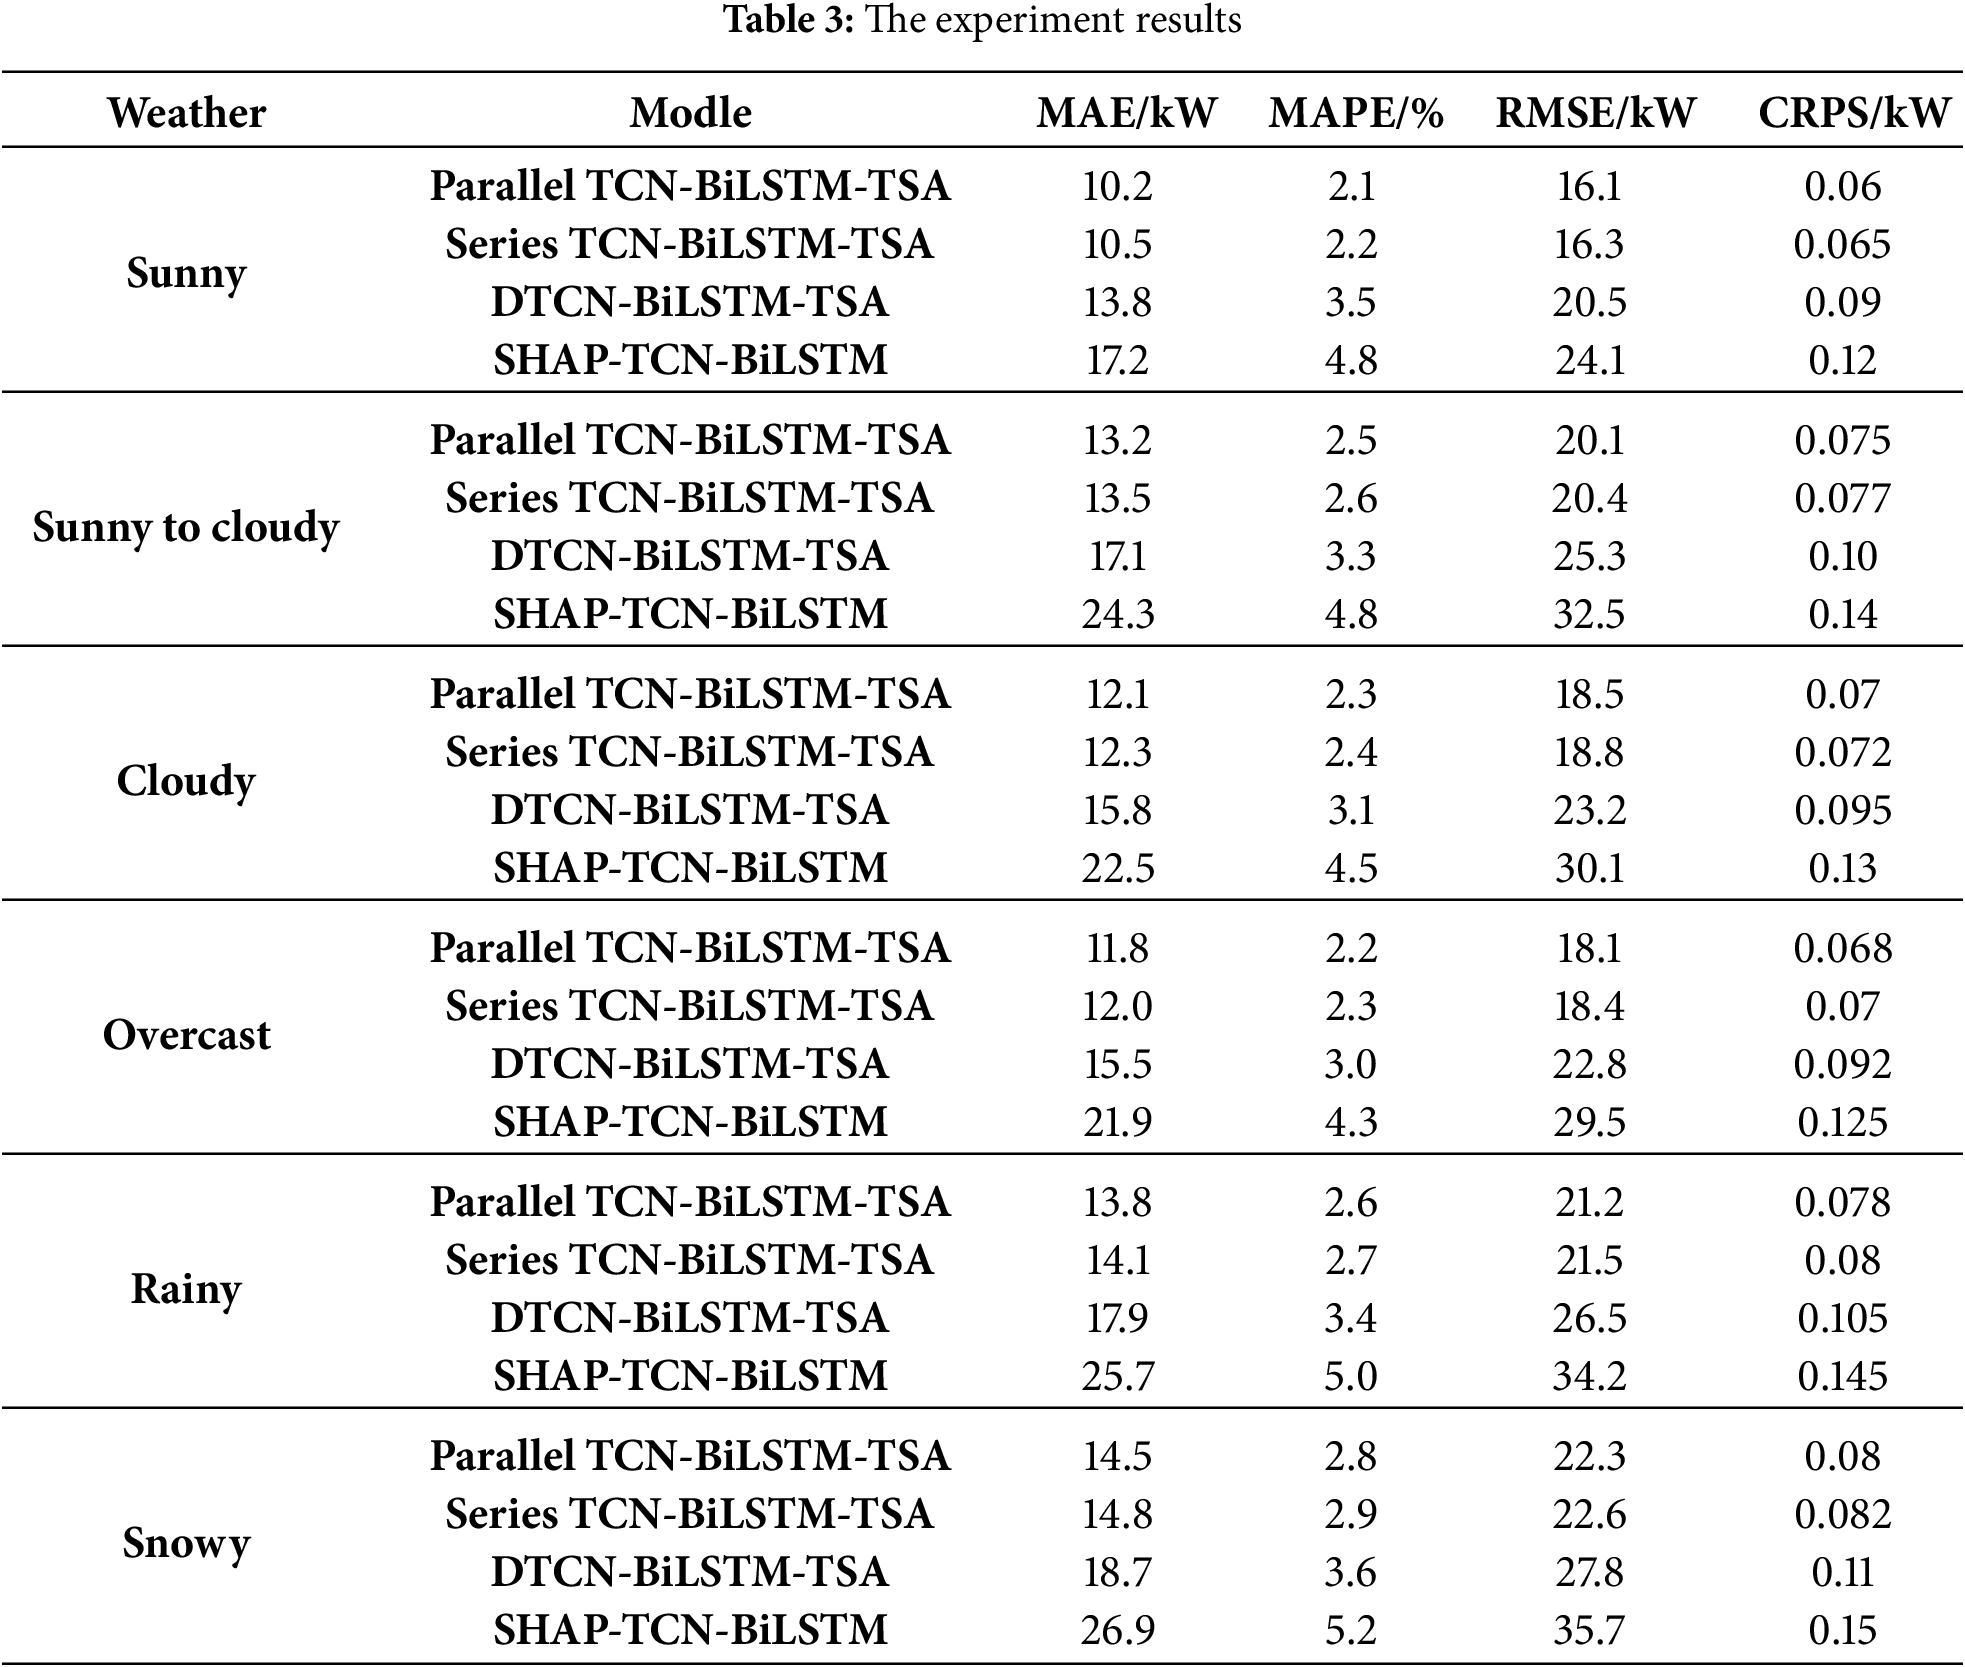
From Fig. 11 and Table 3, it can be observed that under “rainy” and “overcast” conditions, the TCN-BiLSTM-TSA model exhibits smaller prediction errors compared to other models, enabling effective PV power prediction under these weather scenarios.
In summary, across five distinct weather conditions—clear skies with high temperatures, cloudy, overcast, rainy, and snowy/low-temperature conditions—the TCN-BiLSTM-TSA model successfully captures the variation trends of PV power sequences. It achieves accurate power predictions under diverse meteorological scenarios, demonstrating robust forecasting performance and strong generalization capabilities.
4.3 Experimental Results Analysis
Test results demonstrate that the proposed parallel dual-stream architecture with spatiotemporal attention mechanism reduces training time by 5.4% compared to serial architecture. This spatiotemporal attention mechanism improves RMSE by 17.6% for predictions under overcast, rainy and snowy conditions, verifying the effectiveness of parallel architecture in feature decoupling. Furthermore, the proposed prediction model exhibits superior performance during both extreme weather and stable PV generation periods, while significantly enhancing computational efficiency and substantially reducing training time. Performance comparison shows Parallel TCN-BiLSTM-TSA and Series TCN-BiLSTM-TSA curves nearly overlapping actual values with minimal errors, MAE ≤ 15 kW, MAPE ≤ 3%. DTCN-TCN-BiLSTM-TSA exhibits moderate dispersion but captures fluctuations with intermediate errors, MAE ≤ 19 kW, MAPE ≤ 3.6%. SHAP-TCN-BiLSTM significantly deviates from actual values with maximum errors, MAE ≥ 21 kW, MAPE ≥ 4.3%. Weather impacts reveal slightly higher errors in high-variability scenarios like snowfall and sunny-to-cloudy transitions, though Parallel TCN-BiLSTM-TSA maintains superior accuracy, while its advantage becomes more pronounced in stable conditions like overcast and cloudy weather with lower errors. The model achieves 5.00% MAPE on Northeast China field data, outperforming comparison models by 1.27%, proving parallel TCN-BiLSTM-TSA delivers optimal prediction performance for specific winter/summer dates with significantly improved accuracy over single models. Under constraints of Pearson feature selection, autocorrelation analysis and SHAP interpretability feedback fusion, peak power prediction errors remain below 8% even during extreme winter weather, validating multi-module collaboration robustness. SHAP analysis reveals irradiance contribution reaches 62.3%, providing quantitative basis for PV array cleaning maintenance.
To address the issue of inaccurate predictions during periods of high fluctuation in ultra-short-term photovoltaic power forecasting, this paper conducts Pearson analysis and autocorrelation analysis on PV sequences. It determines the high-correlation factors for model inputs and the optimal historical time series window. Based on this, a parallel TCN-BiLSTM neural network prediction model is established by integrating spatiotemporal attention mechanisms. Through comparison with traditional deep learning prediction models, it is found that the proposed prediction model effectively improves the application effect of ultra-short-term photovoltaic power forecasting, enhancing both the accuracy of forecasting photovoltaic power and computational efficiency. This verifies the effectiveness of the parallel design in feature decoupling and confirms the robustness of the multi-module collaboration. Additionally, it provides quantitative evidence for the maintenance of photovoltaic arrays.
However, the data set selected in this study still has certain limitations. The climate conditions in Northeast China are special and the time span is short, which cannot fully demonstrate the stability of power forecasting across seasonal changes. Although multiple data processing steps can filter out strong correlation factors affecting power prediction, and the parallel dual-stream structure of the TCN-BiLSTM with spatiotemporal attention mechanisms significantly reduces training time, the multiple data processing steps of the model may still increase the training cost. This study only conducts prediction for a single site, while in actual production, multiple sites often work collaboratively, requiring simultaneous consideration of the spatiotemporal correlation among multiple sites. How to extend this model to multi-site collaborative prediction is a direction for future research.
Acknowledgement: Not applicable.
Funding Statement: This work is funded by the National Natural Science Foundation of China (NSFC) (No. 62066024). This research is funded by Basic Scientific Research Projects of Higher Education Institutions in Liaoning Province (LJ212411632063) and the National Undergraduate Training Program for Innovation and Entrepreneurship (S202511632045).
Author Contributions: Conceptualization, Supervision, Xingyu Jiang; Data curation, Writing—original draft, Hongbo Sun; Design, Data interpretation, Wenyao Sun; Writing—review and editing, Validation, Yi Zhao; Validation, Visualization, Investigation, Xiaoyi Qian; Methodology and algorithm guidance, Jifeng Cheng and Guo Wang. All authors reviewed the results and approved the final version of the manuscript.
Availability of Data and Materials: Data available on request from the authors. The data that support the findings of this study are available from the Corresponding Author, [Xingyu Jiang], upon reasonable request.
Ethics Approval: Not applicable.
Conflicts of Interest: The authors declare no conflicts of interest to report regarding the present study.
References
1. Das UK, Tey KS, Seyedmahmoudian M, Mekhilef S, Idris MYI, Van Deventer W, et al. Forecasting of photovoltaic power generation and model optimization: a review. Renew Sustain Energy Rev. 2018;81(1):912–28. doi:10.1016/j.rser.2017.08.017. [Google Scholar] [CrossRef]
2. Tian J, Ooka R, Lee D. Multi-scale solar radiation and photovoltaic power forecasting with machine learning algorithms in urban environment: a state-of-the-art review. J Clean Prod. 2023;426:139040. doi:10.1016/j.jclepro.2023.139040. [Google Scholar] [CrossRef]
3. Li L-L, Wen S-Y, Tseng M-L, Wang C-S. Renewable energy prediction: a novel short-term prediction model of photovoltaic output power. J Clean Prod. 2019;228(2):359–75. doi:10.1016/j.jclepro.2019.04.331. [Google Scholar] [CrossRef]
4. Tang Y, Zhang L, Huang D, Yang S, Kuang Y. Ultra-short-term photovoltaic power generation prediction based on hunter-prey optimized K-nearest neighbors and simple recurrent unit. Appl Sci. 2024;14(5):2159. doi:10.3390/app14052159. [Google Scholar] [CrossRef]
5. Huang C, Yang M. Memory long and short term time series network for ultra-short-term photovoltaic power forecasting. Energy. 2023;279(2):127961. doi:10.1016/j.energy.2023.127961. [Google Scholar] [CrossRef]
6. Di Leo P, Ciocia A, Malgaroli G, Spertino F. Advancements and challenges in photovoltaic power forecasting: a comprehensive review. Energies. 2025;18(8):2108. doi:10.20944/preprints202502.2234.v1. [Google Scholar] [CrossRef]
7. Zhang Y, Ren X, Zhang F, Liu Y, Li J. A deep learning-based dual-scale hybrid model for ultra-short-term photovoltaic power forecasting. Sustainability. 2024;16(17):7340. doi:10.3390/su16177340. [Google Scholar] [CrossRef]
8. Qiu H, Hu R, Chen J, Yuan Z. Short-term electricity load forecasting based on complete ensemble empirical mode decomposition with adaptive noise and improved sparrow search algorithm-convolutional neural network-bidirectional long short-term memory model. Mathematics. 2025;13(5):813. doi:10.3390/math13050813. [Google Scholar] [CrossRef]
9. Chen Y, Li Y, Wu B, Liu F, Deng Y, Jiang X, et al. Lightweight hotspot detection model fusing SE and ECA mechanisms. Micromachines. 2024;15(10):1217. doi:10.3390/mi15101217. [Google Scholar] [PubMed] [CrossRef]
10. Ganesh N, Arindham S, Ramanan AV. Comparative analysis of the Black-Winged Kite Algorithm (BWKA) with ant lion optimizer and grey wolf optimizer using benchmark functions for global optimization. In: 2025 AI-Driven Smart Healthcare for Society 50. New York, NY, USA: IEEE; 2025. doi:10.1109/ieeeconf64992.2025.10962946. [Google Scholar] [CrossRef]
11. Liu W, Mao Z. Short-term photovoltaic power forecasting with feature extraction and attention mechanisms. Renew Energy. 2024;226(22):120437. doi:10.1016/j.renene.2024.120437. [Google Scholar] [CrossRef]
12. Dai G, Luo S, Chen H, Ji Y. Efficient method for photovoltaic power generation forecasting based on state space modeling and BiTCN. Sensors. 2024;24(20):6590. doi:10.3390/s24206590. [Google Scholar] [PubMed] [CrossRef]
13. Ma R, Zhu D, Shuai C. Photovoltaic power prediction based on feature fusion and DTCN-BiLSTM-TSA. Comput Technol Dev. 2025;1–10. (In Chinese). doi:10.20165/j.cnki.ISSN1673-629X.2025.0181. [Google Scholar] [CrossRef]
14. Zhao W, Yang Q, Chen Y. Ultra-short-term source-load joint forecasting method based on group cross-gating mechanism and graph convolutional neural network. High Volt Eng. 2025;1–14. (In Chinese). doi:10.13336/j.1003-6520.hve.20250444. [Google Scholar] [CrossRef]
15. Xiang X, Li X, Zhang Y, Jiang H. A short-term forecasting method for photovoltaic power generation based on the TCN-ECANet-GRU hybrid model. Sci Rep. 2024;14(1):6744. doi:10.1038/s41598-024-56751-6. [Google Scholar] [PubMed] [CrossRef]
16. Wang L, Liu Y, Li T, Xie X, Chang C. Short-term PV power prediction based on optimized VMD and LSTM. IEEE Access. 2020;8:165849–62. doi:10.1109/ACCESS.2020.3022246. [Google Scholar] [CrossRef]
17. Xiao F, Yang Q, Cui Q, Wang X. EMD-KPCA-BO-BILSTM: a novel hybrid approach for photovoltaic power prediction. In: Proceedings of the 2024 7th International Conference on Computer Information Science and Application Technology; 2024 Jul 12–14; Hangzhou, China. p. 1367–70. doi:10.1109/CISAT62382.2024.10695238. [Google Scholar] [CrossRef]
18. Guo F, Yang C, Xia D, Xu J. Short-term prediction of photovoltaic power based on improved CNN-LSTM and cascading learning. Energy Eng. 2025;122(5):1975–99. doi:10.32604/ee.2025.062035. [Google Scholar] [CrossRef]
19. Liu S, Xu T, Du X. A hybrid deep learning model based on parallel architecture TCN-LSTM with Savitzky-Golay filter for wind power prediction. Energy Convers Manag. 2024;302(3):118–22. doi:10.1016/j.enconman.2024.118122. [Google Scholar] [CrossRef]
20. Zhou Z, Dai Y, Leng M. A photovoltaic power forecasting framework based on attention mechanism and parallel prediction architecture. Appl Energy. 2025;391(1):125869. doi:10.1016/j.apenergy.2025.125869. [Google Scholar] [CrossRef]
21. Fu J, Sun Y, Li Y. An investigation of photovoltaic power forecasting in buildings considering shadow effects: modeling approach and SHAP analysis. Renew Energy. 2025;245(3):122821. doi:10.1016/j.renene.2025.122821. [Google Scholar] [CrossRef]
22. Cao R, Tian H, Li D, Feng M, Fan H. Short-term photovoltaic power generation prediction model based on improved data decomposition and time convolution network. Energies. 2024;17(1):33. doi:10.3390/en17010033. [Google Scholar] [CrossRef]
23. Zang H, Liu L, Sun L, Cheng L, Wei Z, Sun G. Short-term global horizontal irradiance forecasting based on a hybrid CNN-LSTM model with spatiotemporal correlations. Renew Energy. 2020;160(2):26–41. doi:10.1016/j.renene.2020.05.150. [Google Scholar] [CrossRef]
24. Yu B, Wang Y, Wang J. A hybrid model for short-term offshore wind power prediction combining Kepler optimization algorithm with variational mode decomposition and stochastic configuration networks. Int J Electr Power Energy Syst. 2025;168:110703. doi:10.1016/j.ijepes.2025.110703. [Google Scholar] [CrossRef]
25. Bakht MP, Mohd MNH, Ibrahim BSKSMK, Khan N, Sheikh UU, Rahman AA-HA. Advanced automated machine learning framework for photovoltaic power output prediction using environmental parameters and SHAP interpretability. Results Eng. 2025;25(19):103838. doi:10.1016/j.rineng.2024.103838. [Google Scholar] [CrossRef]
Cite This Article
 Copyright © 2026 The Author(s). Published by Tech Science Press.
This work is licensed under a Creative Commons Attribution 4.0 International License , which permits unrestricted use, distribution, and reproduction in any medium, provided the original work is properly cited.
 Downloads
 Citation Tools